Self-Organized Model Fitting Method for Railway Structures Monitoring Using LiDAR Point Cloud


Advanced Technologies Research Laboratory, Asia Air Survey Co. Ltd, 1-2-2 Manpukuji, Asao-ku, Kawasaki-shi 215-0004, Kanagawa Prefecture, Japan
*
Author to whom correspondence should be addressed.
Remote Sens. 2020, 12(22), 3702; https://doi.org/10.3390/rs12223702
Submission received: 12 October 2020
/
Revised: 6 November 2020
/
Accepted: 9 November 2020
/
Published: 11 November 2020
Abstract
:Mobile laser scanning (MLS) has been successfully used for infrastructure monitoring apt to its fine accuracy and higher point density, which is favorable for object reconstruction. The massive data size, computational time, wider spatial distribution and feature extraction become a challenging task for 3D point data processing with MLS point cloud receives from terrestrial structures such as buildings, roads and railway tracks. In this paper, we propose a new approach to detect the structures in-line with railway track geometry such as railway crossings, turnouts and quantitatively estimate their dimensions and spatial location by iteratively applying a vertical slice to point cloud data for long distance laser measurement. The rectangular vertical slices were defined and their boundary coordinates were estimated based on a geometrical method. Estimated vertical slice boundaries were iteratively used to evaluate the point density of each vertical slice along with a cross-track direction of the railway line. Those point densities were further analyzed to detect the railway line track objects by their shape and spatial location along with the rail bed. Herein, the survey dataset is used as a dictionary to preidentify the spatial location of the object and then as an accurate estimation for the rail-track, by estimating the gauge corner (GC) from dense point cloud. The proposed method has shown a significant improvement in the rail-track extraction process, which becomes a challenge for existing remote sensing technologies. This adaptive object detection method can be used to identify the railway track structures prior to the railway track extraction, which allows in finding the GC position precisely. Further, it is based on the parallelism of the railway track, which is distinct from conventional railway track extraction methods. Therefore it does not require any inertial measurements along with the MLS survey and can be applied with less background information of the observed MLS point cloud. The proposed algorithm was tested for the MLS data set acquired during the pilot project collaborated with West Japan Railway Company. The results indicate 100% accuracy for railway structure detection and enhance the GC extraction for railway structure monitoring.

1. Introduction
The mobile laser scanning (MLS) point cloud becomes a more accurate and sophisticated technique to acquire terrestrial information from the surrounding environment. Currently, it has become a more popular method to monitor the quality and the safety of the social infrastructure systems such as railway roads [1], highways and public roads [2,3], bridges and other peripherals [4,5,6,7,8]. During the past few years, maintenance of public transportation, especially, railway track monitoring by MLS has been widely used in many institutions due to its advantage of providing precise estimation in railway structures up to the millimeter level accuracy [9,10]. Figure 1 depicts the 3D models generated by MLS survey to monitor the railway infrastructure and surrounding environment, which is very important and coequal to the physical inspections for railway maintenance. The structures in (a), (b) and (c) depict the ridged metal structures, non-ridged metal structures such as electric wires and non-metal equipment, which are located above the human eye contacting range. Some of those locations can be accessible for inspection, but some of them need specially equipped machinery such as cranes to take the measurements. Figure 1d depicts a railway track passing through the concrete tunnel, which seems monotonous for low resolution. However, higher point density of the 3D point cloud inside the tunnel surface permitted to capture structural defects of, not only the railway infrastructure, but also the surrounding environment. Visualizing such information in the GIS platform [11,12] increases the efficiency of infrastructure management and decision making. Minimum workforce, long observation within a short period, day and night time monitoring process and the possibility of keeping a track history for further analysis become favorable factors of MLS based survey for railway maintenance companies and their regular maintenance work. Therefore railway structure monitoring by MLS becomes the most reliable and cost effective method accepted by many countries for both private and government operated railway systems [13,14,15].
However, due to experimental defects during the MLS survey such as poor sampling, misalignment of the data acquisition system, perturbations in GPS and limitations in the data processing algorithm, the accurate estimation of 3D terrestrial structures, their dimensions and special locations become more challenging [16,17]. The inside corners of the rail head is defined as the railway gauge corner (hereinafter, this is abbreviated to “GC”), which becomes an important position for point data alignment [1]. The precise estimation of railway infrastructure such as the rail track depends on the accurate estimation of the railway GC. The point cloud captured from the ideal railway track bed in flat terrain is depicted in Figure 1e. In this scenario, both left and right rail track positions are in the same elevation. Therefore the distribution of point cloud near GC in both the left and right of the railway track has similarities in horizontal and zero altitude change in the vertical plane. However, Figure 1f depicts the railway track running on a slope surface. In this scenario, the distribution of point cloud near GC in left or right or both railway tracks are varying in horizontal and vertical planes. Moreover, railway crossings, turnouts and combined locations depicted in Figure 1g–i make the GC extraction process more complicated than the ideal location in (e). This can be identified as one of the major limitations for accurate estimation of GC. This affects specially for long distance MLS survey in the urban environment, which contains a considerable number of crossings and turnouts due to other transportation infrastructures.
Several methods have been proposed to overcome these issues and Arastounua M. [18] presented a diverse approach to detect the railway infrastructure in track bed and above. However, in the case of point extraction within the same height of the neighborhood, GC extraction criteria need to be improved for more accurate and efficient processing. Zhou Y. et al. [19] discusses the course and fine extraction of the railhead. In the course extraction step, the center point coordinate of the railway track was calculated to estimate the rough aliment direction of the two railway tracks in the preliminary stage. In the next step, the fine extraction was done by considering the elevation value of the railhead point extracted from the previous step. However, in the practical field experiments, rough estimation becomes a challenging task if the GPS and LiDAR sensors set independently. Elberink S. O. et al. [20] discusses a generalized approach to determine the railway track and surrounding with a model-based method. It discusses the applicability of the rail track and inside structure detection based on thresholding the points, which are located in a specific distance from the centre line. However, this method has considerable discrepancies while applying to the real experimental datasets of the railway track. In the real LiDAR dataset of the railway track bed, the points incident not only by track objects such as railway turnouts or crossings, but also due to signaling components, bridge structures or vegetation. In those cases, the above methods fail to give accurate results to identify each of the above objects from the railway track. Niina Y. et al. [21] presents a method to accurately extract the railway track by considering the point cloud around the known distance from the GPS trajectory line by applying the iterative closest point (ICP) algorithm for railway track extraction. This can be used with higher efficiency and accuracy while processing large datasets. However, this method needs to be improved especially in the point cloud extraction near composite environments such as railway crossings and turnouts, which needs to have further attention for more precise analysis. The main aim of this study is to enhance the GC extraction for precise estimation of railway tracks. The precisely estimated results of GC become the key component to evaluate the other secondary analysis such as train clearance check, temporal change of the distance between closely located railway tracks and temporal change of the levels between two rails. Thus, the above mentioned inspections have a higher influence on today’s railway industry, and leads to fulfilling the marketing requirements. In this paper, we proposed new criteria to detect the rail crossings and turnouts based on parallelism of the railway track and the spatial distribution of the neighboring MLS point cloud.
2. Materials and Method
2.1. Overview
The rail structures in a railway line can be identified by point cloud recorded during the MLS survey, after generating a 3D model as depicted in Figure 1. Then the feature extraction algorithm can be applied to extract particular structures such as GC. In order to monitor the GC, we differentiated the railway track into 3 categories according to the formation of the railway GC position compared to its neighborhood. Figure 2 depicts the physical formation of 3 different scenarios in GC positions incorporated with the rail track, by 3 different colors. Blue color represents the ideal case of the train movement, while orange and green colors represent near the turn-out and near the crossing respectively. The ideal railway track that runs through the flat surface is depicted in Figure 2a where the track separation distance was fixed to a particular type of compartment. In this campaign, we designed the MLS experimental setup for the local railway line with the constant track separation distance. However, it can be adjusted according to the MLS survey setup. Figure 2b,c depicts the second scenario, before and after the right-handed turnout. Here, the conventional GC detection algorithms are compromised [18,19,20] due to multiple occurrence of GC in variable distances in the horizontal plane. It adversely affects the rail track extraction results by making a sudden fluctuation due to the wrong estimation of the GC position. On the other hand, the MLS survey has a large amount of point cloud data in long distance observation during the field experiment. Therefore, the rail extraction process needs to be very efficient and sophisticated not only for an ideal track, but also for a vivid environment [22,23]. Figure 2d depicts the third scenario, which explains the GC extraction near the rail crossing. There, the shape of the rail head is visible as half of its physical shape and remaining sides of the rail head were curved by smooth passing of road vehicles. Therefore, the shape of the rail head near the crossing is slightly different than the shape of the rail head in ideal track and turnout. The point cloud received from each of these scenarios has identical responses, which can be distinguished from the recorded dataset. On the other hand, GC position extraction using the 3D model by visual inspection can be considered as a more precise attempt for the inhomogeneous dataset of the rail track. However, separation of the ideal track from the irregular neighborhood with a large dataset is very time consuming and resource intensive. Therefore, a general method needs to be implemented for the enhancement of the GC extraction process.
2.2. MLS Sensor and Survey Setup
The MLS system has been optimized as a combination of several sensors [24,25]. The key components of a MLS include 3D laser scanners, GNSS, inertial measurement unit (IMU) and optical cameras. Figure 3 depicts the MLS system used in this experiment. This system was fully equipped with the above specified sensor units, which facilitate to acquire point cloud by a density of 1600 per square meter at a 10 m distance from the LiDAR source while having a moving at a speed of 10 m per second. It increased the data acquisition rate up to 1.016 million pixels per second. This becomes a huge advantage especially for 3D model generation and feature extraction. The systems can be mounted on vehicles, trolleys or boats, with the former two often being used in urban areas [26,27]. The system specifications and limitations are summarized in Table 1.
In this experiment, point cloud around the rail track was acquired by MLS on a trolley pulled by a motor car. Figure 4 depicts the experiment setup of the monitoring system. The Leica Pegasus MDA software was used for data acquisition [28]. It allows to store point cloud, images, IMU and GNSS data in the system. The continuously acquired point cloud along the rail track was registered with time and the GNSS coordinate. The preliminary data processing was done by the system client software Leica Pegasus Manager [29] and then the self-script algorithm was coded by C++ to analyze the point cloud data. For the rail track extraction, the point cloud extraction range was defined as depicted by the rectangular area covered by dashline with the height offset value from the GC position in the vertical plane. The experimental setup parameters are summarized in Table 2.
2.3. Vertical Slicing
The point cloud distribution in the plane parallel to the railway track has a sensibility to the rail bed structures such as the rail bottom, rail web and surface of the rail head, which lies on the vertical plane. In the proposed method, we used vertical slices defined from GNSS trajectory to extract the corresponding point densities. The GNSS trajectory lies parallel to the railway track as depicted in Figure 5a. We defined vertical slices by centering the GNSS track position. The total slice width 2r was divided into equal sectors. The same process was consecutively applied to every 1 m position along the railway track. In the proposed method, the estimation of the vertical slice edge coordinates become significant for fast and accurate data processing. Those edge coordinates, in another word, boundary coordinates were used to define the rectangular area as depicted in Figure 5b to extract point densities from the relevant spatial location. In this algorithm, we used the geometrical method to calculate the edges of each vertical slice. This process was divided into left and right side slices from the GNSS track position to separate the structure position in the horizontal plane. The circle with center xc, yc and zc in Figure 5a with radius r and AB was defined as a line perpendicular to the trajectory. This was calculated by considering the consecutive GNSS coordinates of xi, yi, zi and xi+1, yi+1 and zi+1, which is separated by a 1 m distance. The intersection position between the line and the circle in each r values of both left and the right sides were used to estimate the boundary coordinates of left vertical slices and the right vertical slices. The estimated boundary values were used to clip corresponding points, which are located inside the slice area and count the points of each vertical slice. The number of vertical slices within the 2r diameter becomes an important parameter for target identification and processing time estimation.
In this experiment, the structure identification was limited to precise identification of crossings and turnout. Therefore, 2r diameter was divided into equal slices by considering the dimension of the rail in Figure 6 rail and the distance in between railway tracks. Figure 7 depicts the expected formation of the rail position within the vertical slices discussed in the proposed method. In the local railway line, the dimension of the rail varies and can be standardized by the weight of its unit length of 1 m. In the Japan Railway (JR) West operator, 7 stranded rail shapes were used for train operation. This rail shapes and their dimensions were summarized in Figure 6. In this study, the width of the rail head a varied between 60 and 70 mm (<100 mm) and b, c and d varied between 100 and 150 mm, 100 and 175 mm and 10 and 20 mm respectively. The total track width had a fixed value of 1067 mm between the rails. Therefore, the vertical slice number was defined as 10 units. Figure 7a depicts the ideal railway track formatted within 10 strips. The first most slices in the left handed side and last most slices in the right handed side were densely populated. However, the point count of each slice varied due to survey condition. The monitoring speed of the MLS could not be maintained as a constant value due to speed limits of the railway track. Sudden slowdown while passing railway stations and slowdown near the track turnout or stop near railway crossings affected the stability of the moving speed. This will affect the observed point density, which changes along the same track in different situations. Therefore, the mean threshold value for peak detection was estimated for the ideal track, left/right turn out and crossing detection. The threshold value for turnout detection is defined as CT1 and the threshold value for crossing detection is defined as CT2. On the other hand, the point density peak of the individual vertical slice has dynamically moved from left to right as in Figure 7b,c in left-turn out or in the alternative direction in right handed turnout. Therefore, a method based on vertical slices and its spatial change in the horizontal plane needs to be implemented for accurate estimation of rail structures.
2.4. Structure Detection
The point density value and its position in the vertical slice array become essential factors while detecting the crossings and turnouts from the point cloud. Figure 7b–d depicts an example of the turnout and crossing formation in vertical slices. We used that information with the following pattern detection methods to identify the structures and to measure their lengths. In the proposed method for crossing detection in Equation (1), vertical slices were formatted in liner 2D coordinates; where i is the slice iteration along the track and j is the slice iteration in the cross-track direction. Si,j denotes the point density of vertical slice. Then the point density variation was examined in each consecutive iteration captured by a 1 m interval. Near to the railway crossing, both vertical slices in the ith and jth direction simultaneously get a higher value as shown in Figure 7d. Therefore, the crossing Pi can be detected by evaluating Qi,j the area, which exceeds the threshold CT1,
L is the maximum number of iterations in the cross-track direction. If j moves until 1 to L, then the crossings can be identified by exceeding the value of CT1 as depicted in Figure 8a.
On the other hand, near to the turnouts, the point densities in both ith and jth directions have peak values consecutively. In the proposed method for turnout detection, the point density in the middle of the railway track was checked first and the relevant threshold value (CT2) was testified in both left and right handed neighborhood of the vertical slice until the local maxima for turnout selection as depicted in Figure 8b. The number of iterations was counted for length estimation, until satisfying the following logical condition for peak detection within neighboring slices,
This method was repeatedly applied until it reached the left and right edges of the vertical slices corresponds to point densities of the rail-track. The difference between the number of slices count in left and right stands as a total length of the turnout. Thereby the turnout initiation location and total length was estimated to distinguish them from ideal model fitting [30].
2.5. Model Fitting
The preliminary scanning of the MLS server dataset detects and classifies the ideal track, left/right turnout and crossing locations. It identifies the locations of the rail track, which need to be matched with vivid shapes for precise estimation of GC in the second stage. Therefore, the survey dataset itself is used as the organizer to classify each different structural shape and locations. This is used as a dictionary to match the model according to the probable shape of the classified track location using the iterative closest pair method [31,32,33,34]. This self-organized frame of the proposed method enhances the accuracy of the conventional GC detection method [18,19,20]. In this survey, we used three identical shapes to match the structures, which was described in Section 2.3. The identical shapes of the rail track were synthesized by measuring the dimensions of the rail head.
The clipped point cloud in Figure 9a is projected into the plane, which is vertical to the trajectory direction as depicted in Figure 9b. Next, the position of the GC, which is the inside corner of a rail head, was extracted by matching the shape of the ideal rail head with respect to the projected point cloud in Figure 9c by adopting the ICP algorithm. The reason for using the shape of a rail head instead of a whole shape is to avoid the mismatching of GCs’ height due to rail wear in each model. Then the precise position of GC was estimated and the railway track position was accurately estimated as in Figure 9d. The mirror image of synthesized shape in each model in Figure 9d was applied to track the extraction in both left and right railway lines. This method was repeatedly applied to each of the track points located in a 1 m distance. Finally, the rail geometry and track center line are defined as each connected GC positions and each points of track center sequentially.
3. Experiment and Evaluation
The onsite experiment was carried out by the MLS sensor mount on a trolley, which was attached to the motor car. The complete system; sensor, trolley and motor car are depicted in Figure 10a. The system acquired point cloud from the surrounding environment while moving along the railway line. The recorded point cloud includes the rail track and other railway structures; signaling polls, cantilevers, kilo post and distributed structures; station platforms, bridges, tunnels, etc. Therefore, the identification of the point cloud corresponded to the rail track becoming challenging. The geometry of the experimental setup and acquired point cloud were used to obtain a relative position of the railway track. The GNSS along with MLS was defined as the initiative position of recorded point cloud. Thereby extraction length was set as the maximum distance in the vertical plane and 1 m interval was set as the region of observation in the horizontal plane. The overall processing flow was summarized in Figure 10b.
Two local railway lines were tested in the preliminary survey using the same experimental setup. Railway line A is located near Osaka city, Japan and is depicted in Figure 11. Railway line B is located near Kyoto city, Japan and is depicted in Figure 12. Both locations are heavily urbanized and the transportation infrastructure lies favorable for the complicacy of the surrounding. The stranded distance between two rail heads (2r) was fixed as 1067 mm. The height information within a 1 m interval was calibrated with GPS and the motion sensor. Then the fixed height adjustment factor was estimated to detect the rail position in the vertical plane. The height adjustment factor becomes an important parameter to estimate the threshold value CT. In the presurvey, point density recorded in the ideal track, turnout and crossings was examined. Then the estimated average value of point density for each railway structure ideal track, turnout and crossing was used as a threshold value CT during the regular MLS survey. The recorded point densities and their spatial location along the track (horizontal plane) and in the cross track (vertical plane) were used to identify the structures lie on the railway track as depicted in Figure 13.
However, the rail track conditions in each line have some differences to the acquired MLS datasets. The average moving speed during the experiment has been reported as 20 km/h in the locomotive. However this speed has been differed in both railway tracks due to the number of bends and slope conditions. It becomes a noticeable factor while estimating the threshold parameters CT1 and CT2 as estimated and summarized in Table 3 and Table 4. The proposed algorithm was applied to the large point cloud dataset received from the railway track survey. The locations of crossings, left-turnouts and right-turnouts were notified with each track iteration in the railway monitoring system. As a quantitative estimation, we summarized the number of detected structures and results of visual inspection after the manual survey of each railway line in Table 3 and Table 4.
The comparison of model fitting results for GC detection, before and after applying the proposed results for the left rail was depicted in Figure 13 the left side. The comparison of model fitting results for GC detection, before and after applying the proposed results for the right rail was depicted in Figure 13 the right side. It shows that Model 1, GC of the ideal track remained as the best fitting in both conventional and proposed methods. In Model 2, the GC detection near to the crossing fell under a fail attempt for GC detection in Figure 13b,h. On the other hand, predetection of the crossing location by self-organized query changes the shape of the GC for both left and right side rail heads. Then, the GC position was accurately estimated. Therefore, the proposed alternative process becomes a very efficient method to detect and further analyze the locations, which need more attention for the ICP based model fitting method. Model 3 in Figure 13c depicts the point cloud near to turnout location. The conventional method and the proposed method accurately estimated the left GC corner, but the right GC fell under false estimation. This could be cause due to shape irregularities in the neighborhood of the turnout. The rail head shape near to the turnout combined as a compound structure, which is very challenging for shape simulation. This shape asymmetry depends on the direction of the (left/right sided) turnout. Therefore, those mismatching locations need to be further assessed. The manual survey results proved that the proposed algorithm extracted all the turnouts, without missing any of the real structures. However, the crossing estimation shows one overdetection. This was caused due to the overlap of the point cloud data, which later was identified as a correction position of the raw point cloud in the original dataset.
4. Accuracy Estimation
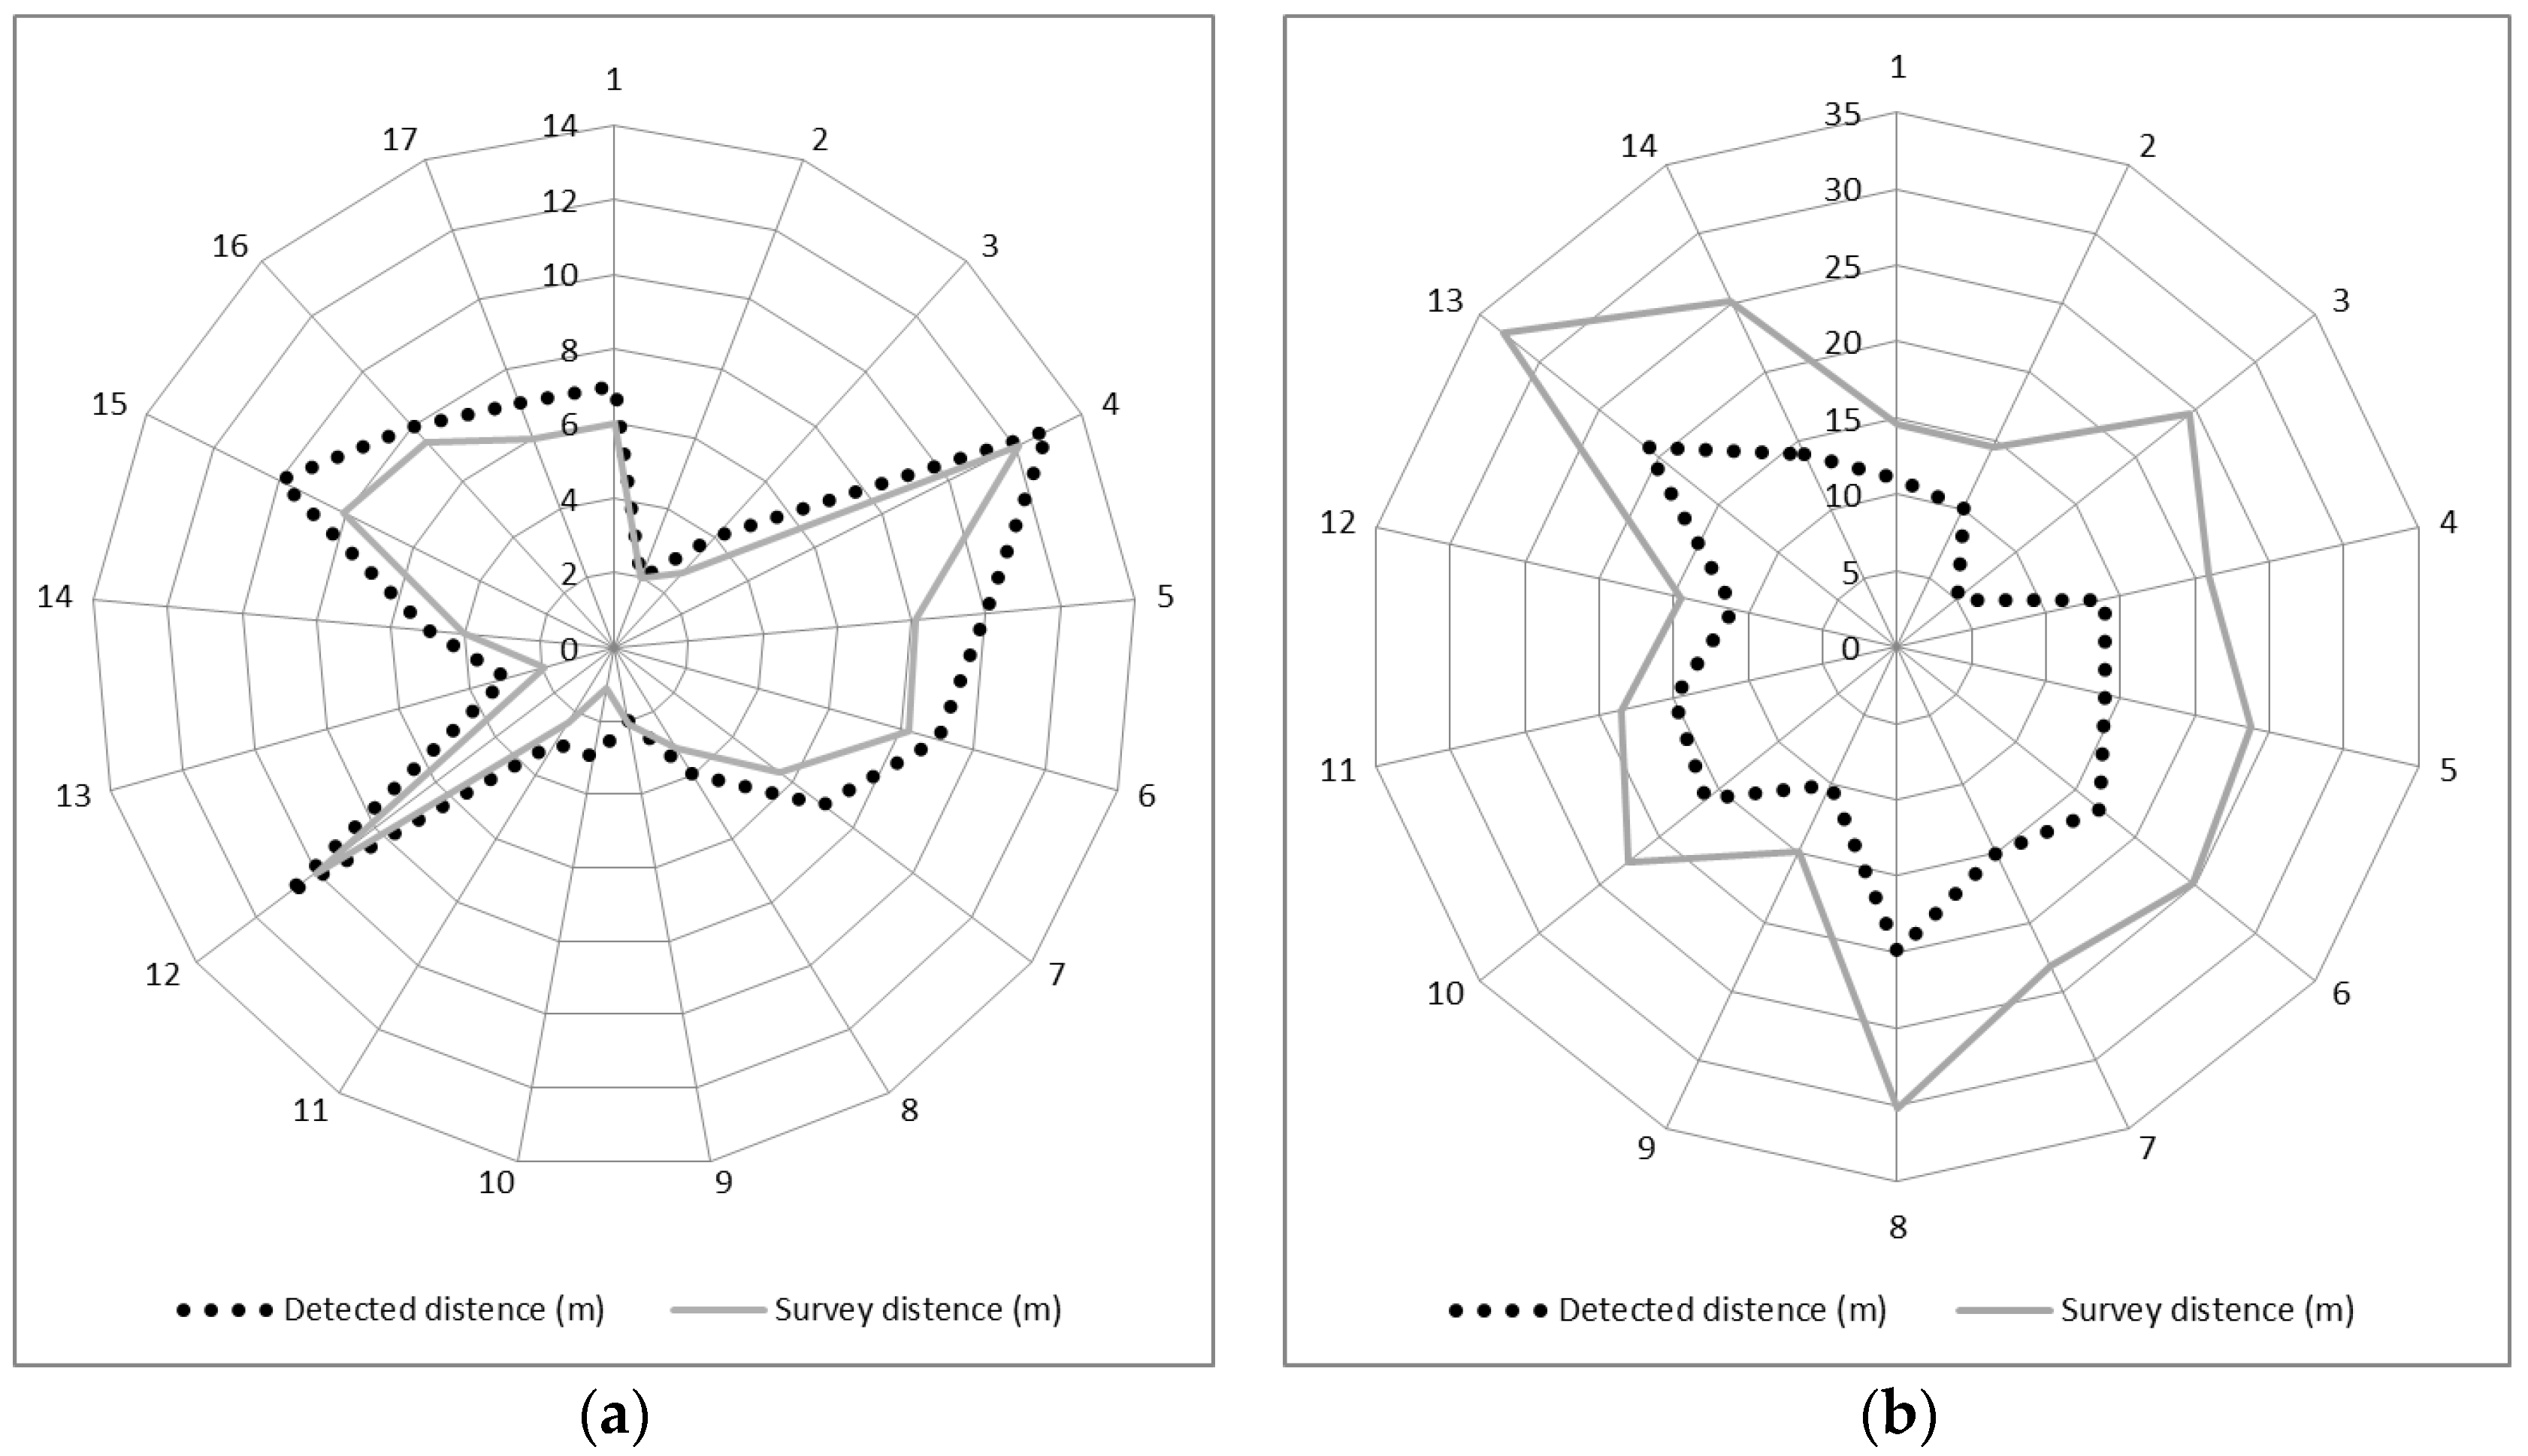
As a qualitative estimation, we compared the detected length of both crossings and turnouts with their real length by manually measuring each of the structure locations as the standard for verification. Figure 14 proved that both crossings and turnout had 100% detection accuracy. The comparison of crossings in Figure 14a depicts that the lengths of the crossing structures length had a better agreement with a manual survey. However, Figure 14b, the length of the turnout shows some shifts. This could occur due to the point density variation near the target due to the characteristics of the laser scanner and the moving speed of a bogie pulled motor car, which needs to be improved in future. Therefore, the quantitative estimation of both rail crossing and turnout detection achieved a 100% successive rate. The detected length of each turnout was smaller than its actual length measured by a manual survey, but proportionally equal to its real length. Therefore, turnout length should be calculated and updated before applying the model fitting step of the algorithm.
5. Conclusions
The proposed algorithm presents a novel framework for automatic rail track extraction for MLS data. It allows one to detect the requested object very precisely from surrounding railway structures with less background information. This was recorded in the track information dictionary, which contained ideal track, turnout and crossing details with their spatial locations. Then the appropriate model fitting method can be applied to increase the accuracy of the rail GC position estimation. Therefore, the automatic rail extraction can be done for the spatial locations with multiple structures, which become problematic to evaluate by conventional GC detection methods. Further, sensitive analysis can be done in order to estimate the railway track with the optimum precision. In the conventional methods, the accuracy of the structure locations derived by an acquired point cloud is based on the accuracy of the received GNSS reading. However, the proposed rail structure detection method is based on both point cloud density and pattern recognition along the track and cross-track direction. The railway structure position along the track was estimated by pattern recognition (Section 2.3) and the structure position in cross-track direction was detected by the threshold value of the vertical slice. Thus an accurate alignment of the GNSS position will not become mandatory for the process, which is an advantage during the field experiment. The proposed method was tested with two local railway lines. The results indicate that the proposed method could be applied with 100% structure detection accuracy. However, the detected length and the measurement length show some discrepancies, especially for lengthy structures, which need to be compensated as a secondary step. Furthermore, point density of each vertical slice becomes an important parameter to set the threshold value for structure extraction. This will also depend on the LiDAR system and moving speed of the locomotive. Those dependencies can be eliminated by estimating the threshold values through the sample dataset. In this campaign, we mainly focused on three of the most common rail structures; ideal track, turnouts and crossings. Those three structures showed the best successive rate with no fall detection. Moreover, the proposed structure detection method could also be adjusted according to the physical dimension of the other objects such as rail bottom, fastening nuts, signaling sensors, etc. The resultant point density and its spatial location could be used for rail track structure identification. This enhanced the rail track extraction process and performed well in any complex situation with multiple disturbances.
Author Contributions
Conceptualization, Y.N. and A.K.; investigation, A.K.; methodology, A.K.; algorithm, A.K. and R.H.; formal analysis, A.K.; data curation, Y.N. and R.H.; writing—original draft preparation, A.K.; writing—review and editing, A.K.; visualization, A.K.; supervision, Y.N. and R.H. All authors have read and agreed to the published version of the manuscript.
Funding
This research received no external funding.
Acknowledgments
We are thankful for West Japan Railway Company for the provision of MLS data.
Conflicts of Interest
The authors declare no conflict of interest.
References
- Niina, Y.; Oketani, E.; Yokouchi, H.; Honma, R.; Tsuji, K.; Kondo, K. Monitoring of railway structures by MMS. J. Jpn. Soc. Photogramm. Remote Sens. 2016, 55, 95–99. [Google Scholar] [CrossRef] [Green Version]
- Miao, Z.; Wang, B.; Shi, W.; Wu, H. A Method for Accurate Road Centerline Extraction from a Classified Image. IEEE J. Sel. Top. Appl. Earth Obs. Remote Sens. 2014, 7, 4762–4771. [Google Scholar] [CrossRef]
- Miao, Z.; Shi, W.; Zhang, H.; Wang, X. Road Centerline Extraction from High-Resolution Imagery Based on Shape Features and Multivariate Adaptive Regression Splines. IEEE Geosci. Remote Sens. Lett. 2012, 10, 583–587. [Google Scholar] [CrossRef]
- Wang, Y.; Chen, Q.; Zhu, Q.; Liu, L.; Li, C.; Zheng, D. A Survey of Mobile Laser Scanning Applications and Key Techniques over Urban Areas. Remote Sens. 2019, 11, 1540. [Google Scholar] [CrossRef] [Green Version]
- Petrie, G. Mobile mapping systems: An introduction to the technology. GeoInformatics 2010, 13, 32–43. [Google Scholar]
- Puente, I.; González-Jorge, H.; Martínez-Sánchez, J.; Arias, P. Review of mobile mapping and surveying technologies. Measurement 2013, 46, 2127–2145. [Google Scholar] [CrossRef]
- Tang, P.; Huber, D.; Akinci, B.; Lipman, R.; Lytle, A. Automatic reconstruction of as-built building information models from laser-scanned point clouds: A review of related techniques. Autom. Constr. 2010, 19, 829–843. [Google Scholar] [CrossRef]
- Khoshelham, K.; Li, Z. A Model-Based Approach to Semi? Automated Reconstruction of Buildings from Aerial Images. Photogramm. Rec. 2004, 19, 342–359. [Google Scholar] [CrossRef]
- Mikrut, S.; Kohut, P.; Pyka, K.; Tokarczyk, R.; Barszcz, T.; Uhl, T. Mobile Laser Scanning Systems for Measuring the Clearance Gauge of Railways: State of Play, Testing and Outlook. Sensors 2016, 16, 683. [Google Scholar] [CrossRef] [Green Version]
- Soni, A.; Robson, S.; Gleeson, B. Extracting rail track geometry from static terrestrail laser scans for monitoring purposes. Int. Arch. Photogramm. Remote Sens. Spat. Inf. Sci. 2014, 45, 553–557. [Google Scholar] [CrossRef] [Green Version]
- Railway ICT Solution “RaiLis” by 3D Laser Measurement, Asia Air Survey Co., LTD. Available online: https://www.ajiko.co.jp/product (accessed on 6 November 2020).
- Soni, A.X. Non-Contact Monitoring of Railway Infrastructure with Terrestrial Laser Scanning and Photogrammetry at Network Rail. Ph.D. Thesis, University College London, London, UK, 2016. [Google Scholar]
- Zou, R.; Fan, X.; Qian, C.; Ye, W.; Zhao, P.; Tang, J.; Liu, H. An Efficient and Accurate Method for Different Configurations Railway Extraction Based on Mobile Laser Scanning. Remote Sens. 2019, 11, 2929. [Google Scholar] [CrossRef] [Green Version]
- Coelho, B.E.Z. Dynamics of Railway Transition Zones in Soft Soil. Master’s Thesis, University of Porto, Porto, Portugal, 2010. [Google Scholar]
- Yang, B.; Fang, L. Automated Extraction of 3-D Railway Tracks from Mobile Laser Scanning Point Clouds. IEEE J. Sel. Top. Appl. Earth Obs. Remote Sens. 2014, 7, 4750–4761. [Google Scholar] [CrossRef]
- Besl, P.; McKay, N.D. A method for registration of 3-D shapes. IEEE Trans. Pattern Anal. Mach. Intell. 1992, 14, 239–256. [Google Scholar] [CrossRef]
- Diaz Benito, D. Automatic 3d Modelling of Train Rails in a Lidar Point Cloud. Master’s Thesis, University of Twente, Enschede, The Netherlands, 2012. [Google Scholar]
- Arastounia, M. Automated Recognition of Railroad Infrastructure in Rural Areas from LIDAR Data. Remote Sens. 2015, 7, 14916–14938. [Google Scholar] [CrossRef] [Green Version]
- Zhou, Y.; Wang, S.; Mei, X.; Yin, W.; Lin, C.; Hu, Q.; Mao, Q. Railway Tunnel Clearance Inspection Method Based on 3D Point Cloud from Mobile Laser Scanning. Sensors 2017, 17, 2055. [Google Scholar] [CrossRef]
- Elberink, S.O.; Khoshelham, K. Automatic Extraction of Railroad Centerlines from Mobile Laser Scanning Data. Remote Sens. 2015, 7, 5565–5583. [Google Scholar] [CrossRef] [Green Version]
- Niina, Y.; Honma, R.; Honma, Y.; Kondo, K.; Tsuji, K.; Hiramatsu, T.; Oketani, E. Automatic rail extraction and celarance check with a point cloud captured by mls in a railway. ISPRS Int. Arch. Photogramm. Remote Sens. Spat. Inf. Sci. 2018, 767–771. [Google Scholar] [CrossRef] [Green Version]
- Kukko, A.; Kaartinen, H.; Hyyppä, J.; Chen, Y. Multiplatform Mobile Laser Scanning: Usability and Performance. Sensors 2012, 12, 11712–11733. [Google Scholar] [CrossRef] [Green Version]
- Brédif, M.; Vallet, B.; Ferrand, B. Distributed Dimensonality-Based Rendering Of Lidar Point Clouds. ISPRS Int. Arch. Photogramm. Remote Sens. Spat. Inf. Sci. 2015, 40, 559–564. [Google Scholar] [CrossRef] [Green Version]
- Masiero, A.; Fissore, F.; Guarnieri, A.; Yang, B.; Visintini, D.; Vettore, A. Performance Evaluation of Two Indoor Mapping Systems: Low-Cost UWB-Aided Photogrammetry and Backpack Laser Scanning. Appl. Sci. 2018, 8, 416. [Google Scholar] [CrossRef] [Green Version]
- Furitsu, Y.; Deguchi, D.; Kawanishi, Y.; Ide, I.; Murase, H.; Mukojima, H.; Nagamine, N. Semantic Segmentation of Railway Images Considering Temporal Continuity. In Pattern Recognition; Springer: Cham, Switzerland, 2019. [Google Scholar]
- Leica Pegasus: Two Ultimate Mobile Reality Capture, Specification, Leica Geosystems AG 2018. Available online: www.leica-geosystems.com (accessed on 6 November 2020).
- Leica Pegasus: Two Ultimate Mobile Reality Capture, Smart City Applications, Leica Geosystems AG 2018. Available online: www.leica-geosystems.com (accessed on 6 November 2020).
- Leica Pegasus: Map Factory Mobile Reality Capture, Leica Geosystems AG 2018. Available online: www.leica-geosystems.com (accessed on 6 November 2020).
- Leica Pegasus: Manager Complete Work Flows for Reality Capture Projects, Specification, Leica Geosystems AG 2018. Available online: www.leica-geosystems.com (accessed on 6 November 2020).
- Karunathilake, A.; Honma, R.; Niina, Y. Detection of level crossing and turnouts by vertical slicing of railway MLS point cloud. In Proceedings of the Annual Conference of Japan Society of Photogrammetry and Remote Sensing, Tokyo, Japan, 23–24 May 2019. [Google Scholar]
- Gelfand, N.; Ikemoto, L.; Rusinkiewicz, S.; Levoy, M. Geometrically Stable Sampling for the ICP Algorithm. In Proceedings of the Fourth International Conference on 3-D Digital Imaging and Modeling, Banff, AB, Canada, 6–10 October 2003; pp. 260–267. [Google Scholar]
- Yoshimura, R.; Date, H.; Kanai, S.; Honma, R.; Oda, K.; Ikeda, T. Automatic registration of MLS point clouds and SfM meshes of urban area. Geo-Spat. Inf. Sci. 2016, 19, 171–181. [Google Scholar] [CrossRef]
- Lai, K.; Fox, D. Object Recognition in 3D Point Clouds Using Web Data and Domain Adaptation. Int. J. Robot. Res. 2010, 29, 1019–1037. [Google Scholar] [CrossRef]
- Lowe, D.G. Three-dimensional object recognition from single two-dimensional images. Artif. Intell. 1987, 31, 355–395. [Google Scholar] [CrossRef] [Green Version]
Figure 1.
Point cloud acquired near to the railway: (a) station platform (b) bridge (c) catenary system (d) concrete tunnel (e) track bed in flat terrain (f) track bed in slope terrain (g) level crossing (h) turnout (i) multipel trackes during the mobile laser scanning (MLS) survey.
Figure 1.
Point cloud acquired near to the railway: (a) station platform (b) bridge (c) catenary system (d) concrete tunnel (e) track bed in flat terrain (f) track bed in slope terrain (g) level crossing (h) turnout (i) multipel trackes during the mobile laser scanning (MLS) survey.

Figure 2.
Rail track fastning: (a) ideal case, turnout (b) before changing the track and (c) after changing the track and (d) near rail crossing.
Figure 2.
Rail track fastning: (a) ideal case, turnout (b) before changing the track and (c) after changing the track and (d) near rail crossing.

Figure 3.
MLS sensor.
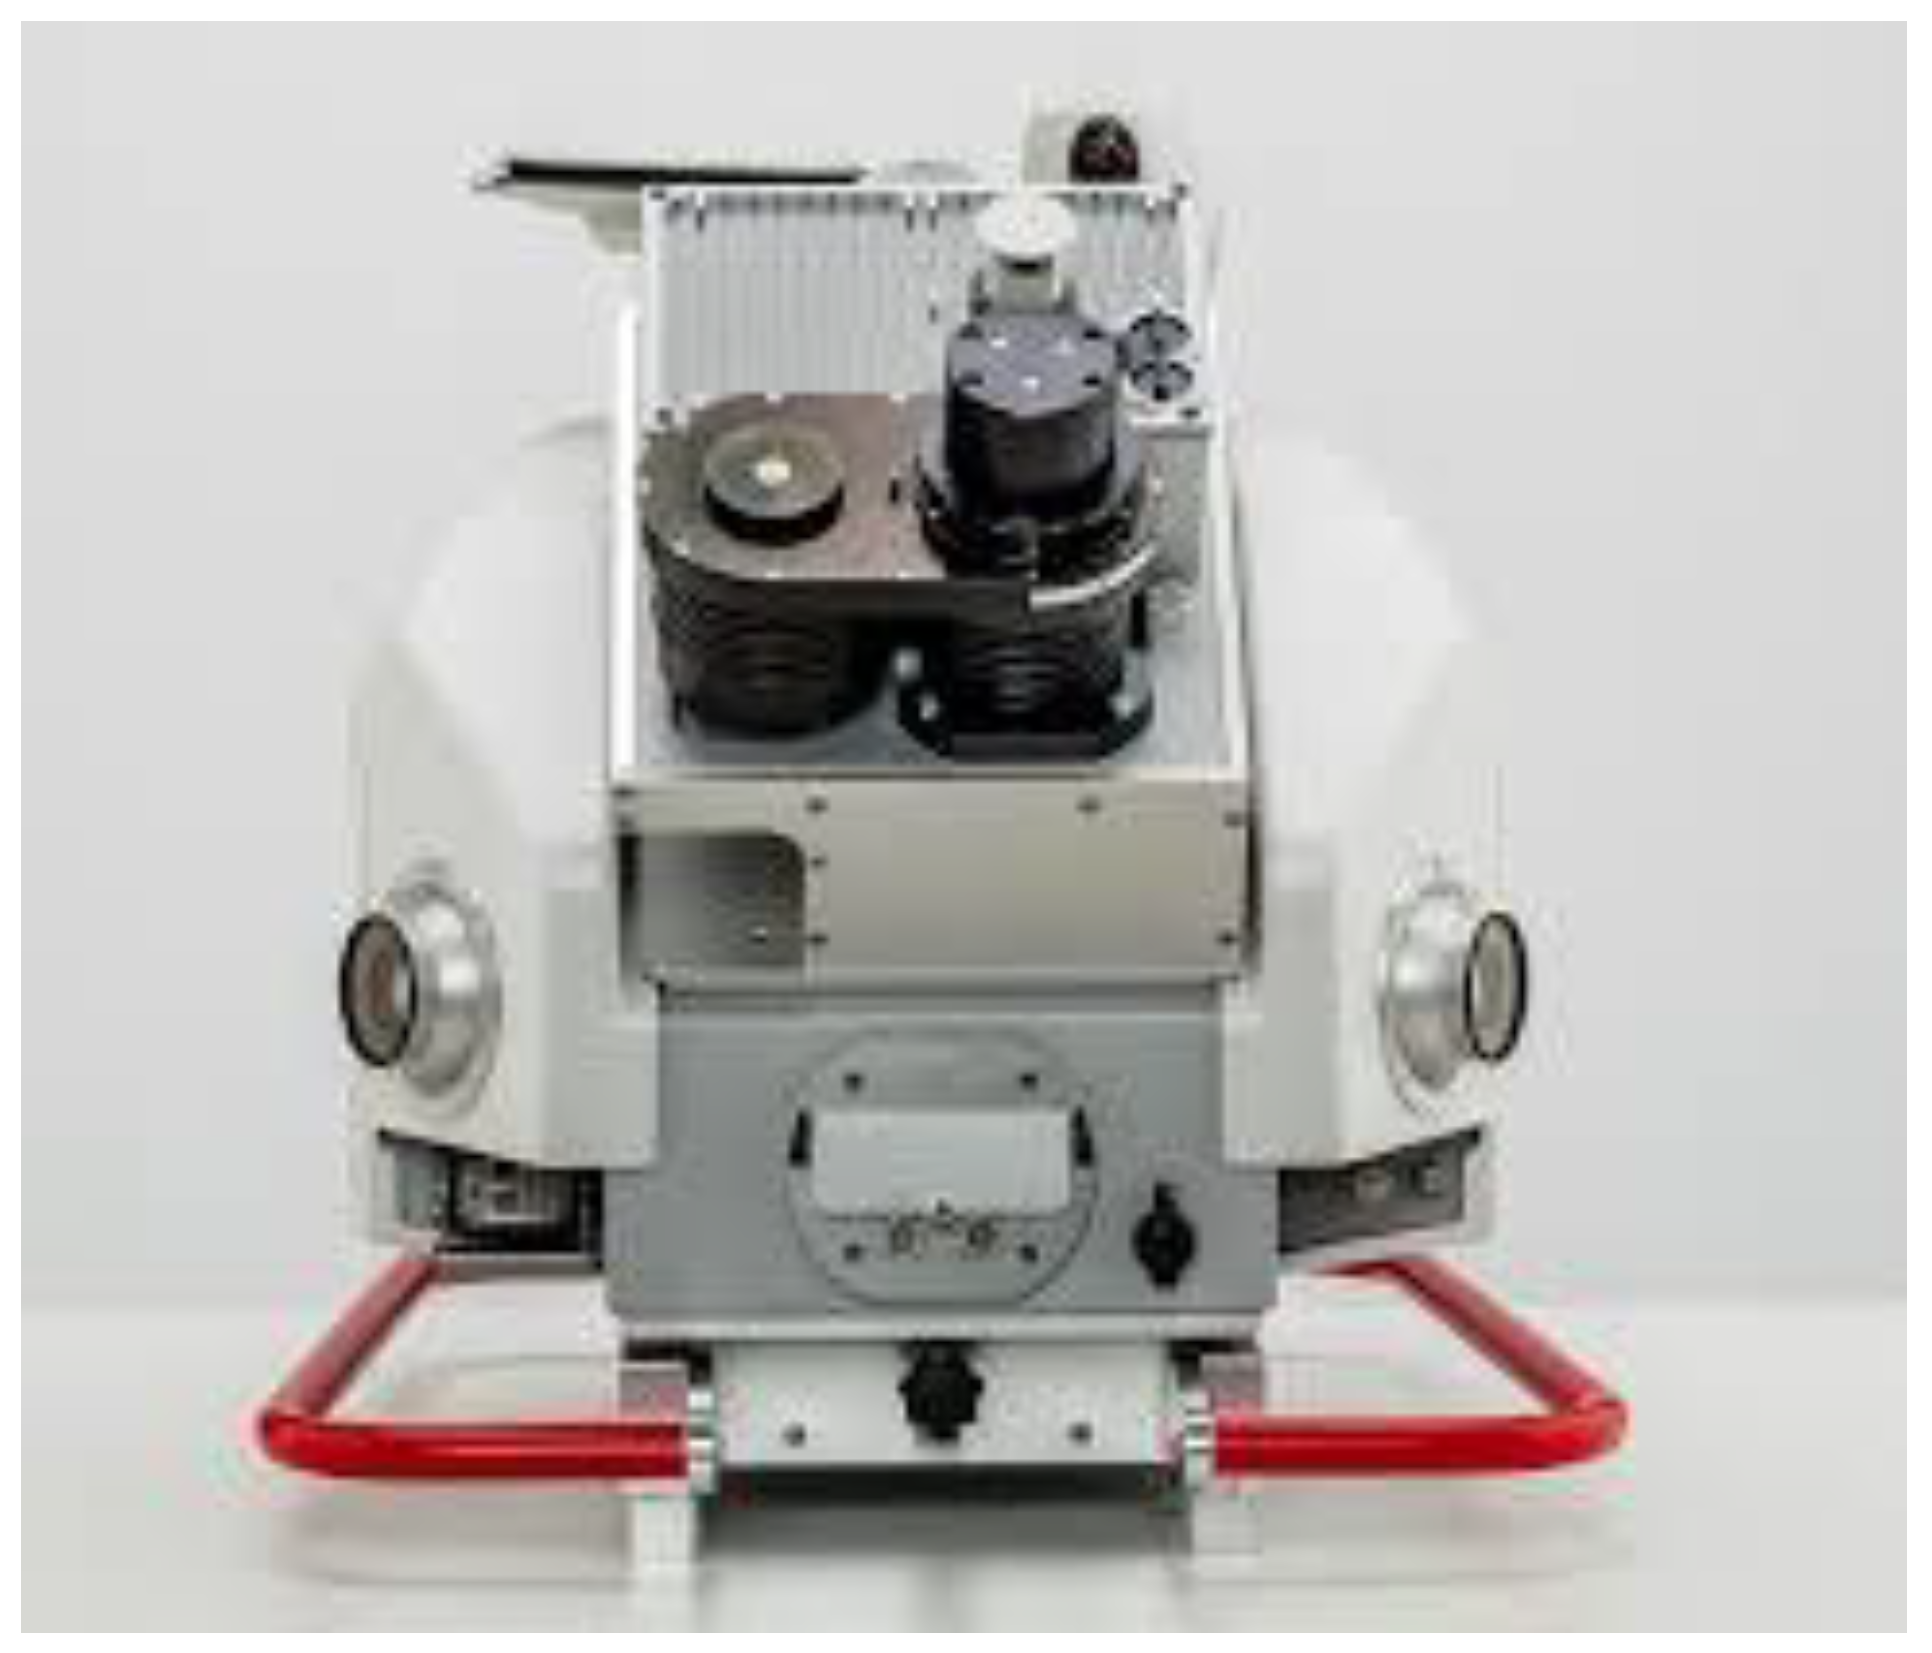
Figure 4.
Experiment setup.
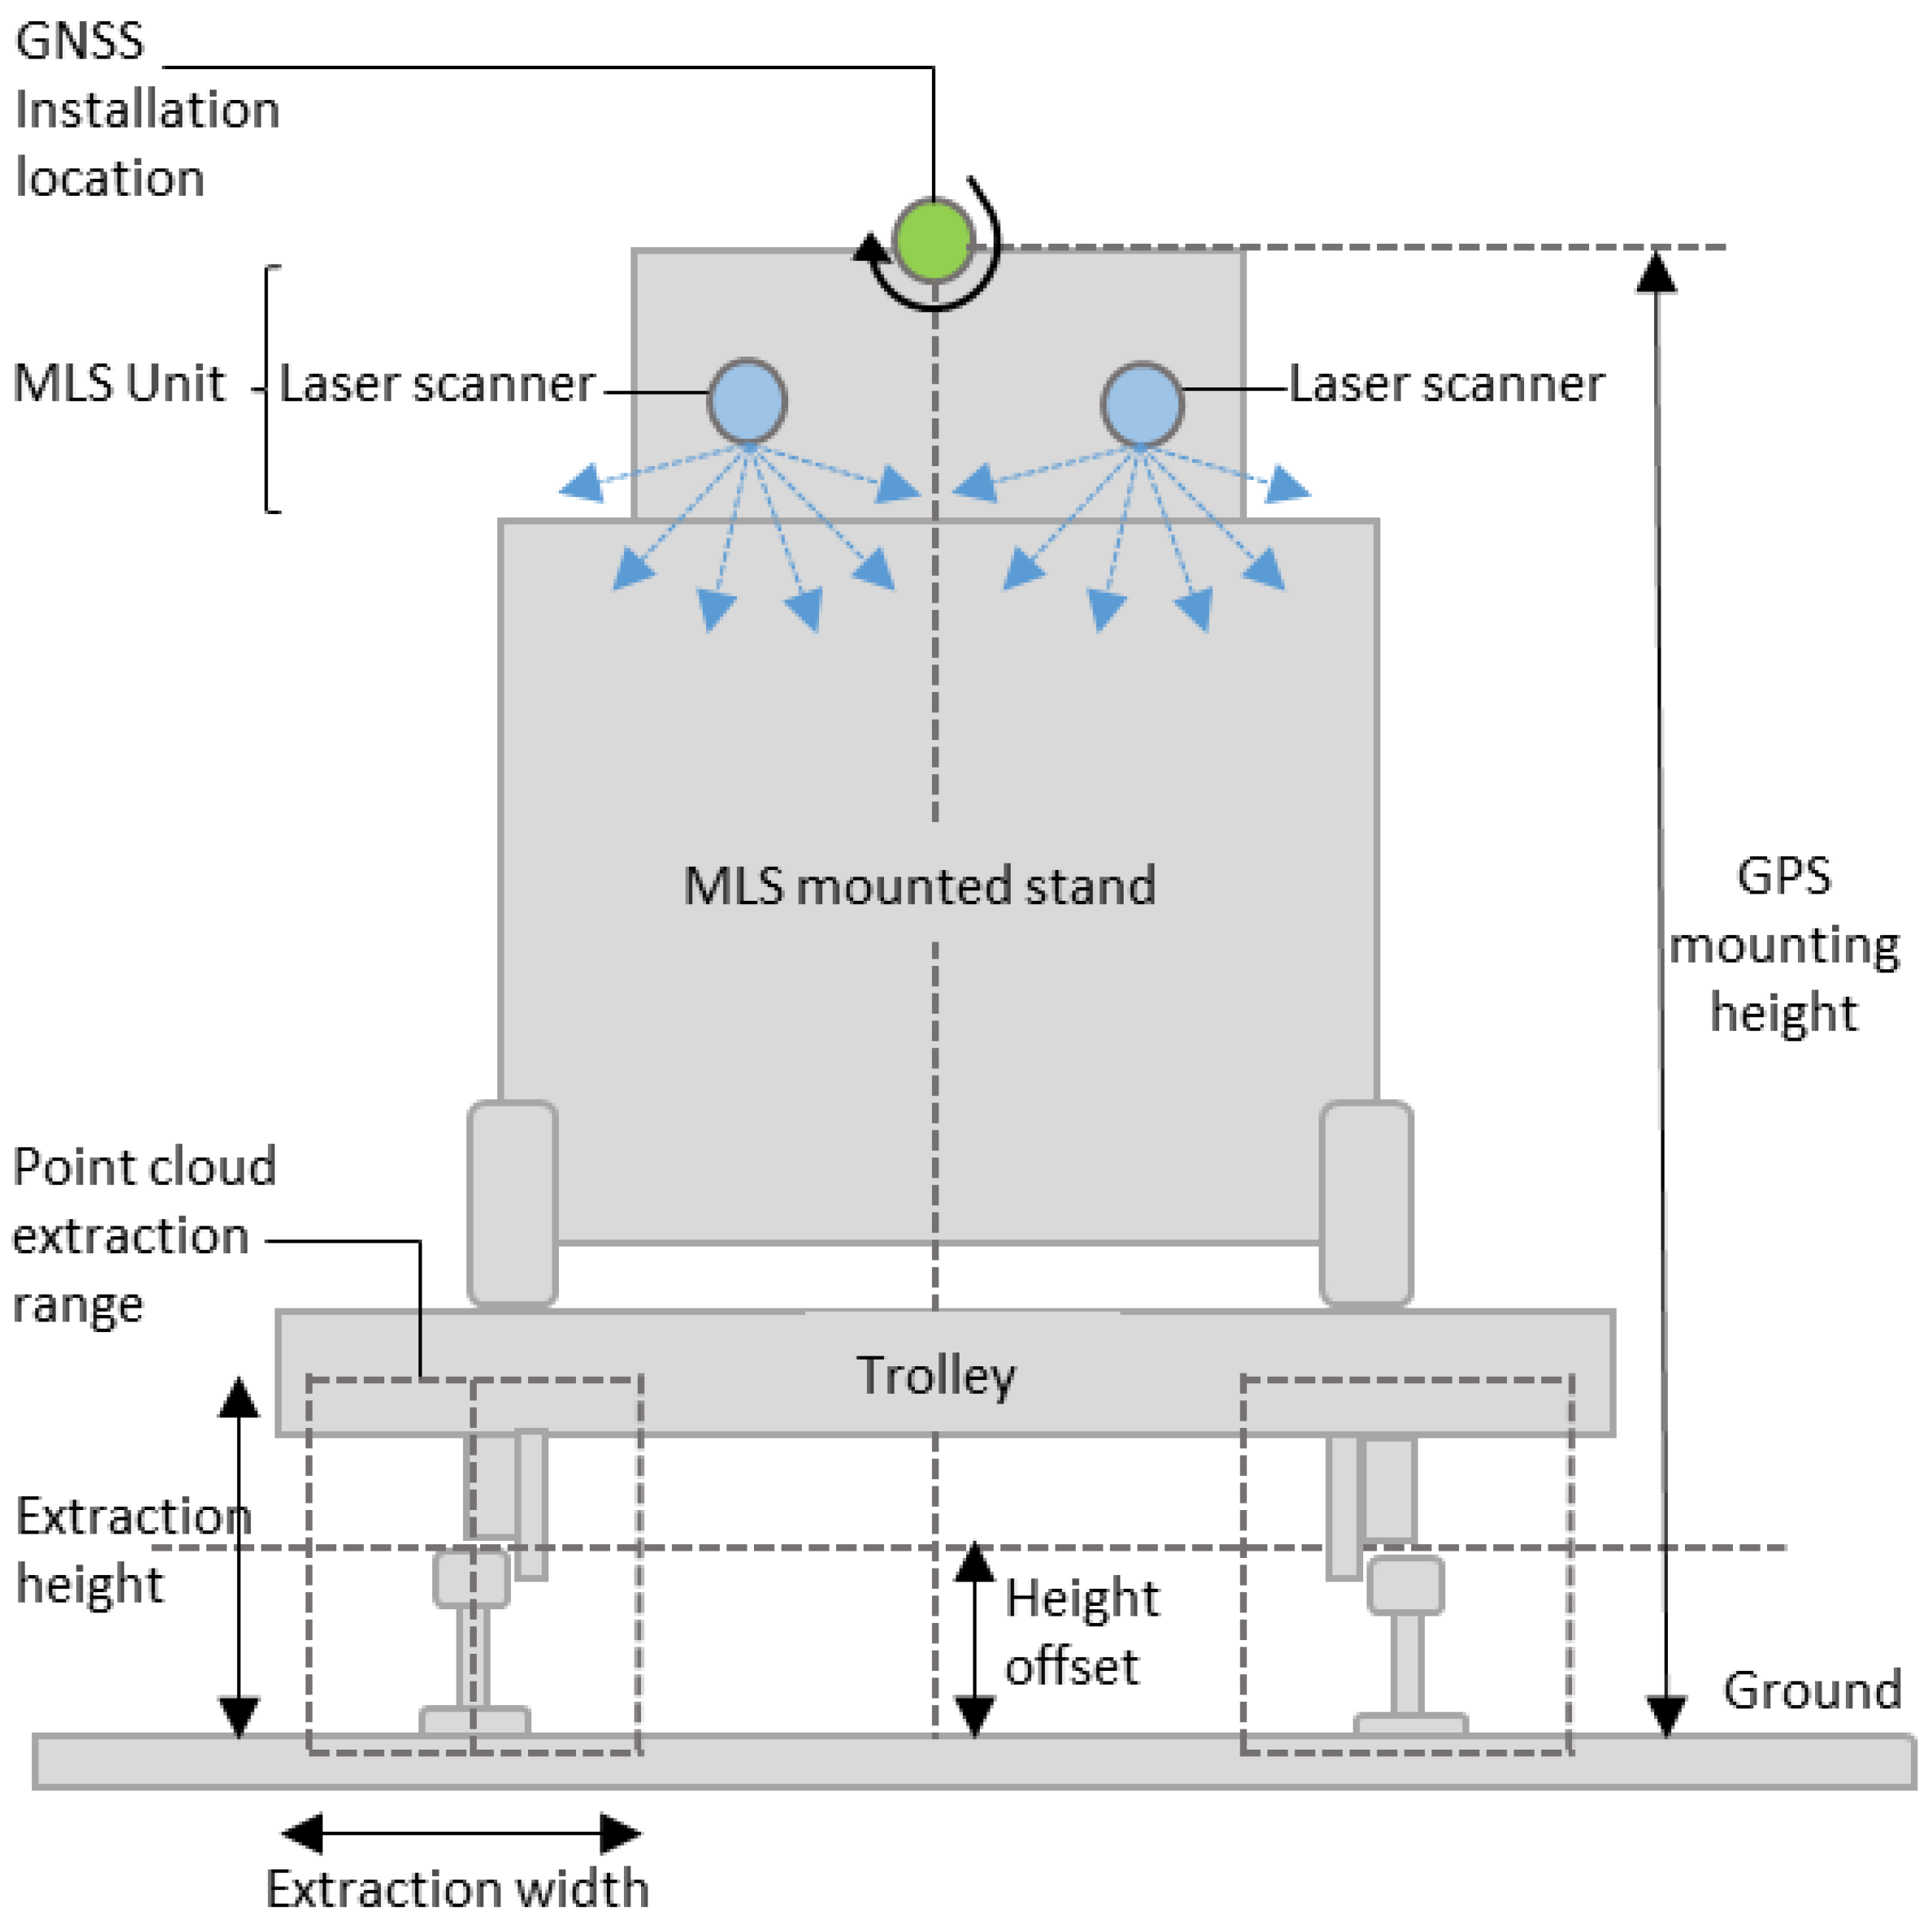
Figure 5.
The recorded GNSS for (a) boundary coordinate estimation and (b) vertical slice definition.
Figure 5.
The recorded GNSS for (a) boundary coordinate estimation and (b) vertical slice definition.
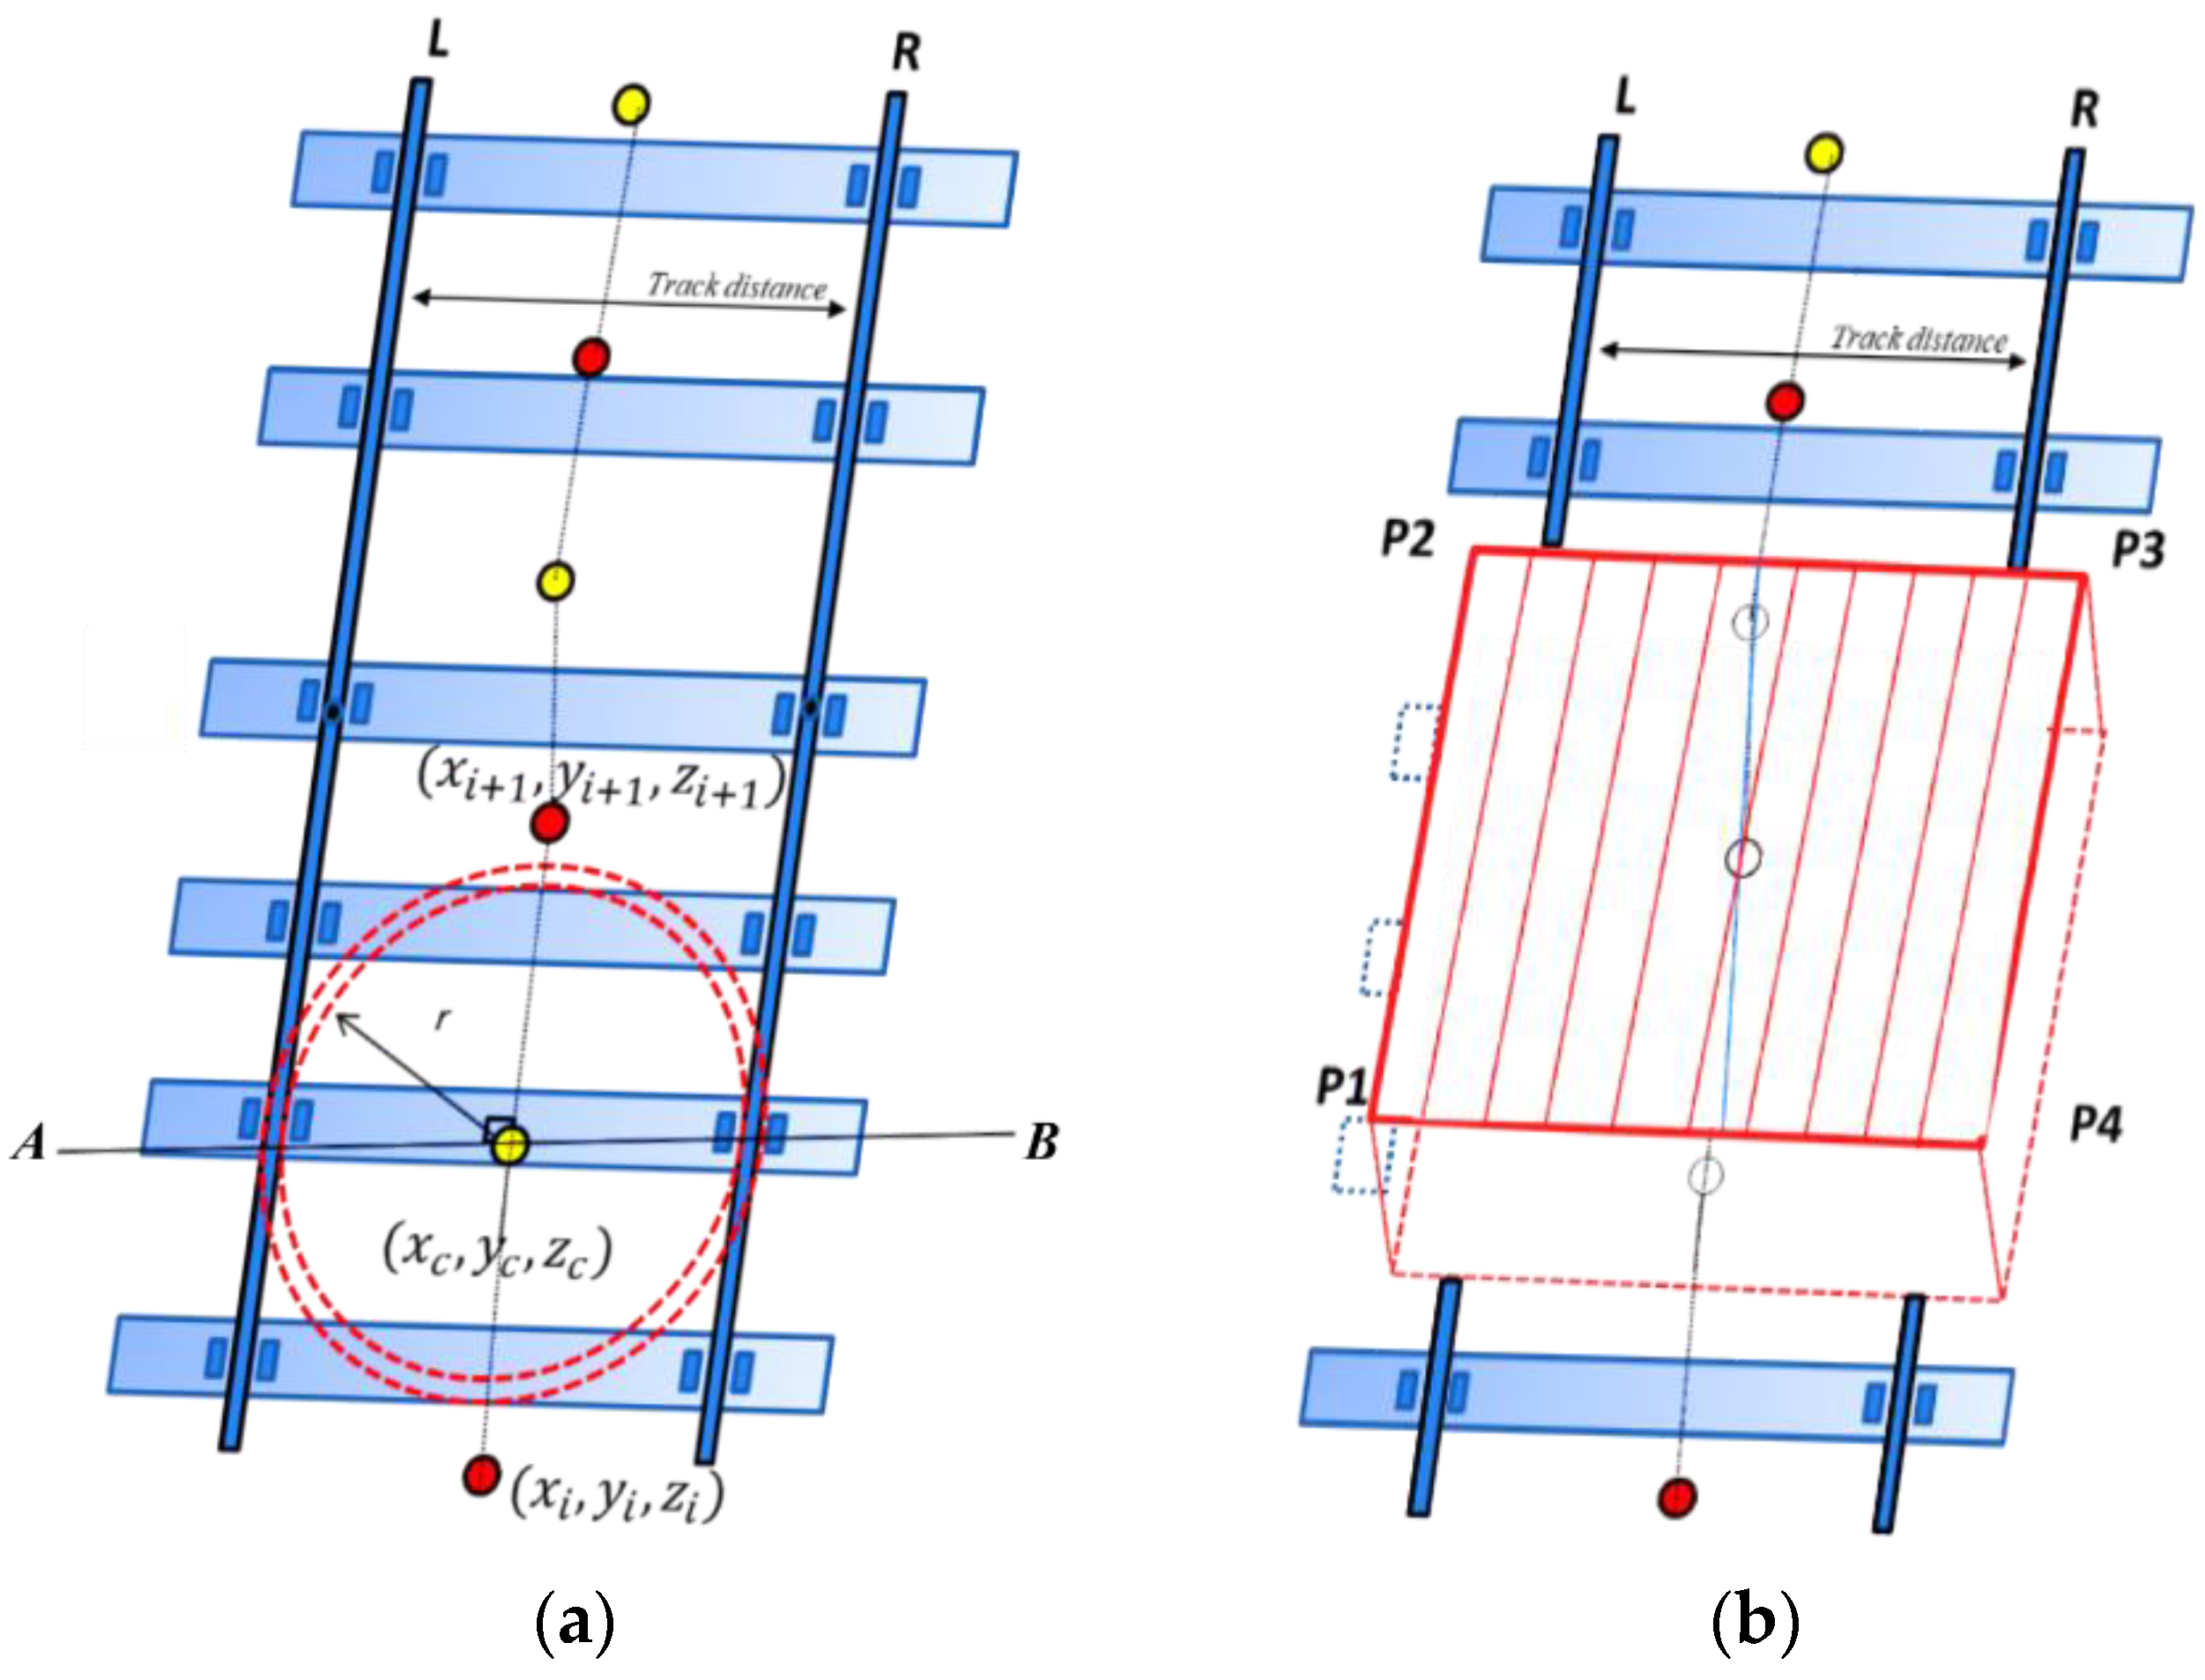
Figure 6.
Dimension of the standard rail.

Figure 7.
Proposed vertical slice for point density extraction near to the railway: (a) ideal track (b) beginning of the track turnout (c) passing of the track turnout (d) the level crossing.
Figure 7.
Proposed vertical slice for point density extraction near to the railway: (a) ideal track (b) beginning of the track turnout (c) passing of the track turnout (d) the level crossing.
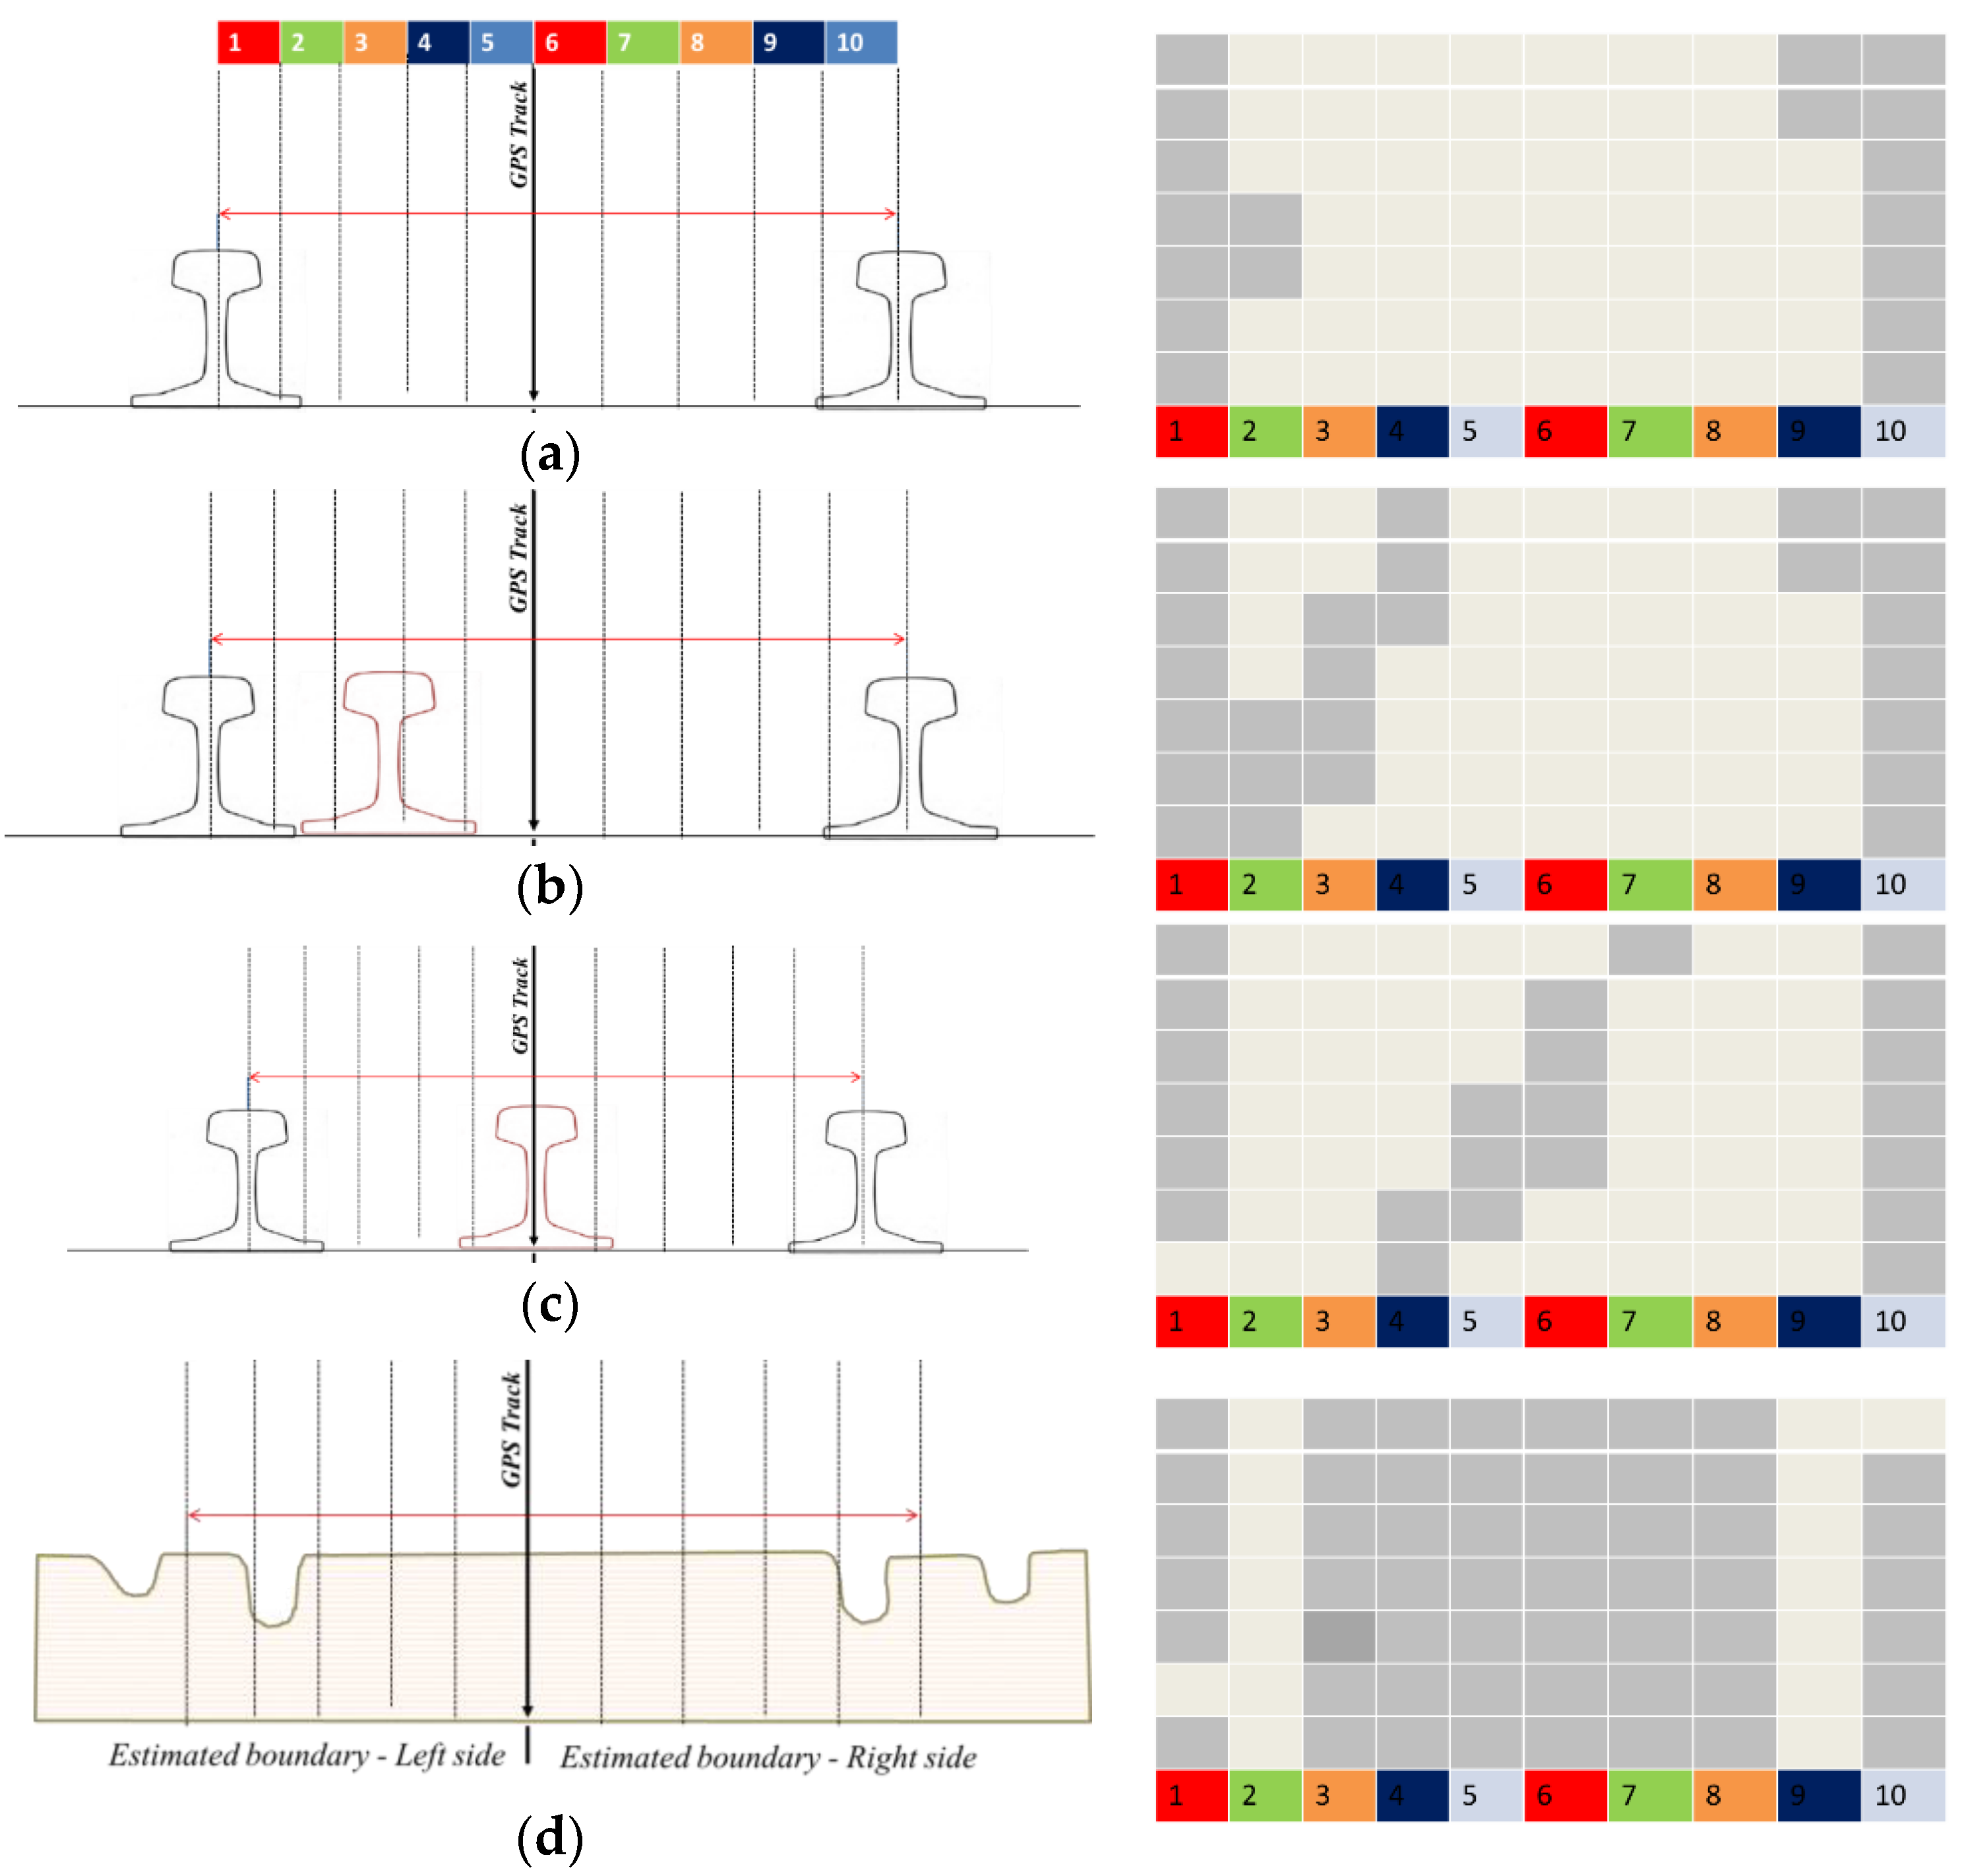
Figure 8.
Apply the proposed method to the real dataset near the (a) rail crossing and (b) turnout in the 2D plane.
Figure 8.
Apply the proposed method to the real dataset near the (a) rail crossing and (b) turnout in the 2D plane.
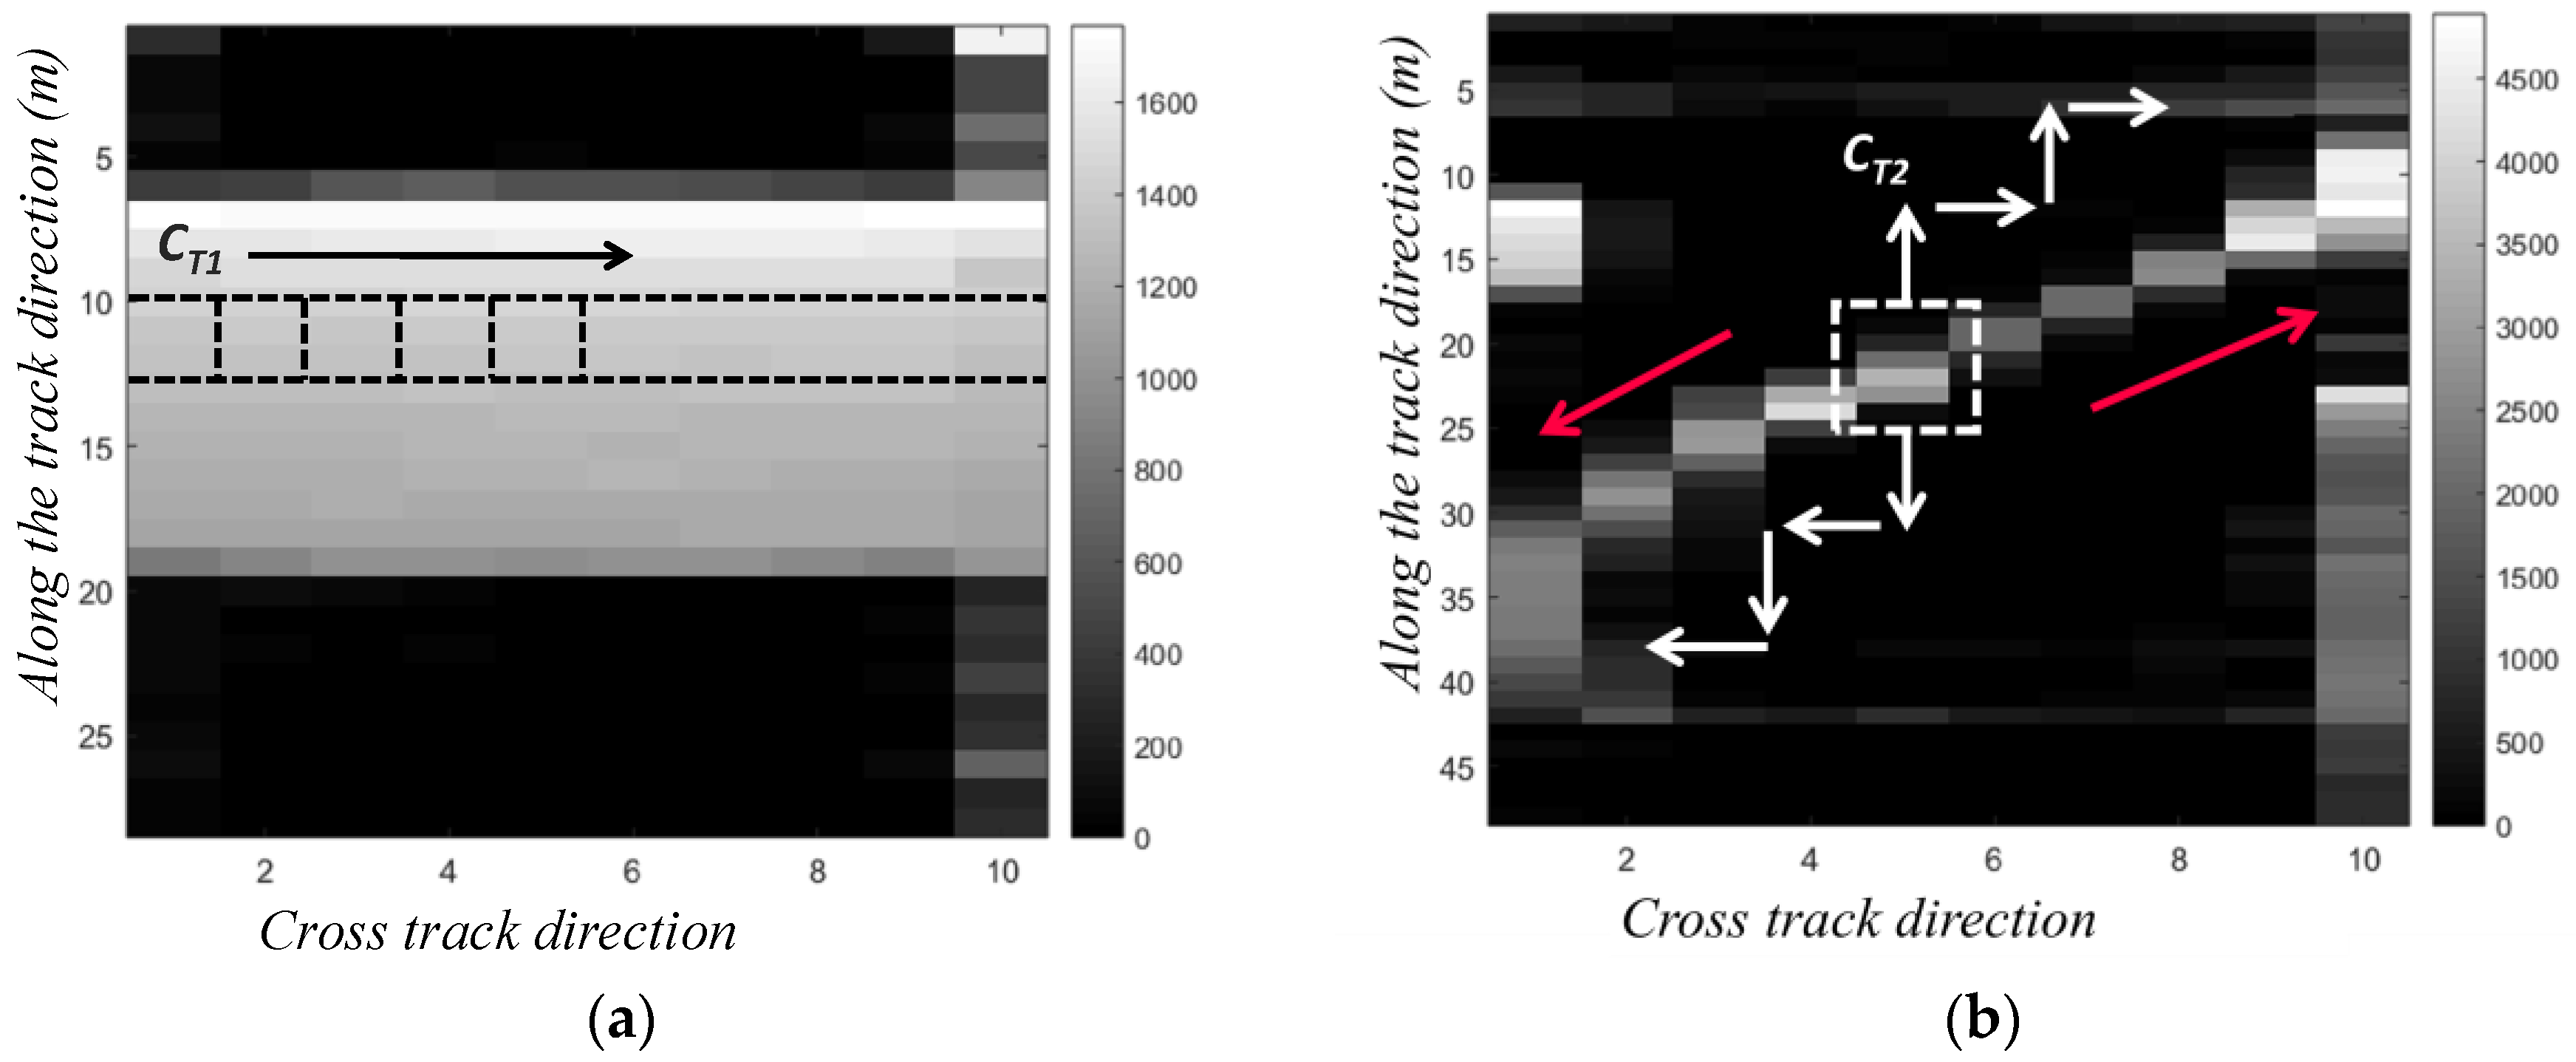
Figure 9.
Spatial dispertion of (a) extracted point cloud in 3D plane (b) projected points in 2D plane, (c) proposed model fitting shapes (d) ICP applied ideal track in Model 1, level crossing in Model 2 and turnout in Model 3.
Figure 9.
Spatial dispertion of (a) extracted point cloud in 3D plane (b) projected points in 2D plane, (c) proposed model fitting shapes (d) ICP applied ideal track in Model 1, level crossing in Model 2 and turnout in Model 3.

Figure 10.
(a) MLS survey setup with the LiDAR sensor and (b) processing flow chart.

Figure 11.
MLS survey site JR Tozai railway line, Osaka city, Japan (Railway line A).

Figure 12.
MLS survey site JR Kusatsu railway line, Kyoto city, Japan (Railway line B).
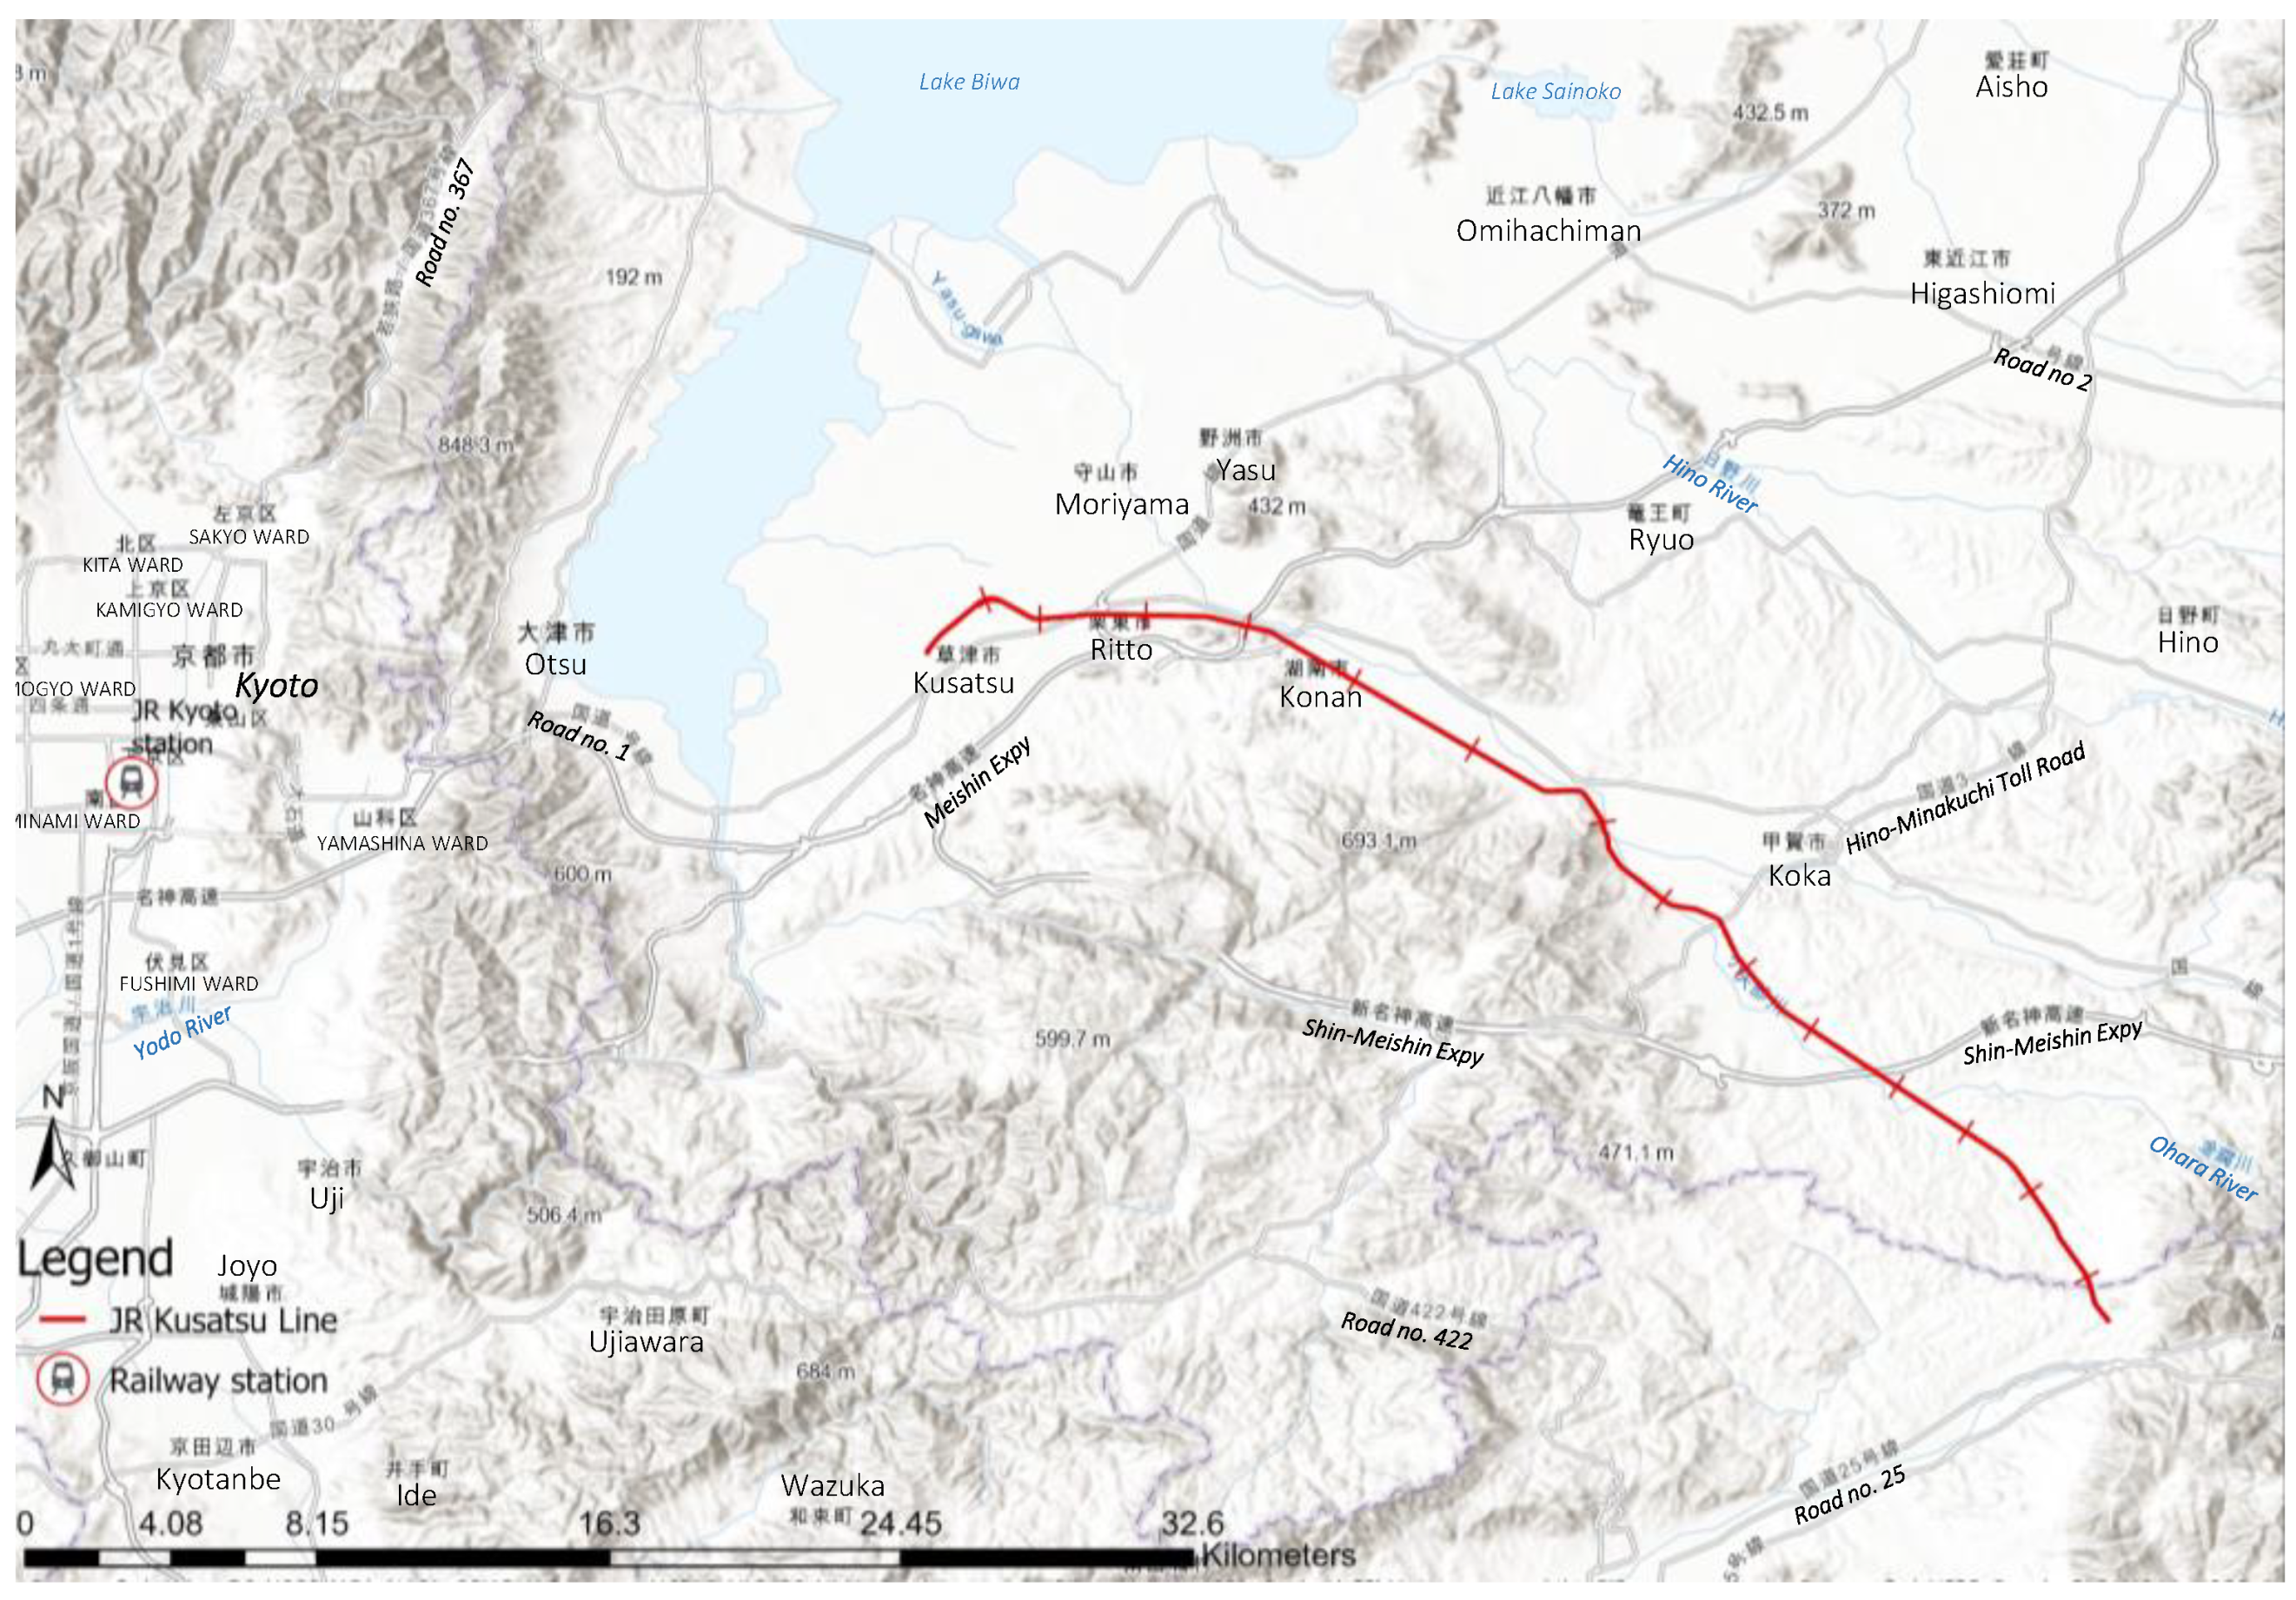
Figure 13.
GC detection results of the left rail track by the conventional track extraction method: (a) ideal track, (b) near crossing and (c) near turnout and the proposed track extraction method: (d) ideal track, (e) near crossing and (f) near turnout. GC detection results of the right rail track by the conventional track extraction method: (g) ideal track, (h) near crossing and (i) near turnout and the proposed track extraction method: (j) ideal track, (k) near crossing and (l) near turnout.
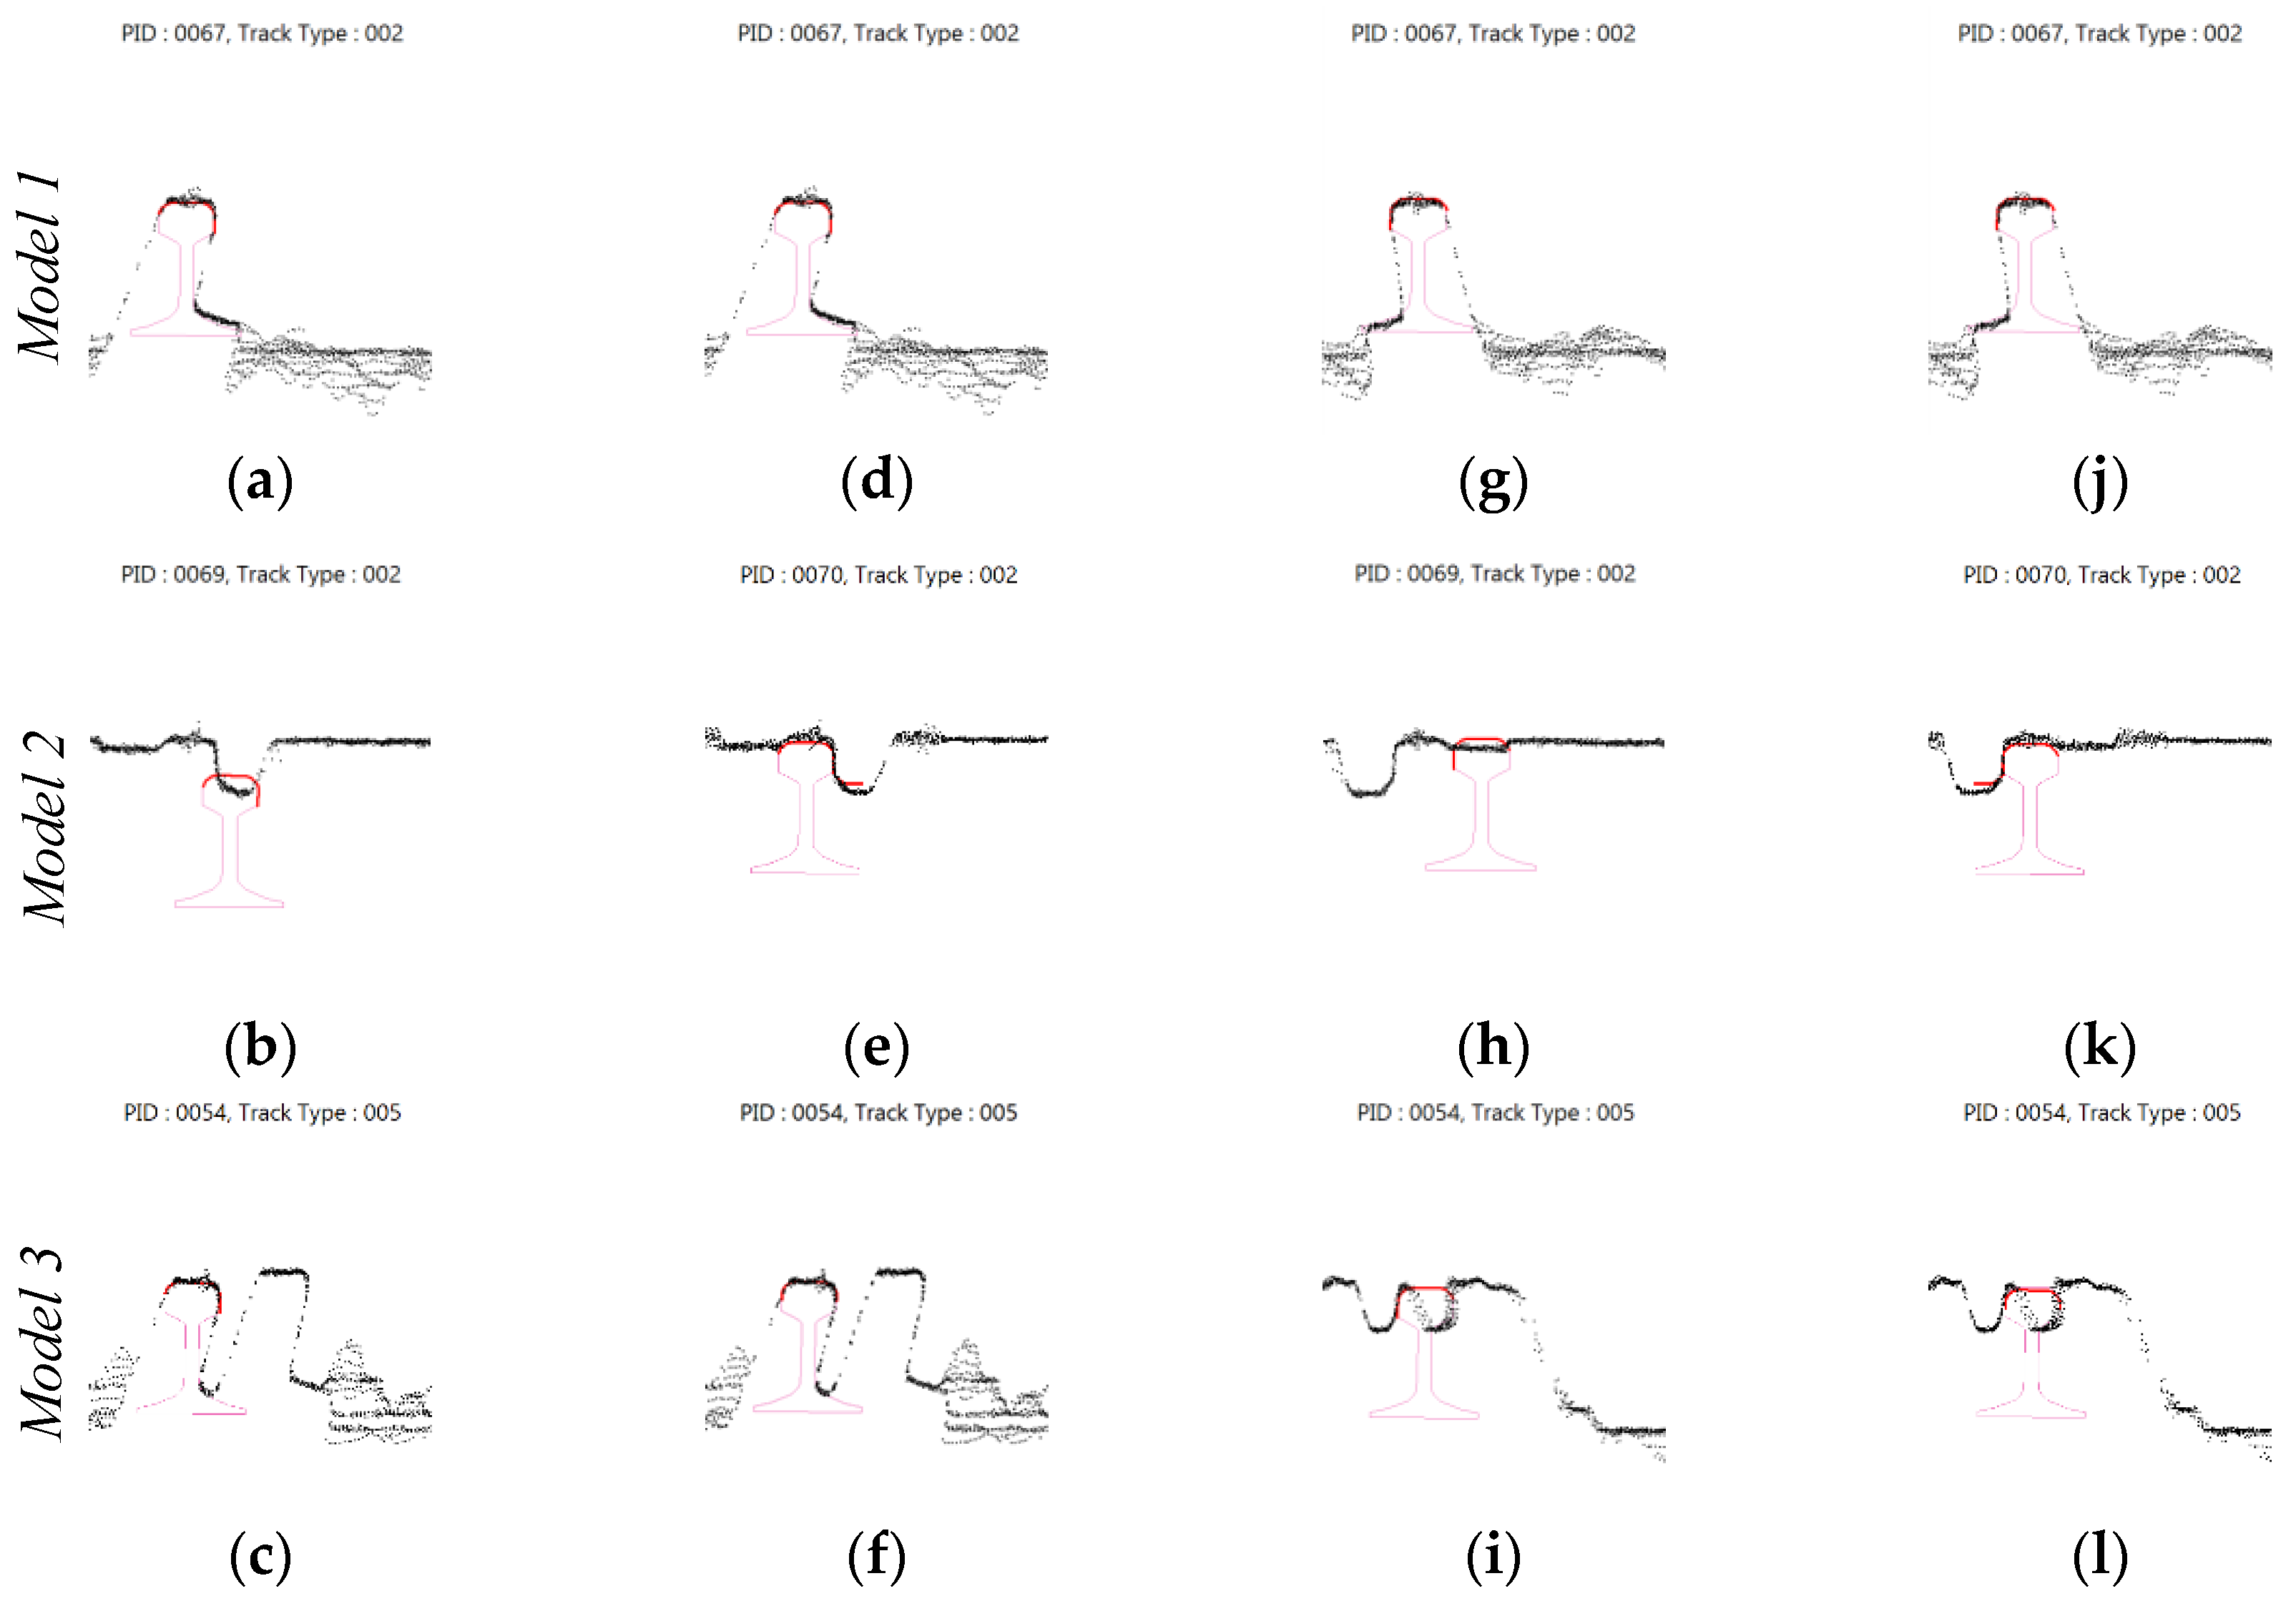
Figure 14.
The comparison of (a) detected crossings, distance with manual inspection and (b) detected turnouts, distance with manual inspection in Kusatsu line.
Figure 14.
The comparison of (a) detected crossings, distance with manual inspection and (b) detected turnouts, distance with manual inspection in Kusatsu line.

Table 1.
Sensor parameters.
| Product Name | Pegasus: Two |
|---|---|
| Manufacture | Leica Geosystems |
| Laser scanner | Z+F PROFILE® 9012 |
| Data acquisition rate | 1.016 million pixel/s (200 Hz) |
| Point density | 1600 pts./m2 (@10 m, 10 m/s) |
| Distances | 0.3–119 m |
| Relative accuracy | About 0.2–0.5 mm (@10 m) |
| Absolute accuracy | 2 cm (Open sky condition) |
Table 2.
Experiment setup parameters.
| Parameter | Value |
|---|---|
| GPS mounting height | 1500 mm |
| Extraction height | 400 mm |
| Height offset | 200 mm |
| Half width | 1067/2 mm |
| Point cloud extraction range | 1000 mm |
| Height of the trolley from rail head | 500 mm |
Table 3.
Structure detection results—Railway line A.
| Structure | Height Adjustment (m) | Threshold (points/m2) | By Manual Survey (Number of Structure) | By Algorithm (Number of Structure) |
|---|---|---|---|---|
| Crossing | 1.48 | 200 | 4 | 5 |
| Left-turnout | 1.48 | 400 | 2 | 2 |
| Right-turnout | 1.48 | 400 | 2 | 2 |
Table 4.
Structure detection results—Railway line B.
| Structure | Height Adjustment (m) | Threshold (points /m2) | By Manual Survey (Number of Structure) | By Algorithm (Number of Structure) |
|---|---|---|---|---|
| Crossing | 1.5 | 200 | 16 | 17 |
| Left-turnout | 1.5 | 400 | 5 | 5 |
| Right-turnout | 1.5 | 400 | 9 | 9 |
Publisher’s Note: MDPI stays neutral with regard to jurisdictional claims in published maps and institutional affiliations. |
© 2020 by the authors. Licensee MDPI, Basel, Switzerland. This article is an open access article distributed under the terms and conditions of the Creative Commons Attribution (CC BY) license (http://creativecommons.org/licenses/by/4.0/).
Share and Cite
MDPI and ACS Style
Karunathilake, A.; Honma, R.; Niina, Y. Self-Organized Model Fitting Method for Railway Structures Monitoring Using LiDAR Point Cloud. Remote Sens. 2020, 12, 3702. https://doi.org/10.3390/rs12223702
AMA Style
Karunathilake A, Honma R, Niina Y. Self-Organized Model Fitting Method for Railway Structures Monitoring Using LiDAR Point Cloud. Remote Sensing. 2020; 12(22):3702. https://doi.org/10.3390/rs12223702
Chicago/Turabian StyleKarunathilake, Amila, Ryohei Honma, and Yasuhito Niina. 2020. "Self-Organized Model Fitting Method for Railway Structures Monitoring Using LiDAR Point Cloud" Remote Sensing 12, no. 22: 3702. https://doi.org/10.3390/rs12223702
Note that from the first issue of 2016, this journal uses article numbers instead of page numbers. See further details here.