Long-Term Variation of Black Carbon Absorption Aerosol Optical Depth from AERONET Data over East Asia


1
Division of Earth Environmental System Science, Pukyong National University, Busan 48513, Korea
2
Department of Environmental Engineering, Pukyong National University, Busan 48513, Korea
*
Author to whom correspondence should be addressed.
Remote Sens. 2020, 12(21), 3551; https://doi.org/10.3390/rs12213551
Submission received: 31 August 2020
/
Revised: 4 October 2020
/
Accepted: 28 October 2020
/
Published: 30 October 2020
(This article belongs to the Special Issue Remote Sensing of Aerosols and Gases in Cities)
Abstract
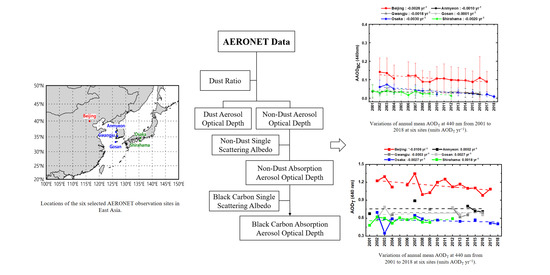
:Absorption aerosol optical depth induced by black carbon (AAODBC) was retrieved using the depolarization ratio and single scattering albedo provided by the Aerosol Robotic Network (AERONET) inversion products over East Asia. Our analysis considered AERONET data from six sites in East Asia that are mostly affected by anthropogenic pollution, black carbon (BC) emissions, and natural mineral dust, during the period 2001–2018. We identified a rapid reduction in total aerosol optical depth (AODT) of −0.0106 yr−1 over Beijing, whereas no considerable trend was observed at the Korean and Japanese sites. The long-term data for AAODBC showed decreasing trends at all sites. We conclude that successful emission control policies were the major underlying driver of AODT and AAODBC reductions over East Asia, particularly in China, during the study period. Values of the AAODBC/AODT ratio revealed that, although these policies were successful, the Chinese government needs to undertake stricter measures toward reducing BC emissions. We found that AAODBC follows seasonal trends, peaking in the colder months. This suggests that in East Asia, particularly in China, domestic coal burning is still of concern.
1. Introduction
Atmospheric aerosols can greatly affect the global climate by scattering and absorbing solar radiation and influencing cloud formation [1,2]. Population growth, urbanization, and economic development have considerably increased anthropogenic emissions of aerosols [3]. The incomplete combustion of fossil fuels, biomass, and carbon-containing substances emits black carbon (BC) aerosol particles, particularly in developing regions such as East Asia [4], which is one of the main source regions of not only BC and other anthropogenic pollutants, but also natural mineral dust [5,6,7]. China, in particular, is a major source of BC because of its large population and high fossil fuel consumption [8]. Indirect effects of BC include changing the microphysical properties of clouds, and its direct effects include temperature increase through light absorption [9,10,11]. High atmospheric aerosol levels over East Asia, including BC, affect not only local air quality but also the radiative balance of downwind areas [12]. Despite the availability of global atmospheric aerosol information, there is little data observed for more than 10 years available for BC concentrations in East Asia. Furthermore, there is no record of the impact of BC’s light-absorption on aerosol optical depth (AOD) and its trends over time. The Aerosol Robotic Network (AERONET) is a global network of ground-based sun/sky photometers that provide long term data on aerosols, such as depolarization ratio (DPR), spectral AOD, column single scattering albedo (SSA), particle size distribution, and absorption AOD (AAOD). Overall, AAOD defines the column aerosol loading of light-absorbing particles such as BC, carbon-containing particles, or mineral dust. Calculation of AAOD is complicated when different types of absorbing aerosol are present in a mixed aerosol plume.
Because BC is the main light absorber in the atmosphere, and also affects atmospheric chemical processes and air quality, the quantification of its specific AAOD (AAODBC) is critical [13]. Although several studies have investigated the contribution of BC to aerosol light absorption from AERONET columnar observations [14], few studies have determined AAODBC and its optical properties. Schuster et al. [15] derived the BC concentrations and the specific absorption from AERONET measurements to describe the radiance field and absorption optical thickness. Russell et al. [13] applied SSA, absorption Ångström exponent, and AAOD from AERONET data to identify the individual shares of BC, mineral dust, and organic matter in the total AAOD. Shin et al. [14] discussed the contribution of BC-related absorption to the non-dust AAOD. To the best of our knowledge, this is the first study in which the contribution of AAODBC to the total AOD has been studied over a period of 18 years in East Asia.
In this study, we retrieved the AAODBC from AERONET version 3 level 2.0 data using DPR and SSA to identify its long-term trends and seasonal variations in East Asia. The work is beneficial to the analysis of areas of (and downwind of) deserts with notable contributions of dust to AAOD. Section 2 describes our methodology; Section 3 provides the results; Section 4 describes the discussion; Section 5 presents a summary and conclusion of this study.
2. Materials and Methods
2.1. AERONET Version 3 Data and Sites
AERONET sun/sky radiometers measure direct solar and sky radiation. The measurements are analyzed automatically by the AERONET inversion algorithm [16,17]. All AERONET data are stored in an online database (http://aeronet.gsfc.nasa.gov, AERONET, 2019) and the measurements are downloadable. AERONET instruments measure AOD at 440, 670, 870, and 1020 nm. In the absence of cloud contamination, the AOD uncertainty is estimated as 0.01 to 0.02 depending on wavelength. Additionally, the calibrated sky radiance measurements have uncertainties below 5%. AERONET inversion code provides aerosol optical properties in the total atmospheric column derived from the direct and diffuse radiation measured by AERONET sun/sky radiometers. AERONET version 3 level 2.0 inversion products provide DPRs at 440, 675, 870, and 1020 nm as well as AOD and other properties such as SSA. In addition, the outputs of inversion products provide estimates for random and possible systematic errors resulted from possible biases in measurements for most of the retrieved characteristics. SSA is used to determine the share of scattered light and the fraction of AOD related to light absorption (i.e., AAOD). The uncertainty in SSA was reported to be of the order of 0.03 [16].
This study selected AERONET sites with the following considerations. First, the sites must measure the optical properties of atmospheric aerosols generated in East Asia. Second, they must show variations in aerosol optical characteristics due to the mixing of dust and anthropogenic aerosol during long-range transport. Third, the sites should be able to provide long-term data on the variations in optical properties for at least 10 years. Figure 1 shows the locations of the six selected AERONET sites: one in China (Beijing, 39.977°N 116.381°E), three in Korea (Anmyeon, 36.539°N 126.330°E; Gwangju 35.228°N 126.843°E; and Gosan, 33.292°N 126.162°E), and two in Japan (Osaka, 34.651°N 135.591°E; and Shirahama, 33.693°N 135.357°E). Urbanization and industrialization in East Asia, specifically in China, have led to a vast emission of anthropogenic aerosols in this region. East Asian dust storms originating in the Asian desert also raise dust particles into the atmosphere. Readings at the selected sites are influenced by both anthropogenic (e.g., those from fossil fuels and biomass burning) and natural (e.g., mineral dust) aerosols [18]. The AERONET inversion algorithm is only performed for observations with AODs larger than 0.4 at 440 nm [17]. In this study, the data on particle linear DPR (PLDR), SSA, and size distribution is derived from the AERONET (level 2.0 (quality-assured), version 3) inversion products and the respective processing algorithms from 2001 to 2018 at the selected sites (http://aeronet.gsfc.nasa.gov, AERONET, 2019).
2.2. AAODBC Retrieval Methodology
Most aerosols in the atmosphere scatter light and absorb it in different levels, but BC has a strong light absorbing ability [19,20,21,22], as do dust particles [23,24,25,26,27]. In the absence of dust particles, BC is mainly responsible for the light absorbed by atmospheric aerosols, and BC’s specific AAOD (AAODBC) can be calculated simply from the SSA:
where, λ indicates wavelength. However, in the presence of dust particles, their effect must be separated to calculate AAODBC.
AAODBC,λ = (1 − SSAλ) × AODλ
Previous researchers have found that the DPR measured by LIDAR can be used to distinguish between dust and pollution (non-dust) particles [28,29,30]. Noh et al. [31] confirmed that the DPR at 532 nm measured by LIDAR, and that at 1020 nm retrieved from AERONET data, were highly correlated. Therefore, we applied the method of Shin et al. [14] to separate dust and non-dust particles using the DPR at 1020 nm from AERONET data, and consequently calculate AAODBC using only the SSA of pollution particles.
The particle linear DPR can be used as a parameter to obtain insight into the variation of optical and microphysical properties of particles. The AERONET version 3 level 2.0 inversion product provides particle linear DPRs () at 440, 675, 870, and 1020 nm. Shin et al. [32] showed that any value of at 1020 nm greater than 0.30 represents pure Asian dust particles, while values below 0.02 indicate Asian anthropogenic pollution particles [33]. Values between these two thresholds (labeled and , respectively) represent a mixture of dust and other aerosols such as anthropogenic pollution and non-dust particles. Therefore, the can be used to distinguish the share of pure dust and non-dust in a mixed plume [14,29]. The dust ratio (Rd) was first calculated here using values at 1020 nm from AERONET data. Shimizu et al. (2004) gave the following calculation for Rd [28]:
Noh et al. [31] concluded that the high correlation of at 1020 nm from AERONET version 3 inversion data, and that from LIDAR measurements, means that the AERONET data can be used to assess the presence of dust particles. The value of Rd allows the total AOD (AODT) at 1020 nm to be separated into components for dust (AODD) and non-dust (AODnd):
where the subscript numbers denote the wavelength in nm. To convert AODD,1020 to corresponding values for other wavelengths, we used the Ångström exponent of pure Asian dust (åD = 0.14) [30]:
which can be used to calculate AODnd,λ:
AODD,1020 = AODT,1020 × Rd,1020
AODnd,λ = AODT,λ − AODD,λ
Dark mineral phases like iron oxides influence the visible-light absorption of mineral dust [34,35,36], while BC is the main anthropogenic light absorber across the entire solar spectrum, especially in the mid-visible range [37,38]. The SSA spectral curvature can provide further information on the composition of aerosol mixtures. The SSA increases with increasing wavelength for pure mineral dust, but decreases for anthropogenic pollution or carbon-containing particles [39]. As dust and BC both absorb light in the visible range (around 440 nm), the total SSA (SSAT) can be split into components for dust (SSAD) and non-dust (SSAnd) as follows:
where SSAnd is derived as
The spectral SSA values for pure Asian dust particles at 440, 675, 870, and 1020 nm have been calculated as 0.94, 0.98, 0.98, and 0.98, respectively, using data for a source region of Asian dust; Dunhuang in Western China (40.49°N 94.95°E) [31].
From SSAnd, the share of light scattered by coarse and fine non-dust particles, the non-dust AAOD can be found:
Since aerosol light absorption in the atmosphere is dominated by BC, we assume that in the absence of dust particles the light absorption by pollution (non-dust) is mostly due to BC. As BC is not an ideal light absorber, its SSA is not equal to 0. To estimate the BC-related AAOD (AAODBC) we used the SSA of BC (SSABC,λ):
2.3. Statistical Analysis
To the better interpretation of the AAODBC trends, the average data points for each year at all sites were subjected to a one-way ANOVA test using SPSS statistics application (IBM SPSS Statistics, USA) to compare means at p < 0.05.
3. Results
3.1. Total Aerosol Optical Depth (AODT) and AAODBC
Table 1 summarizes the daily mean values of total and seasonal variation of AODT, AAODBC, and AAODBC ratio (the ratio of AAODBC/AODT, i.e., AOD > 0.4) at 440 nm for the six selected stations over the period 2001–2018.
The highest values of AODT in Table 1 are for Beijing, whereas the Japanese sites showed the lowest (almost half those for Beijing). Considering seasonal variation, AODT was highest in summer at most sites, but not at Anmyeon and Gosan where it was higher in winter and fall, respectively. Beijing showed the highest total AAODBC and AAODBC ratio during all seasons, with values greatest in winter. All the Korean and Japanese sites showed roughly similar values of AAODBC (0.02–0.04), which were clearly less than those for Beijing (0.09–0.13).
Figure 2 shows the 18-year (2001–2018) variations of the annual mean AODT at 440 nm for each site. Beijing showed steeply declining values (−0.0106 AODT yr−1) during the study period, whereas no considerable trends emerged for the Korean and Japanese sites, which showed annual variations between −0.0003 and 0.0027 AODT yr−1. Overall, there is some seasonal variability in AOD, which is generally highest in summer (see Table 1).
Figure 3 presents the annual variation in AAODBC at the six sites. Similar to AODT in Figure 2, Beijing showed the highest annual mean AAODBC, which was approximately double that at each of the Korean and Japanese sites. Unlike the annual variation of AODT, AAODBC declined annually, not only in Beijing but at all sites, with the greatest annual decline (−0.0030 AAODBC yr−1) observed at Osaka. The next greatest annual decline of −0.0026 AAODBC yr−1 was at Beijing, where the highest AAODBC of approximately 0.14 in 2002 declined to 0.09 in 2017. The annual mean AAODBC at Osaka, Shirahama, and Gosan peaked in 2003. The lack of continuous observations at the Korean sites prevented observation of any coherent trend for AAODBC, but AAODBC declined overall at these sites from 2001 to 2018.
Figure 4 shows the time series of seasonal mean AAODBC and its trends for the six sites. There is a distinct seasonal trend, with higher values in winter and lower values in summer. Most sites showed annual decreases of AAODBC; the exceptions, Anmyeon and Gwangju, showed increases in winter values of 0.0015 and 0.0006 AAODBC yr−1, respectively.
3.2. BC Ratio
The variations of the annual ratios of AAODBC to AODT and AAODBC to AODnd at 440 nm and their trends for 2001–2018 are shown in Figure 5a,b, respectively. Both ratios show a long-term declining trend at all sites. As mentioned in Section 3.1, Beijing showed the greatest declining trend for the annual variation of AODT and the second greatest for AAODBC (after Osaka), with annual declines of −0.0106 and −0.0026 yr−1, respectively (Figure 2 and Figure 3). The results in Figure 5 show that Beijing had the smallest decreases in the annual ratios of both AAODBC/AODT (after Gosan and Anmyeon) and AAODBC/AODnd from 2001 to 2018. Therefore, although Beijing had sharp drops in AAODBC and AODT, its ratios of AAODBC/AODT and AAODBC/AODnd decreased only slightly. On the other hand, for the Korean and Japanese sites, although AODT remained largely steady, and decreases (in Osaka and Gwangju) were less than those in Beijing, rapid decreases in AAODBC led the annual ratios of AAODBC/AODT and AAODBC/AODnd to fall more quickly than those for Beijing.
Figure 6 compares the seasonal variation of the annual AAODBC/AODT ratio (BC ratio) at 440 nm. It was higher during winter, and lower in summer (below 0.12) at all sites. The observed variation indicates a larger contribution of BC to AAOD in fall and winter. The BC ratio declined at all sites, other than Anmyeon (during spring and winter). The greatest rate of decrease at −0.0100 was at Osaka in the winter.
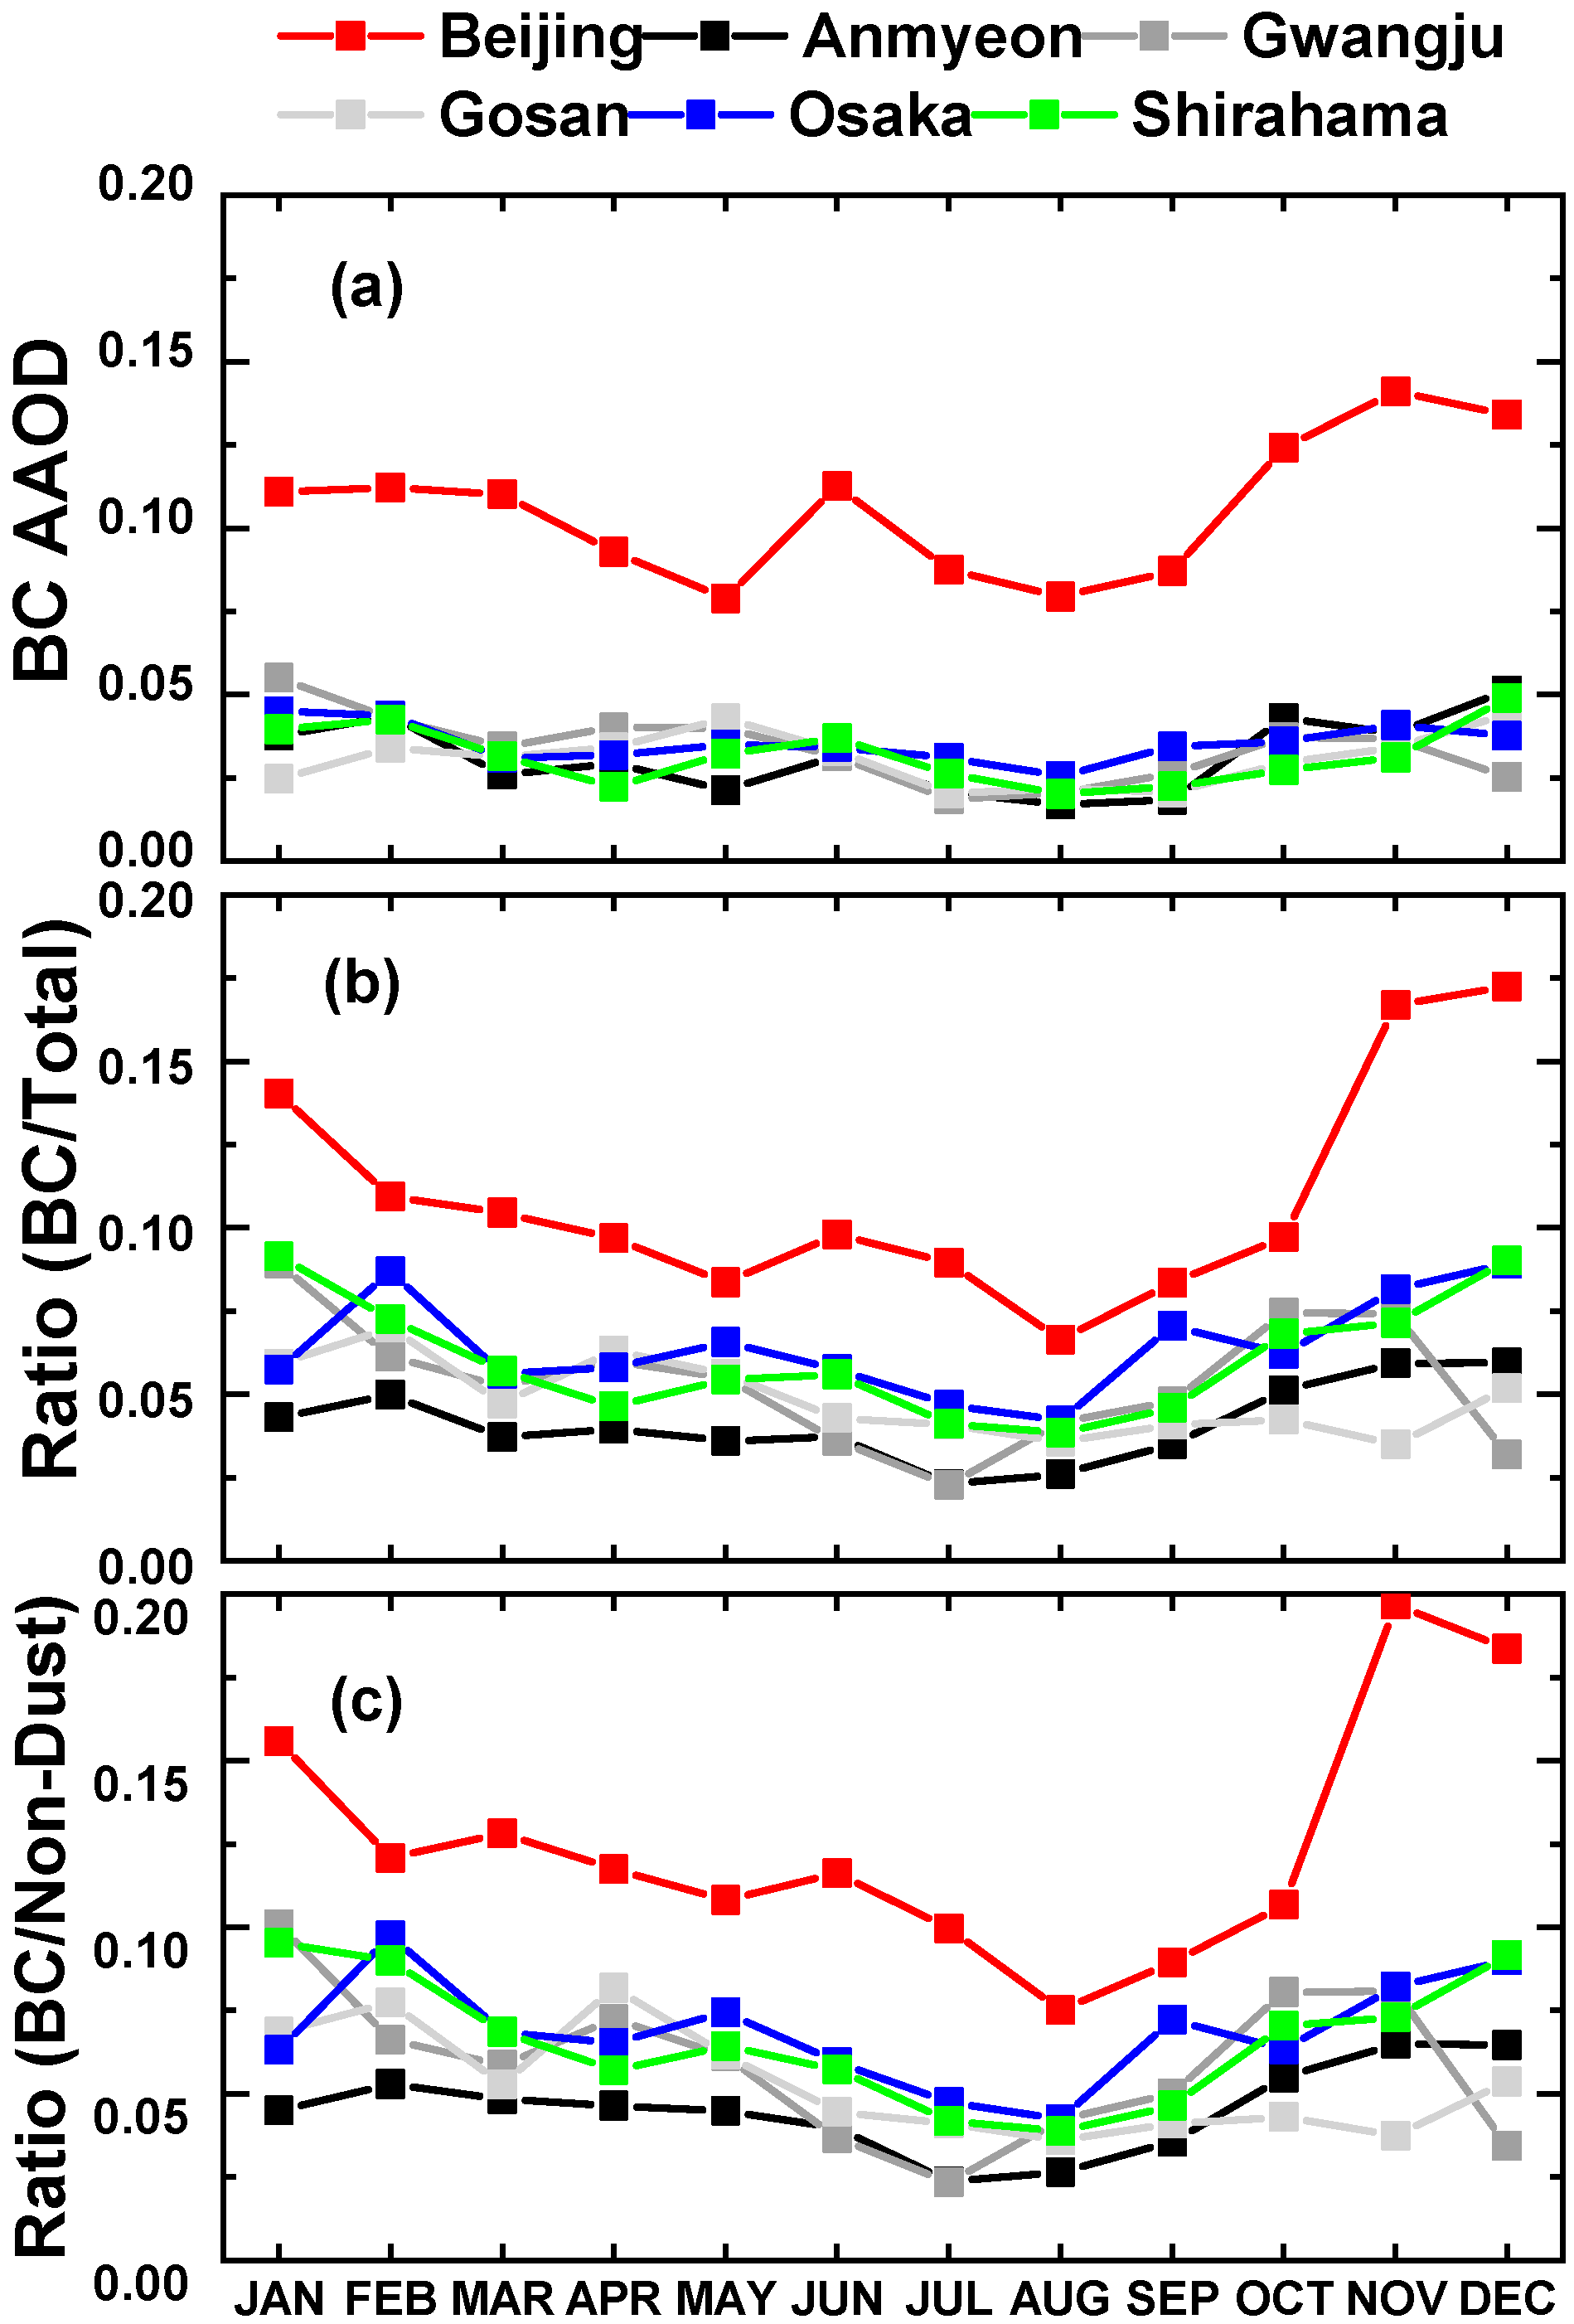
Figure 7b presents the monthly variation of BC ratio from 2001 to 2018. The highest values were in Beijing, peaking in November, December, and January; the lower values were in August. The next-highest values were at the Japanese sites (Osaka and Shirahama), while the Korean sites showed the lowest BC ratios.
The monthly mean variations of the ratio of AAODBC to AODnd at the six sites are shown in Figure 7c. For Beijing, this ratio increased sharply from October to February, and was lowest in late summer (August).
3.3. Statistical Analysis Results
Since AAODBC trends are the main findings of this study, a one-way ANOVA test was applied to the average data sets at all six sites to further test that if the trends are statistically significant or not. Table 2 summarizes the statistical results of the One-way ANOVA. Among all the selected sites, Beijing and Anmyeon with the p-values of 0.128 and 0.358 did not show a significant difference between the average data points.
4. Discussion
According to Figure 2, Beijing showed steeply declining values of AODT during the study period, whereas no considerable trends were found for the Korean and Japanese sites. Yu et al. [43] and Kim et al. [44] reported similar seasonal variations of AOD in Beijing and Gosan, respectively. The higher values and high declining trend of AOD in China have been reported previously [45,46,47]. Yu et al. [48] compared AOD values in East Asia during 2001–2005, and found higher values at Chinese sites than at Korean or Japanese sites. Khan et al. [49] reported a decreasing trend in AOD at 440 nm over the North China Plain, with Beijing showing the highest values from 2001 to 2018; however, some studies have reported that the annual mean AOD has remained constant or increased over Northeast Asia and China [50,51,52]. Nam et al. [50] found the highest annual mean AOD at North China sites and lower values at Korean and Japanese sites. A significantly increasing trend in AOD has been found in North and Northeast China, but no significant trends were identified at sites in Korea (Gwangju) and Japan (Shirahama and Osaka) between 2004 and 2015.
The higher AODs in China and its downwind regions during spring are attributed to dust plumes transported from deserts in Mongolia and China, which coincide with increasing local sources during this season [53,54]. In summer, AOD peaks at most sites due to increased moisture and enhanced formation of secondary aerosols [55,56,57]. Beijing’s higher annual mean AOD in comparison to other sites is mainly due industrial pollution and its combination with mineral dust and other anthropogenic particles [58]. This is also associated with high emissions of different chemical species, such as burning fossil fuel (including coal) for transportation, industry, and domestic heating during cold seasons [59]. Furthermore, the declining trend of AOD in Beijing can be explained by improving air pollution control measures and the implementation of strict governmental policies on air pollution [60,61]. The lower variation of annual mean AOD at Korean and Japanese sites is attributable to lower air pollution emissions in comparison to China. The lack of continuous observations and limited data for the Korean and Japanese sites is another possible reason for their lower AOD values.
In Figure 3, Beijing showed the highest annual mean AAODBC; besides, AAODBC declined overall at the Korean and Japanese sites from 2001 to 2018. The trends for Anmyeon and Beijing are not statistically significant; however, the higher values of AAODBC were found in the Beijing site. This non-significant trend can result from the higher emissions of BC over China. In the case of the Anmyeon site, the non-significant trend might be due to the few observations and insufficient data sets over this site. Sun et al. [62] found decreasing trends in both AAODBC and AOD from 2008 to 2017 in China. The variation of AAOD in China from 1980 to 2017 was mostly attributed to the variation of AAODBC. Other studies have also reported declining trends of BC concentration in Beijing, which may explain the declining trend of AAODBC in this region [8,21]. The reduction of BC emissions in China appears to result from governmental clean air actions (e.g., Regional Emission inventory in Asia (REAS) version 3.1 and Multi-resolution Emission Inventory version 1.3 (MEIC1.3)), reduction of coal combustion (both industrial and residential), traffic limitation, and gasoline consumption restrictions [63].
Cho et al. [64] compared the contribution of BC to carbonaceous aerosol AAOD at background sites (Gosan, Anmyeon, Shiraham, Fukuoka, and Baengnyeong) and polluted urban regions (Beijing, Gwangju, Osaka, Xianghe, Xuzhou, Taihu, Hongkong, Seoul, and Chiba). They found that BC made a greater contribution to carbonaceous aerosol AAOD in polluted urban regions than in the background cities. Our study found the highest annual mean AAODBC in China, the largest source of BC in East Asia [65,66]. Liquid fuels such as kerosene, gasoline, and diesel have been found to contribute significantly to BC pollution in Beijing in recent years [67]. The high AAODBC in China is mainly due to carbon-containing pollutants emitted from industry and other human activities associated with the country’s growing economy and population density over the last three decades. Transportation also accounts for significant emissions of BC in Beijing and the neighboring regions. We found lower values of AAODBC in rural and coastal regions, such as Anmyeon, Gosan, and Shirahama, compared with metropolitan cities such as Beijing, Osaka, and Gwangju. This is related to lower BC emissions from diesel engines for transportation, industrial, and residential use.
According to Figure 4, there is a distinct seasonal trend for AAODBC, with higher values in winter and lower values in summer. The BC emissions from residential heating accounted for the generally higher winter values of AAODBC. The highest mean AAODBC (approximately 0.17) was observed at Beijing in winter 2002; this value had dropped to 0.05 by summer 2016. The mean values in Korea and Japan were consistently lower (less than 0.10) than those observed in China over all seasons. Several studies have reported similar seasonal trends of BC concentrations (lowest in summer, highest in winter) at Chinese sites [68,69]. Zhuang et al. [70] found considerable seasonal variations in BC emissions over East Asia, predominantly driven by changing domestic and residential emissions. Kang et al. [71] attributed increased AAOD over the North China Plain and the Korean Peninsula during winter to seasonal increases of BC and organic carbon (OC) emissions. Incomplete combustion of fossil fuel for domestic heating is a significant source of BC and OC [72], and the strong light-absorbing properties of BC partly explain the increased AAODBC during winter.
Figure 5a,b shows the variations of the annual ratios of AAODBC to AODT and AAODBC to AODnd at 440 nm and their trends for 2001–2018, respectively. The AAODBC in Japan and Korea fell more greatly or more quickly than in Beijing, despite AODT remaining stable at those sites. We attributed the difference in the ratios of AAODBC/AODT and AAODBC/AODnd between Beijing and the Korean and Japanese sites to Beijing’s lower and/or slower reduction in BC emissions during the study period. Figure 5b shows that Beijing’s ratio of AAODBC/AODnd declined at a rate of 0.0008 yr−1, the lowest among the six sites. Hence, it can be concluded that Beijing’s decrease in BC emissions relative to the other pollution particles was lower than that at the Korean and Japanese sites. This might be attributable to the delayed implementation of pollution control or fuel substitution policies, or a shift of, or even increase in, residential coal use and emissions from vehicles burning liquid fuel in Beijing compared to the Korean and Japanese sites. In other words, although BC emission control policies in China seem to have been successful during the past 18 years, BC still needs to be further reduced.
The ratio of AAODBC/AODnd showed an almost identical annual variation to the ratio of AAODBC/AODT in the Korean and Japanese sites. Polluted urban regions, such as Osaka, showed higher AAODBC/AODnd ratios during the study period than background cities, such as Anmyeon and Gosan, owing to higher BC concentrations. Another distinctive feature of Figure 5 is that Beijing generally had the highest values for both annual ratios from 2001 to 2018 (except for 2003). Beijing’s severe urban haze that contains notable amounts of BC may account for its high AAODBC/AODT ratio. China has been reported to emit nearly a quarter of global anthropogenic BC due to its high usage of coal, oil, and biofuel [73,74].
Figure 6 represents that the seasonal variation of the annual AAODBC/AODT ratio (BC ratio) at 440 nm was higher during winter, and lower in summer at all sites. The common trend in BC ratio across the sites suggests similar reductions in BC emissions associated with the implementation of emission control measures over East Asia. A seasonal trend with summer minima and winter maxima was superimposed on this downward trend at all sites (except for Anmyeon). Regardless of the seasonal variation, Beijing showed the highest BC ratios as it had the highest BC emissions among the selected sites. Due to a lack of long-term regional-scale observational data, no consistent trend was identifiable for the Korean sites specifically in winter, but Gwangju had higher BC ratios than the other Korean sites (Anmyeon and Gosan) during all seasons. This is connected to Gwangju being a metropolitan city and a regional industrial center, with much coal-burning and other anthropogenic emissions that negatively affect air quality. Among the Japanese sites, Osaka had a higher BC ratio than Shirahama. Osaka is Japan’s second largest urban area and has contributed greatly to Japan’s economy and rapid industrialization over recent decades, which may explain its high BC ratio. Note that in addition to local emissions, the Korean and Japanese sites might be affected by aerosol loads transported from China by strong westerly winds [75].
According to Figure 7b, the monthly variation of BC ratio represents the highest values in Beijing, peaking in November, December, and January, and the lower values in August from 2001 to 2018. Summers in Beijing are rainy, and account for about 70% of the city’s rainfall. The frequent rain probably lowered the concentration of BC, and consequently its AAOD, over Beijing in summer. The BC sources from October to March in Beijing are unlikely to be forest fires because of the cold weather. The increased BC ratio in this period was instead attributed to changes in major emission sources, specifically residential emissions. Qin et al. [67] suggested that transportation is the dominant emission source of BC in Beijing, with similarly high emissions in all seasons, while residential BC emissions greatly increase in winter. The Korean and Japanese sites showed lower BC ratios (below 0.10) than Beijing. The limited observation data for the Korean and Japanese sites may have resulted in them showing lower BC ratios. The highest values were in cold seasons (October to March), and the lowest values were during warmer seasons (June to September).
Figure 7c shows that the monthly mean variations of the ratio of AAODBC to AODnd increased sharply from October to February, and was lowest in late summer (August) for Beijing. This suggests a higher contribution of BC to AAOD during the colder months (November to January) than at other times of the year. The average ratio of AAODBC to AODnd at 440 nm during 2001–2018 varied between 0.10 and 0.02 at the Korean and Japanese sites, with the Japanese sites showing higher values than those in Korea. Values were highest in December and January, and lowest in July and August. The residential sector was likely the main reason the ratio of AAODBC to AODnd increased during the colder months over these regions.
It is worth noting that in this study some errors arise from SSAD and SSABC. As was mentioned in the materials and methods section, the value of 0.94 was used for SSA of East Asian dust at 440 nm [31], while in some other studies the value of 0.92 was applied for SSAD over Korea sites [48]. Besides, the value of 0.25 was applied for SSABC at 440 nm; however, in some other studies, this value was reported to be 0.25 ± 0.13 [14]. In this study, the value of 0.25 ± 0.13 for SSABC can cause negligible changes in AAODBC values.
5. Conclusions
The long-term results for AODT show that Beijing had the highest values, but its values are decreasing. The lower values in Korea and Japan showed no significant trend. This suggests that Beijing had higher loads of anthropogenic emissions from transportation, residential, and industrial sectors, which combined with naturally occurring mineral dust. Our analysis of AAODBC revealed a decrease at all sites from 2001 to 2018, and the highest values were in Beijing. The AAODBC varied seasonally, being greatest in winter and lowest in summer due to seasonal differences in BC emissions. Comparison of the annual ratios of AAODBC/AODT and AAODBC/AODnd and their trends over the selected sites showed that Beijing had the lowest rate of decrease for both ratios, despite it showing the greatest rate of decrease for annual variation of AODT and the second greatest for AAODBC (after Osaka). The annual ratios of AAODBC/AODT and AAODBC/AODnd in the Korean and Japanese sites decreased more rapidly than those in Beijing, despite these sites showing largely steady AODT, because AAODBC decreased. This suggests that, although BC emissions have reduced over China during the past 18 years, further reductions are needed. The monthly variations of AAODBC, and the ratios of AAODBC/AODT and AAODBC/AODnd increased during the cold months and in June, because of elevated BC emissions for domestic heating and biomass burning, respectively. Overall, this study is a valuable contribution, and particularly useful for the analysis of regions with high BC emissions that mix with desert dust and anthropogenic pollutants to affect downwind areas.
Author Contributions
Conceptualization; Y.N., Data curation; N.D. and Y.N., Formal analysis; Y.N., Methodology; Y.N.; Resources; Y.N., Software; S.J., Writing—original draft; N.D. All authors have read and agreed to the published version of the manuscript.
Funding
This work was supported by the National Research Foundation of Korea (NRF). Funding was provided by the Ministry of Science and ICT (MSIT) and Ministry of Education (MOE), Republic of Korea (grant No. 2019M3E7A1113103).
Acknowledgments
We would like to thank the principal investigators of the AERONET sites used in this work for maintaining their instruments and providing their data to the community.
Conflicts of Interest
The authors declare no conflict of interest.
Data Availability
The data used in this study are freely available through the AERONET portal at https://aeronet.gsfc.nasa.gov/.
References
- Yuan, Y.; Huang, X.; Shuai, Y.; Mao, Q. Study on the Influence of Aerosol Radiation Balance in One-Dimensional Atmospheric Medium UsingPn-Approximation Method. Math. Probl. Eng. 2014, 2014, 1–9. [Google Scholar] [CrossRef] [Green Version]
- Hansson, H.C.; Bhend, J. Causes of regional change-Aerosols. In Second Assessment of Climate Change for the Baltic Sea Basin, 2nd ed.; Bolle, H.J., Menenti, M., Vesuvio, S.S.A., Rasool, I., Eds.; Springer: New York, NY, USA, 2015; Volume 6, pp. 441–452. [Google Scholar]
- Zhong, S.; Qian, Y.; Sarangi, C.; Zhao, C.; Leung, R.; Wang, H.; Yan, H.; Yang, T.; Yang, B. Urbanization Effect on Winter Haze in the Yangtze River Delta Region of China. Geophys. Res. Lett. 2018, 45, 6710–6718. [Google Scholar] [CrossRef]
- Bao, K.; Shen, J.; Wang, G.; Gao, C. Anthropogenic Black Carbon Emission Increase during the Last 150 Years at Coastal Jiangsu, China. PLoS ONE 2015, 10, e0129680. [Google Scholar] [CrossRef] [Green Version]
- Tian, P.; Zhang, L.; Ma, J.; Tang, K.; Xu, L.; Wang, Y.; Cao, X.; Liang, J.; Ji, Y.; Jiang, J.H.; et al. Radiative absorption enhancement of dust mixed with anthropogenic pollution over East Asia. Atmos. Chem. Phys. Discuss. 2018, 18, 7815–7825. [Google Scholar] [CrossRef] [Green Version]
- Wang, R.; Tao, S.; Wang, W.; Liu, J.; Shen, H.; Shen, G.; Wang, B.; Liu, X.; Li, W.; Huang, Y.; et al. Black Carbon Emissions in China from 1949 to 2050. Environ. Sci. Technol. 2012, 46, 7595–7603. [Google Scholar] [CrossRef]
- Peng, J.; Hu, M.; Guo, S.; Du, Z.; Zheng, J.; Shang, D.; Zamora, M.L.; Zeng, L.; Shao, M.; Wu, Y.-S.; et al. Markedly enhanced absorption and direct radiative forcing of black carbon under polluted urban environments. Proc. Natl. Acad. Sci. USA 2016, 113, 4266–4271. [Google Scholar] [CrossRef] [Green Version]
- Ni, M.; Huang, J.; Lu, S.; Li, X.; Yan, J.; Cen, K. A review on black carbon emissions, worldwide and in China. Chemosphere 2014, 107, 83–93. [Google Scholar] [CrossRef]
- Zhang, A.; Wang, Y.; Zhang, Y.; Weber, R.J.; Song, Y.; Ke, Z.; Zou, Y. Modeling the global radiative effect of brown carbon: A potentially larger heating source in the tropical free troposphere than black carbon. Atmos. Chem. Phys. Discuss. 2020, 20, 1901–1920. [Google Scholar] [CrossRef] [Green Version]
- Hansen, J.; Sato, M.; Ruedy, R.; Lacis, A.; Oinas, V. Global warming in the twenty-first century: An alternative scenario. Proc. Natl. Acad. Sci. USA 2000, 97, 9875–9880. [Google Scholar] [CrossRef] [Green Version]
- Jacobson, M.Z. Strong radiative heating due to the mixing state of black carbon in atmospheric aerosols. Nat. Cell Biol. 2001, 409, 695–697. [Google Scholar] [CrossRef]
- Huang, X.; Ding, A.; Liu, L.; Liu, Q.; Ding, K.; Niu, X.; Nie, W.; Xu, Z.; Chi, X.; Wang, M.; et al. Effects of aerosol–radiation interaction on precipitation during biomass-burning season in East China. Atmos. Chem. Phys. Discuss. 2016, 16, 10063–10082. [Google Scholar] [CrossRef] [Green Version]
- Russell, P.B.; Bergstrom, R.W.; Shinozuka, Y.; Clarke, A.D.; Decarlo, P.F.; Jimenez, J.L.; Livingston, J.M.; Redemann, J.; Dubovik, O.; Strawa, A. Absorption Angstrom Exponent in AERONET and related data as an indicator of aerosol composition. Atmos. Chem. Phys. Discuss. 2010, 10, 1155–1169. [Google Scholar] [CrossRef] [Green Version]
- Shin, S.-K.; Tesche, M.; Müller, D.; Noh, Y. Technical note: Absorption aerosol optical depth components from AERONET observations of mixed dust plumes. Atmos. Meas. Tech. 2019, 12, 607–618. [Google Scholar] [CrossRef] [Green Version]
- Schuster, G.L.; Dubovik, O.; Holben, B.N.; Clothiaux, E.E. Inferring black carbon content and specific absorption from AERONET retrievals. J. Geophys. Res. 2005, 101, D10S17. [Google Scholar] [CrossRef]
- Dubovik, O.; King, M.D. A flexible inversion algorithm for retrieval of aerosol optical properties from sun and sky radiance measurements. Geophys. Res. 2000, 105, 20673–20696. [Google Scholar] [CrossRef] [Green Version]
- Dubovik, O.; Sinyuk, A.; Lapyonok, T.; Holben, B.N.; Mishchenko, M.; Yang, P.; Eck, T.F.; Volten, H.; Munoz, O.; Veihelman, B.; et al. Application of spheroid models to account for aerosol particle non-sphericity in remote sensing of desert dust. J. Geophys. Res. 2006, 111, D11208. [Google Scholar] [CrossRef] [Green Version]
- Shin, S.-K.; Tesche, M.; Noh, Y.; Müller, D. Aerosol-type classification based on AERONET version 3 inversion products. Atmos. Meas. Tech. 2019, 12, 3789–3803. [Google Scholar] [CrossRef] [Green Version]
- Heintzenberg, J. Size-segregated measurements of particulate elemental carbon and aerosol light absorption at remote artic locations. Atoms. Environ. 1982, 16, 2461–2469. [Google Scholar] [CrossRef]
- Bond, T.C.; Doherty, S.J.; Fahey, D.W.; Forster, P.M.; Berntsen, T.; DeAngelo, B.J.; Flanner, M.G.; Ghan, S.; Kaercher, B.; Koch, D.; et al. Bounding the role of black carbon in the climate system: A scientific assessment. J. Geophys. Res. Atmos. 2013, 118, 5380–5552. [Google Scholar] [CrossRef]
- Andreae, M.O.; Gelencsér, A. Black carbon or brown carbon? The nature of light-absorbing carbonaceous aerosols. Atmos. Chem. Phys. Discuss. 2006, 6, 3131–3148. [Google Scholar] [CrossRef] [Green Version]
- Chen, Y.; Schleicher, N.; Fricker, M.; Cen, K.; Liu, X.-L.; Kaminski, U.; Yu, Y.; Wu, X.-F.; Norra, S. Long-term variation of black carbon and PM2.5 in Beijing, China with respect to meteorological conditions and governmental measures. Environ. Pollut. 2016, 212, 269–278. [Google Scholar] [CrossRef]
- Ackerman, A.S.; Toon, O.B.; Stevens, D.E.; Heymsfield, A.J.; Ra-manathan, V.; Welton, E.J. Reduction of tropical cloudiness by soot. Science 2000, 288, 1042–1047. [Google Scholar] [CrossRef] [Green Version]
- Huang, J.; Lin, B.; Minnis, P.; Wang, T.; Wang, X.; Hu, Y.; Yi, Y.; Ayers, J.K. Satellite-based assessment of possible dust aerosols semi-direct effect on cloud water path over East Asia. Geophys. Res. Lett. 2006, 33, L19802. [Google Scholar] [CrossRef] [Green Version]
- Huang, J.; Fu, Q.; Su, J.; Tang, Q.; Minnis, P.; Hu, Y.; Yi, Y.; Zhao, Q. Taklimakan dust aerosol radiative heating derived from CALIPSO observations using the Fu-Liou radiation model with CERES constraints. Atmos. Chem. Phys. 2008, 9, 4011–4021. [Google Scholar] [CrossRef]
- Kim, H.; Kim, J.Y.; Jin, H.C.; Lee, J.Y.; Lee, S.P. Seasonal variations in the light-absorbing properties of water-soluble and insoluble organic aerosols in Seoul, Korea. Atoms. Environ. 2016, 129, 234–242. [Google Scholar] [CrossRef]
- Bi, J.; Huang, J.; Holben, B.; Zhang, G. Comparison of key absorption and optical properties between pure and transported anthropogenic dust over East and Central Asia. Atmos. Chem. Phys. 2016, 16, 15501–15516. [Google Scholar] [CrossRef] [Green Version]
- Shimizu, A.; Sugimoto, N.; Matsui, I.; Arao, K.; Uno, I.; Murayama, T.; Kagawa, N.; Aoki, K.; Uchiyama, A.; Yamazaki, A. Continuous observations of Asian dust and other aerosols by polarization lidars in China and Japan during ACE-Asia. Geophys. Res. Atoms. 2004, 109, D19S17. [Google Scholar] [CrossRef]
- Tesche, M.; Ansmann, A.; Müller, D.; Althausen, D.; Engelmann, R.; Freudenthaler, V.; Groß, S. Vertically resolved separation of dust and smoke over Cape Verde using multi-wavelength Raman and polarization lidars during Saharan Mineral Dust Experiment 2008. Geophys. Res. Atoms. 2009, 114, D13. [Google Scholar] [CrossRef]
- Tesche, M.; Muller, D.; Gross, S.; Ansmann, A.; Althausen, D.; Freudenthaler, V.; Weinzirl, B.; Veira, A.; Petzold, A. Optical and microphysical properties of smoke over Cape Verde inferred from multi-wavelength lidar measurements. TELLUS B Chem. Phys. Meteorol. 2011, 63B, 677–694. [Google Scholar] [CrossRef] [Green Version]
- Noh, Y.; Müller, D.; Lee, K.; Kim, K.; Shimizu, A.; Sano, I.; Park, C.B. Depolarization ratios retrieved by AERONET sun–sky radiometer data and comparison to depolarization ratios measured with lidar. Atmos. Chem. Phys. 2017, 17, 6271–6290. [Google Scholar] [CrossRef] [Green Version]
- Shin, S.K.; Tesche, M.; Kim, K.; Kezoudi, M.; Tatarov, B.; Muller, D.; Noh, Y. On the spectral depolarization and lidar ratio of mineral dust provided in the AERONET version 3 inversion product. Atmos. Chem. Phys. 2018, 18, 12735–12746. [Google Scholar] [CrossRef] [Green Version]
- Burton, S.P.; Vaughan, M.A.; Ferrare, R.A.; Hostetler, C.A. Separating mixtures of aerosol types in airborne High Spectral Resolution Lidar data. Atmos. Meas. Tech. 2014, 7, 419–436. [Google Scholar] [CrossRef] [Green Version]
- Tegen, I.; Hollrig, P.; Chin, M.; Fung, I.; Jacob, D.; Penner, J. Contribution of different aerosol species to the global aerosol extinction optical thickness: Estimates from model results. Geophys. Res. 1997, 102, 23895–23915. [Google Scholar] [CrossRef]
- Sokolik, I.N.; Toon, O.B. Incorporation of mineralogical composition into models of the radiative properties of mineral aerosol from UV to IR wavelengths. Geophys. Res. 1999, 104, 9423–9444. [Google Scholar] [CrossRef]
- Zhang, X.L.; Wu, G.J.; Zhang, C.L.; Xu, T.L.; Zhou, Q.Q. What is the real role of iron oxides in the optical properties of dust aerosols? Atmos. Chem. Phys. 2015, 15, 12159–12177. [Google Scholar] [CrossRef] [Green Version]
- Moosmuller, H.; Chakrabarty, R.K.; Arnott, W.P. Aerosol light absorption and its measurement: A review. J. Quant. Spectrosc. Radiat. 2009, 110, 844–878. [Google Scholar] [CrossRef]
- Zhu, C.; Cao, J.; Ho, K.; Chen, L.W.A.; Huang, R.; Wang, Y.C.; Li, H.; Shen, Z.; Chow, J.; Waston, J.; et al. The optical properties of urban aerosol in northern China: A case study at Xian. Atoms. Res. 2015, 160, 59–67. [Google Scholar] [CrossRef]
- Noh, Y.; Lee, K.; Kim, K.; Shin, S.K.; Muller, D.; Shin, D.H. Influence of the vertical absorption profile of mixed Asian dust plumes on aerosol direct radiative forcing over East Asia. Atmos. Environ. 2016, 138, 191–204. [Google Scholar] [CrossRef] [Green Version]
- Haywood, J.M.; Ramaswamy, V. Global sensitivity studies of the direct radiative forcing due to anthropogenic sulfate and black carbon aerosols. J. Geophys. Res. 1998, 103, D6. [Google Scholar] [CrossRef]
- Bond, T.C.; Bergstrom, W. Light absorption carbonaceous particles: An investigative review. Aerosol. Sci. Tech. 2007, 40, 27–67. [Google Scholar] [CrossRef]
- Khalizov, A.F.; Xue, H.; Wang, L.; Zheng, J.; Zhang, R. Enhanced light absorption and scattering by carbon soot aerosol internally mixed with sulfuric acid. J. Phys. Chem. A 2009, 113, 1066–1074. [Google Scholar] [CrossRef] [PubMed]
- Yu, X.; Zhu, B.; Zhang, M. Seasonal variability of aerosol optical properties over Beijing. Atmos. Environ. 2009, 43, 4095–4101. [Google Scholar] [CrossRef]
- Kim, S.W.; Choi, I.J.; Yoon, S.C. A multi-year analysis of clear-sky aerosol optical properties and direct radiative forcing at Gosan, Korea (2001–2008). Atoms. Res. 2010, 95, 279–287. [Google Scholar] [CrossRef]
- Provencal, S.; Kishcha, P.; Silva, A.M.D.; Elhacham, E.; Alpert, P. AOD distributions and trends of major aerosol species over a selection of the worlds most populated cities based on the 1st version of NASA’s MERRA aerosol reanalysis. Urban Clim. 2017, 20, 168–191. [Google Scholar] [CrossRef] [PubMed]
- Kim, H.S.; Chung, Y.S.; Kim, J.T. Spatio-temporal variations of optical properties of aerosols in East Asia measured by MODIS and relation to the ground-based mass concentrations observed in central Korea during 2001–2010. J. Atoms. Sci. 2014, 50, 191–200. [Google Scholar] [CrossRef]
- Noh, Y.; Muller, D.; Lee, H.; Lee, K.; Kim, K.; Shin, S. Estimation of radiative forcing by the dust and non-dust content in mixed East Asian pollution plumes on the basis of depolarization ratios measured with lidar. Atoms. Environ. 2012, 61, 221–231. [Google Scholar] [CrossRef]
- Yu, X.; Cheng, T.; Chen, J.; Liu, Y. A comparison of dust properties between China continent and Korea, Japan in East Asia. Atmos. Environ. 2006, 40, 5787–5797. [Google Scholar] [CrossRef]
- Khan, R.; Kumar, K.R.; Zhao, T. The climatology of aerosol optical thickness and radiative effects in southeast Asia from 18-years of ground-based observations. Environ. Pollut. 2019, 254, 113025. [Google Scholar] [CrossRef]
- Nam, J.; Kim, S.W.; Park, R.J.; Park, J.S.; Park, S.S. Changes in column aerosol optical depth and ground-level particulate matter concentration over East Asia. Air Qual. Atoms. Health 2017, 11, 49–60. [Google Scholar] [CrossRef]
- Sogacheva, L.; Leeuw, G.; Rodriguez, E.; Kolmonen, P.; Georgoulias, A.K.; Alexsandri, G.; Kourtidis, K.; Proestakis, E.; Marinou, E.; Amiridis, V.; et al. Spatial and seasonal variations of aerosols over China from two decades of multi-satellite observations- part 1: ATSR (1995–2011) and MODIS C6.1 (2000–2017). Atmos. Chem. Phys. 2018, 18, 11389–11407. [Google Scholar] [CrossRef] [Green Version]
- De Leeuw, G.; Sogacheva, L.; Rodriguez, E.; Kourtidis, K.; Georgoulias, A.K.; Alexandri, G.; Amiridis, V.; Proestakis, E.; Marinou, E.; Xue, Y.; et al. Two decades of satellite observations of AOD over mainland China using ATSR-2, AATSR and MODIS/Terra: Data set evaluation and large-scale patterns. Atmos. Chem. Phys. 2018, 18, 1573–1592. [Google Scholar] [CrossRef] [Green Version]
- Deng, X.; Tie, X.; Zhou, X.; Wu, D.; Zhong, L.; Tan, H.; Li, F.; Huang, X.; Bi, X.; Deng, T. Effects of southeast Asia biomass burning on aerosols and ozone concentrations over the Pearl River Delta (PRD) region. Atoms. Environ. 2008, 42, 8493–8501. [Google Scholar] [CrossRef]
- Qu, W.; Arimoto, R.; Zhang, X.Y.; Zhao, C.H.; Wang, Y.Q.; Sheng, L.F.; Fu, G. Spatial distribution and inter annual variation of surface PM10 concentrations over eighty-six Chinese cities. Atmos. Chem. Phys. 2010, 10, 5641–5662. [Google Scholar] [CrossRef] [Green Version]
- Heald, C.L.; Ridely, D.A.; Kreidenweis, S.M.; Drury, E.E. Satellite observations cap the atmospheric organic aerosol budget. Geophys. Res. Lett. 2010, 37, 24. [Google Scholar] [CrossRef] [Green Version]
- Fu, T.M.; Cao, J.J.; Zhang, X.Y.; Lee, S.C.; Zhang, Q.; Han, Y.M.; Qu, W.J.; Han, Z.; Zhang, R.; Wang, Y.X.; et al. Carbonaceous aerosols in China: Top-down constraints on primary sources and estimation of secondary contribution. Atmos. Chem. Phys. 2011, 11, 28219–28272. [Google Scholar] [CrossRef] [Green Version]
- Liu, Y.; Liu, J.; Tao, S. Inter annual variability of summertime aerosol optical depth over East Asia during 2000-2011: A potential influence from El Nino Southern Oscillation. Environ. Res. Lett. 2013, 8, 044034. [Google Scholar] [CrossRef] [Green Version]
- Chan, C.K.; Yao, X. Air pollution in mega cities in China. Atmos. Environ. 2008, 42, 1–42. [Google Scholar] [CrossRef]
- Liu, Z.; Gao, W.; Yu, Y.; Hu, B.; Xin, J.; Sun, Y.; Wang, L.; Wang, G.; Bi, X.; Zhang, G.; et al. Characteristics of PM2.5 mass concentrations and Chemical species in urban and background areas of China: Emerging results from the CARE_China network. Atmos. Chem. Phys. 2018, 18, 8849–8871. [Google Scholar] [CrossRef] [Green Version]
- Wang, L.; Zhang, F.; Pilot, E.; Yu, J.; Nie, C.; Holdaway, J.; Yang, L.; Li, Y.; Wang, W.; Vardoulakis, S.; et al. Taking action on air pollution control in the Beijing-Tianjin-Hebi (BTH) region: Progress, challenges and opportunities. Int. J. Environ. Res. Public Health 2018, 15, 306. [Google Scholar] [CrossRef] [Green Version]
- Li, J. Pollution Trends in China from 2000 to 2017: A multi-Sensor view from space. Remote Sens. 2020, 12, 208. [Google Scholar] [CrossRef] [Green Version]
- Sun, E.; Xu, X.; Che, H.; Tang, Z.; Gui, K.; An, L.; Lu, C.; Shi, G. Variation in MERRA-2 aerosol optical depth and absorption aerosol optical depth over China from 1980 to 2017. J. Atoms. Sol. Terr. Phys. 2019, 186, 8–19. [Google Scholar] [CrossRef]
- Kanaya, Y.; Yamaji, K.; Miyakawa, T.; Taketani, F.; Zhu, C.; Choi, Y.; Komazaki, Y.; Ikeda, K.; Kondo, Y.; Klimont, Z. Rapid reduction in black carbon emissions from China: Evidence from 2009-2019 observations on Fukue Island, Japan. Atmos. Chem. Phys. 2020, 20, 6339–6356. [Google Scholar] [CrossRef]
- Cho, C.; Kim, S.W.; Lee, M.; Lim, S.; Fang, W.; Gustafsson, O.; Andersson, A.; Park, R.J.; Sheridan, P.J. Observation-based estimates of the mass absorption cross-section of black and brown carbon and their contribution to aerosol light absorption in East Asia. Atmos. Environ. 2019, 212, 65–74. [Google Scholar] [CrossRef]
- Kondo, Y.; Oshima, N.; Kajino, M.; Mikami, R.; Moteki, N.; Takegawa, N.; Verma, R.L.; Kajii, Y.; Kato, S.; Takami, A. Emisiions of black carbon in East Asia estimated from observations at a remote site in the East China Sea. Geophys. Res. 2011, 116, D16201. [Google Scholar] [CrossRef]
- Qin, Y.; Xie, S.D. Spatial and temporal variation of anthropogenic black carbon emissions in China for the period 1980–2009. Atmos. Chem. Phys. 2012, 12, 4825–4841. [Google Scholar] [CrossRef] [Green Version]
- Qin, W.; Zhang, Y.; Chen, J.; Yu, Q.; Cheng, S.; Li, W.; Liu, X.; Tian, H. Variation, sources and historical trend of black carbon in Beijing, China based on ground observation and MERRA-2 reanalysis data. Environ. Pollut. 2019, 245, 853–863. [Google Scholar] [CrossRef]
- Cao, J.J.; Zhu, C.S.; Chow, J.C.; Watson, J.G.; Han, Y.M.; Wang, G.H.; Shen, Z.X.; An, Z.S. Black carbon relationships with emissions and meteorology in Xi’an, China. Atmos. Res. 2009, 94, 194–202. [Google Scholar] [CrossRef]
- Zhuang, B.; Jiang, F.; Wang, T.; Li, S.; Zhu, B. Investigation on the direct radiative effect of fossil fuel black-carbon aerosol over China. Theor. Appl. Climatol. 2010, 104, 301–312. [Google Scholar] [CrossRef]
- Zhuang, B.L.; Chen, H.M.; Li, S.; Wang, T.J.; Liu, J.; Zhang, L.J.; Liu, H.N.; Xie, M.; Chen, P.L.; Li, M.M.; et al. The direct effects of black carbon aerosols from different source sectors in East Asia in summer. Clim. Dyn. 2019, 53, 5293–5310. [Google Scholar] [CrossRef] [Green Version]
- Kang, L.; Chen, S.; Huang, J.; Zhao, S.; Ma, X.; Yuan, T.; Zhang, X.; Xie, T. The spatial and temporal distributions of absorbing aerosols over East Asia. Remote Sens. 2017, 9, 1050. [Google Scholar] [CrossRef] [Green Version]
- Bond, T.C.; Streets, D.G.; Yarber, K.F.; Nelson, S.M.; Woo, J.H.; Klimont, Z. A technology-based global inventory of black and organic carbon emissions from combustion. Geophys. Res. 2004, 109, D14203. [Google Scholar] [CrossRef] [Green Version]
- Granier, C.; Bessagent, B.; Bond, T.; Angiola, A.; Van der gan, H.D.; Frost, G.J.; Heil, A.; Kaiser, J.W.; Kinne, S.; Klimont, Z.; et al. Evolution of anthropogenic and biomass burning emissions of air pollutants at global and regional scales during the 1980–2010 period. Clim. Chang. 2011, 109, 163–190. [Google Scholar] [CrossRef]
- Lamarque, J.F.; Bond, T.C.; Eyring, V.; Granier, C.; Heil, A.; Klimont, Z.; Lee, D.; Liousse, C.; Mieville, A.; Owen, B.; et al. Historical (1850–2000) gridded anthropogenic and biomass burning emissions of reactive gases and aerosols: Methodology and application. Atoms. Chem. Phys. 2010, 10, 7017–7039. [Google Scholar] [CrossRef] [Green Version]
- Yoon, J.E.; Lim, J.H.; Shim, J.M.; Kwon, J.-I.; Kim, I. Spring 2018 Asian Dust Events: Sources, transportation, and potential biogeochemical implications. Atmosphere 2019, 10, 276. [Google Scholar] [CrossRef] [Green Version]
Figure 1.
Locations of the six selected AERONET observation sites in East Asia.
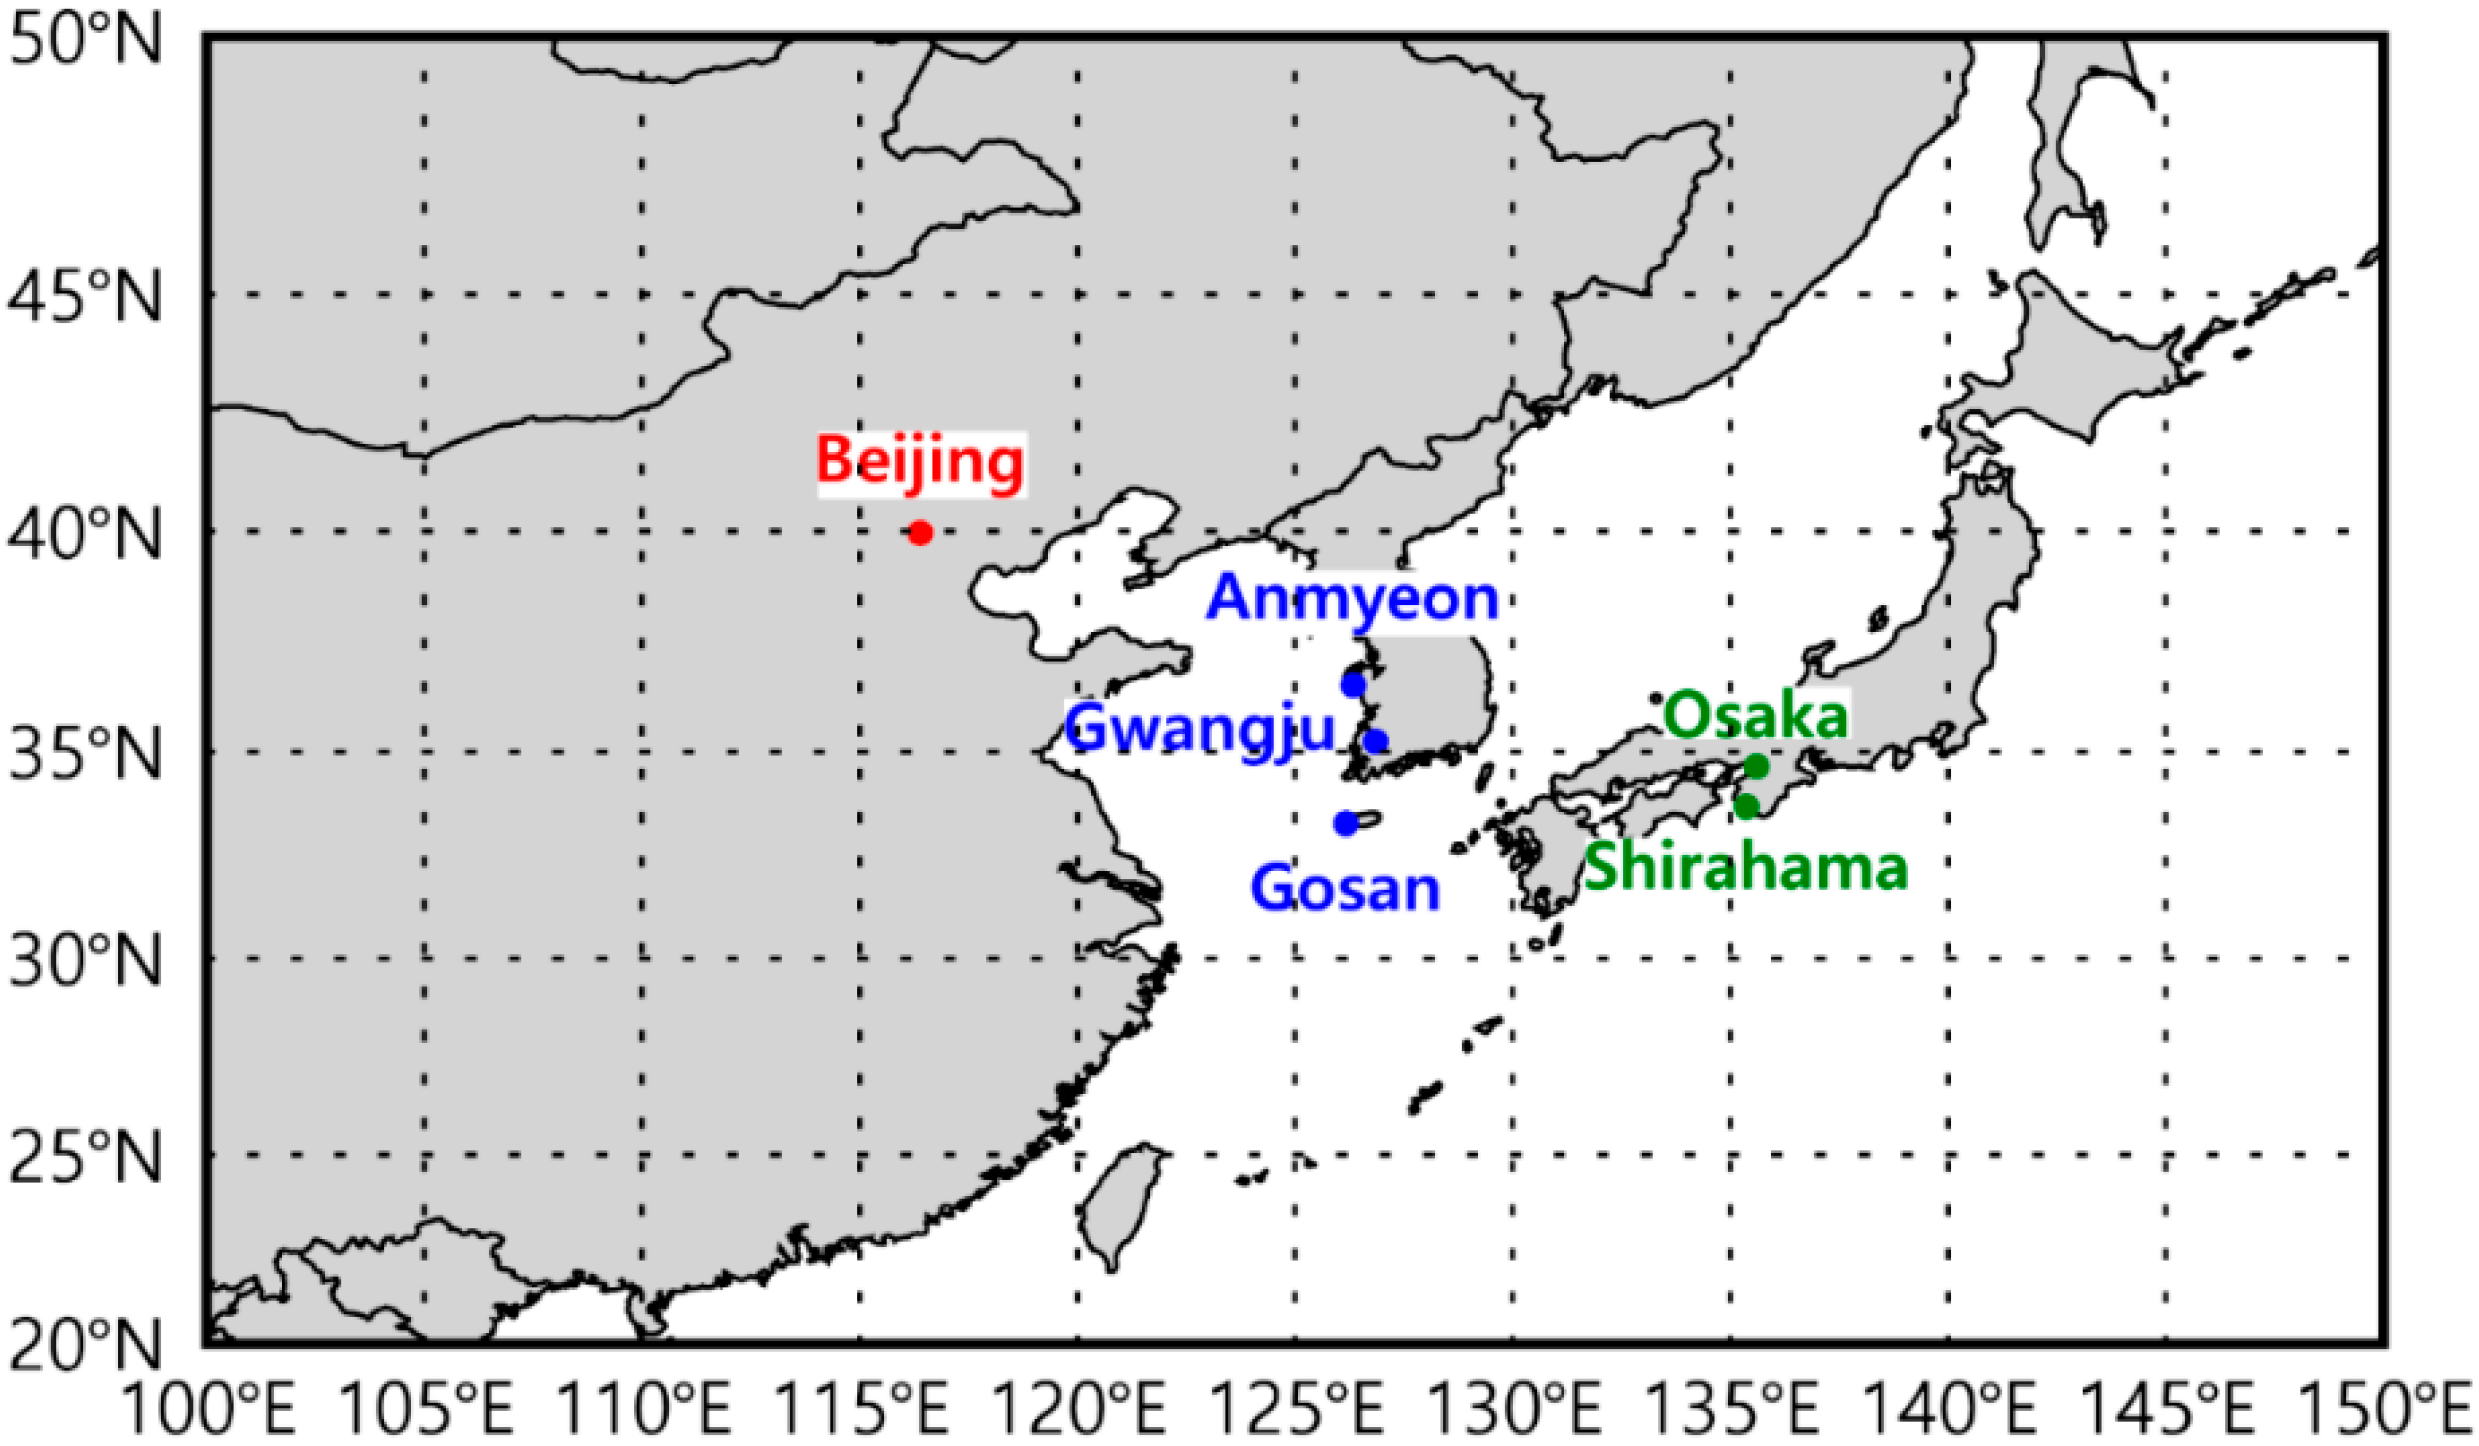
Figure 2.
Variations of annual mean AODT at 440 nm from 2001 to 2018 at six sites. * (units AODT yr−1).
Figure 2.
Variations of annual mean AODT at 440 nm from 2001 to 2018 at six sites. * (units AODT yr−1).
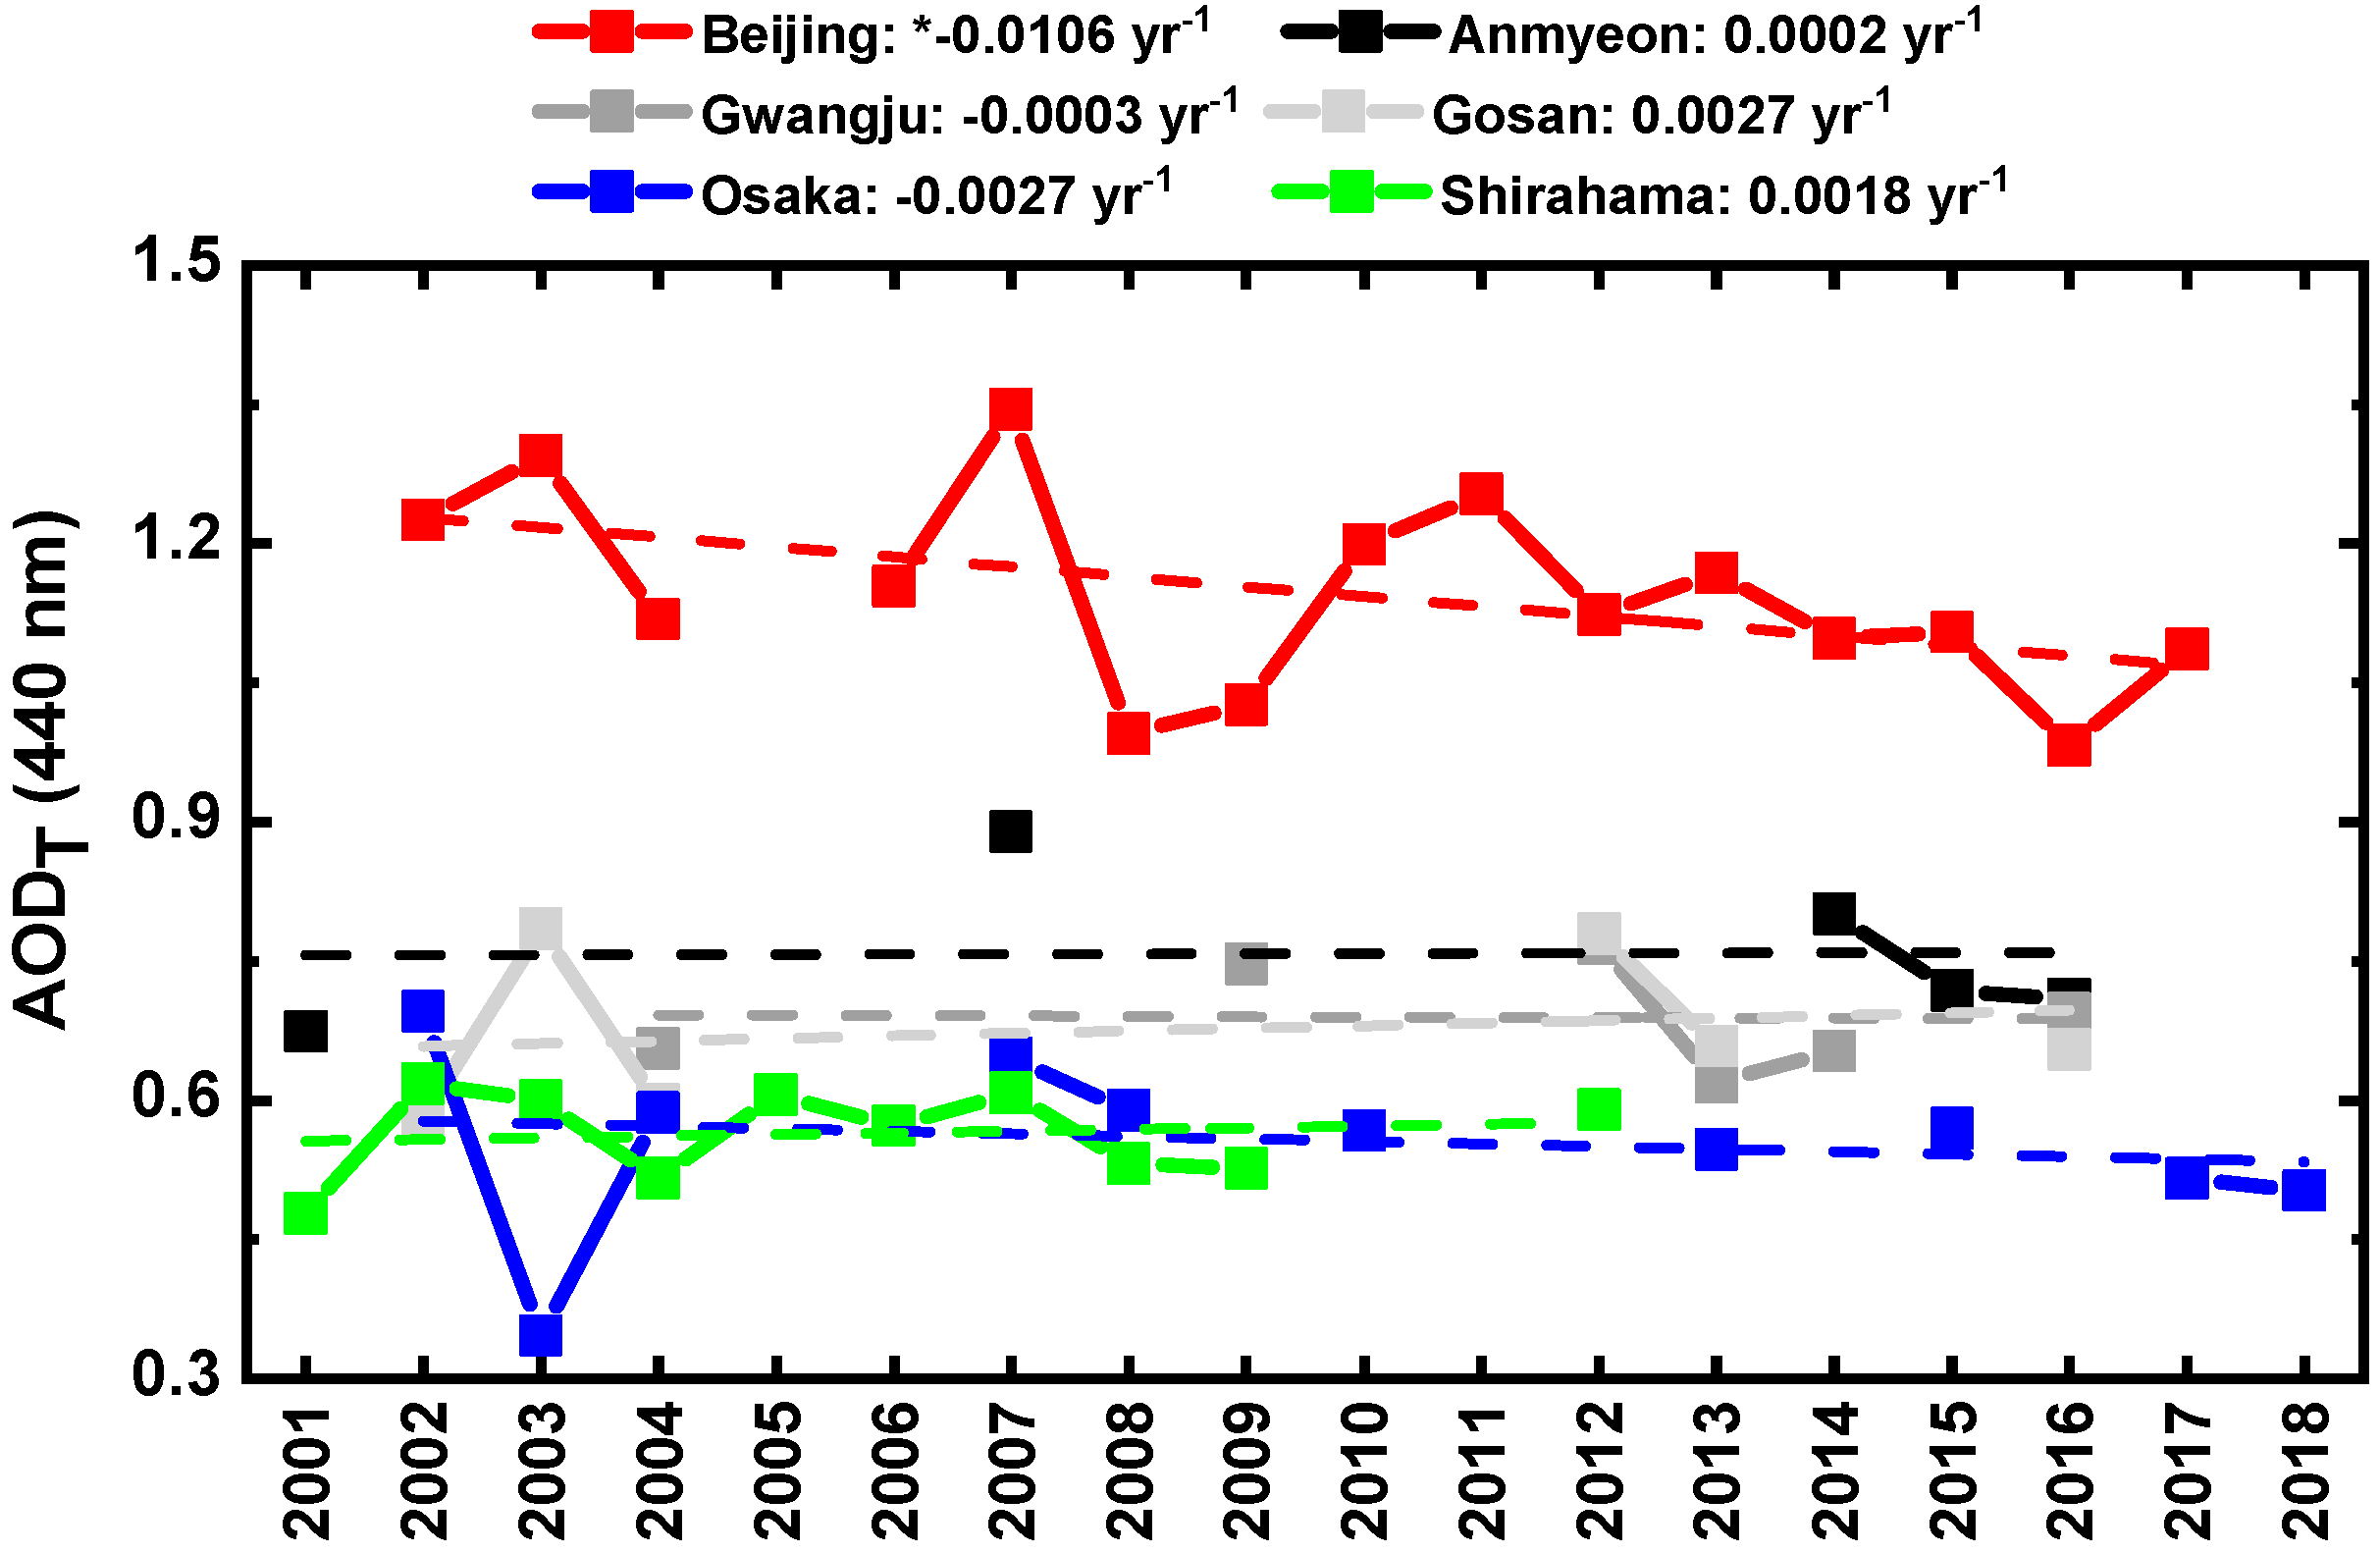
Figure 3.
Variations of annual mean AAODBC at 440 nm from 2001 to 2018 at six sites. Error bars show the standard deviation of the annual averages. * (units AAODBC yr−1).
Figure 3.
Variations of annual mean AAODBC at 440 nm from 2001 to 2018 at six sites. Error bars show the standard deviation of the annual averages. * (units AAODBC yr−1).
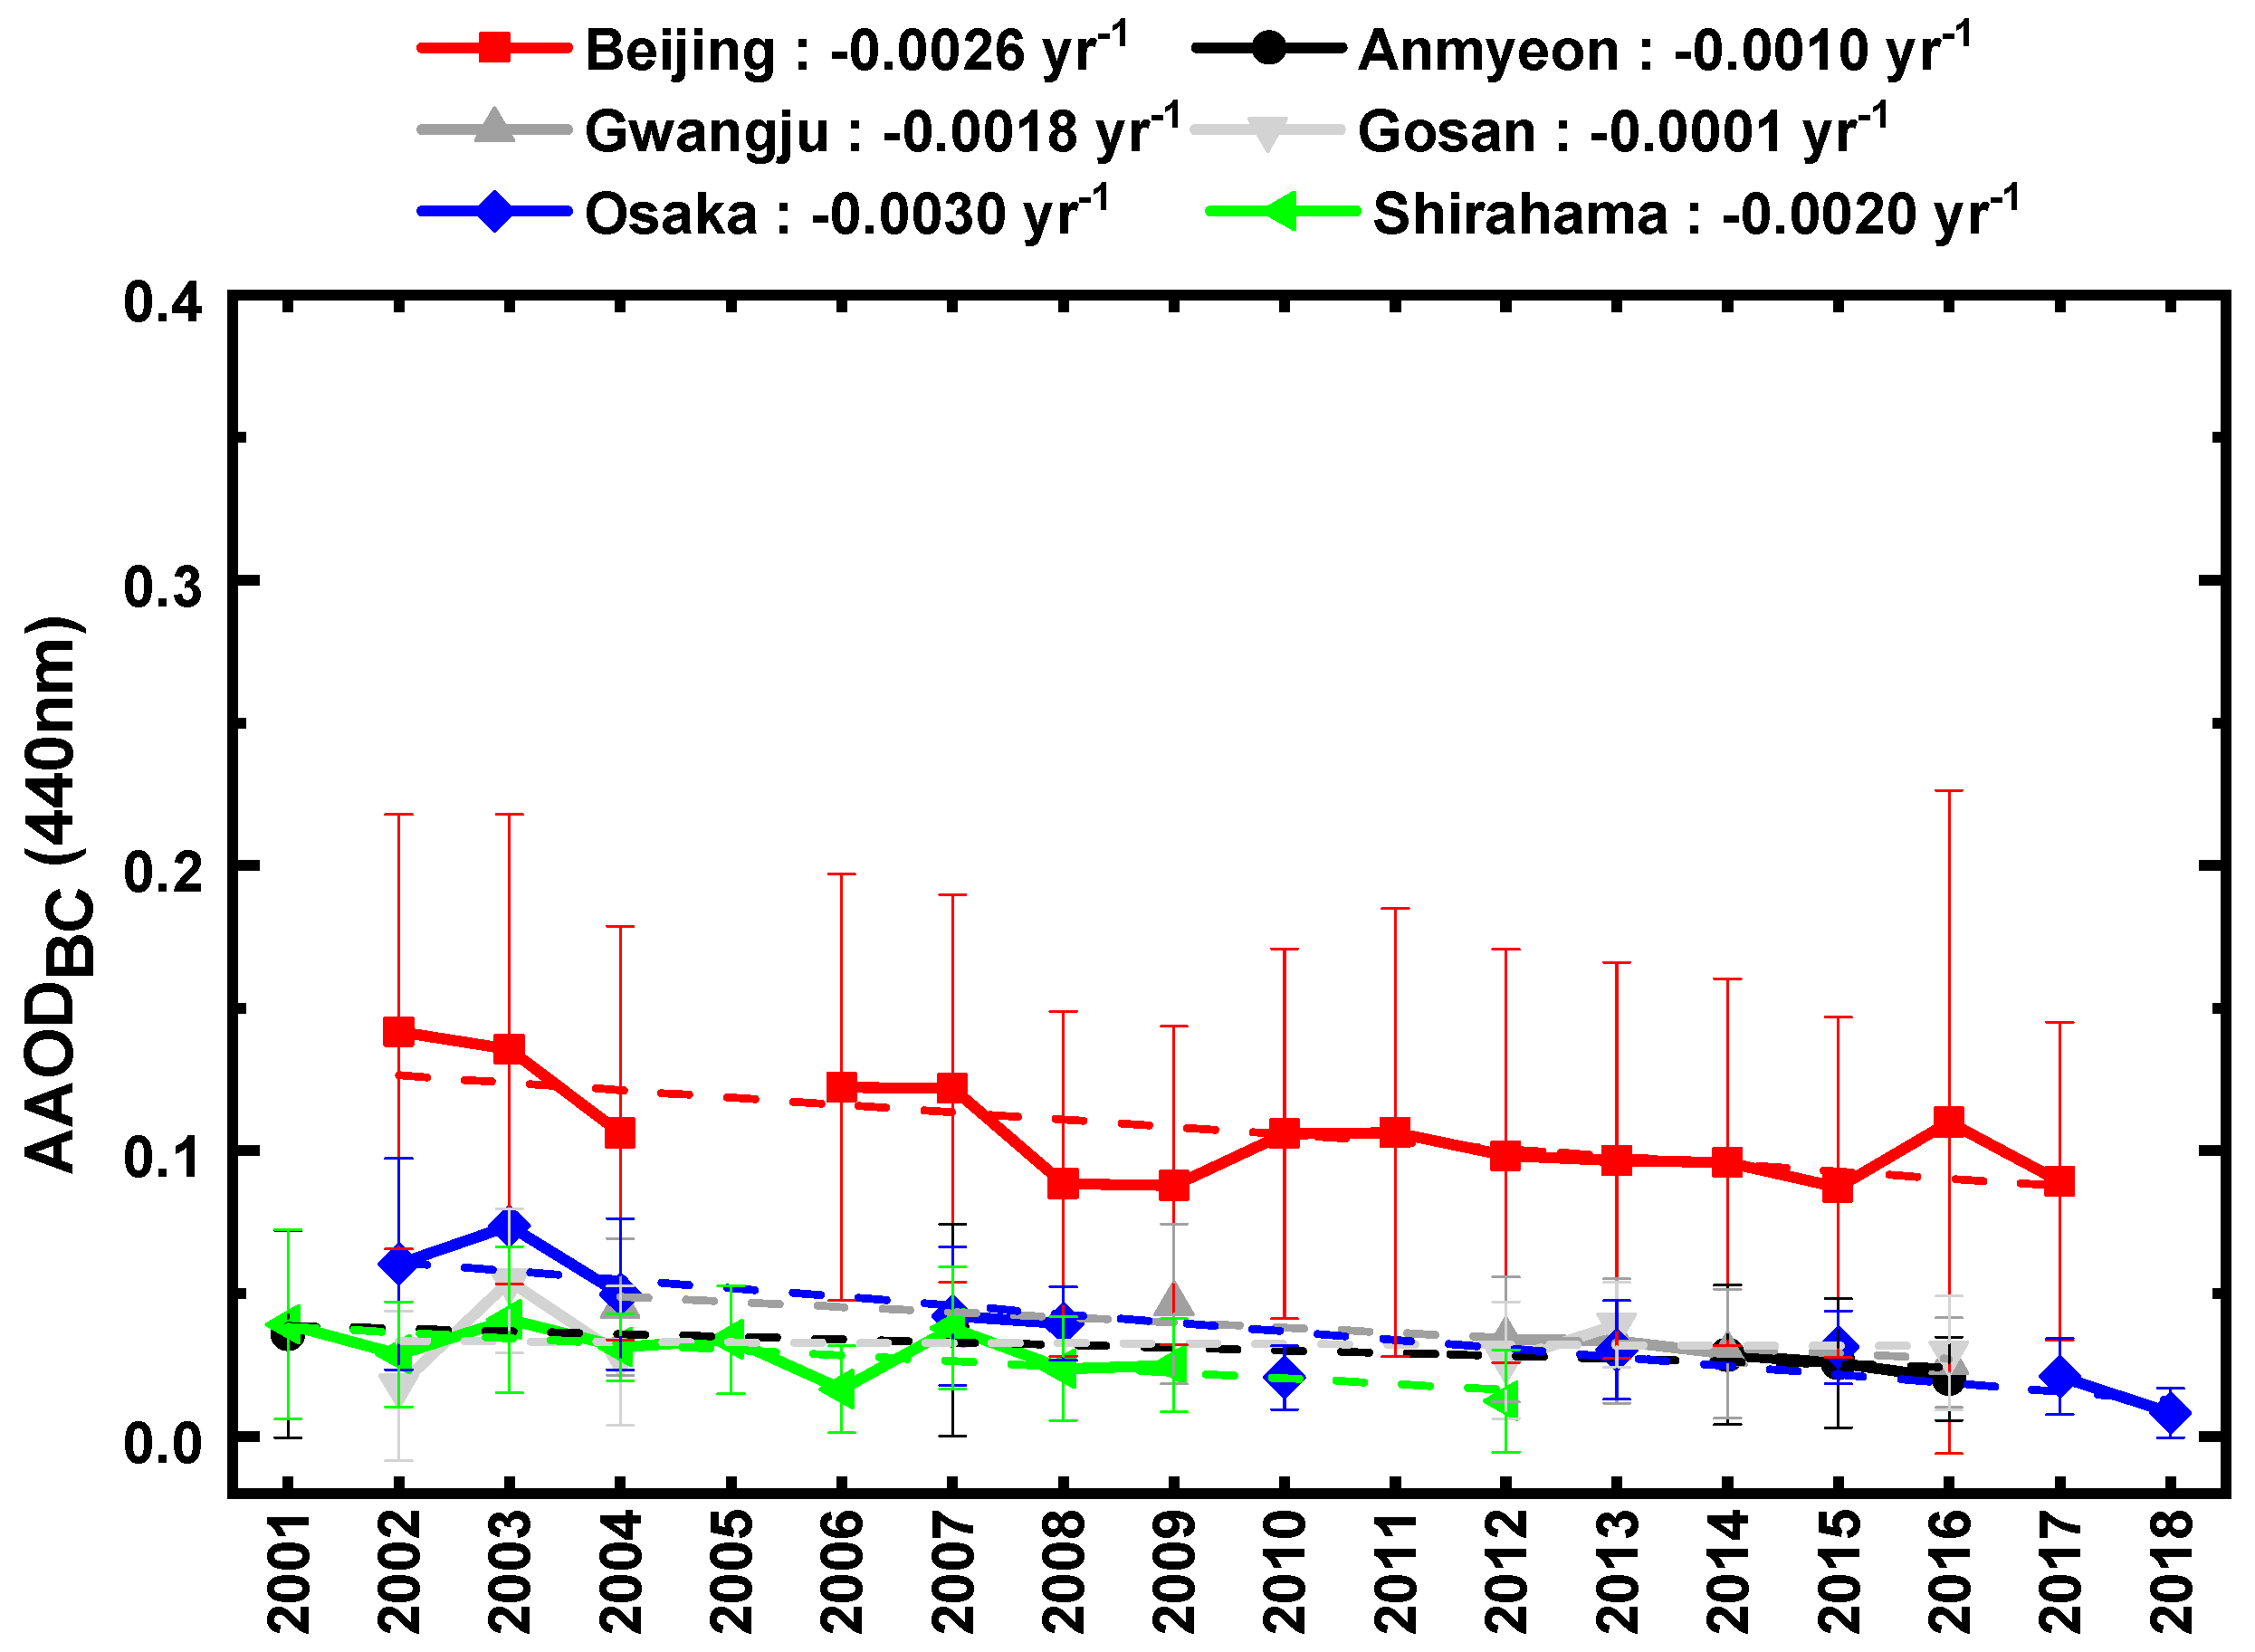
Figure 4.
Variations of seasonal mean AAODBC at 440 nm in (a) spring (b) summer (c) fall, and (d) winter from 2001 to 2018 at six sites. * (units AAODBC yr−1).
Figure 4.
Variations of seasonal mean AAODBC at 440 nm in (a) spring (b) summer (c) fall, and (d) winter from 2001 to 2018 at six sites. * (units AAODBC yr−1).
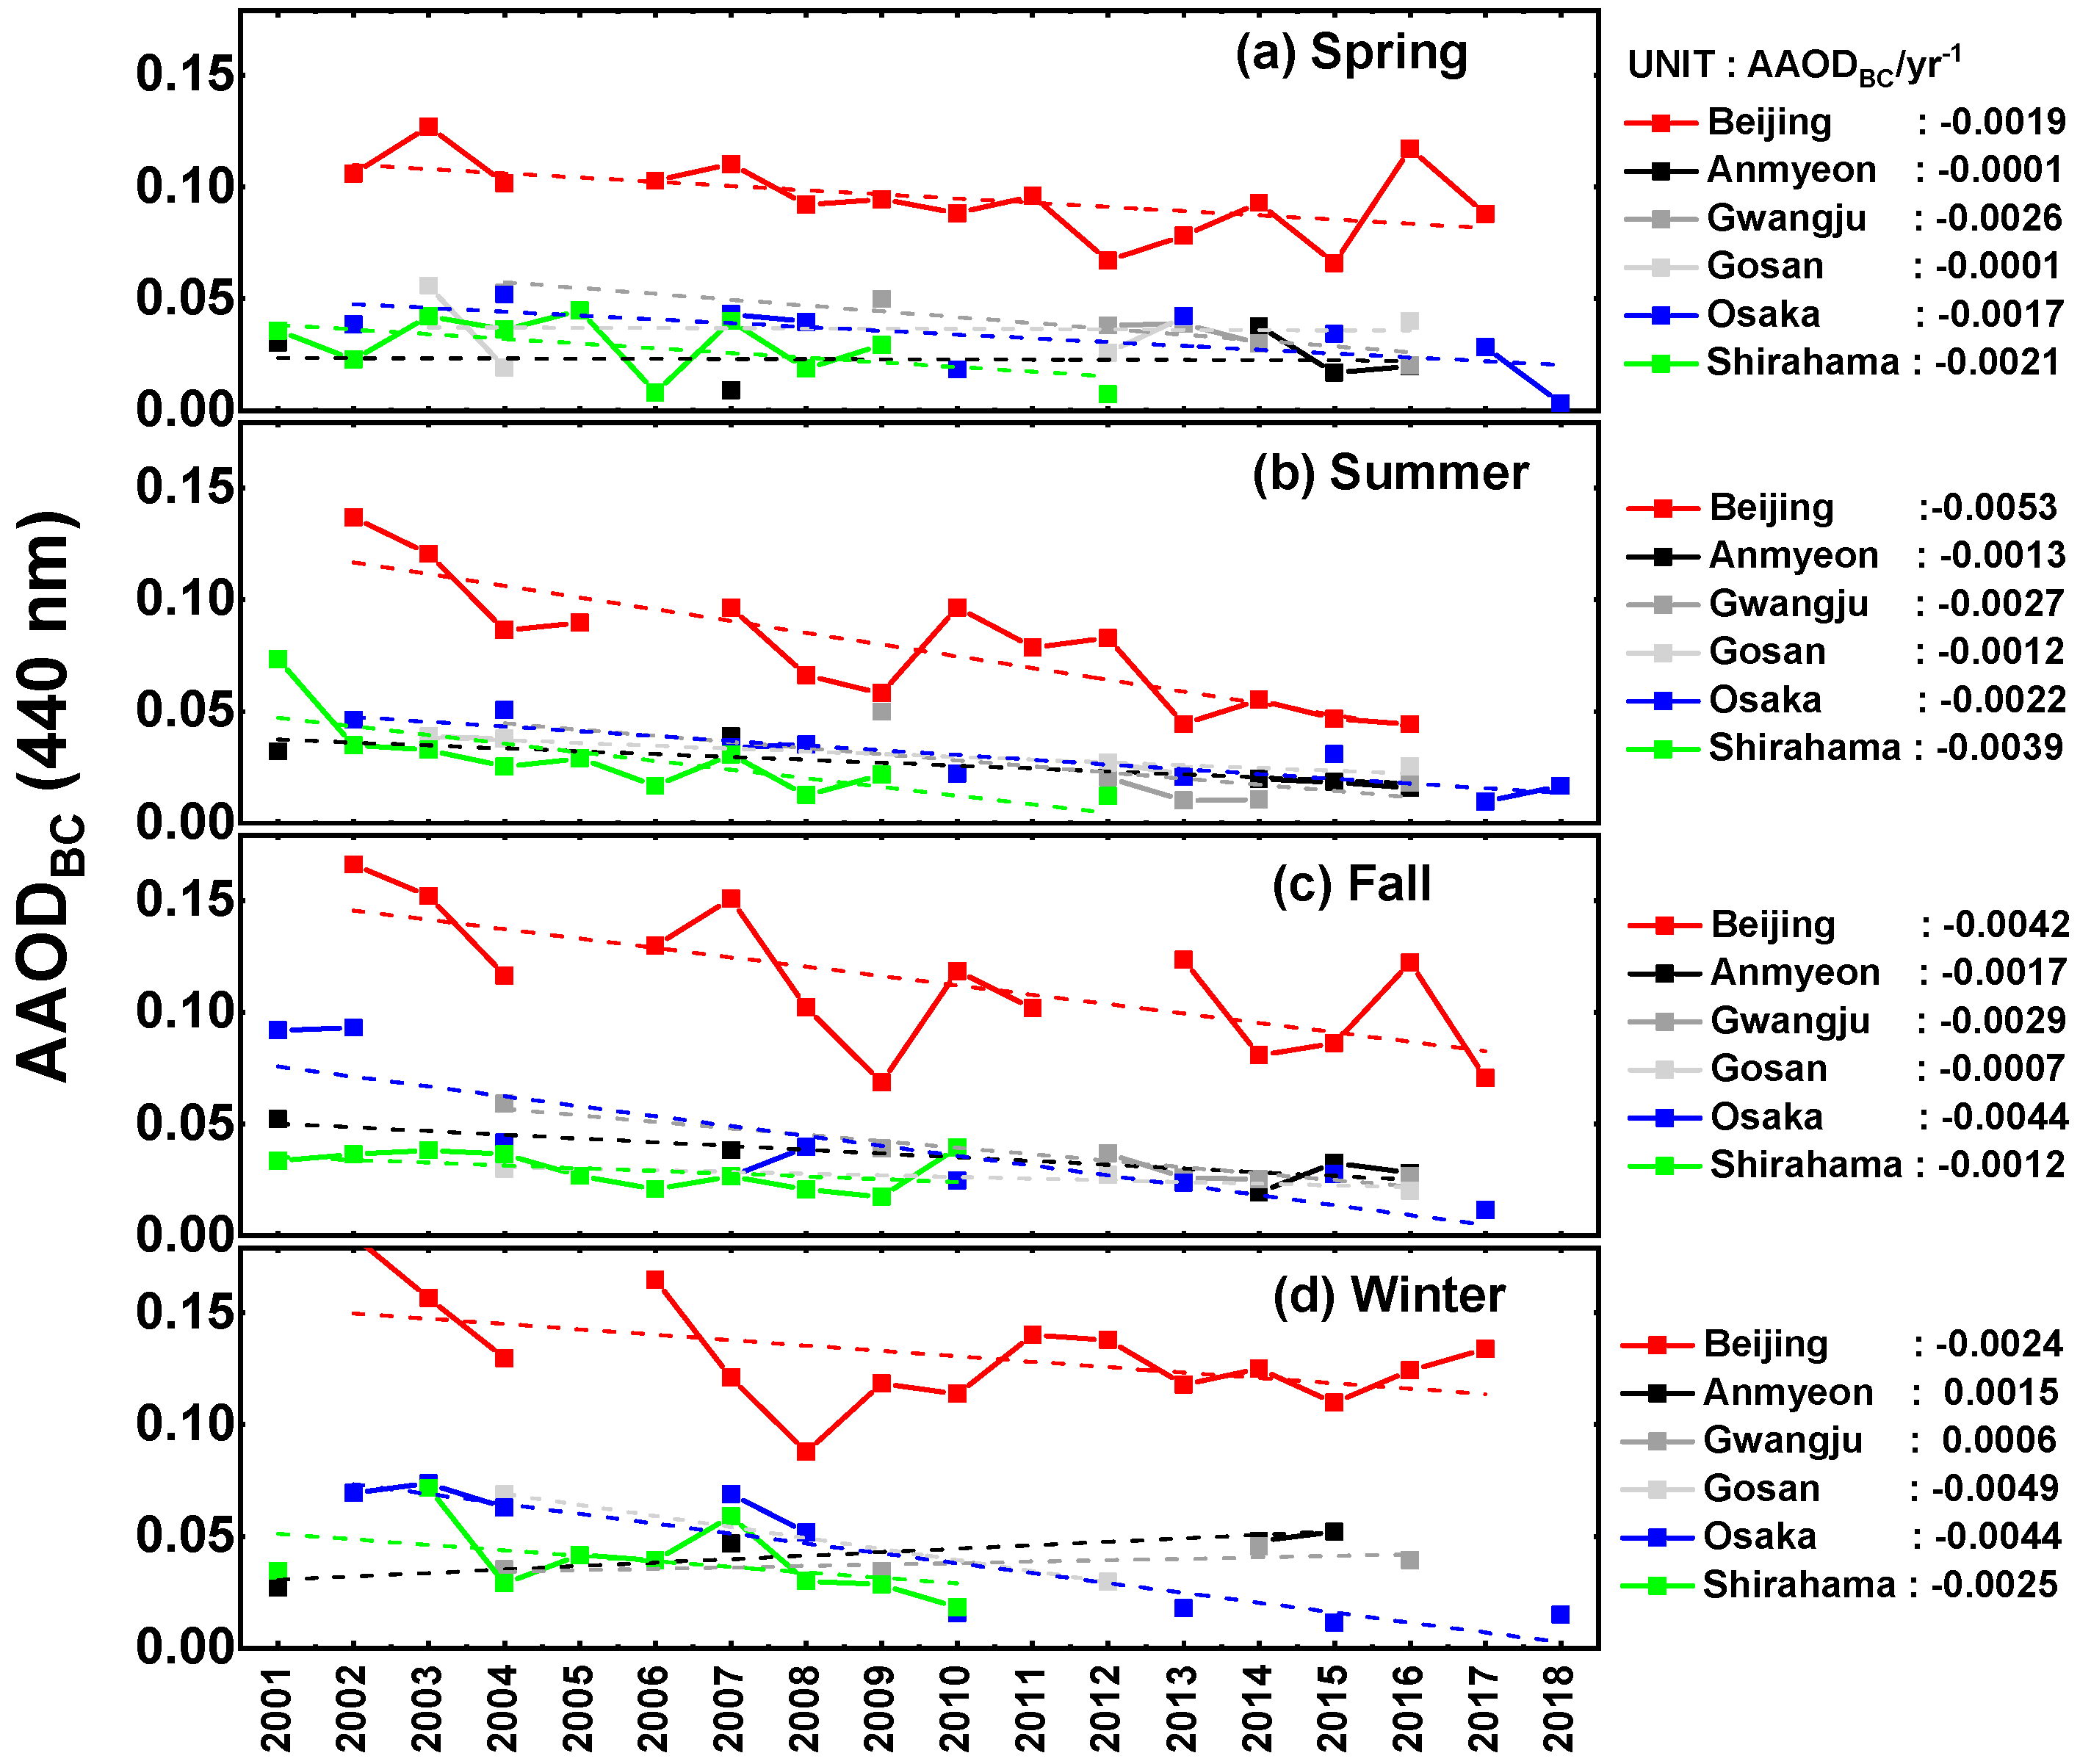
Figure 5.
Variations of (a) annual AAODBC/AODT ratio at 440 nm (b) annual ratio of AAODBC/AODnd at 440 nm from 2001 to 2018 at six sites. * (units yr−1).
Figure 5.
Variations of (a) annual AAODBC/AODT ratio at 440 nm (b) annual ratio of AAODBC/AODnd at 440 nm from 2001 to 2018 at six sites. * (units yr−1).
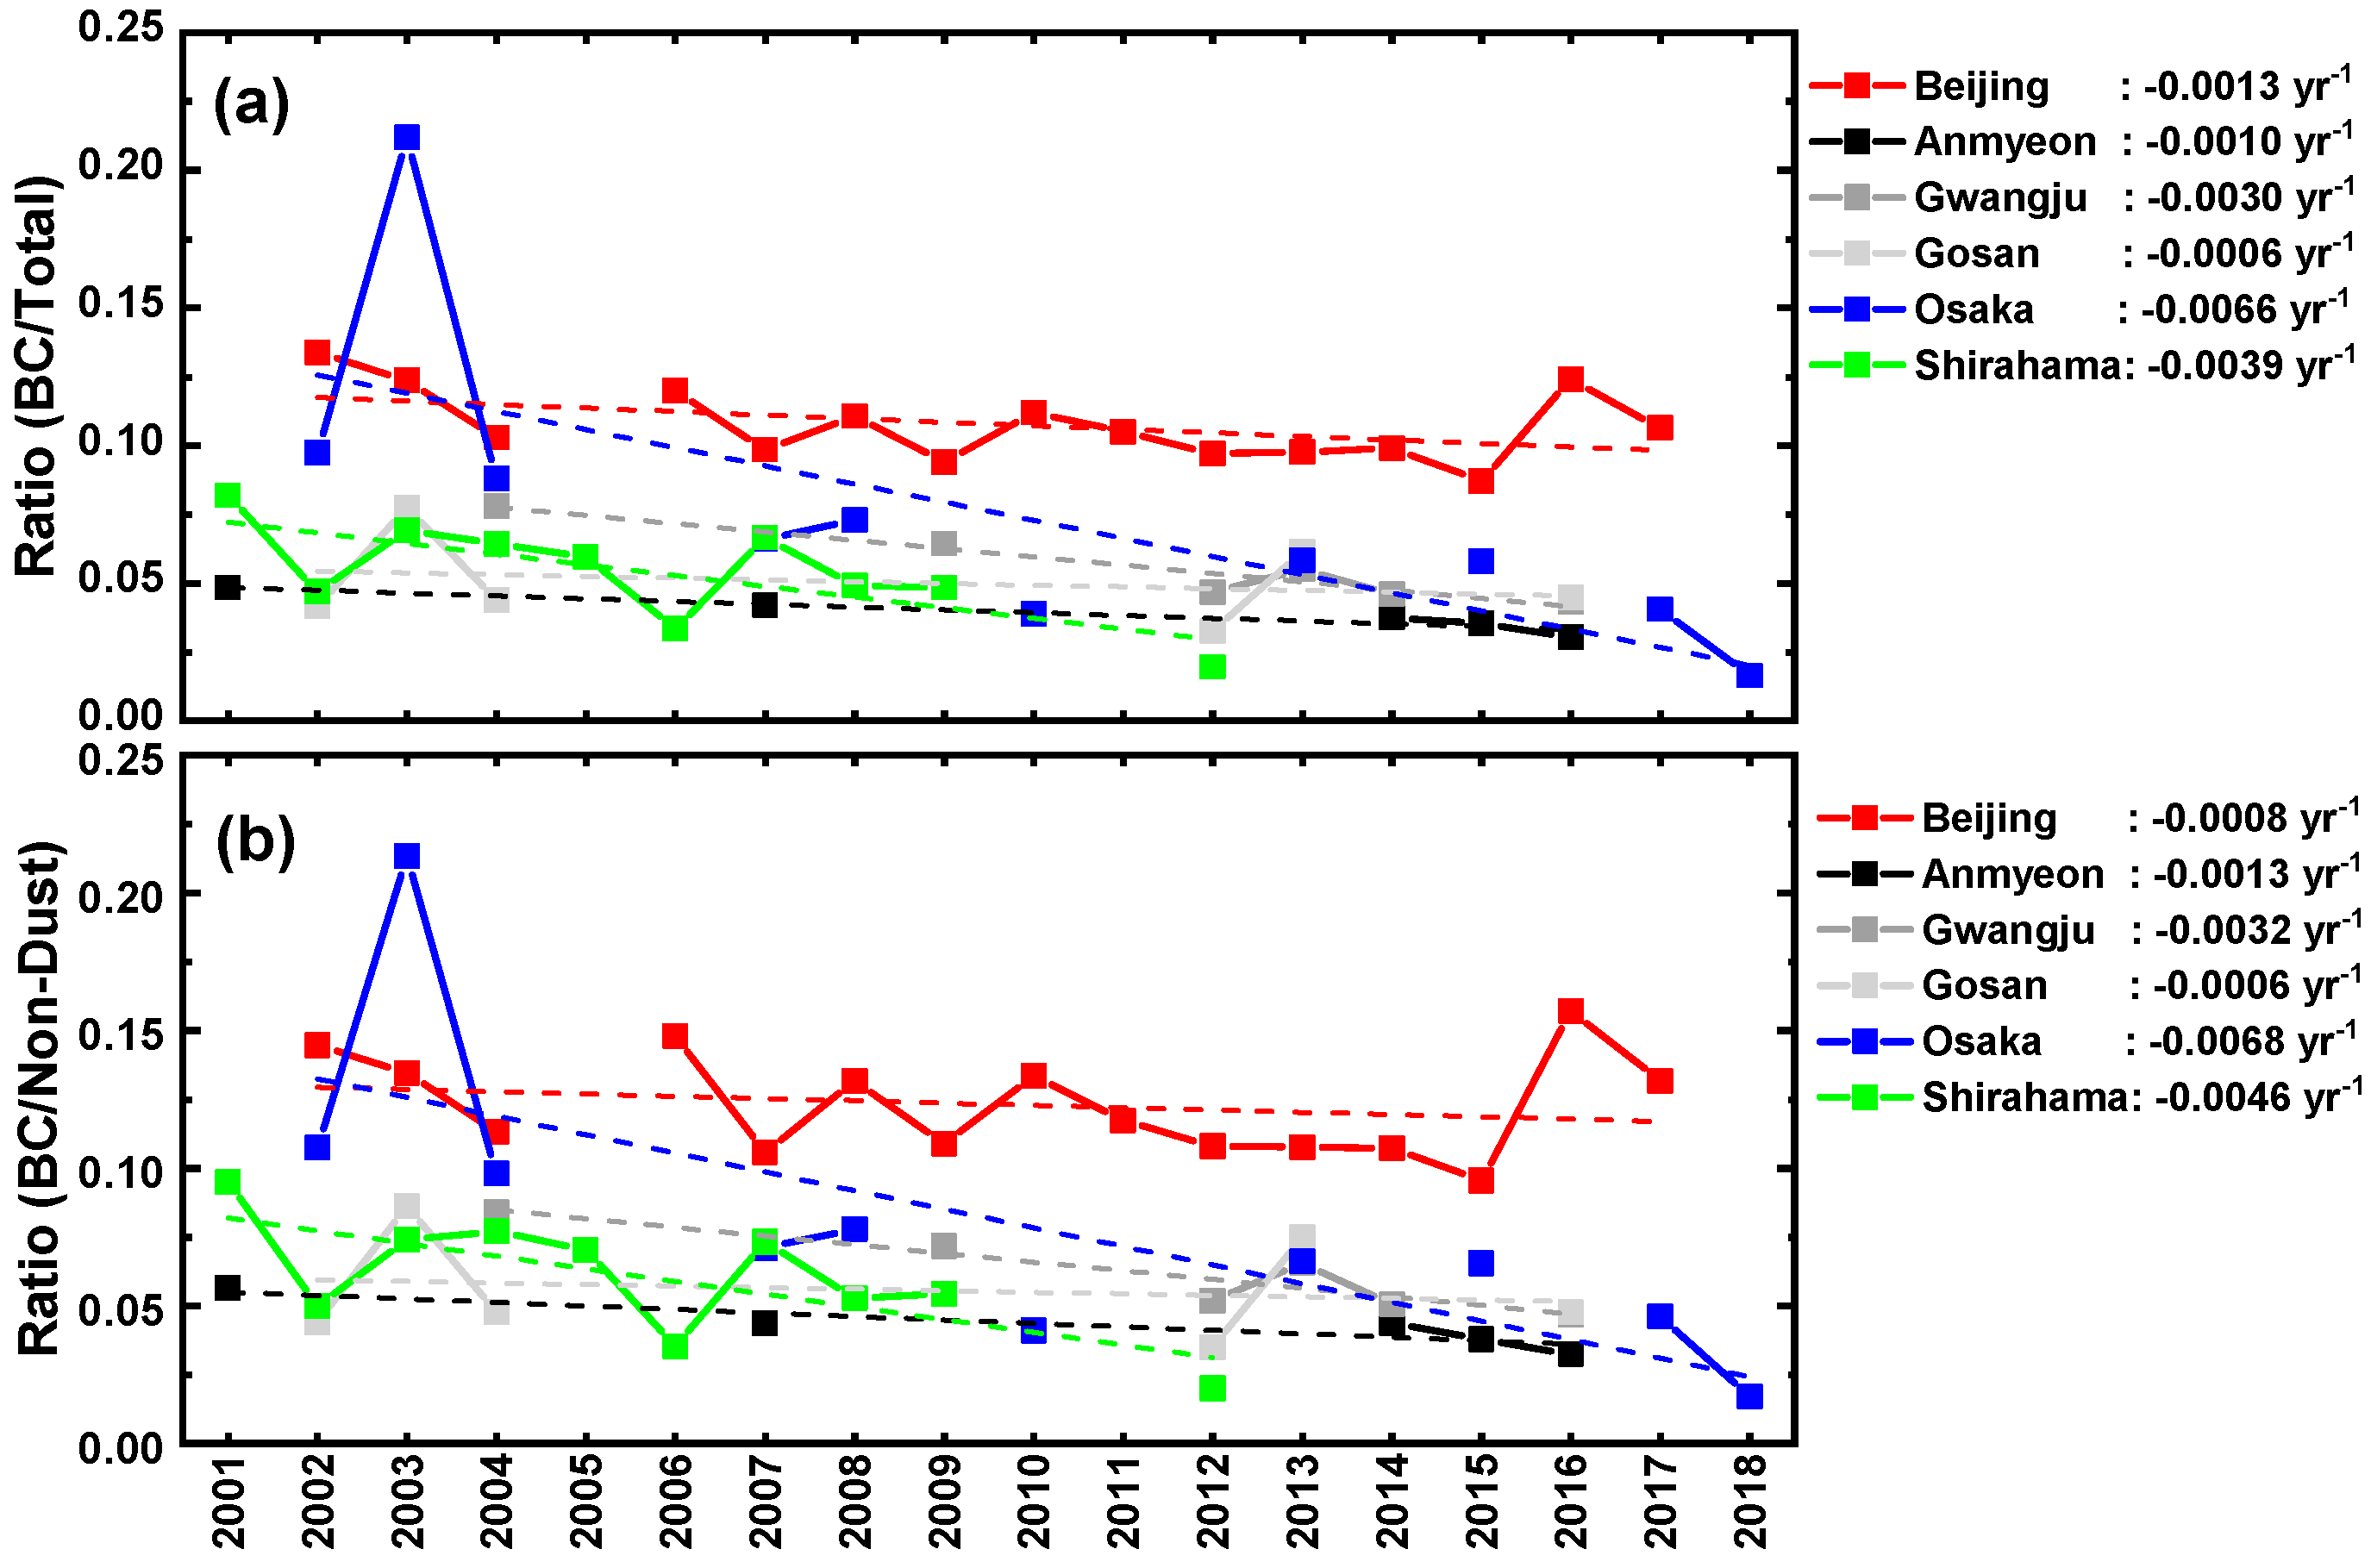
Figure 6.
Seasonal variations of annual AAODBC/AODT ratio at 440 nm in (a) spring (b) summer (c) fall, and (d) winter from 2001 to 2018 at six sites. * (units yr−1).
Figure 6.
Seasonal variations of annual AAODBC/AODT ratio at 440 nm in (a) spring (b) summer (c) fall, and (d) winter from 2001 to 2018 at six sites. * (units yr−1).
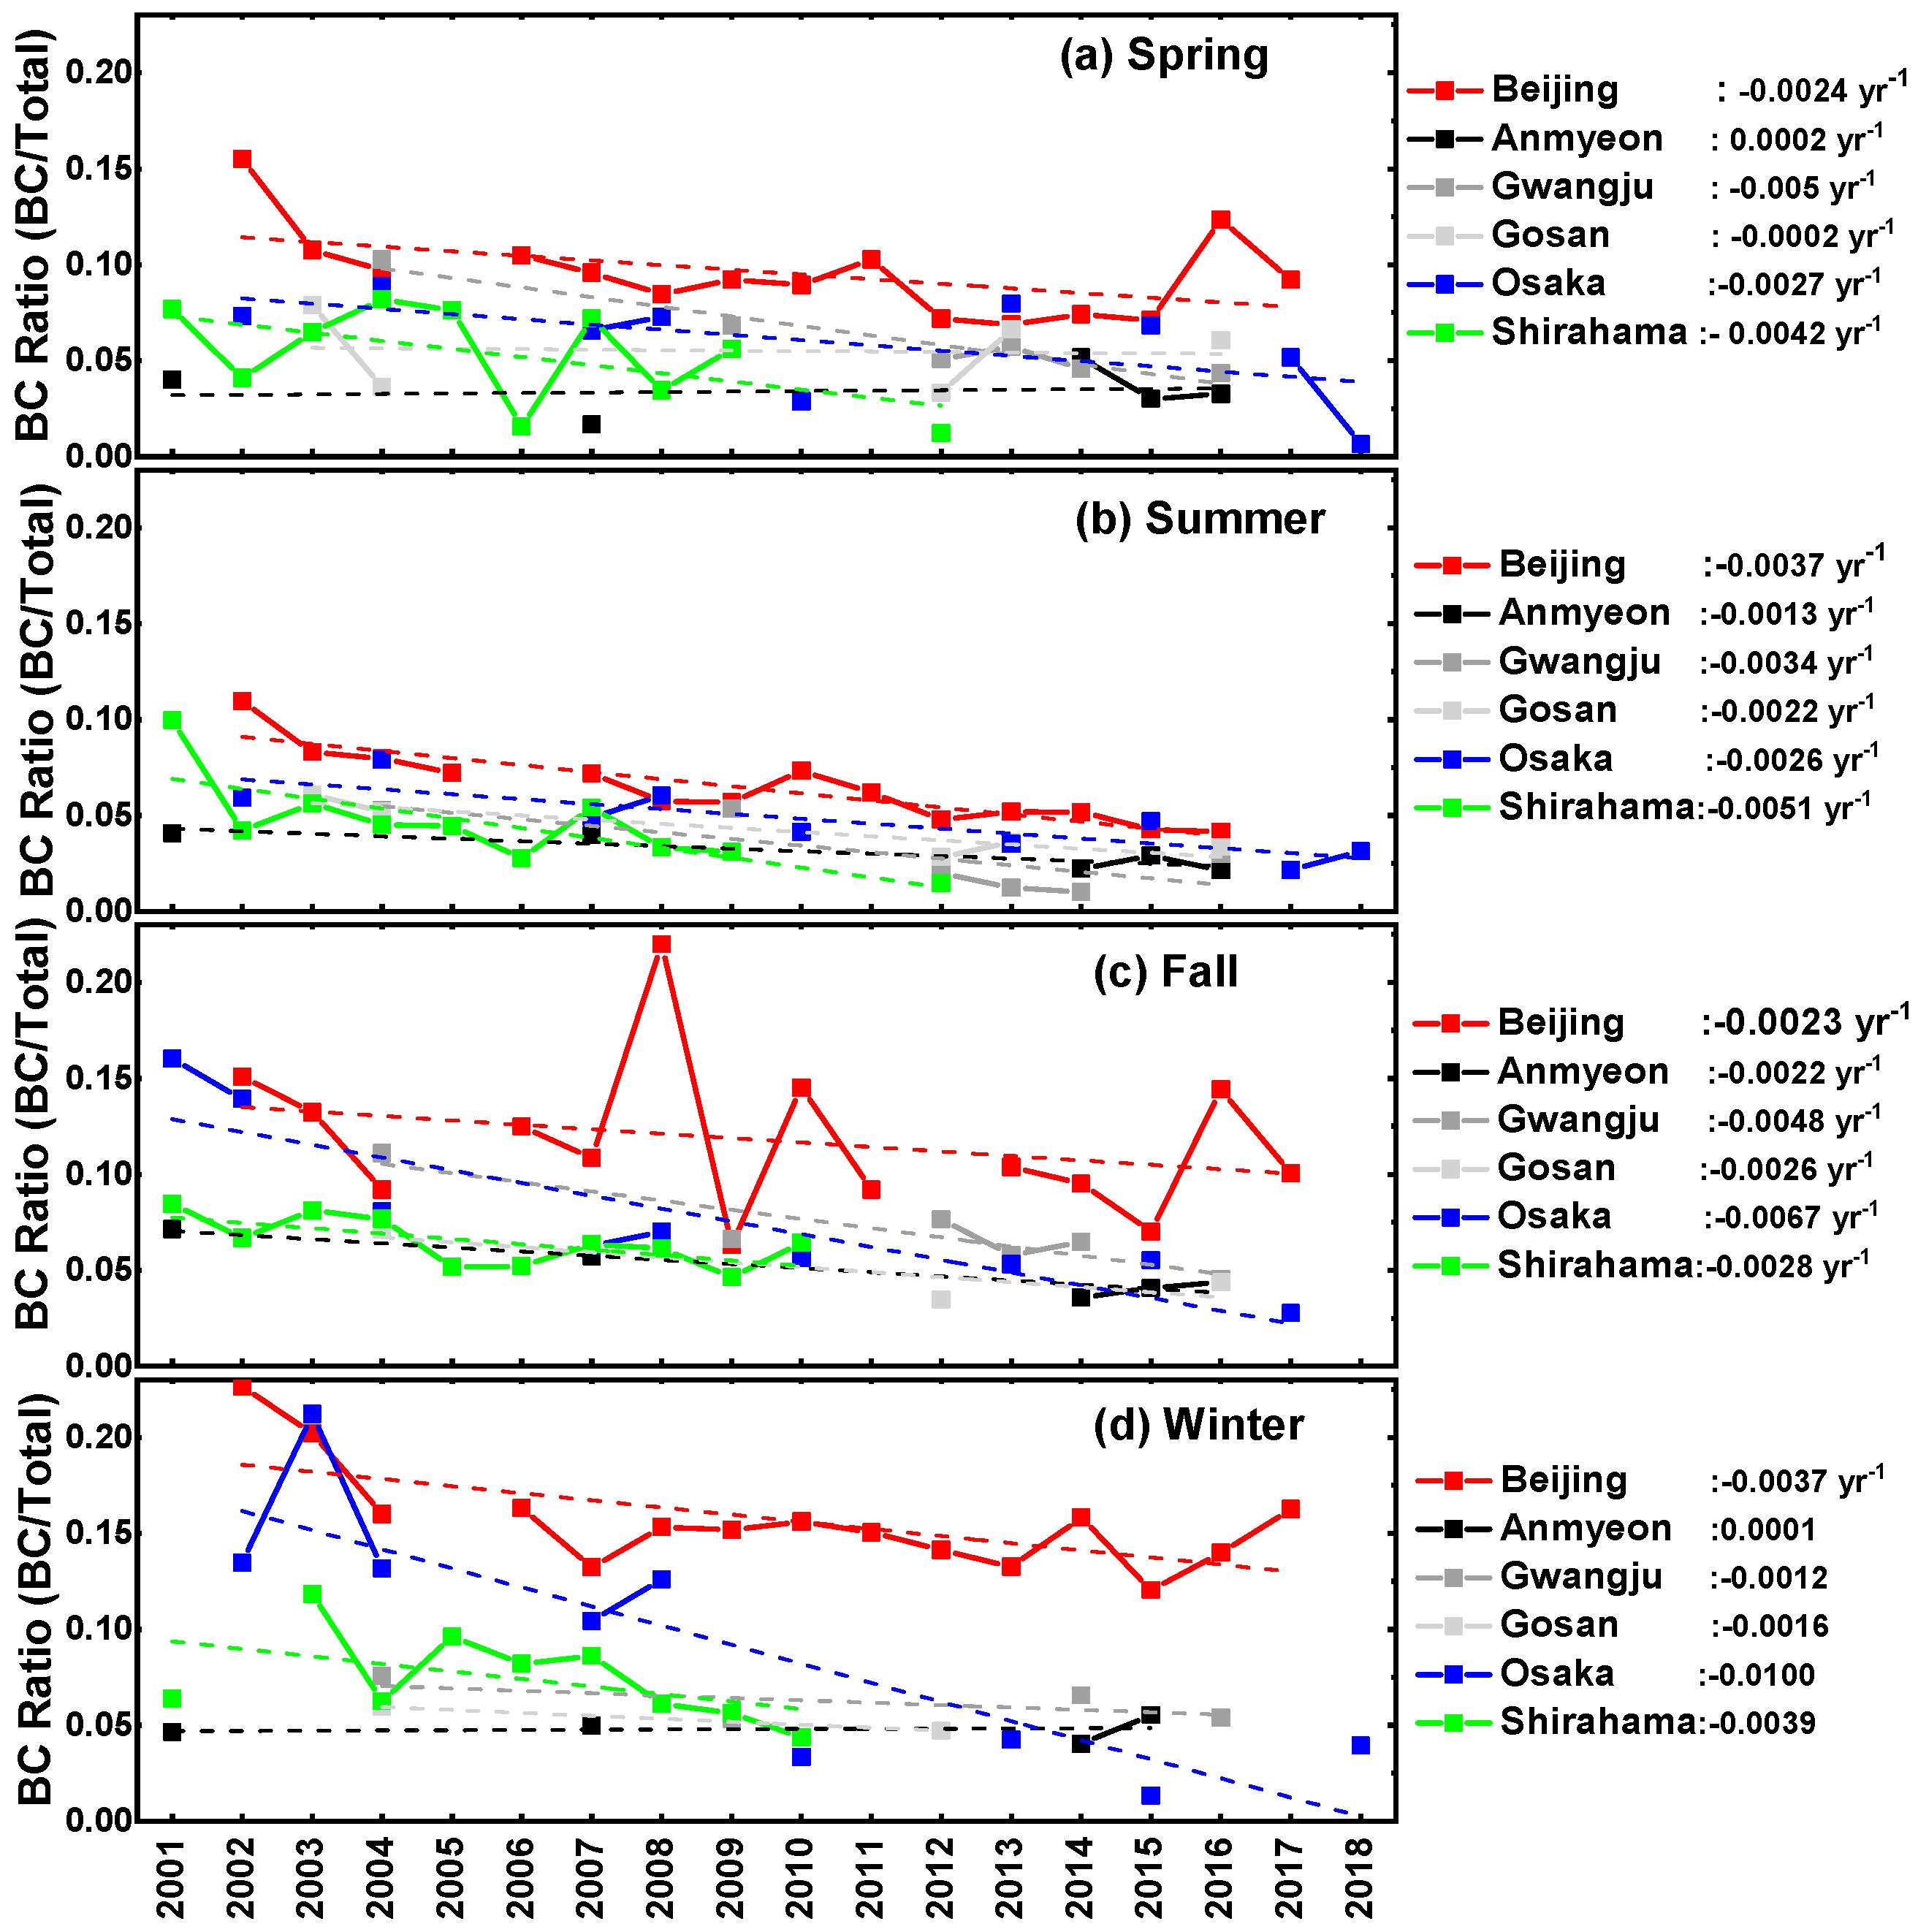
Figure 7.
Monthly variations of (a) mean AAODBC, (b) the ratio of AAODBC to AODT (BC ratio), and (c) the ratio of AAODBC to AODnd at 440 nm from 2001 to 2018 at six sites. * (a) (units, AAODBC yr−1), (b) (units, yr−1), and (c) (units yr−1).
Figure 7.
Monthly variations of (a) mean AAODBC, (b) the ratio of AAODBC to AODT (BC ratio), and (c) the ratio of AAODBC to AODnd at 440 nm from 2001 to 2018 at six sites. * (a) (units, AAODBC yr−1), (b) (units, yr−1), and (c) (units yr−1).

Table 1.
AERONET data for six selected sites listing mean values and standard deviations of total and seasonal variations of AODT, AAODBC, and AAODBC ratio at 440 nm, over the period 2001–2018.
Table 1.
AERONET data for six selected sites listing mean values and standard deviations of total and seasonal variations of AODT, AAODBC, and AAODBC ratio at 440 nm, over the period 2001–2018.
| Station | N | AODT (440 nm) (Mean ± SD) | AAODBC (440 nm) (Mean ± SD) | AAODBC Ratio (440 nm) (Mean ± SD) | ||||||||||||
|---|---|---|---|---|---|---|---|---|---|---|---|---|---|---|---|---|
| Total | Spring | Summer | Fall | Winter | Total | Spring | Summer | Fall | Winter | Total | Spring | Summer | Fall | Winter | ||
| Beijing | 1313 | 1.15 ± 0.73 | 1.10 ± 0.65 | 1.43 ± 0.80 | 1.18 ± 0.80 | 0.96 ± 0.67 | 0.11 ± 0.08 | 0.09 ± 0.07 | 0.09 ± 0.06 | 0.12 ± 0.08 | 0.13 ± 0.08 | 0.11 ± 0.01 | 0.09 ± 0.06 | 0.07 ± 0.04 | 0.12 ± 0.07 | 0.15 ± 0.06 |
| Anmyeon | 240 | 0.74 ± 0.38 | 0.67 ± 0.30 | 0.78 ± 0.39 | 0.72 ± 0.37 | 0.94 ± 0.55 | 0.03 ± 0.03 | 0.03 ± 0.03 | 0.02 ± 0.03 | 0.04 ± 0.02 | 0.04 ± 0.03 | 0.04 ± 0.01 | 0.04 ± 0.03 | 0.03 ± 0.02 | 0.05 ± 0.02 | 0.05 ± 0.02 |
| Gwangju | 267 | 0.70 ± 0.35 | 0.69 ± 0.31 | 0.84 ± 0.40 | 0.54 ± 0.18 | 0.80 ± 0.61 | 0.04 ± 0.02 | 0.04 ± 0.02 | 0.03 ± 0.03 | 0.03 ± 0.02 | 0.04 ± 0.02 | 0.06 ± 0.01 | 0.06 ± 0.03 | 0.03 ± 0.03 | 0.07 ± 0.03 | 0.06 ± 0.03 |
| Gosan | 113 | 0.69 ± 0.32 | 0.69 ± 0.32 | 0.72 ± 0.27 | 0.73 ± 0.39 | 0.63 ± 0.24 | 0.04 ± 0.02 | 0.04 ± 0.03 | 0.03 ± 0.02 | 0.03 ± 0.01 | 0.04 ± 0.02 | 0.05 ± 0.02 | 0.06 ± 0.04 | 0.04 ± 0.02 | 0.04 ± 0.02 | 0.06 ± 0.03 |
| Osaka | 300 | 0.58 ± 0.20 | 0.57 ± 0.19 | 0.64 ± 0.21 | 0.53 ± 0.20 | 0.53± 0.20 | 0.03 ± 0.02 | 0.03 ± 0.02 | 0.03 ± 0.02 | 0.04 ± 0.03 | 0.04 ± 0.03 | 0.07 ± 0.05 | 0.06 ± 0.04 | 0.05 ± 0.03 | 0.07 ± 0.05 | 0.08 ± 0.07 |
| Shirahama | 296 | 0.57 ± 0.23 | 0.57 ± 0.22 | 0.65 ± 0.28 | 0.46 ± 0.13 | 0.51 ± 0.18 | 0.03 ± 0.02 | 0.03 ± 0.02 | 0.03 ± 0.02 | 0.03 ± 0.02 | 0.04 ± 0.02 | 0.05 ± 0.02 | 0.05 ± 0.04 | 0.05 ± 0.03 | 0.06 ± 0.03 | 0.08 ± 0.03 |
Table 2.
Results of the ANOVA test for variations of annual mean AAODBC at 440 nm from 2001 to 2018 at six sites using SPSS statistics application (IBM SPSS Statistics, USA).
Table 2.
Results of the ANOVA test for variations of annual mean AAODBC at 440 nm from 2001 to 2018 at six sites using SPSS statistics application (IBM SPSS Statistics, USA).
| Station | p-Value * |
|---|---|
| Beijing | 0.128 |
| Anmyeon | 0.358 |
| Gwangju | 0.023 |
| Gosan | 0.032 |
| Osaka | 0.00 |
| Shirahama | 0.016 |
* Means were considered significant at p < 0.05.
Publisher’s Note: MDPI stays neutral with regard to jurisdictional claims in published maps and institutional affiliations. |
© 2020 by the authors. Licensee MDPI, Basel, Switzerland. This article is an open access article distributed under the terms and conditions of the Creative Commons Attribution (CC BY) license (http://creativecommons.org/licenses/by/4.0/).
Share and Cite
MDPI and ACS Style
Dehkhoda, N.; Noh, Y.; Joo, S. Long-Term Variation of Black Carbon Absorption Aerosol Optical Depth from AERONET Data over East Asia. Remote Sens. 2020, 12, 3551. https://doi.org/10.3390/rs12213551
AMA Style
Dehkhoda N, Noh Y, Joo S. Long-Term Variation of Black Carbon Absorption Aerosol Optical Depth from AERONET Data over East Asia. Remote Sensing. 2020; 12(21):3551. https://doi.org/10.3390/rs12213551
Chicago/Turabian StyleDehkhoda, Naghmeh, Youngmin Noh, and Sohee Joo. 2020. "Long-Term Variation of Black Carbon Absorption Aerosol Optical Depth from AERONET Data over East Asia" Remote Sensing 12, no. 21: 3551. https://doi.org/10.3390/rs12213551
Note that from the first issue of 2016, this journal uses article numbers instead of page numbers. See further details here.