Application of UAV Imagery to Detect and Quantify Submerged Filamentous Algae and Rooted Macrophytes in a Non-Wadeable River


1
Department of Environmental Science, Policy, and Management, University of California, Berkeley, CA 94720, USA
2
Division of Biological Sciences and Flathead Lake Biological Station, University of Montana, Missoula, MT 59812, USA
3
Division of Agriculture and Natural Resources, University of California, Davis, CA 95618, USA
*
Author to whom correspondence should be addressed.
Remote Sens. 2020, 12(20), 3332; https://doi.org/10.3390/rs12203332
Submission received: 31 August 2020
/
Revised: 3 October 2020
/
Accepted: 9 October 2020
/
Published: 13 October 2020
(This article belongs to the Special Issue She Maps)
Abstract
:Imagery from unoccupied aerial vehicles (UAVs) is useful for mapping floating and emerged primary producers, as well as single taxa of submerged primary producers in shallow, clear lakes and streams. However, there is little research on the effectiveness of UAV imagery-based detection and quantification of submerged filamentous algae and rooted macrophytes in deeper rivers using a standard red-green-blue (RGB) camera. This study provides a novel application of UAV imagery analysis for monitoring a non-wadeable river, the Klamath River in northern California, USA. River depth and solar angle during flight were analyzed to understand their effects on benthic primary producer detection. A supervised, pixel-based Random Trees classifier was utilized as a detection mechanism to estimate the percent cover of submerged filamentous algae and rooted macrophytes from aerial photos within 32 sites along the river in June and July 2019. In-situ surveys conducted via wading and snorkeling were used to validate these data. Overall accuracy was 82% for all sites and the highest overall accuracy of classified UAV images was associated with solar angles between 47.5 and 58.72° (10:04 a.m. to 11:21 a.m.). Benthic algae were detected at depths of 1.9 m underwater and submerged macrophytes were detected down to 1.2 m (river depth) via the UAV imagery in this relatively clear river (Secchi depth > 2 m). Percent cover reached a maximum of 31% for rooted macrophytes and 39% for filamentous algae within all sites. Macrophytes dominated the upstream reaches, while filamentous algae dominated the downstream reaches closer to the Pacific Ocean. In upcoming years, four proposed dam removals are expected to alter the species composition and abundance of benthic filamentous algae and rooted macrophytes, and aerial imagery provides an effective method to monitor these changes.
1. Introduction
The extent, distribution, and assemblage of primary producers can indicate the ecological health of a water body [1,2]. Like vegetation on land, algae and aquatic plants provide a large portion of the nutritional and structural foundation for aquatic ecosystems [3]. In many rivers and clear lakes, primary producer assemblages are dominated by benthic algae and aquatic plants growing attached to the substrate, where filamentous algae and aquatic plants provide structural support to streambeds, as well as improve water quality by storing and processing nutrients and promoting settlement of suspended particles [4,5]. Diverse assemblages of primary producers, including thin films of diatoms, filamentous algae, and rooted aquatic plants, also provide food resources and habitat for invertebrates and fish in these ecosystems [6,7].
Macrophytes and benthic algae can become a nuisance to water bodies when excess nutrients, dams, or changing flows stimulate algal proliferations that reduce overall biodiversity and degrade water quality [8,9,10,11,12,13]. Medium and large rivers are especially vulnerable to nutrients and environmental conditions that promote algal and aquatic plant proliferations due to their position in watersheds and proximity to human habitation [5,14,15,16,17]. Despite the importance of primary producers in rivers and their vulnerability to alterations, monitoring the extent, types, and coverage of benthic primary producers in rivers is rarely conducted due to challenges associated with heterogeneity in benthic communities and field conditions. Given the important ecological functions and potential problems of macrophyte and benthic algal proliferations, it is valuable to monitor and understand primary producer assemblages in aquatic ecosystems.
High-resolution imagery can provide fine-scale detection of algae and vegetation [18,19,20,21]. Unoccupied Aerial Vehicles (UAVs) have been utilized for algal bloom and submerged aquatic vegetation detection for nearly two decades [22,23,24]. This type of high-resolution aerial imagery offers a cost-effective and rapid method to assess primary producer assemblages in aquatic environments and provides greater spatial resolution than current commercially available satellite imagery [25,26,27]. Furthermore, UAV image capture can provide benefits to traditional surveying of submerged filamentous algae and rooted aquatic vegetation in deep rivers, such as wading, swimming, kayaking, boating, and scuba diving [28,29,30,31], because this method is more accessible than physically entering a body of water, and it can accelerate the data acquisition process [32]. For these reasons, this study explored UAV image capture as a method to supplement current detection and quantification techniques.
Several researchers, such as Husson et al. [19], Flynn and Chapra [23], Visser et al. [33], and Stanfield [34], have been successful in identifying species and quantifying percent cover of submerged aquatic vegetation and benthic algae using UAV imagery over freshwater ecosystems. In these studies, Flynn and Chapra [23] and Stanfield [34] used multirotor DJI drones and Visser et al. [33] used a Helikite UAV to capture imagery with red-green-blue (RGB) and multispectral cameras in wadeable (< 1 m) [23], and non-turbid (0–10 Formazin Nephelometric Units (FNU)) [34] rivers. Several researchers flew over aquatic environments at low altitudes, such as Visser et al. [33] at 5 m, Husson et al. [19] at 10 to 25 m, and Stanfield [34] at 10 to 50 m, while others flew much higher, such as Flynn and Chapra [23] at 120 m and Brooks et al. [20] at 150 m. Flynn and Chapra [23] and Stanfield [34] used pixel-based classification techniques, and Visser et al. [33] employed object-based image analysis (OBIA) methods. With the exception of Visser et al. [33], in which a near-infrared camera was used to identify three macrophyte species, Brooks et al. 2019 [20], Flynn and Chapra [23], and Stanfield [34] focused on distinguishing one specific taxa from the rest of a submerged aquatic vegetation patch in clear, shallow environments. As green wavelengths are known to penetrate to deeper portions of the water column than other optical wavelengths [33,35,36], Flynn and Chapra [23], Visser et al. [33], and Stanfield [34] leveraged the green portion of the electromagnetic spectrum to detect submerged filamentous algae and macrophytes. However, a common challenge in this field involves detection interference due to sun glint [18,23,34,37], or the solar reflection of the sun off the water’s surface. Several researchers have incorporated techniques such as dark object subtraction [18] or calculations of solar angle [38] to mitigate these effects.
Recent submerged algae and macrophyte monitoring via UAVs has expanded the use of high spectral resolution sensors and algorithms, but has yet to implement these techniques for multiple taxa in non-wadeable environments. Current researchers, such as Flynn and Chapra [39] use acoustic profiling, and others such as Brooks et al. [20], Taddia et al. [40], and Brinkhoff et al. [41] use RGB, multispectral, and hyperspectral sensors over shallow (< 1 m) aquatic environments. With the exception of Tait et al. [42], in which several macroalga species were detected using RGB and multispectral imagery in a shallow coastal environment, and Brinkhoff et al. [41], in which three aquatic vegetation species were identified using multispectral imagery in irrigation canals, current studies primarily identify a single submerged primary producer taxa [20,39,40]. In marine environments, researchers such as Slocum et al. [43] leverage RGB sensors on fixed-wing and rotary-wing UAVs to create 3D point clouds of submerged aquatic vegetation or coral reefs from structure from motion photogrammetry. Tait et al. [42] flew at 50 m, Taddia et al. [40] flew at 70 m, and Brinkhoff et al. [41] flew at 75 m altitude. Several researchers used supervised classification techniques, such as Tait et al. [42] with support vector machines and Taddia et al. [40] with maximum likelihood classification, and others, such as Brooks et al. [20] and Brinkhoff et al. [41], used vegetation indices to identify submerged algae or macrophytes. Notable vegetation indices that have been applied to submerged aquatic vegetation detection in recent years include the Normalized Difference Aquatic Vegetation Index (NDAVI) and the Water Adjusted Vegetation Index (WAVI), both of which combine the near-infrared and blue bands [20,41]. Furthermore, the red edge band has been incorporated into submerged aquatic vegetation detection, as shown by studies from Taddia et al. [40] and Brinkhoff et al. [41]. Researchers, such as Slocum et al. [43] and Kwon et al. [37], are continuing to address issues of solar glint by flying slightly off-nadir and flying during times when solar angles are between 35 to 40°. As demonstrated in previous studies conducted by Brooks et al. [20], Flynn and Chapra [39], and Taddia et al. [40], there is a paucity of research on the effectiveness of UAV-based benthic discrimination and quantification of multiple submerged taxa using RGB imagery in non-wadeable rivers.
This study employed an inexpensive (< 1500 USD) UAV with an RGB camera and used a machine learning algorithm to investigate how depth and solar angle influenced benthic primary producer identification and quantification in a non-wadeable river in northern California. The Klamath River is an ideal system to test the effectiveness of high-resolution aerial imagery to quantify benthic primary producer assemblages in a deep river because of its high rates of productivity, high associated algal biomass [44,45], and relatively high optical depth at baseflow. Also, because the Klamath River is dominated by swift currents and areas of depth > 1 m, surveying benthic primary producers using traditional transect survey methods designed for wadeable rivers is not possible [46,47]. Furthermore, monitoring changes in primary producer assemblages is needed to track changes in flow management, restoration activities, climate change, and the planned removal of four large dams along this river [48,49]. This study analyzed aerial images at 32 sites that had variable primary producer assemblages within the Klamath River during June and July of 2019. Research objectives were to: (1) classify submerged filamentous algae and rooted macrophytes using a Random Trees classification algorithm; (2) evaluate the accuracy of this classification scheme based on in-situ river surveys; (3) investigate the maximum depths and optimal solar angles at which submerged filamentous algae and rooted macrophytes can be detected with an RGB camera on board a UAV; and (4) quantify the percent cover of filamentous algae and rooted macrophytes at river locations with variable primary producer assemblages. This paper assesses the efficacy of RGB aerial imagery to identify and quantify multiple taxa of submerged filamentous algae and rooted macrophytes in a non-wadeable river, thereby providing a low-cost and accessible methodology to supplement current in-situ survey methods. Section 2 provides an overview of the study sites, technological components, data acquisition, and data processing methods. Section 3 focuses on the reported classification accuracies and distribution of submerged filamentous algae and rooted macrophytes throughout the study sites. Finally, Section 4 and Section 5 discuss limitations, recommendations, and applications of this study.
2. Materials and Methods
This section describes the study sites, aerial imagery and in-situ data collection methods, image processing and validation techniques, and percent cover calculation methods used in this study.
2.1. Study Sites
The 40,600 km2 Klamath River watershed spans south-central Oregon and northwestern California, USA (Figure 1). The Klamath River starts at the outflow of Upper Klamath Lake in Oregon (42.3996° N, −121.8777° E), and travels approximately 420 km to the Pacific Ocean (41.5430° N, −124.0750° E). Free-flowing tributaries contribute substantial water during rain and snowmelt periods (generally October–May/June), with tributaries increasing in size and frequency with greater proximity to the Pacific Ocean. Summer base flows stabilize in July and August, when the outflow from Iron Gate Dam is the primary source of water to the river (mean August discharge from 2000 to 2019 is 27 m³ s−1, USGS Gage 11516530) until the confluence with the Trinity River, 262 km below the outflow of Iron Gate Dam. Flows from the Trinity River greatly increase flows below Iron Gate Dam (mean August discharge from 2000 to 2019 = 26 m³ s−1, Trinity River USGS Gage 11530000), which, combined with the contribution of smaller tributaries, result in August base flows of about 81 m³ s−1 near the river mouth (Klamath River near Klamath, USGS Gage 11530500). The Klamath River is a non-wadeable river due to both excessive depth and velocity, even during summer baseflow periods. This study examined benthic primary producer assemblages (submerged rooted macrophytes and filamentous algae) in June and July of 2019, as this is peak primary productivity season in the Klamath River [44,45], a time of lower flows, and when water clarity is sufficient to remotely sense benthic and emergent primary producers [50].
The upper watershed which supplies flows at Iron Gate Dam supports heavy agricultural use, including water withdrawals for irrigation and increased nutrient runoff [51], resulting in lower peak flows and increased nutrient concentrations to the Klamath River. A series of 4 hydroelectric dams located between 61 and 113 km below the Upper Klamath Lake outflow (Figure A1) alters flow within the river and reservoirs and increases hydrologic stability below the dams [52]. High nutrient concentrations and stable flows support high rates of riverine primary productivity and substantial autotrophic biomass in the Klamath River [44], with peak proliferations typically occurring below Iron Gate Dam in early summer. Standing stock of primary producers includes dense beds of filamentous algae and rooted-aquatic plants, such as Cladophora sp., Potamogeton sp., and Elodea sp. Both rooted aquatic plants and filamentous algae create seasonally dense plant and algal patches [53] that are visible from river margins. Primary producer dominance changes longitudinally below the hydroelectric dams, shifting from rooted aquatic plant dominance to filamentous algae dominance downstream.
2.2. Data Acquisition
2.2.1. UAV Data
Aerial imagery was captured to classify submerged filamentous algae and rooted macrophytes and estimate percent cover of each class from 32 sites within ten reaches of the Klamath River (Figure 1) between Iron Gate Dam and Weitchpec, CA. Imagery was acquired using a DJI Phantom 4 Pro rotorcraft (DJI, Shenzhen, China) (Figure 2), using the native RGB 20 megapixel camera. This camera has an 8.8 mm focal length and a resolution of 5472 × 3648 pixels [54]. Flights were conducted for 15 to 20 min over each of the 32 sites, at flying heights between 19 and 104 m. This resulted in estimated ground sampling distances between 0.52 and 2.85 cm (Table A1). Single images per site that encompassed the width of the channel and included portions of each side of the riverbank in every photo were acquired. Images were captured manually (without an automated mission flight plan) at nadir above each site, avoiding sun glint to minimize the relative angle between the sun and surface ripples. The UAV was flown between 10:04 a.m. and 5:11 p.m. to correspond with in-situ transect surveys, from 26 June to 9 July 2019. The time of each UAV flight was converted to solar elevation in degrees (now referred to as solar angle) using the University of Oregon Solar Radiation Monitoring Lab’s Sun Chart Program (http://solardat.uoregon.edu/SunChartProgram.html). Solar angle helps predict the amount of solar glare that is reflected off the water’s surface and into the aerial sensor. No calibration panel was used for the RGB image analysis, and no atmospheric correction was applied, as this is often unnecessary for low-flying UAV image collection over a small region [55].
2.2.2. In-Situ Surveys
To validate the UAV imagery, in-situ surveys were conducted for rooted aquatic plants and filamentous algae along three to four transects (from one side of the river bank to the other) at each of the 10 reaches (Figure 3) in the Klamath River below Iron Gate Dam between 26 June and 9 July 2019. Reaches were surveyed starting at the reach closest to Iron Gate Dam, and ending near Weitchpec, CA. At each of the 10 reaches, the riverbed was surveyed to assess the coverage of aquatic vegetation. Reaches ranged from 1 to 8 km in length, based on river access points. Kayaks were used to float the 10 reaches, surveying six transects in each reach, with transects randomly chosen among variable habitats represented in the reach. Three to four out of the six transects per reach were selected for analysis based on corresponding UAV image quality and to reduce computational processing time. Each transect was a minimum of 100 m downstream from the previous transect, and attempts were made to survey transects with more pool-type and riffle-type characteristics. Each transect’s general habitat type was estimated based on river velocity and surface tension characteristics and classified as a run, riffle, or pool (Table A1). Areas of rapids and swift current were under-represented in surveys due to safety concerns and the general inability of a surveyor to access these swift sections. Transect selection was balanced with what was possible to survey safely, as well as what was representative of the reach; thus, transects were selected in the field while conducting these surveys. No transects were fully wadeable across the river, confirming that the mixed survey method of wading and snorkeling was necessary. Each in-situ survey was completed in about an hour per site.
Several variables were measured and collected during the in-situ surveys. At each transect, a shore-based field technician recorded longitude and latitude with a handheld Global Positioning System (GPS) (GPSMAP 76CSx, Garmin Inc., Olathe, Kansas) and a GPS-enabled GoPro Hero 5 (GoPro Inc., San Mateo, California), and measured wetted width with laser rangefinders from the river’s edge. The technician calculated the width of the channel using the rangefinders, and divided each transect into 11 evenly spaced quadrants, from one side of the riverbank to the other. When possible, the surveyor waded to each of the quadrant locations (Figure 2). However, when the river became too deep for wading (> 1–1.4 m, depending on river velocity), the surveyor transitioned to snorkeling. Individual quadrants were not surveyed along some transects due to especially swift or deep points (N = 56). At all transects, at least seven quadrants were surveyed. At each quadrant, the surveyor lowered a 40 × 40 cm weighted PVC square to the riverbed to visually estimate information about filamentous algae and rooted macrophytes. Filamentous algae coverage was recorded when filaments were > 2 cm long. For each species or genera observed in a quadrant (generally identified to species for rooted aquatic plants and genus for algae), the surveyor recorded the species or genus code, percent cover of the specific taxa, the substrate that the vegetation type was growing on, plant condition and color, and the average length of the plant or its filaments within the quadrant. Mat thickness was recorded in species without obvious filaments. Water depth was recorded using a marked depth stick (quadrants < 2 m deep) or sonar depth finder (quadrants > 2 m deep, Vexilar LPS-1, Vexilar, Minneapolis, Minnesota). To test the effect of increasing mean river depth on the detectability and classification accuracy of benthic primary producers, in-situ depth measurements were averaged per site. Discrete points within each site were also evaluated to assess the maximum depth detection of filamentous algae and rooted macrophytes in the aerial imagery. Turbidity was measured at deep portions (> 1 m) of a river reach by vertically deploying a Secchi disk from a kayak up to five times and taking an average. Secchi disk observations were not available at each reach due to depth limitations. Finally, the technician and UAV pilot recorded observational field notes regarding the composition of benthic filamentous algae and rooted macrophytes 100 m upstream and 100 m downstream of each transect by kayaking and collecting samples from sizeable patches (> 1 m2) to assist in the image classification and validation processes.
2.3. Image Classification
A supervised classification scheme was employed to categorize image pixels into several classes after images were chosen. First, all aerial photos were reviewed and 3 to 4 images from each of the 10 river reaches were selected based on image quality and in efforts to reduce computational processing time. A total of 32 images (out of 60 images) were chosen for analysis after visually inspecting all photos and selecting the highest-quality images that had reduced sun reflection and glare, variation of in-situ depth measurements, and were captured at a nadir camera angle. In addition to image quality, these 32 images were subjectively selected to reduce image processing time associated with classifications and percent cover estimates. A single-image analysis approach was used in which only one image per site was analyzed (orthomosaics were not constructed for each site) due to challenges in stitching aerial images over a uniform surface such as water. Image metadata was then extracted using the uasimg R package [56] and incorporated to map centroids and footprints of images, as well as to estimate ground sampling distance and above ground altitude of each image. Yaw was manually corrected using Georeference tools in ArcGIS Pro 2.5 (Esri, Redlands, California).
Known GPS locations and visual observation were used to train and classify the UAV imagery into a six-class schema (1. algae, 2. macrophytes, 3. water, 4. land, 5. shadows, and 6. sun glint) with a machine learning algorithm. To detect these classes within the imagery, in-situ validation locations within each image were identified using GPS coordinates extracted from metadata on the GPS devices. It is important to acknowledge that positioning and alignment errors are introduced from the GPS devices used in the river, as well as from the Phantom 4 Pro internal GPS and subsequent EXIF modeling that depends on x, y, and z coordinate values. These errors were minimized by manually aligning images using high resolution basemaps in ArcGIS Pro and Google Earth, comparing river width measurements using ArcGIS Pro tools and in-situ width measurements from laser rangefinders, overlaying several estimated GPS coordinates (GoPro, Garmin, UAV) within the map, and visually detecting the quadrant and surveyor within the photo. When neither the quadrant nor swimmer was visible in the imagery, training sample pixels were selected from regions identified in the visual observation notes that were taken during aerial missions.
Algae and macrophyte classes were identified within UAV photos by incorporating information from in-situ quadrant measurements that had 80% cover or more of either class, resulting in 162 quadrants used for filamentous algae classification and 46 quadrants for rooted macrophyte classification. These data were used to justify the ‘pure pixel’ assumption employed when selecting samples for classification. All filamentous algae and macrophytes in this study were submerged, and it was assumed that any algae or macrophyte pixels that were visible from above the water’s surface represented only one class (thus were considered ‘pure pixels’). The algae and macrophyte classes were categorized generally, without classification to the species or genus level, and filamentous algae (no diatoms) composed the algae class. The water class included any portion of the river in which filamentous algae or rooted macrophytes were not visible, including wetted channels and riverbed. The land class included any rocks, grass, trees, sand, or otherwise surrounding environment adjacent to the river. The shadows class included dark shadow pixels throughout an image, while the sun glint class involved highly reflective solar glare pixels on the surface of the water. Not all classes were represented in every image.
After creating the class schema, a Random Trees pixel-based supervised classifier was trained and applied to all image pixels in ArcGIS Pro. Roughly 50–80 training sample polygons were selected per class by visually identifying sample pixels of all classes except algae and macrophytes, which were verified with in-situ quadrant surveys and visual observation notes written concurrently during each aerial mission. To minimize error, ‘pure pixel’ samples (containing only pixels of the class) were created by selecting pixels from the center of a patch and with a minimum number of 3 pixels. Each image was classified using a Random Trees classifier (30 maximum number of trees, 30 maximum tree depth, 1000 maximum number of samples per class). This algorithm iteratively classifies an image using a random subset of training pixels to form a group of decision trees. Samples are classified based on the majority “vote” of the trained decision tree label outputs [57,58]. This machine learning algorithm was chosen because it reduces computational load, particularly compared to other ensemble classifiers such as boosting and bootstrap aggregating [59], and it is less prone to overfitting data, as artificial neural networks [60] and maximum likelihood classification [61] have been reported to do. Furthermore, Random Trees has low error rates of classification [62] in comparison to support vector machines and artificial neural networks [63], and this method is well suited for studies involving multiple sources of remote sensing imagery [59], as in this study in which each image is analyzed separately. Finally, the Random Trees method was chosen over OBIA because of its ability to detect heterogeneous environments [64], such as the fine-scale combinations of filamentous algae and rooted macrophyte patches that are common in the Klamath River [65].
2.4. Validation
UAV imagery classifications were validated using the in-situ survey data and visual observations recorded in the field. The predicted class was compared against the observed class to validate sampling points, and additional variables such as solar angle were analyzed to help understand the factors affecting classification accuracy. The accuracy was assessed by creating an error matrix to calculate errors of omission, errors of commission, and the overall accuracy using the in-situ transect measurements as reference data, and visual observations to increase the spatial distribution of validation. In this context, omission error can be described as how often filamentous algae in the river is omitted from the proper class, while commission error is how often pixels identified as filamentous algae in the image are incorrectly classified [19]. Overall accuracy describes the proportion of correctly mapped pixels out of the total number of reference pixels. In this study, the overall accuracy, and not the kappa coefficient, is reported following best practices to omit the latter metric in imagery classification accuracy assessments [66,67]. ArcGIS Pro 2.5 was used to calculate omission error, commission error, and overall accuracy by assigning ground reference values to 50–100 stratified random points (randomly distributed based proportionally on the area of each class) per image and computing an error matrix.
2.5. Percent Cover Estimates
The percent cover of filamentous algae and rooted macrophytes was estimated based on UAV image classifications to ascertain the spatial distribution of these groups within the Klamath River between Iron Gate Dam and Weitchpec, CA. All filamentous algal species that were classified in the imagery were pooled into one percent cover class (“algae”), and all rooted macrophyte species classified in the imagery were grouped to form another separate percent cover class (“macrophytes”) [68]. To maintain a standardized number of pixels per image, all images were resampled to 0.014 m (the average resolution of all 32 images), and then clipped using a bounding box of 48.8 m × 48.8 m to mimic a 40 cm × 40 cm quadrant at 160 feet (48.8 m) flight altitude. Next, rasters were converted to polygons (simplified polygons with multipart features), and summary statistics were performed on the area of each class. ArcGIS Pro 2.5 tools, including Resample, Extract by Mask, Raster to Polygon, and Summary Statistics were used within ArcGIS ModelBuilder. Finally, percent cover was calculated by dividing each class’ area by the total number of pixels in the image. Although each image was initially classified using the six-class schema described above, the land class was excluded from the filamentous algae and rooted macrophyte percent cover estimates to more accurately depict these classes within the river rather than within the entire image. Filamentous algae and macrophyte percent cover estimates within the UAV imagery were then compared to the in-situ quadrant class cover estimates per site using a linear regression [69] with the ggplot2 package [70] in R version 3.6.3 software [71].
3. Results
This section details this study’s findings pertaining to image classification outcomes in relation to depth and solar angle, as well as percent cover estimates of benthic filamentous algae and rooted macrophytes calculated throughout study sites via aerial imagery classifications and in-situ surveys.
3.1. Random Trees Classification Results
Overall accuracy of all classes (algae, macrophytes, water, land, shadows, sun glint) from the Random Trees supervised classification of 32 sites of the Klamath River was 82% (Table 1). Commission error was lowest for the water class (5%) and highest for the macrophyte class (41%), while omission error was lowest for the shadows class (5%) and highest for the land class (32%). The algae class had lower commission error (27%) but higher omission error (17%) than the macrophyte class (41% commission error and 12% omission error). For individual sites, overall accuracy was highest at Weitchpec site 2 (WE 2) (95%) and lowest at Rocky Point site 4 (RP 4) (66%) (Table A1). Weitchpec site 2 (WE 2) and Happy Camp site 1 (HC 1) had the lowest commission error of all 32 images’ algae classes at 0%, while Above Interstate 5 site 5 (I5 5) had the lowest commission error of all images’ macrophyte classes at 10%. For groups of sites, Weitchpec (WE) reach sites (N = 4) had the highest overall accuracy (89%) of all 32 sites, and Brown Bear (BB) reach sites (N = 3) had the lowest (73%) overall accuracy.
Results demonstrated that depth and solar angle impacted the classification accuracies of the UAV imagery. Generally, overall accuracy increased with average depth per transect up to about 2.75 m (in-situ depth measurements ranged from 0 to 9 m) (Figure 4). While the adjusted R2 value was very low (adj R2 = 0.115) between average depth per transect and overall accuracy, these results were statistically significant (p-value ≤ 0.05). To further understand the effects of solar angle and depth on accuracy, images were organized into three overall accuracy groups using Jenks natural breaks categorization: 1 (greater than 84% accuracy, N = 14), 2 (greater than 74% and less than or equal to 84% accuracy, N = 10), and 3 (less than or equal to 74% accuracy, N = 8). The majority of images in group 1 (highest overall accuracy) had solar angles between 47.5 and 58.72° (10:04 a.m. and 11:21 a.m., N = 5) or between 48.5 and 62.69° (2:53 p.m. and 4:16 p.m., N = 5), and had an average depth of 1.71 m. Most images in group 2 (second highest overall accuracy) had solar angles between 71.06 and 62.59° (1:32 p.m. and 2:54 p.m.), and had an average depth of 1.45 m. Finally, the majority of images in group 3 (lowest overall accuracy) had solar angles between 62.72 and 71.2° (11:40 a.m. and 1:17 p.m.), and had an average depth of 1.19 m. Throughout this study, solar noon occurred between 1:13 p.m. and 1:20 p.m. (at about a 71° solar elevation angle). Times either before or after solar noon (particularly in the range of about 45 to 60° in the morning or afternoon) rendered the best imagery with both the most illumination of the substrate and least solar glare on the surface (which is heightened around solar noon).
The spectral signals of this study’s six classes can be described by the digital numbers captured by the native Phantom 4 Pro UAV RGB camera (Table A2). The algae class had the highest reflectance in the green band and second highest in the blue band, while the macrophyte class had highest values in the green band, followed by the red and then blue bands. The water class had the highest reflectance values in the blue band, and the land class had equal digital number values in the red and green bands. The shadows and sun glint classes each had equal digital numbers in their respective red, green, and blue band values.
3.2. Study Site Characteristics and Percent Cover Estimates
Rooted macrophytes dominated a majority of upstream reaches (I5 through Happy Camp), while filamentous algae dominated downstream reaches closer to the Pacific Ocean (Old Man River through Weitchpec). The I5 site 1 (I5 1) location had the highest macrophyte percent cover (31%), and the Old Man River site 2 (OMR 2) had the highest algae percent cover (39%) (Figure 5). While filamentous algae were present at upstream sites (I5 to HC), no macrophytes (0%) were detected in the aerial imagery at Happy Camp site 4 (HC 4) or at any sites downstream of this location.
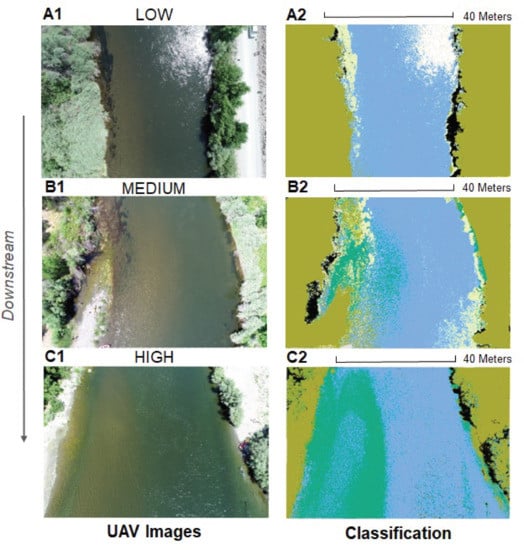
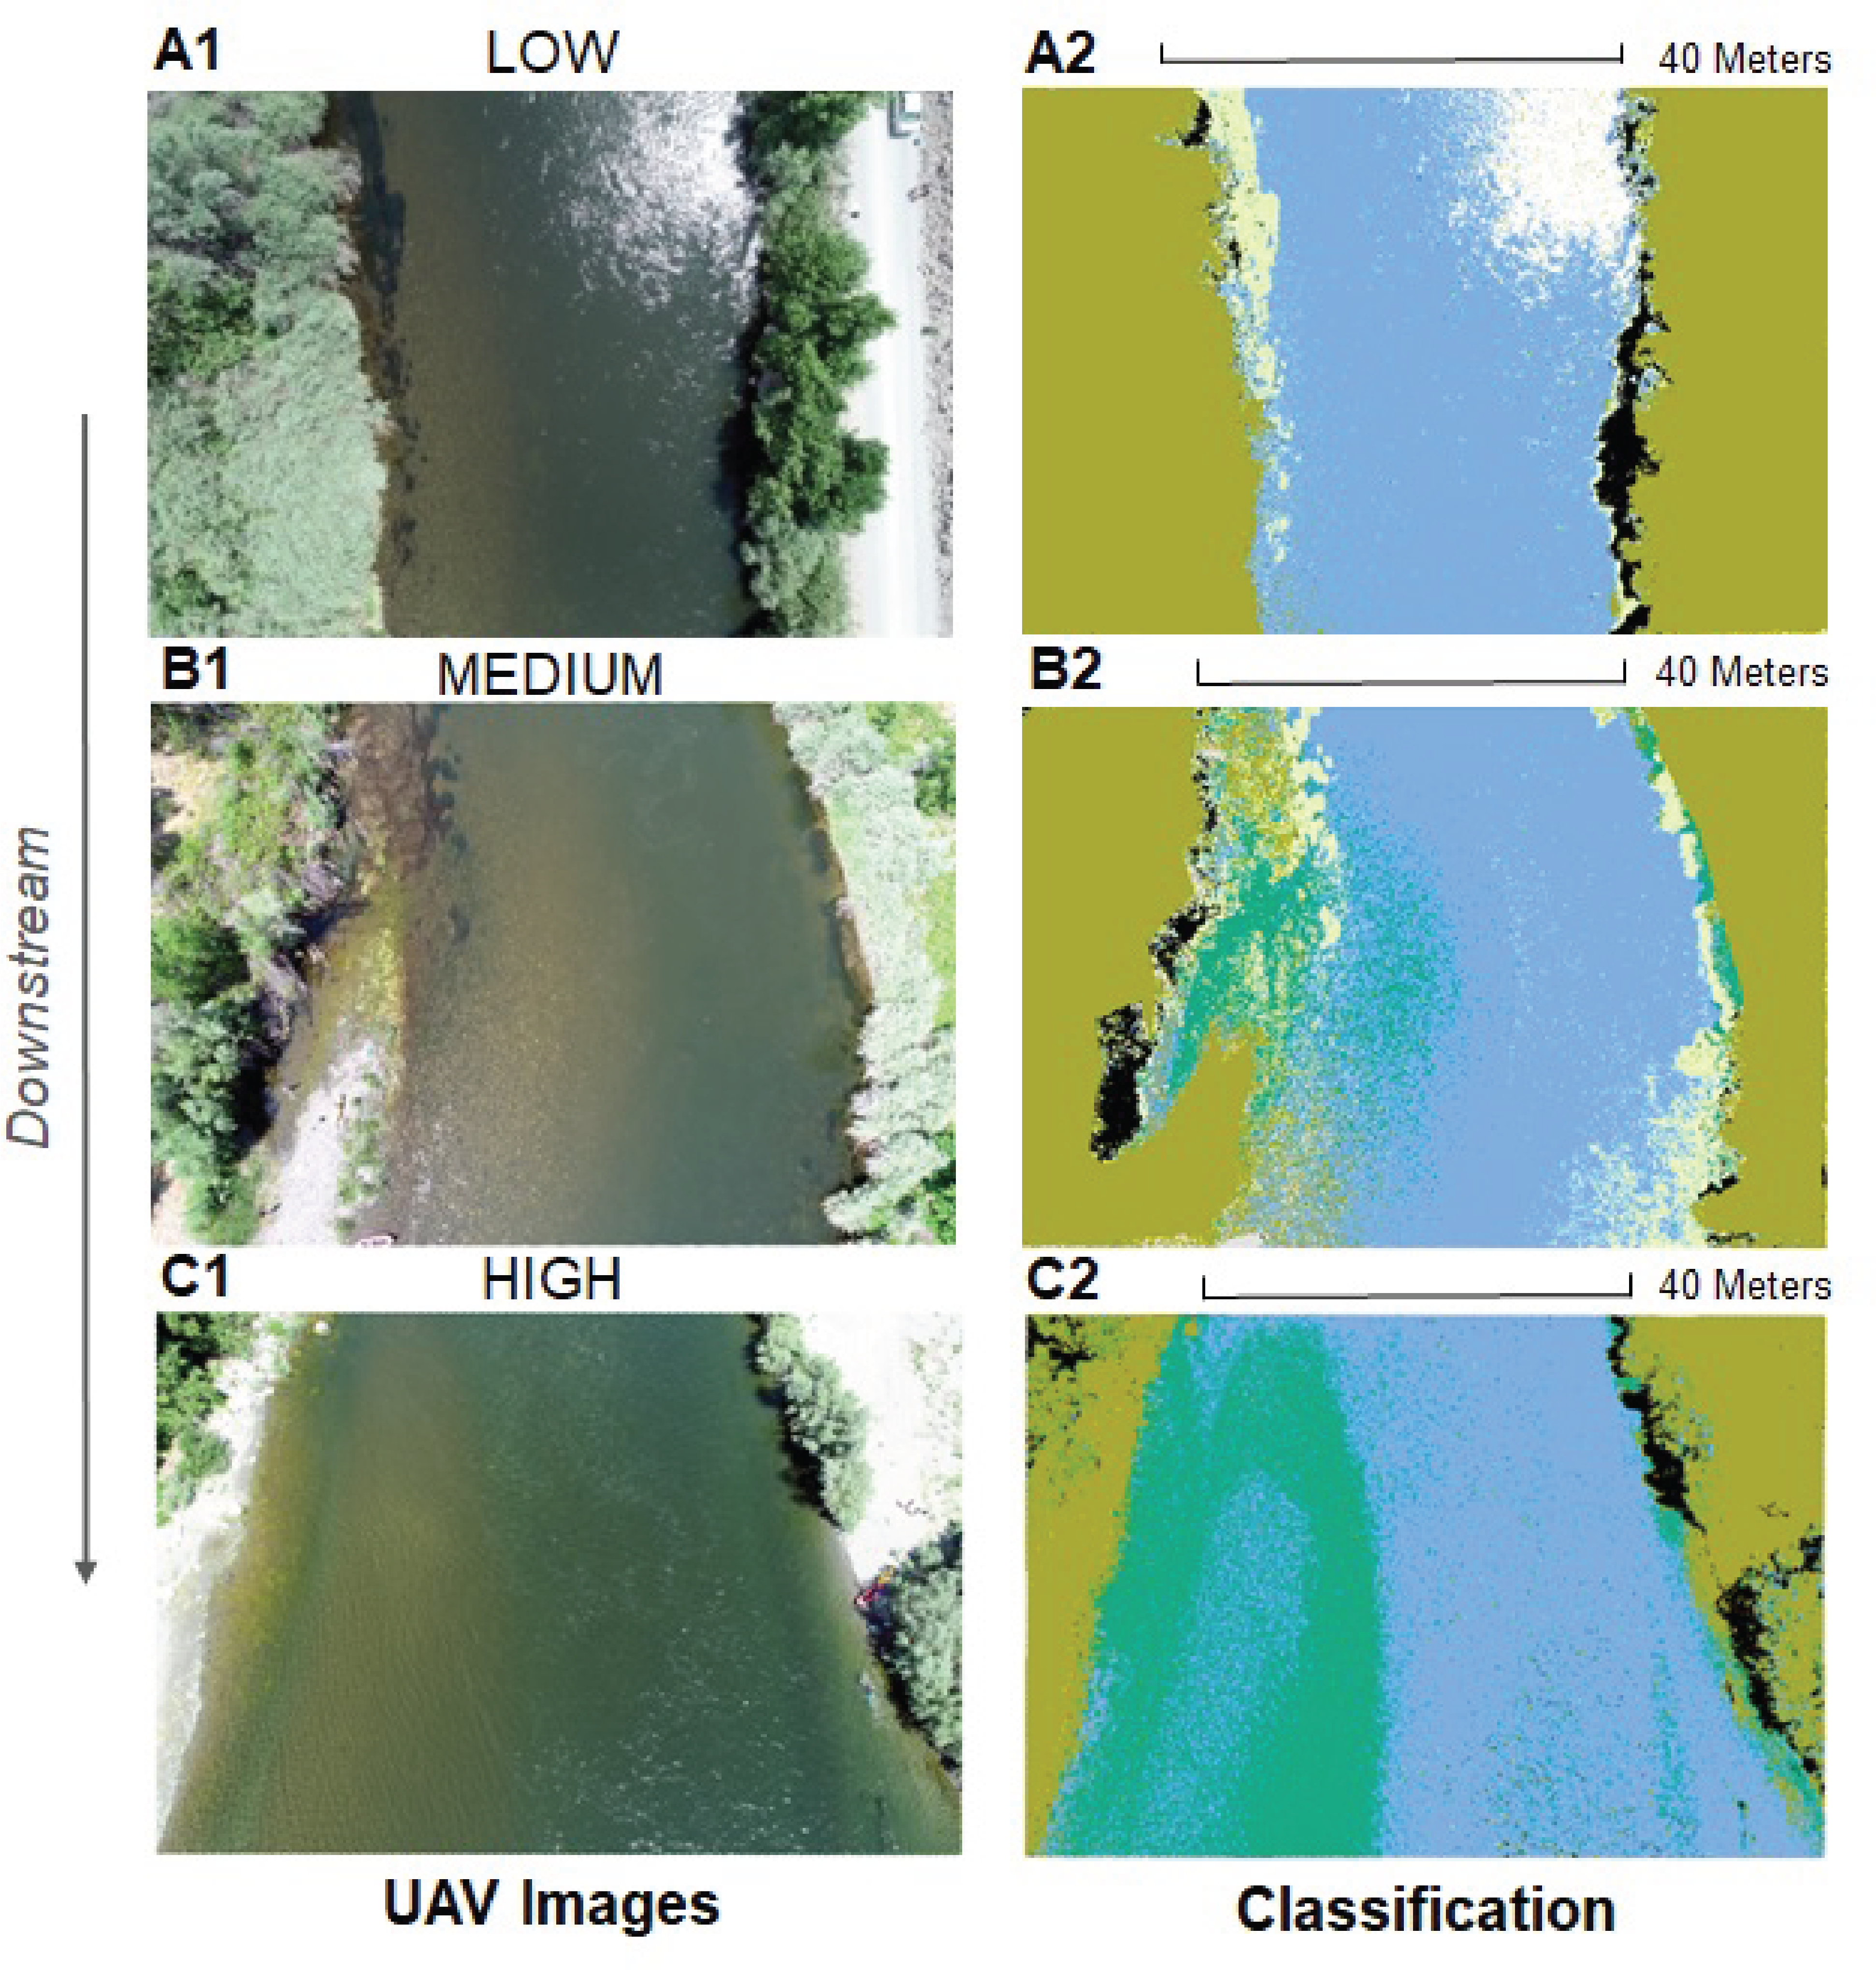
To illustrate the changes in percent cover of submerged filamentous algae and rooted macrophytes moving downstream along the river, three examples that depicted low, medium, and high percent cover of UAV images were selected and their respective Random Trees classification results were displayed (Figure 6). Tree of Heaven site 5 (TH 5) had low filamentous algae percent cover (0% algae, 7% macrophytes), as was commonly observed in upstream sites within close proximity to Iron Gate Dam. Brown Bear site 6 (BB 6) displayed equal percentages of filamentous algae and macrophytes (13% algae, 13% macrophytes) and represented a medium concentration of percent cover for the 32 sites in this study. Finally, Old Man River site 2 (OMR 2) was selected to display a high amount of primary producer percent cover because aerial imagery over this location detected the highest amount of filamentous algae of all sites (39% algae, 0% macrophytes). This site is representative of downstream sites below Happy Camp site 4, below which no rooted macrophytes were detected. Figure 6 also helps demonstrate the increase in channel width as the Klamath River approaches the Pacific Ocean.
The relationship between in-situ and UAV-based percent cover estimates of submerged filamentous algae and rooted macrophytes was assessed within the 32 sites to understand how aerial imagery results compared to river survey results. UAV percent cover estimates were moderately correlated to in-situ quadrant percent cover estimates for both the filamentous algae and macrophyte classes (algae: Pearson’s r = 0.51, macrophytes: Pearson’s r = 0.72), indicating a moderately strong linear relationship between each variable per dataset. Although the filamentous algae and macrophyte classes for UAV imagery and in-situ data had low and moderate adjusted R2 values (algae: adj R2 = 0.23, macrophytes: adj R2 = 0.50), this result was statistically significant (p-value ≤ 0.05) (Figure 7). Thus, the null hypothesis that there is no relationship between the UAV and in-situ percent cover measurements for both filamentous algae and rooted macrophyte observations was rejected. For algae measurements, the residual standard error, or the average amount the response variable (algae) diverged from the regression line [72] was 9.214 with 30° of freedom. The residual standard error for macrophyte measurements is 7.208 with 30° of freedom. The F-statistic, an indicator of significance between the groups of observations, was relatively low for algae (10.49) and moderate for macrophyte (32.01) measurements.
Results from this study indicated that filamentous algae were more easily detected and quantified in deeper regions and often inhabited areas farther from the riverbanks than did macrophytes below Iron Gate Dam. The filamentous algae class had high overall accuracy (overall accuracy of 80% or more and in-situ percent cover of 80% or greater per quadrant) down to a depth of 1.9 m, while rooted macrophytes (overall accuracy of 80% or more and in-situ percent cover of 80% or greater per quadrant) were accurately classified down to 1.2 m below the water’s surface at discrete locations. Within the 32 sites, in-situ quadrant observations revealed that submerged rooted macrophytes generally grew at shallower depths than filamentous algae (0.83 m mean for rooted macrophyte in-situ percent cover > 0% per quadrant, 1.2 m mean for filamentous algae in-situ percent cover > 0% per quadrant). On average, rooted macrophytes grew within 7.7 m from either side of the bank within the 32 sites, and filamentous algae were most commonly found within 8.7 m from either bank. In the 32 sites analyzed, rooted macrophytes and filamentous algae both most frequently inhabited straight sections of the river that had lower river velocity (< 1 m sec−1) or in relatively shallow areas along banks.
4. Discussion
This study demonstrates that an inexpensive UAV equipped with an RGB camera is a useful tool for detecting and quantifying multiple types of submerged primary producers in a non-wadeable river. Filamentous algae and rooted macrophyte coverage had > 70% overall accuracy at 28 of 32 sites, and water surface solar reflection was the primary factor limiting the ability to assess submerged vegetation coverage. Along the 32 sites distributed among 10 reaches beginning below a series of large dams, there was greater dominance of rooted macrophytes upstream, transitioning to a greater dominance of filamentous algae at downstream sites. The larger spatial scale documented in UAV image capture can supplement current in-situ survey methods or provide a novel and useful method to assess primary producer coverage in rivers where in-situ surveys are not possible due to excessive depth or velocity.
4.1. UAV Monitoring of Benthic Primary Producers
This study’s UAV method resulted in the highest classification accuracy in river conditions with high water clarity and homogenous primary producer assemblages. In contrast, other researchers have found that classification accuracy decreased with river depth, particularly in water deeper than 3 m [42,73,74]. Our results were slightly different from these studies in that filamentous algae were more easily detected and quantified in deeper water (up to 2.75 m). In our system, water depth covaried with water clarity (Figure 4), largely as a result of the tributaries entering the Klamath River below Iron Gate Dam which tend to contribute relatively clearer water to the main stem, creating higher water clarity with distance downstream from the dam [75]. Deepening river channels created by high winter flows follow a similar longitudinal trend associated with these tributary inputs [76]. At the deepest sites with high overall accuracy, (Old Man River site 3: 2.09 m average depth, 90.38% overall accuracy; Orleans site 1: 2.75 m average depth, 92% overall accuracy; Weitchpec site 1: 2.69 m average depth, 91.3% overall average), conditions were optimal for capturing high-quality aerial imagery. At these sites, lower turbidity (Secchi depth between 2.1 and 4.4 m) (Table A1) was measured, and only filamentous algae (no rooted macrophytes) (Figure 5) was detected. Having only one type of submerged primary producer to classify in each of these sites contributed to increased accuracy of the supervised classification [77,78] because it diminished the risk of conflated categorization. The counterintuitive finding that deeper river sites had higher accuracy when these deeper locations co-occur with lower turbidity reinforces previous findings that water clarity is a major predictor for how well imagery can be used to successfully detect and quantify submerged primary producers [43,79,80]. This demonstrates that UAV methods are not limited to shallow (< 1 m) rivers when turbidity is low and primary producer assemblages are homogenous.
This study was novel in that it attempted to classify both filamentous algae and rooted macrophyte groups using an RGB camera throughout a non-wadeable river [20,34]. However, there were instances of class confusion between filamentous algae and rooted macrophytes. In some dense areas of aquatic vegetation, algae grew on rooted macrophytes, making class separation challenging. In these cases, spectral unmixing may be a more suitable classification approach [81,82]. Furthermore, in-situ surveys along a single transect left several unknown or unidentified points of interest in the UAV imagery, making class discrimination challenging. Also, both algae and macrophyte classes had the highest spectral signals in the green band (Table A2), which further exacerbated confusion between these classes [83]. Some algae genera (Cladophora, Oedogonium) and macrophyte species (Zannichellia palustris, Potamogeton crispus) had both light and dark green reflectance values throughout the river, resulting in too much overlap of reflectance values to create a useful spectral library to identify filamentous algae and rooted macrophyte classes across all 32 images. Each image was classified individually, and the classifications were reduced to two distinct groups because creating spectral libraries for each image requires in-situ sampling and is time consuming. Due to the individual classification per image and lack of automation in this process, large sample sizes might not be well suited under these specific methods.
While OBIA is commonly used for high-resolution underwater classification of vegetation and wetland species [84,85], this study utilized a pixel-based supervised classification. Pixel-based methods facilitate the identification of large patches of rooted macroalgae or filamentous algae, as well as speckled and interspersed filamentous algae, both of which were common at study sites. Random Forest algorithms have proven successful in previous studies in complex, heterogeneous landscapes [19,85,86], demonstrating that this method can effectively reduce speckle and noise within imagery. To build on current work, future image analysis techniques that can be applied to benthic surveys in heterogeneous environments include aquatic vegetation indices, OBIA, structure from motion photogrammetry, and hyperspectral image capture [20,40,41,86,87,88,89].
One of the most prominent challenges to achieving high classification accuracy in this study involved solar glare, which is affected by solar angle, wind, and ripples or surface tension on the water [90,91,92,93]. In this study, the sun’s reflection produced large white spots in photos that were taken close to solar noon (around 71° solar angle in this study), thus making detection below the surface impossible. Several images captured around solar noon had some of the lowest classification accuracy results (between 66% and 72%) due to issues related to solar angle and resulting glare. Wind and higher velocity water (> 1 m s−1), such as in areas with ripples, further exacerbated the prominence of solar glare and created distortions within the UAV imagery. These concerns affected how the 32 out of 60 total UAV images were selected for analysis, and several selected photos (n = 5) had sizable portions (between 8% and 12% of the image) of solar glare that prohibited visibility below the water’s surface. Flying on a uniformly cloudy day would also reduce solar glare, although detection capabilities may suffer as light penetration through the water column would be reduced [94].
Methods from this study can be applied to a variety of environments, including both freshwater and marine [88,95], and will perform best in clear and relatively shallow (< 2 m) waters. Given that classification accuracy was highest in regions with reduced water surface tension, such as in a pool or a slow-moving river run, techniques from this study would also be well-suited for lake environments [19]. Additionally, the Random Trees classifier most easily identified large, homogenous patches of algae and macrophytes, and would similarly perform well with other large groups of macroalgae and submerged aquatic vegetation, such as kelp or seagrass [96,97,98]. Despite these applications, this method is not optimal for distinguishing multiple aquatic species, as RGB imagery is spectrally sparse. Therefore, aerial hyperspectral sensors would be more effective in these scenarios [99,100].
Detection and quantification techniques in future studies might be complicated in water with increasing depth, turbidity, and confounding primary producer types [43,101], and accuracy will likely decrease as these conditions converge. Thus, times of higher river flows that increase water depth and turbidity, including spring snowmelt or autumn rains, are expected to result in lower accuracy of primary producer identification and quantification. Changing water levels associated with water year variation, dam management, and season are expected to influence primary producer assemblages [45,102,103] in addition to methodological accuracy, making complementary in-situ surveys important during variable conditions. Examples of expected changes to primary producer assemblages include lower overall coverage of rooted macrophytes during high-flow years, and seasonal progression of rooted macrophyte and filamentous algae coverage, resulting in lower coverage as macrophytes and algae slough in the fall [104,105].
4.2. Recommendations
Analysis of UAV photos using a single-image, supervised classification method for 32 sites proved to be time intensive due to the need to create a novel spectral library and separate classification for each high-resolution image. Ways to address this in future studies involve assessing fewer sites and spectrally correcting the imagery in order to apply a uniform spectral library to all photos. While this study represented a static glimpse of conditions on the Klamath River at 32 individual locations, this method can successfully be applied to smaller-scale river studies with greater temporal scale, such as time series or change analyses of benthic communities in small sections of a river. For example, managers can adapt this technique to capture aerial images of the same river location each month to help answer how specific filamentous algal communities in one region of a river change in response to seasonal dam-altered flow regimes. While this small-scale study is best suited for small rotary-wing UAVs, pilots who are designing future projects may consider employing a larger rotary-wing UAV with additional power capacity when surveying larger portions of a river [106].
For monitoring greater river extents (> 100 m river length per site), it is helpful to consider flight altitudes, platforms, and study site characteristics before conducting a UAV-based benthic primary producer study. A flight plan at high altitudes (above 100 m) is recommended to both avoid obstacles (such as trees, power lines, and bridges) and assist in the image stitching process in order to create orthomosaic maps of large swaths of the river. When generating orthomosaics, researchers should use real-time kinematic GPS, or have ground control points, secured markers or landmarks with known GPS locations, or slivers of land in the images to facilitate image stitching [40,107,108]. When target algal or macrophyte patches are identifiable at large spatial scales, or when higher spectral resolution is required to discern among taxa, high-resolution satellite imagery can be an alternative to UAV imagery [109]. Fixed-wing UAVs may be difficult to fly in meandering river environments unless there are open riverbanks or roads adjacent to the study sites that can be used for take-off and landing [110]. As river survey extent increases, UAV data increases, thereby posing additional constraints to computational processing time. The sampling and image capture methods described in this study are broadly applicable to benthic primary producer studies, but caution should be taken when attempting to apply this technique to large spatial extents due to computational and logistical constraints. In summary, this study’s methods are best suited for smaller-scale studies across time, rather than across space.
Another recommendation includes changing the order of the in-situ sampling protocol that was employed in this study. Instead of simultaneously conducting an in-situ transect survey and flying a drone overhead, it is more effective to capture aerial imagery first, identify several target sampling areas in the UAV photo, and then collect samples and observations in discrete locations of the river to reflect target areas within the photo. Also, including in-situ biomass calculations of filamentous algae and rooted macrophytes to the sampling protocol would augment percent cover estimates. Finally, incorporating a spectral calibration target and a corrective optical equation [36] would allow managers to apply a spectral library to the entire UAV image dataset, which would reduce time spent on individual classifications and increase the ability to discriminate among different submerged taxa.
4.3. Management Applications of UAV Monitoring in Non-Wadeable Rivers
UAV imagery is useful in detecting and quantifying submerged primary producer assemblages, and can be integrated into monitoring programs where current monitoring is limited or non-existent. Algae and aquatic plants are sensitive to ecosystem change, making them useful indicators of ecosystem health [111,112]. The type, distribution, and condition of algae and aquatic plants can drive water quality (pH, dissolved oxygen, suspended sediment, water temperature) and fisheries health (food resources, habitat), making quantification of these taxa useful in identifying mechanisms responsible for ecosystem change [7,111,113,114]. In non-wadeable rivers such as the Klamath River, documentation of aquatic plants and algae is generally limited to wadeable areas easily accessible from shore, where the primary producer assemblage may not be representative of the river reach [45]. In this study, UAV photos expanded the spatial scale of the surveyed area, and included areas generally ignored in established survey methods, including areas > 1 m deep, areas of swift current, and zones not adjacent to shoreline river access points. Although aerial images cannot capture the taxonomic detail with the same accuracy as in-situ surveys or samples collected for laboratory analysis of species composition, the larger spatial scale can help address other research questions and monitoring goals. Ultimately, combining in-situ and UAV methods will likely provide the most thorough monitoring practice.
UAV images can be used to track ecosystem change associated with management actions and restoration expected to influence primary producer assemblages. The Klamath River and many larger rivers are considered impaired due to high aquatic plant and algae biomass, spurring management actions aimed at reducing these proliferations [65,115]. In the case of the Klamath, nutrient criteria are set by water quality management agencies, but challenges with monitoring aquatic plant and algae growth limit the ability to monitor the effectiveness of regulatory nutrient reductions and restoration actions [116,117]. In rivers where confounding factors are expected to influence benthic algae growth, including nutrients, flow, and water clarity, alterations including dams and associated flow management can further influence growth patterns of algae and aquatic plants [118,119]. Where restoration has the potential to alter algae and aquatic plant assemblages, as is the case in the proposed removal of the four large hydroelectric dams (Figure A1) on the Klamath River [120], monitoring these assemblages with UAV-based techniques provides a promising opportunity to learn about the effects of large-scale restoration on non-target taxa that may otherwise be challenging to monitor. In cases in which analytical expertise may not be available, UAV imagery can still be collected to document conditions before and after management actions so that data can later be analyzed.
5. Conclusions
Employing a pixel-based Random Trees supervised classification on RGB images from a low-cost UAV is an effective technique to classify and quantify both benthic filamentous algae and rooted macrophytes in a non-wadeable river. Although increases in water-column turbidity, water depth, and complex species assemblages can decrease the accuracy of rooted macrophyte and filamentous algae quantification, overall accuracy was 82% at the 32 assessed sites. This study fits within the level of accuracy of similar studies analyzing submerged aquatic vegetation coverage in clear water at shallow depths (< 1 m) [19,85,86,121], and results verified that these methods can be applied in deeper bodies of water, both freshwater and marine, that have high water clarity. These findings also expand on existing research by suggesting that classifying vegetation categories and assessing images in mixed vegetation assemblages, in addition to single taxa-dominant ecosystems, is possible with an RGB camera. It is recommended that future studies collect aerial imagery between about 45 to 60° of solar elevation angle in the morning or afternoon to reduce solar glare. Photos taken around solar noon should generally be avoided to diminish the effect of solar reflection. Future analysis involves incorporating in-situ biomass calculations to augment percent cover estimates, and further investigating the utility of multispectral imagery detection at depths deeper than 1 m below the surface. Methods from this study are not suited for a purely white-water river caused by wind and rapids due to visibility issues related to solar glare and water surface tension. Instead, this study’s methods are particularly useful in inaccessible study regions that host large, homogenous patches of submerged filamentous algae or macrophytes in relatively shallow (< 2 m) and clear water.
As UAVs become a common tool used by research and monitoring groups, the potential to increase ecosystem monitoring in environments not previously accessible and on larger spatial scales is expanding. Capturing aerial imagery is relatively efficient and can be combined with other sample collection efforts as part of regular water quality monitoring programs. These images can be cataloged for later assessment, which may prove incredibly valuable in the cases of retrospective monitoring of unplanned management actions, natural variation in ecosystem condition, or other changes. The collection of UAV images from established long-term study sites will be comparable through time to assess temporal changes with limited in-situ data, and aerial images collected in conjunction with in-situ samples will be informative in aquatic system management and decision-making.
Author Contributions
Conceptualization, C.K., L.G.; data curation, C.K., L.G.; formal analysis, C.K.; methodology, C.K., L.G., A.L.; project administration, C.K., L.G., M.K.; validation, C.K., L.G.; writing—original draft, C.K., M.K.; writing—review and editing, C.K., L.G., A.L., M.K. All authors have read and agreed to the published version of the manuscript.
Funding
This material is based upon work supported by the National Science Foundation Graduate Research Fellowship Program under Grant No. 1752814, the National Science Foundation under Grant No. DGE-1633831, and the National Science Foundation Data Science 4 the 21st Century (DS421) program.
Acknowledgments
We would like to thank the Karuk and Yurok tribes for their support, as well as Dr. Iryna Dronova for invaluable suggestions to the manuscript.
Conflicts of Interest
The authors declare no conflict of interest.
Appendix A
Figure A1.
Four hydroelectric dams along the Klamath River that are proposed for future removal.


Table A1.
Results from the 32 sites: overall accuracy, algae percent cover, macrophyte percent cover, estimated ground sampling distance (GSD), Secchi depth, habitat, average depth per site, solar angle, flight latitude (center point), and flight longitude (center point).
Table A1.
Results from the 32 sites: overall accuracy, algae percent cover, macrophyte percent cover, estimated ground sampling distance (GSD), Secchi depth, habitat, average depth per site, solar angle, flight latitude (center point), and flight longitude (center point).
| Reach | Name | Site | Overall Accuracy (%) | Algae (%) | Macro-phyte (%) | Estimated GSD (cm) | Secchi Depth (m) | Habitat | Avg. Depth (m) | Solar Elevation (Degrees) | Flight Latitude | Flight Longitude |
|---|---|---|---|---|---|---|---|---|---|---|---|---|
| 1 | I5 | 1 | 76 | 1 | 31 | 1.72 | 1.98 | run | 1.34 | 59.26 | 41.87464 | −122.55732 |
| 1 | I5 | 5 | 88 | 19 | 19 | 2.48 | 1.98 | run | 1.54 | 49.54 | 41.86690 | −122.56314 |
| 1 | I5 | 6 | 78 | 0 | 16 | 1.39 | 1.98 | run | 1.00 | 37.75 | 41.86408 | −122.56460 |
| 2 | TH | 3 | 80 | 0 | 27 | 1.18 | 2.53 | run | 1.75 | 71.06 | 41.82669 | −122.65785 |
| 2 | TH | 4 | 72 | 5 | 24 | 1.64 | 2.53 | run | 0.69 | 70.77 | 41.82578 | −122.65799 |
| 2 | TH | 5 | 90 | 0 | 7 | 1.46 | 2.53 | riffle | 0.53 | 66.38 | 41.82821 | −122.66158 |
| 3 | ABC | 1 | 72 | 14 | 17 | 1.53 | 3.05 | run | 0.93 | 63.76 | 41.86546 | −122.79469 |
| 3 | ABC | 3 | 83 | 21 | 0 | 2.85 | 3.05 | run | 1.22 | 70.72 | 41.86691 | −122.80595 |
| 3 | ABC | 6 | 76 | 11 | 11 | 1.04 | 3.05 | run | 1.97 | 69.87 | 41.86733 | −122.80884 |
| 4 | BB | 1 | 69 | 13 | 29 | 1.85 | 2.29 | run | 1.38 | 56.39 | 41.83120 | −122.95339 |
| 4 | BB | 2 | 69 | 20 | 20 | 1.33 | 2.29 | run | 1.28 | 62.72 | 41.83123 | −122.95296 |
| 4 | BB | 6 | 79 | 13 | 13 | 1.58 | 2.29 | run | 0.68 | 59.41 | 41.82330 | −122.96155 |
| 5 | RP | 2 | 86 | 11 | 6 | 0.52 | 2.74 | run | 1.86 | 58.33 | 41.80778 | −123.11062 |
| 5 | RP | 4 | 66 | 35 | 0 | 0.55 | 2.74 | riffle | 0.96 | 71.20 | 41.81437 | −123.11721 |
| 5 | RP | 6 | 67 | 19 | 17 | 1.69 | 2.74 | run | 1.74 | 60.93 | 41.81620 | −123.12726 |
| 6 | SV | 2 | 88 | 10 | 0 | 0.92 | 2.29 | run | 1.30 | 45.70 | 41.84317 | −123.22069 |
| 6 | SV | 3 | 74 | 17 | 0 | 1.15 | 2.29 | run | 1.56 | 54.31 | 41.84914 | −123.22803 |
| 6 | SV | 6 | 92 | 24 | 4 | 0.96 | 2.29 | riffle | 1.22 | 70.72 | 41.85475 | −123.23216 |
| 7 | HC | 1 | 70 | 13 | 4 | 1.61 | 2.59 | run | 0.95 | 70.86 | 41.79296 | −123.36820 |
| 7 | HC | 2 | 78 | 18 | 15 | 1.48 | 2.59 | run | 0.69 | 69.26 | 41.79229 | −123.37003 |
| 7 | HC | 4 | 86 | 5 | 0 | 1.21 | 2.59 | run | 1.63 | 48.51 | 41.78779 | −123.38213 |
| 8 | OMR | 2 | 90 | 39 | 0 | 1.65 | 2.13 | run | 1.55 | 56.89 | 41.48296 | −123.51500 |
| 8 | OMR | 3 | 90 | 19 | 0 | 1.39 | 2.13 | run | 2.09 | 67.62 | 41.48145 | −123.51385 |
| 8 | OMR | 5 | 84 | 39 | 0 | 1.46 | 2.13 | run | 1.68 | 68.94 | 41.47694 | −123.51273 |
| 8 | OMR | 6 | 88 | 32 | 0 | 1.85 | 2.13 | run | 1.64 | 62.69 | 41.47543 | −123.51309 |
| 9 | OR | 1 | 92 | 18 | 0 | 2.20 | 4.42 | run | 2.75 | 54.08 | 41.31895 | −123.52479 |
| 9 | OR | 5 | 78 | 14 | 0 | 1.68 | 4.42 | riffle | 1.15 | 62.59 | 41.31102 | −123.52683 |
| 9 | OR | 6 | 87 | 3 | 0 | 0.63 | 4.42 | run | 1.81 | 52.02 | 41.30547 | −123.53338 |
| 10 | WE | 1 | 91 | 9 | 0 | 1.67 | 2.59 | run | 2.69 | 58.72 | 41.22923 | −123.65160 |
| 10 | WE | 2 | 95 | 21 | 0 | 0.57 | 2.59 | riffle | 1.63 | 68.89 | 41.20333 | −123.66201 |
| 10 | WE | 3 | 80 | 11 | 0 | 1.60 | 2.59 | run | 2.99 | 70.70 | 41.19162 | −123.67278 |
| 10 | WE | 5 | 91 | 19 | 0 | 1.16 | 2.59 | run | 1.70 | 57.54 | 41.18659 | −123.69190 |
Table A2.
Digital numbers (spectral signals) for UAV image classes in this study.
| Red | Green | Blue | |
|---|---|---|---|
| Algae | 0 | 168 | 132 |
| Macrophytes | 233 | 255 | 190 |
| Water | 115 | 178 | 255 |
| Land | 168 | 168 | 0 |
| Shadows | 0 | 0 | 0 |
| Sun glint | 255 | 255 | 255 |
References
- Dennison, W.C.; Orth, R.J.; Moore, K.A.; Stevenson, J.C.; Carter, V.; Kollar, S.; Bergstrom, P.W.; Batiuk, R.A. Assessing Water Quality with Submersed Aquatic Vegetation Habitat requirements as barometers of Chesapeake Bay health. Bioscience 1993, 43, 86–94. [Google Scholar] [CrossRef]
- Carpenter, S.R.; Lodge, D.M. Effects of submersed macrophytes on ecosystem processes. Aquat. Bot. 1986, 26, 341–370. [Google Scholar] [CrossRef]
- Wetzel, R.G. A Comparative Study of the Primary Production of Higher Aquatic Plants, Periphyton, and Phytoplankton in a Large, Shallow Lake. Int. Rev. Ges. Hydrobiol. Hydrogr. 1964, 49, 1–61. [Google Scholar] [CrossRef]
- Jones, J.; Collins, A.; Naden, P.; Sear, D. The Relationship between Fine Sediment and Macrophytes in Rivers. River Res. Appl. 2011, 28, 1006–1018. [Google Scholar] [CrossRef]
- Jan Stevenson, R.; Bothwell, M.L.; Lowe, R.L. (Eds.) Algal Ecology: Freshwater Benthic Ecosystem; Academic Press: Cambridge, MA, USA, 1996. [Google Scholar]
- Vadeboncoeur, Y.; Power, M.E. Attached Algae: The Cryptic Base of Inverted Trophic Pyramids in Freshwaters. Annu. Rev. Ecol. Evol. Syst. 2017, 48, 255–279. [Google Scholar] [CrossRef]
- Lusardi, R.A.; Jeffres, C.A.; Moyle, P.B. Stream macrophytes increase invertebrate production and fish habitat utilization in a California stream. River Res. Appl. 2018, 34, 1003–1012. [Google Scholar] [CrossRef]
- Duarte, C.M. Submerged aquatic vegetation in relation to different nutrient regimes. Ophelia 1995, 41, 87–112. [Google Scholar] [CrossRef]
- Torn, K.; Martin, G. Response of submerged aquatic vegetation to eutrophication-related environment descriptors in coastal waters of the NE Baltic Sea. Estonian J. Ecol. 2012, 61, 106. [Google Scholar] [CrossRef] [Green Version]
- Welch, E.B.; Jacoby, J.M.; Horner, R.R.; Seeley, M.R. Nuisance biomass levels of periphytic algae in streams. Hydrobiologia 1988, 157, 161–168. [Google Scholar] [CrossRef]
- Flinders, C.A.; Hart, D.D. Effects of pulsed flows on nuisance periphyton growths in rivers: A mesocosm study. River Res. Appl. 2009, 25, 1320–1330. [Google Scholar] [CrossRef]
- Dodds, W.K.; Gudder, D.A. The Ecology of Cladophora. J. Phycol. 1992, 28, 415–427. [Google Scholar] [CrossRef]
- Rørslett, B.; Johansen, S.W. Remedial measures connected with aquatic macrophytes in Norwegian regulated rivers and reservoirs. Regul. Rivers Res. Manag. 1996, 12, 509–522. [Google Scholar] [CrossRef]
- Biggs, B.J.F. Patterns in benthic algae of streams. In Algal Ecology: Freshwater Benthic Ecosystems; Academic Press: Cambridge, MA, USA, 1996; pp. 31–56. [Google Scholar]
- Biggs, B.J.F. Eutrophication of streams and rivers: Dissolved nutrient-chlorophyll relationships for benthic algae. J. N. Am. Benthol. Soc. 2000, 19, 17–31. [Google Scholar] [CrossRef] [Green Version]
- Hilton, J.; O’Hare, M.; Bowes, M.J.; Jones, J.I. How green is my river? A new paradigm of eutrophication in rivers. Sci. Total. Environ. 2006, 365, 66–83. [Google Scholar] [CrossRef]
- Smith, V.; Tilman, G.; Nekola, J. Eutrophication: Impacts of excess nutrient inputs on freshwater, marine, and terrestrial ecosystems. Environ. Pollut. 1999, 100, 179–196. [Google Scholar] [CrossRef]
- Aguirre-Gómez, R.; Salmerón-García, O.; Gómez-Rodríguez, G.; Peralta-Higuera, A. Use of unmanned aerial vehicles and remote sensors in urban lakes studies in Mexico. Int. J. Remote. Sens. 2016, 38, 2771–2779. [Google Scholar] [CrossRef]
- Husson, E.; Hagner, O.; Ecke, F. Unmanned aircraft systems help to map aquatic vegetation. Appl. Veg. Sci. 2014, 17, 567–577. [Google Scholar] [CrossRef]
- Brooks, C.N.; Grimm, A.G.; Marcarelli, A.M.; Dobson, R.J. Multiscale collection and analysis of submerged aquatic vegetation spectral profiles for Eurasian watermilfoil detection. J. Appl. Remote. Sens. 2019, 13, 037501. [Google Scholar] [CrossRef] [Green Version]
- Van Der Merwe, D.; Price, K.P. Harmful Algal Bloom Characterization at Ultra-High Spatial and Temporal Resolution Using Small Unmanned Aircraft Systems. Toxins 2015, 7, 1065–1078. [Google Scholar] [CrossRef] [Green Version]
- Kislik, C.; Dronova, I.; Kelly, M. UAVs in Support of Algal Bloom Research: A Review of Current Applications and Future Opportunities. Drones 2018, 2, 35. [Google Scholar] [CrossRef] [Green Version]
- Flynn, K.F.; Chapra, S.C. Remote Sensing of Submerged Aquatic Vegetation in a Shallow Non-Turbid River Using an Unmanned Aerial Vehicle. Remote. Sens. 2014, 6, 12815–12836. [Google Scholar] [CrossRef] [Green Version]
- Nowak, M.M.; Dziób, K.; Bogawski, P. Unmanned Aerial Vehicles (UAVs) in environmental biology: A review. Eur. J. Ecol. 2019, 4, 56–74. [Google Scholar] [CrossRef]
- Yang, B.; Hawthorne, T.L.; Torres, H.R.; Feinman, M. Using Object-Oriented Classification for Coastal Management in the East Central Coast of Florida: A Quantitative Comparison between UAV, Satellite, and Aerial Data. Drones 2019, 3, 60. [Google Scholar] [CrossRef] [Green Version]
- Díaz-Delgado, R.; Ónodi, G.; Kröel-Dulay, G.; Kertész, M. Enhancement of Ecological Field Experimental Research by Means of UAV Multispectral Sensing. Drones 2019, 3, 7. [Google Scholar] [CrossRef] [Green Version]
- Manfreda, S.; McCabe, M.; Miller, P.E.; Lucas, R.M.; Madrigal, V.P.; Mallinis, G.; Ben Dor, E.; Helman, D.; Estes, L.; Ciraolo, G.; et al. On the Use of Unmanned Aerial Systems for Environmental Monitoring. Remote. Sens. 2018, 10, 641. [Google Scholar] [CrossRef] [Green Version]
- Preskitt, L.B.; Vroom, P.S.; Smith, C.M. A Rapid Ecological Assessment (REA) Quantitative Survey Method for Benthic Algae Using Photoquadrats with Scuba. Pac. Sci. 2004, 58, 201–209. [Google Scholar] [CrossRef] [Green Version]
- Priddle, J. The Production Ecology of Benthic Plants in Some Antarctic Lakes: I. In Situ Production Studies. J. Ecol. 1980, 68, 141. [Google Scholar] [CrossRef]
- Pennuto, C.M.; Howell, E.; Makarewicz, J. Relationships among round gobies, Dreissena mussels, and benthic algae in the south nearshore of Lake Ontario. J. Great Lakes Res. 2012, 38, 154–160. [Google Scholar] [CrossRef]
- Suplee, M.W.; Watson, V.; Teply, M.; McKee, H. How Green is Too Green? Public Opinion of What Constitutes Undesirable Algae Levels in Streams. JAWRA J. Am. Water Resour. Assoc. 2009, 45, 123–140. [Google Scholar] [CrossRef]
- Beijbom, O.; Edmunds, P.J.; Roelfsema, C.; Smith, J.; Kline, D.I.; Neal, B.P.; Dunlap, M.J.; Moriarty, V.; Fan, T.-Y.; Tan, C.-J.; et al. Towards Automated Annotation of Benthic Survey Images: Variability of Human Experts and Operational Modes of Automation. PLoS ONE 2015, 10, e0130312. [Google Scholar] [CrossRef]
- Visser, F.; Wallis, C.; Sinnott, A.M. Optical remote sensing of submerged aquatic vegetation: Opportunities for shallow clearwater streams. Limnologica 2013, 43, 388–398. [Google Scholar] [CrossRef]
- Stanfield, K. Developing Methods to Differentiate Species and Estimate Coverage of Benthic Autotrophs in the Potomac Using Digital Imaging. Master’s Thesis, Hood College, Frederick, MD, USA, 2018. Available online: https://mdsoar.org/handle/11603/8764 (accessed on 1 March 2020).
- Silva, T.S.F.; Costa, M.P.F.; Melack, J.M.; Novo, E.M.L.M. Remote sensing of aquatic vegetation: Theory and applications. Environ. Monit. Assess. 2008, 140, 131–145. [Google Scholar] [CrossRef] [PubMed]
- Legleiter, C.J.; Roberts, D.A.; Marcus, A.; Fonstad, M.A. Passive optical remote sensing of river channel morphology and in-stream habitat: Physical basis and feasibility. Remote. Sens. Environ. 2004, 93, 493–510. [Google Scholar] [CrossRef] [Green Version]
- Kwon, Y.S.; Pyo, J.; Kwon, Y.-H.; Duan, H.; Cho, K.H.; Park, Y. Drone-based hyperspectral remote sensing of cyanobacteria using vertical cumulative pigment concentration in a deep reservoir. Remote. Sens. Environ. 2020, 236, 111517. [Google Scholar] [CrossRef]
- Mount, R. Acquisition of Through-water Aerial Survey Images. Photogramm. Eng. Remote. Sens. 2005, 71, 1407–1415. [Google Scholar] [CrossRef]
- Flynn, K.F.; Chapra, S.C. Evaluating Hydraulic Habitat Suitability of Filamentous Algae Using an Unmanned Aerial Vehicle and Acoustic Doppler Current Profiler. J. Environ. Eng. 2020, 146, 04019126. [Google Scholar] [CrossRef]
- Taddia, Y.; Russo, P.; Lovo, S.; Pellegrinelli, A. Multispectral UAV monitoring of submerged seaweed in shallow water. Appl. Geomatics 2019, 12, 19–34. [Google Scholar] [CrossRef] [Green Version]
- Brinkhoff, J.; Hornbuckle, J.; Barton, J.L. Assessment of Aquatic Weed in Irrigation Channels Using UAV and Satellite Imagery. Water 2018, 10, 1497. [Google Scholar] [CrossRef] [Green Version]
- Tait, L.; Bind, J.; Charan-Dixon, H.; Hawes, I.; Pirker, J.; Schiel, D.R. Unmanned Aerial Vehicles (UAVs) for Monitoring Macroalgal Biodiversity: Comparison of RGB and Multispectral Imaging Sensors for Biodiversity Assessments. Remote. Sens. 2019, 11, 2332. [Google Scholar] [CrossRef] [Green Version]
- Slocum, R.K.; Wright, W.; Parrish, C.; Costa, B.; Sharr, M.; Battista, T.A. Guidelines for Bathymetric Mapping and Orthoimage Generation using sUAS and SfM, An Approach for Conducting Nearshore Coastal Mapping. Available online: https://repository.library.noaa.gov/view/noaa/22923 (accessed on 26 February 2020).
- Genzoli, L.; Hall, R.O. Shifts in Klamath River metabolism following a reservoir cyanobacterial bloom. Freshw. Sci. 2016, 35, 795–809. [Google Scholar] [CrossRef]
- Gillett, N.D.; Pan, Y.; Asarian, J.E.; Kann, J. Spatial and temporal variability of river periphyton below a hypereutrophic lake and a series of dams. Sci. Total. Environ. 2016, 541, 1382–1392. [Google Scholar] [CrossRef] [PubMed]
- Biggs, B.J.; Kilroy, C. Stream Periphyton Monitoring Manual; Niwa: Christchurch, New Zealand, 2000. [Google Scholar]
- Ode, P.R.; Fetscher, A.E.; Busse, L.B. Standard Operating Procedures (SOP) for the Collection of Field Data for Bioassessments of California Wadeable Streams: Benthic Macroinvertebrates, Algae, and Physical Habitat; California State Water Resources Control Board Surface Water Ambient Monitoring Program: Sacramento, CA, USA; Available online: https://meadows.ucdavis.edu/files/SWAMP_combined_sop_031116_reduced.pdf (accessed on 15 August 2020).
- Bellmore, J.R.; Pess, G.R.; Duda, J.J.; O’Connor, J.E.; East, A.E.; Foley, M.M.; Wilcox, A.C.; Major, J.J.; Shafroth, P.B.; Morley, S.A.; et al. Conceptualizing Ecological Responses to Dam Removal: If You Remove It, What’s to Come? Bioscience 2019, 69, 26–39. [Google Scholar] [CrossRef] [PubMed] [Green Version]
- Van Kirk, R.W.; Naman, S.W. Relative Effects of Climate and Water Use on Base-Flow Trends in the Lower Klamath Basin. JAWRA J. Am. Water Resour. Assoc. 2008, 44, 1035–1052. [Google Scholar] [CrossRef]
- Marcus, A.; Fonstad, M.A. Optical remote mapping of rivers at sub-meter resolutions and watershed extents. Earth Surf. Process. Landforms J. Br. Geomorphol. Res. Group 2007, 33, 4–24. [Google Scholar] [CrossRef]
- Snyder, D.T.; Morace, J.L. Nitrogen and Phosphorus Loading from Drained Wetlands Adjacent to Upper Klamath and Agency Lakes, Oregon; US Department of the Interior, U.S. Geological Survey, Branch of Information Services: Denver, CO, USA, 1997. [Google Scholar]
- Bartholow, J.M.; Campbell, S.G.; Flug, M. Predicting the thermal effects of dam removal on the Klamath River. Environ. Manag. 2004, 34, 856–874. [Google Scholar] [CrossRef]
- Holmquist-Johnson, C.L.; Milhous, R.T. Channel Maintenance and Flushing Flows for the Klamath River Below Iron Gate Dam, California. 2010. Available online: https://pubs.usgs.gov/of/2010/1086/ (accessed on 8 January 2020).
- Peppa, M.V.; Hall, J.; Goodyear, J.; Mills, J.P. Photogrammetric assessment and comparison of DJI Phantom 4 pro and phantom 4 RTK small unmanned aircraft systems. In Proceedings of the 4th ISPRS Geospatial Week, Enschede, The Netherlands, 10–14 June 2019; Available online: https://eprints.ncl.ac.uk/file_store/production/258436/916EAB96-2294-430D-A832-CA872DB0A2CD.pdf (accessed on 3 March 2020).
- Su, T.-C.; Chou, H.-T. Application of Multispectral Sensors Carried on Unmanned Aerial Vehicle (UAV) to Trophic State Mapping of Small Reservoirs: A Case Study of Tain-Pu Reservoir in Kinmen, Taiwan. Remote. Sens. 2015, 7, 10078–10097. [Google Scholar] [CrossRef] [Green Version]
- Lyons, A.; R Development Core Team. Uasimg: Drone Images Utilities. R Package Version 1.3.4. Available online: https://github.com/ucanr-igis/uasimg (accessed on 17 August 2020).
- Yang, X. An Assessment of Algorithmic Parameters Affecting Image Classification Accuracy by Random Forests. Photogramm. Eng. Remote. Sens. 2016, 82, 407–417. [Google Scholar] [CrossRef]
- Gerke, M. Supervised Classification of Multiple View Images in Object Space for Seismic Damage Assessment. In Proceedings of the ISPRS Conference, Photogrammetric Image Analysis 2011, Munich, Germany, 5–7 October 2011; Springer: Berlin/Heidelberg, Germany, 2011; pp. 221–232. [Google Scholar]
- Benediktsson, J.A.; Chanussot, J.; Fauvel, M. Multiple Classifier Systems in Remote Sensing: From Basics to Recent Developments. In Proceedings of the 7th International Workshop, Multiple Classifier Systems 2007, Prague, Czech Republic, 23–25 May 2007; Springer: Berlin/Heidelberg, Germany, 2007; pp. 501–512. [Google Scholar]
- Maxwell, A.E.; Warner, T.A.; Fang, F. Implementation of machine-learning classification in remote sensing: An applied review. Int. J. Remote. Sens. 2018, 39, 2784–2817. [Google Scholar] [CrossRef] [Green Version]
- Gomez-Chova, L.; Muñoz-Marí, J.; Laparra, V.; Malo, J.; Camps-Valls, G.; Camps-Valls, G. A Review of Kernel Methods in Remote Sensing Data Analysis. In Optical Remote Sensing: Advances in Signal Processing and Exploitation Techniques; Prasad, S., Bruce, L.M., Chanussot, J., Eds.; Springer: Berlin/Heidelberg, Germany, 2011; pp. 171–206. [Google Scholar]
- Crisci, C.; Ghattas, B.; Perera, G. A review of supervised machine learning algorithms and their applications to ecological data. Ecol. Model. 2012, 240, 113–122. [Google Scholar] [CrossRef]
- Rodriguez, F.; Ponce, R.A.; Pérez-Rodríguez, F.; Agueda, B.; Martín-García, S.; Martínez-Rodrigo, R.; Lizarralde, I. Comparison of Machine Learning Algorithms for Wildland-Urban Interface Fuelbreak Planning Integrating ALS and UAV-borne LiDAR Data and Multispectral Images. Drones 2020, 4, 21. [Google Scholar] [CrossRef]
- Ghimire, B.; Rogan, J.; Miller, J. Contextual land-cover classification: Incorporating spatial dependence in land-cover classification models using random forests and the Getis statistic. Remote. Sens. Lett. 2010, 1, 45–54. [Google Scholar] [CrossRef] [Green Version]
- Asarian, J.E.; Pan, Y.; Gillett, N.D.; Kann, J. Spatial and Temporal Variation of Periphyton Assemblages in the Klamath River 2004—Prepared by Kier Associates, Portland State University, and Aquatic Ecosystem Sciences LLC for the Klamath Basin Tribal Water Quality Work Group. Available online: https://www.researchgate.net/profile/J_Asarian/publication/272788109_Spatial_and_temporal_variation_of_periphyton_assemblages_in_the_Klamath_River_2004-2012/links/5eb032c845851592d6b880e8/Spatial-and-temporal-variation-of-periphyton-assemblages-in-the-Klamath-River-2004-2012.pdf (accessed on 29 August 2020).
- Foody, G.M. Explaining the unsuitability of the kappa coefficient in the assessment and comparison of the accuracy of thematic maps obtained by image classification. Remote. Sens. Environ. 2020, 239, 111630. [Google Scholar] [CrossRef]
- Pontius, R.G.; Millones, M. Death to Kappa: Birth of quantity disagreement and allocation disagreement for accuracy assessment. Int. J. Remote. Sens. 2011, 32, 4407–4429. [Google Scholar] [CrossRef]
- Hughes, B.B.; Haskins, J.C.; Wasson, K.; Watson, E. Identifying factors that influence expression of eutrophication in a central California estuary. Mar. Ecol. Prog. Ser. 2011, 439, 31–43. [Google Scholar] [CrossRef] [Green Version]
- lm Function|R Documentation. 2017. Available online: https://www.rdocumentation.org/packages/stats/versions/3.6.2/topics/lm (accessed on 17 March 2020).
- Wickham, H. ggplot2: Elegant Graphics for Data Analysis; Springer: Berlin/Heidelberg, Germany, 2016. [Google Scholar]
- R Core Team. R: A Language and Environment for Statistical Computing; R Foundation for Statistical Computing: Vienna, Austria, 2013. [Google Scholar]
- Jay Kerns, G. Introduction to Probability and Statistics Using R. 2010. Available online: http://www.atmos.albany.edu/facstaff/timm/ATM315spring14/R/IPSUR.pdf (accessed on 18 August 2020).
- Shintani, C.; Fonstad, M.A. Comparing remote-sensing techniques collecting bathymetric data from a gravel-bed river. Int. J. Remote. Sens. 2017, 38, 2883–2902. [Google Scholar] [CrossRef]
- Zinke, P.; Flener, C. Experiences from the use of unmanned aerial vehicles (UAV) for river bathymetry modelling in Norway. Vann 2013, 48, 351–360. [Google Scholar]
- PacifiCorps. 2019 KHSA Final Datasets. Available online: https://www.pacificorp.com/energy/hydro/klamath-river/water-quality.html (accessed on 14 August 2020).
- Oliver, A.A.; Dahlgren, R.A.; Deas, M.L. The upside-down river: Reservoirs, algal blooms, and tributaries affect temporal and spatial patterns in nitrogen and phosphorus in the Klamath River, USA. J. Hydrol. 2014, 519, 164–176. [Google Scholar] [CrossRef] [Green Version]
- Ahmad, A.; Quegan, S. Comparative analysis of supervised and unsupervised classification on multispectral data. Appl. Math. Sci. 2013, 7, 3681–3694. [Google Scholar] [CrossRef]
- Hasmadi, M.; Pakhriazad, H.Z.; Shahrin, M.F. Evaluating supervised and unsupervised techniques for land cover mapping using remote sensing data. Geogr. Malays. J. Soc. Space 2009, 5, 1–10. [Google Scholar]
- Nelson, S.A.; Cheruvelil, K.S.; Soranno, P.A. Satellite remote sensing of freshwater macrophytes and the influence of water clarity. Aquat. Bot. 2006, 85, 289–298. [Google Scholar] [CrossRef]
- Yadav, S.; Yoneda, M.; Susaki, J.; Tamura, M.; Ishikawa, K.; Yamashiki, Y.A. A Satellite-Based Assessment of the Distribution and Biomass of Submerged Aquatic Vegetation in the Optically Shallow Basin of Lake Biwa. Remote. Sens. 2017, 9, 966. [Google Scholar] [CrossRef] [Green Version]
- Keshava, N. A survey of spectral unmixing algorithms. Lincoln Lab. J. 2003, 14, 55–78. [Google Scholar]
- Yan, G.; Li, L.; Coy, A.; Mu, X.; Chen, S.; Xie, D.; Zhang, W.; Shen, Q.; Zhou, H. Improving the estimation of fractional vegetation cover from UAV RGB imagery by colour unmixing. ISPRS J. Photogramm. Remote. Sens. 2019, 158, 23–34. [Google Scholar] [CrossRef]
- Govender, M.; Chetty, K.; Bulcock, H. A review of hyperspectral remote sensing and its application in vegetation and water resource studies. Water SA 2007, 33. [Google Scholar] [CrossRef] [Green Version]
- Dronova, I. Object-Based Image Analysis in Wetland Research: A Review. Remote. Sens. 2015, 7, 6380–6413. [Google Scholar] [CrossRef] [Green Version]
- Husson, E.; Ecke, F.; Reese, H. Comparison of Manual Mapping and Automated Object-Based Image Analysis of Non-Submerged Aquatic Vegetation from Very-High-Resolution UAS Images. Remote. Sens. 2016, 8, 724. [Google Scholar] [CrossRef] [Green Version]
- Chabot, D.; Dillon, C.; Ahmed, O.; Shemrock, A. Object-based analysis of UAS imagery to map emergent and submerged invasive aquatic vegetation: A case study. J. Unmanned Veh. Syst. 2017, 5, 27–33. [Google Scholar] [CrossRef] [Green Version]
- Becker, R.; Sayers, M.; Dehm, D.; Shuchman, R.; Quintero, K.; Bosse, K.; Sawtell, R. Unmanned aerial system based spectroradiometer for monitoring harmful algal blooms: A new paradigm in water quality monitoring. J. Great Lakes Res. 2019, 45, 444–453. [Google Scholar] [CrossRef]
- Joyce, K.E.; Duce, S.; Leahy, S.M.; Leon, J.; Maier, S.W. Principles and practice of acquiring drone-based image data in marine environments. Mar. Freshw. Res. 2019, 70, 952. [Google Scholar] [CrossRef]
- Ventura, D.; Bonifazi, A.; Gravina, M.F.; Belluscio, A.; Ardizzone, G. Mapping and Classification of Ecologically Sensitive Marine Habitats Using Unmanned Aerial Vehicle (UAV) Imagery and Object-Based Image Analysis (OBIA). Remote. Sens. 2018, 10, 1331. [Google Scholar] [CrossRef] [Green Version]
- Hardin, P.J.; Jensen, R.R. Small-Scale Unmanned Aerial Vehicles in Environmental Remote Sensing: Challenges and Opportunities. GISci. Remote. Sens. 2011, 48, 99–111. [Google Scholar] [CrossRef]
- Kutser, T.; Vahtmäe, E.; Praks, J. A sun glint correction method for hyperspectral imagery containing areas with non-negligible water leaving NIR signal. Remote. Sens. Environ. 2009, 113, 2267–2274. [Google Scholar] [CrossRef]
- Bandini, F.; Jakobsen, J.; Olesen, D.; Reyna-Gutierrez, J.A.; Bauer-Gottwein, P. Measuring water level in rivers and lakes from lightweight Unmanned Aerial Vehicles. J. Hydrol. 2017, 548, 237–250. [Google Scholar] [CrossRef] [Green Version]
- Kay, S.; Hedley, J.; Lavender, S. Sun Glint Correction of High and Low Spatial Resolution Images of Aquatic Scenes: A Review of Methods for Visible and Near-Infrared Wavelengths. Remote. Sens. 2009, 1, 697–730. [Google Scholar] [CrossRef] [Green Version]
- Benavides, M.T.; Fodrie, F.J.; Johnston, D.W. Shark detection probability from aerial drone surveys within a temperate estuary. J. Unmanned Veh. Syst. 2020, 8, 44–56. [Google Scholar] [CrossRef]
- Tamondong, A.; Nakamura, T.; Kobayashi, Y.; Garcia, M.; Nadaoka, K. Investigating the Effects of River Discharges on Submerged Aquatic Vegetation Using Uav Images and GIS Techniques. ISPRS Ann. Photogramm. Remote. Sens. Spat. Inf. Sci. 2020, 5, 93–99. [Google Scholar] [CrossRef]
- Thomsen, M.S.; Mondardini, L.; Alestra, T.; Gerrity, S.; Tait, L.; South, P.M.; Lilley, S.A.; Schiel, D.R. Local Extinction of Bull Kelp (Durvillaea spp.) Due to a Marine Heatwave. Front. Mar. Sci. 2019, 6, 84. [Google Scholar] [CrossRef] [Green Version]
- Duffy, J.P.; Pratt, L.; Anderson, K.; Land, P.E.; Shutler, J.D. Spatial assessment of intertidal seagrass meadows using optical imaging systems and a lightweight drone. Estuarine Coast. Shelf Sci. 2018, 200, 169–180. [Google Scholar] [CrossRef]
- Mora-Soto, A.; Palacios, M.; Macaya, E.C.; Gómez, I.; Huovinen, P.; Pérez-Matus, A.; Young, M.A.; Golding, N.; Toro, M.; Yaqub, M.; et al. A High-Resolution Global Map of Giant Kelp (Macrocystis pyrifera) Forests and Intertidal Green Algae (Ulvophyceae) with Sentinel-2 Imagery. Remote. Sens. 2020, 12, 694. [Google Scholar] [CrossRef] [Green Version]
- Green, D.R.; Gregory, B.J.; Karachok, A.R. Unmanned Aerial Remote Sensing: UAS for Environmental Applications; CRC Press: Boca Raton, FL, USA, 2020. [Google Scholar]
- Rossiter, T.; Furey, T.; McCarthy, T.; Stengel, D.B. UAV-mounted hyperspectral mapping of intertidal macroalgae. Estuarine Coast. Shelf Sci. 2020, 242, 106789. [Google Scholar] [CrossRef]
- Gallant, A.L. The Challenges of Remote Monitoring of Wetlands. Remote. Sens. 2015, 7, 10938–10950. [Google Scholar] [CrossRef] [Green Version]
- Abati, S.; Minciardi, M.R.; Ciadamidaro, S.; Fattorini, S.; Ceschin, S. Response of macrophyte communities to flow regulation in mountain streams. Environ. Monit. Assess. 2016, 188. [Google Scholar] [CrossRef] [PubMed]
- Power, M.E.; Parker, M.S.; Dietrich, W.E. Seasonal Reassembly of a River Food Web: Floods, Droughts, and Impacts of Fish. Ecol. Monogr. 2008, 78, 263–282. [Google Scholar] [CrossRef] [Green Version]
- Wehr, J.D. Analysis of seasonal succession of attached algae in a mountain stream, the North Alouette River, British Columbia. Can. J. Bot. 1981, 59, 1465–1474. [Google Scholar] [CrossRef]
- Banish, N.J. Factors Influencing Cladophora Biomass Abundance in the Upper Clark Fork River, Montana. Available online: https://scholarworks.umt.edu/cgi/viewcontent.cgi?article=12162&context=etd (accessed on 1 October 2020).
- Rusnák, M.; Sládek, J.; Kidová, A.; Lehotský, M. Template for high-resolution river landscape mapping using UAV technology. Measurement 2018, 115, 139–151. [Google Scholar] [CrossRef]
- Nahirnick, N.K.; Hunter, P.; Costa, M.; Schroeder, S.; Sharma, T. Benefits and Challenges of UAS Imagery for Eelgrass (Zostera marina) Mapping in Small Estuaries of the Canadian West Coast. J. Coast. Res. 2019, 35, 673–683. [Google Scholar] [CrossRef]
- Hashemi-Beni, L.; Jones, J.; Thompson, G.; Johnson, C.; Gebrehiwot, A. Challenges and Opportunities for UAV-Based Digital Elevation Model Generation for Flood-Risk Management: A Case of Princeville, North Carolina. Sensors 2018, 18, 3843. [Google Scholar] [CrossRef] [Green Version]
- Kutser, T.; Vahtmäe, E.; Martin, G. Assessing suitability of multispectral satellites for mapping benthic macroalgal cover in turbid coastal waters by means of model simulations. Estuarine Coast. Shelf Sci. 2006, 67, 521–529. [Google Scholar] [CrossRef]
- Boon, M.A.; Drijfhout, A.P.; Tesfamichael, S.G. Comparison of a fixed-wing and multi-rotor uav for environmental mapping applications: A case study. ISPRS Int. Arch. Photogramm. Remote. Sens. Spat. Inf. Sci. 2017, 42, 47–54. [Google Scholar] [CrossRef] [Green Version]
- Bunn, S.E.; Abal, E.G.; Smith, M.J.; Choy, S.C.; Fellows, C.S.; Harch, B.D.; Kennard, M.J.; Sheldon, F. Integration of science and monitoring of river ecosystem health to guide investments in catchment protection and rehabilitation. Freshw. Biol. 2010, 55, 223–240. [Google Scholar] [CrossRef] [Green Version]
- Schneider, S.C.; Hilt, S.; Vermaat, J.E.; Kelly, M. The “Forgotten” Ecology Behind Ecological Status Evaluation: Re-Assessing the Roles of Aquatic Plants and Benthic Algae in Ecosystem Functioning. In Progress in Botany; Cánovas, F.M., Lüttge, U., Matyssek, R., Eds.; Springer: Cham, Switzerland, 2016; Volume 78, pp. 285–304. [Google Scholar]
- Kornijów, R.; Gulati, R.D.; Ozimek, T. Food preference of freshwater invertebrates: Comparing fresh and decomposed angiosperm and a filamentous alga. Freshw. Biol. 1995, 33, 205–212. [Google Scholar] [CrossRef]
- Stevenson, R.J.; Bennett, B.J.; Jordan, D.N.; French, R.D. Phosphorus regulates stream injury by filamentous green algae, DO, and pH with thresholds in responses. Hydrobiologia 2012, 695, 25–42. [Google Scholar] [CrossRef]
- Deas, M.; Vaughn, J. Characterization of Organic Matter Fate and Transport in the Klamath River Below Link Dam to Assess Treatment/Reduction Potential; Watercourse Engineering Inc.: Davis, CA, USA, 2006; Available online: https://www.researchgate.net/profile/Michael_Deas/publication/228985030_Characterization_of_organic_matter_fate_and_transport_in_the_Klamath_River_below_Link_Dam_to_assess_treatmentreduction_potential/links/00b7d534ffacabfad8000000/Characterization-of-organic-matter-fate-and-transport-in-the-Klamath-River-below-Link-Dam-to-assess-treatment-reduction-potential.pdf (accessed on 1 October 2020).
- Poikane, S.; Kelly, M.; Cantonati, M. Benthic algal assessment of ecological status in European lakes and rivers: Challenges and opportunities. Sci. Total. Environ. 2016, 568, 603–613. [Google Scholar] [CrossRef] [PubMed]
- Ebert, D.; Austin, D.; Deas, M.; Carlson, K. Interim Measure 11, Activity 6—Study of Algal Conditions Management within a Reservoir Cove Using Physical Measures. Available online: https://www.pacificorp.com/content/dam/pcorp/documents/en/pacificorp/energy/hydro/klamath-river/khsa-implementation/technical-documents/2016-IM11-Act6TRptF(7-12-16_v3).pdf (accessed on 1 October 2020).
- Blinn, D.W.; Shannon, J.P.; Benenati, P.L.; Wilson, K.P. Algal ecology in tailwater stream communities: The Colorado River below Glen Canyon Dam, Arizona. J. Phycol. 1998, 34, 734–740. [Google Scholar] [CrossRef]
- Sabater, S.; Bregoli, F.; Acuña, V.; Barceló, D.; Elosegi, A.; Ginebreda, A.; Arce, M.I.; Muñoz, I.; Sabater-Liesa, L.; Ferreira, V. Effects of human-driven water stress on river ecosystems: A meta-analysis. Sci. Rep. 2018, 8, 11462. [Google Scholar] [CrossRef] [PubMed]
- Klamath River Renewal Corporation. Definite Plan for the Lower Klamath Project. Available online: https://play.google.com/store/books/details?id=9HXEvQEACAAJ (accessed on 1 October 2020).
- Visser, F.; Buis, K.; Verschoren, V.; Meire, P. Depth Estimation of Submerged Aquatic Vegetation in Clear Water Streams Using Low-Altitude Optical Remote Sensing. Sensors 2015, 15, 25287–25312. [Google Scholar] [CrossRef] [Green Version]
Figure 1.
Ten river reach study locations on the Klamath River below Iron Gate Dam. The ten reaches that host 32 total sites are: 1. 15 Bridge (I5), 2. Tree of Heaven (TH), 3. Above Beaver Creek (ABC), 4. Brown Bear (BB), 5. Rocky Point (RP), 6. Seiad Valley (SV), 7. Happy Camp (HC), 8. Old Man River (OMR), 9. Orleans (OR), 10. Weitchpec (WE).
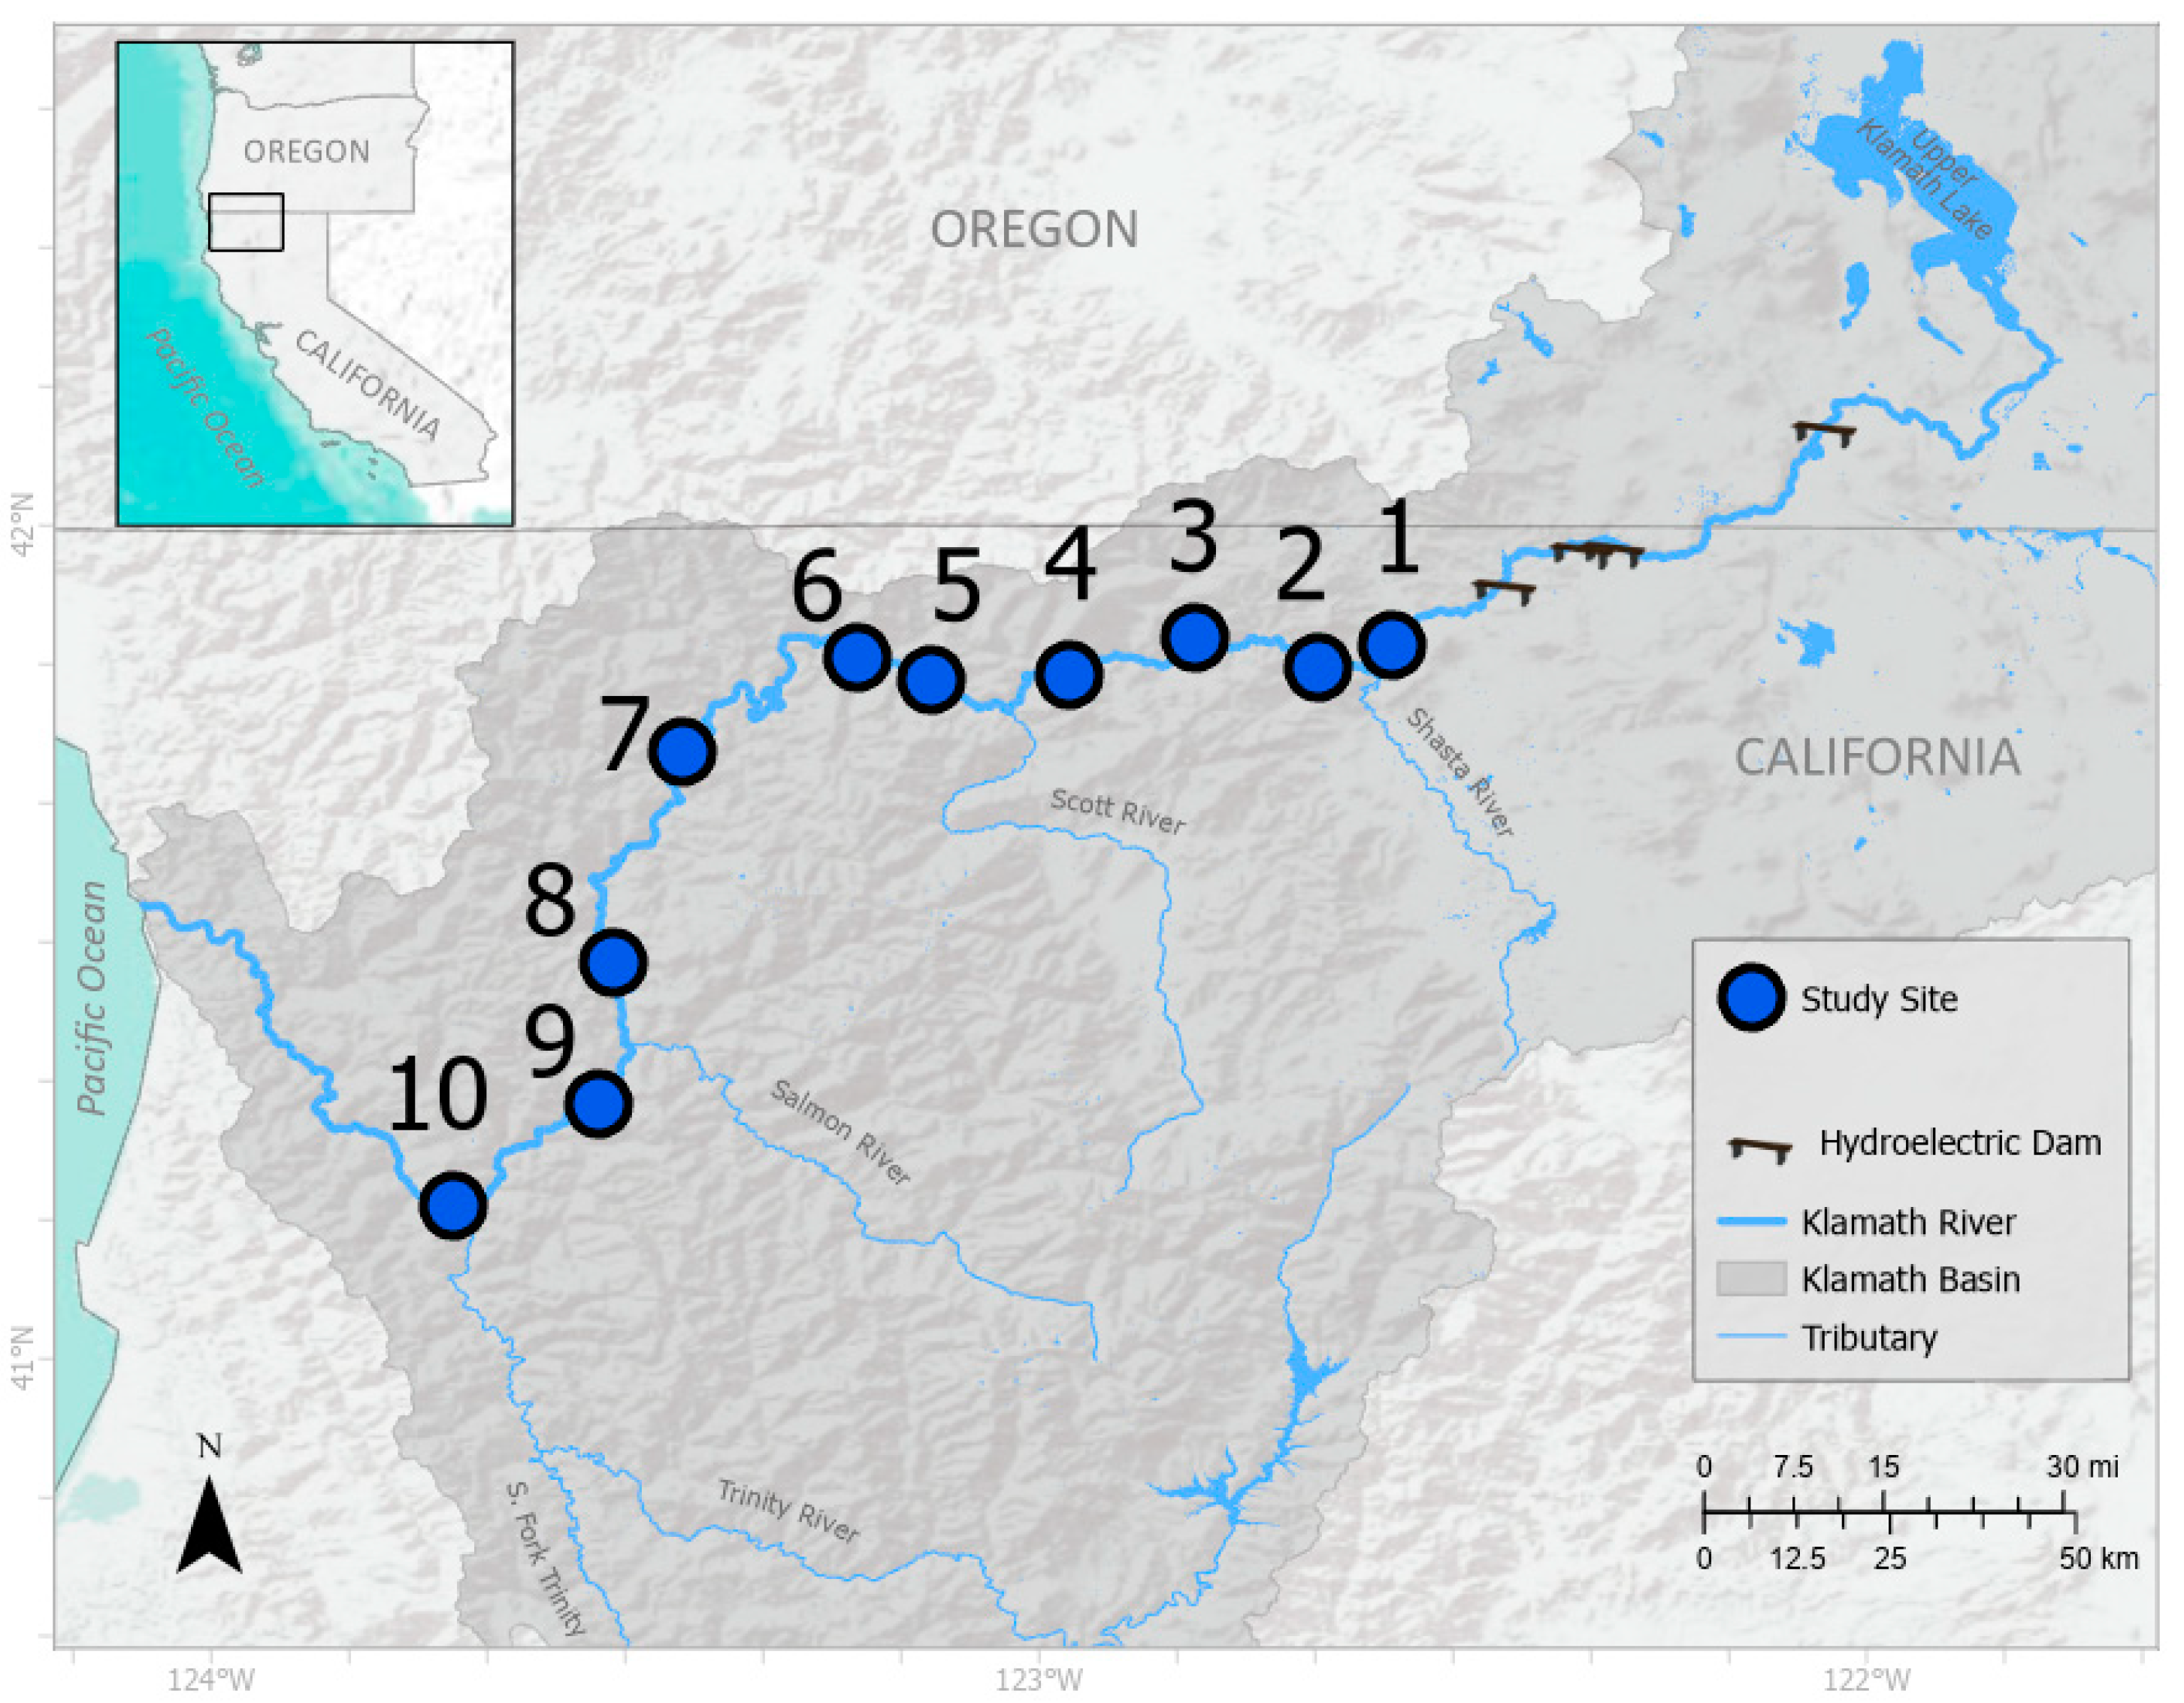
Figure 2.
Examples of data acquisition using (A) a quadrant for in-situ river surveys and (B) a Phantom 4 Pro unoccupied aerial vehicle (UAV) for aerial image collection.
Figure 2.
Examples of data acquisition using (A) a quadrant for in-situ river surveys and (B) a Phantom 4 Pro unoccupied aerial vehicle (UAV) for aerial image collection.
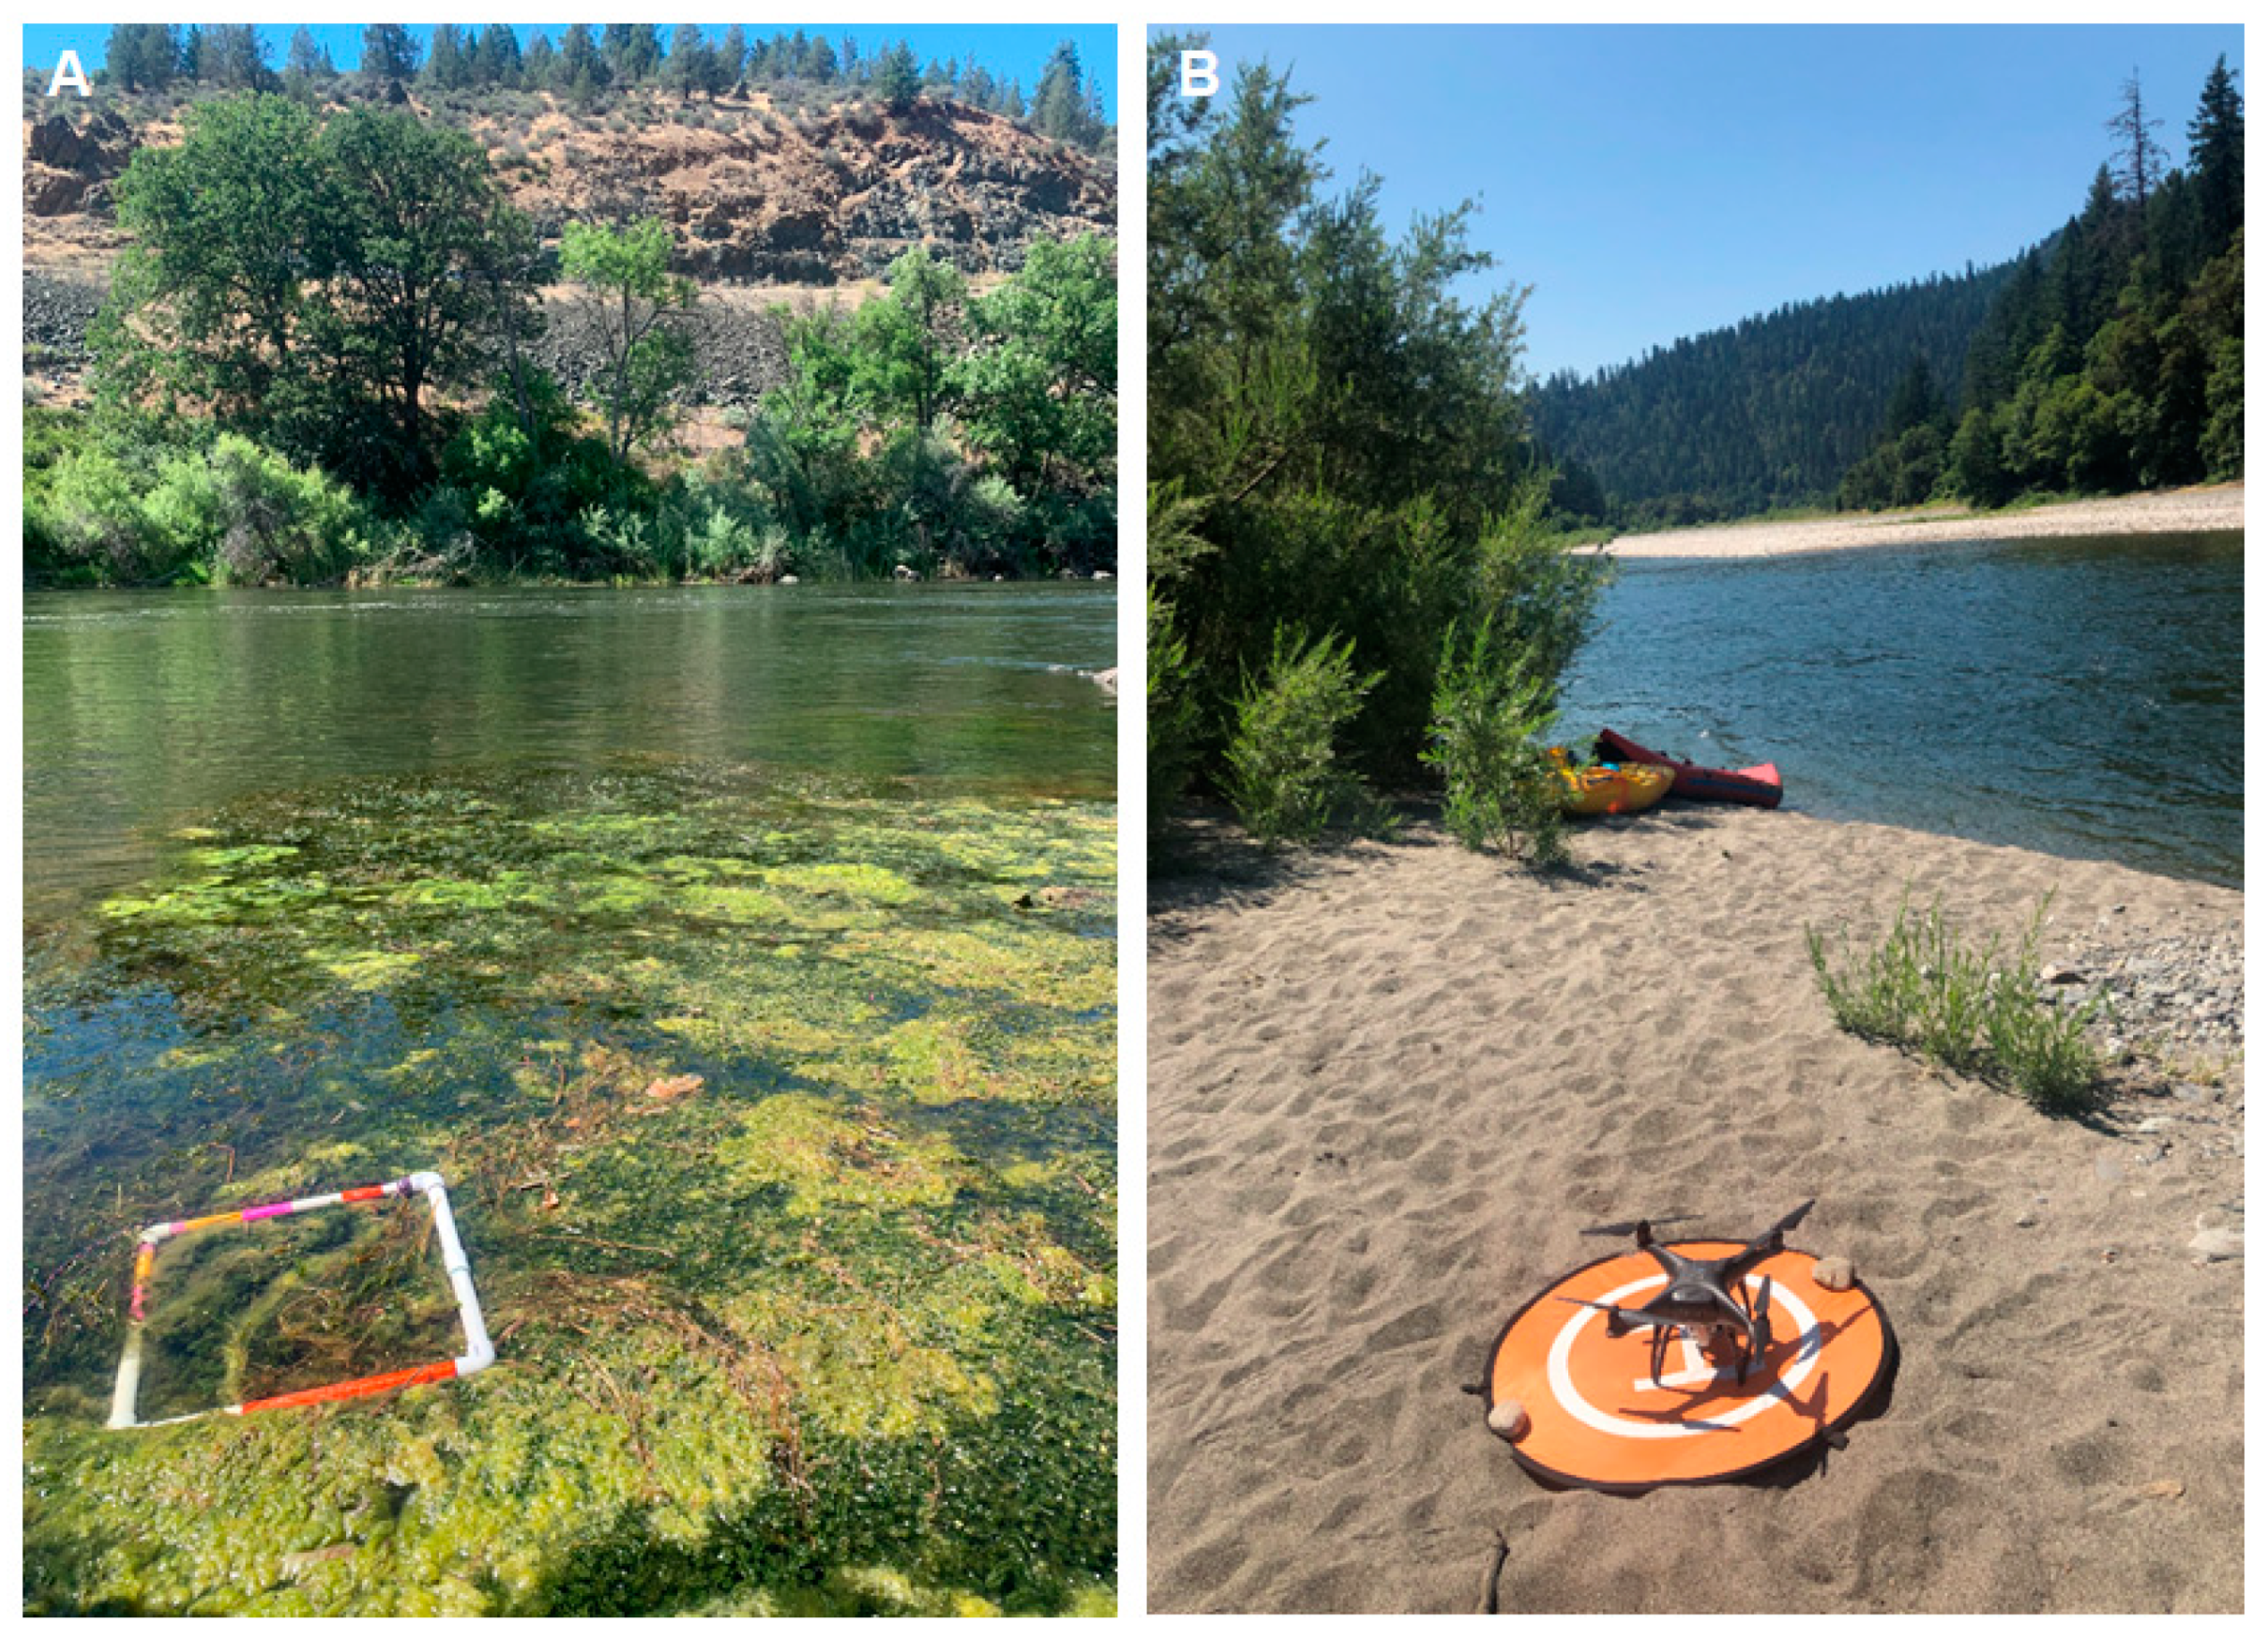
Figure 3.
Methodology of field data collection and data processing and analysis for this study.
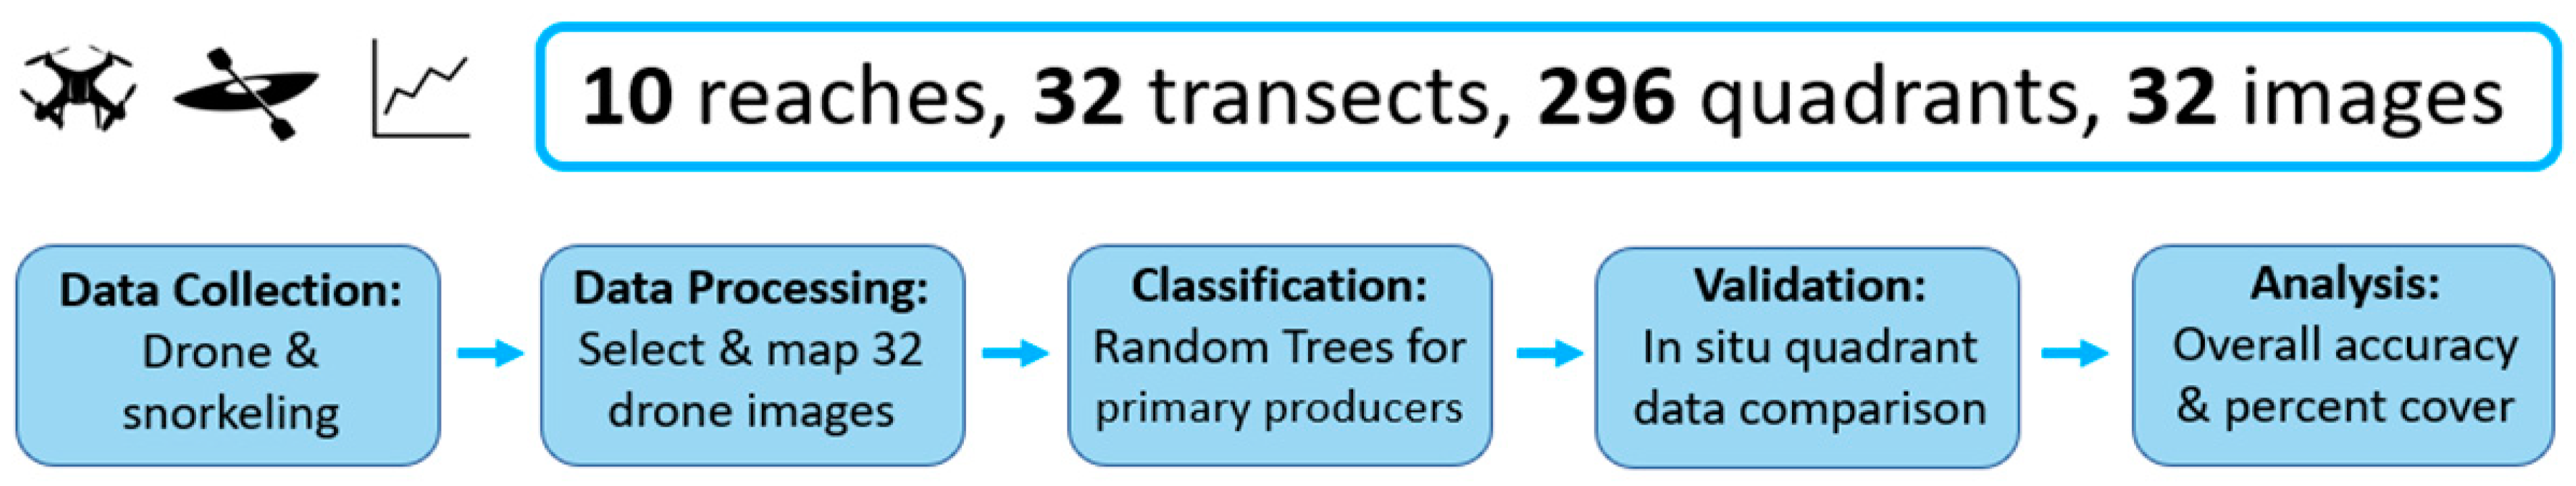
Figure 4.
Overall accuracy of the 32 image classifications and average depth per site (adj R2 = 0.115, p-value ≤ 0.05).
Figure 4.
Overall accuracy of the 32 image classifications and average depth per site (adj R2 = 0.115, p-value ≤ 0.05).
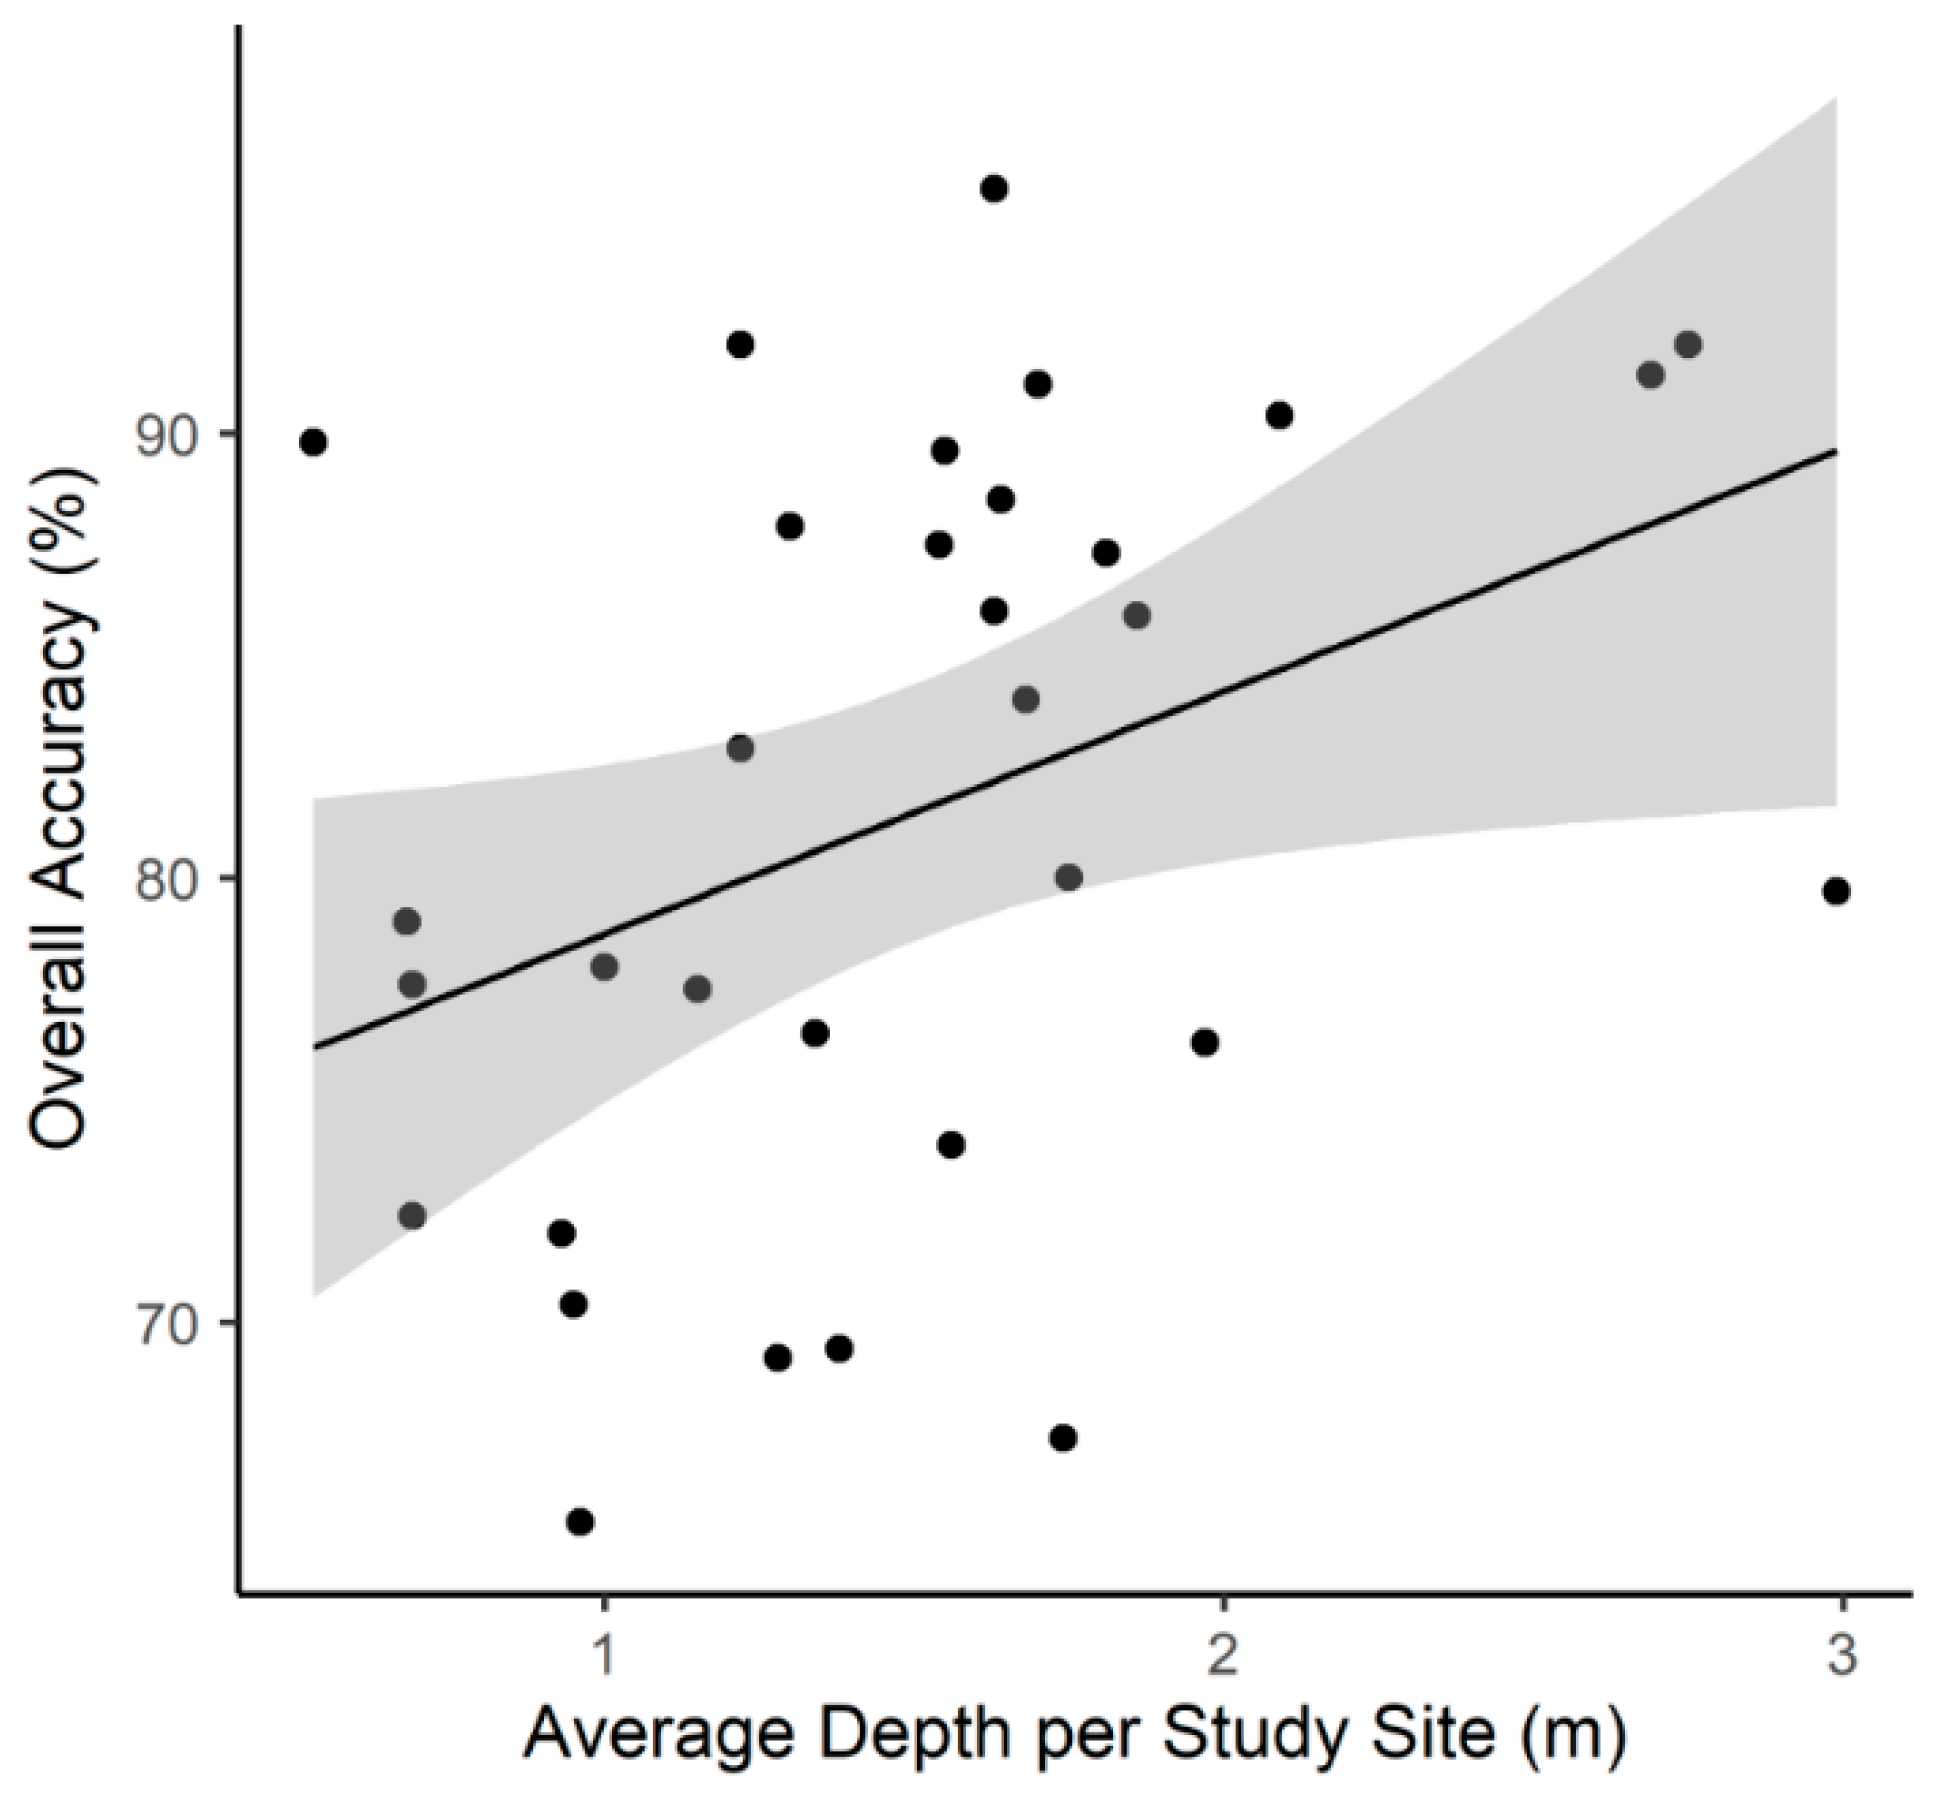
Figure 5.
UAV-based percent cover estimates of submerged rooted macrophytes and filamentous algae moving downstream (left to right: I5 to WE) along 32 sites of the Klamath River below Iron Gate Dam.
Figure 5.
UAV-based percent cover estimates of submerged rooted macrophytes and filamentous algae moving downstream (left to right: I5 to WE) along 32 sites of the Klamath River below Iron Gate Dam.
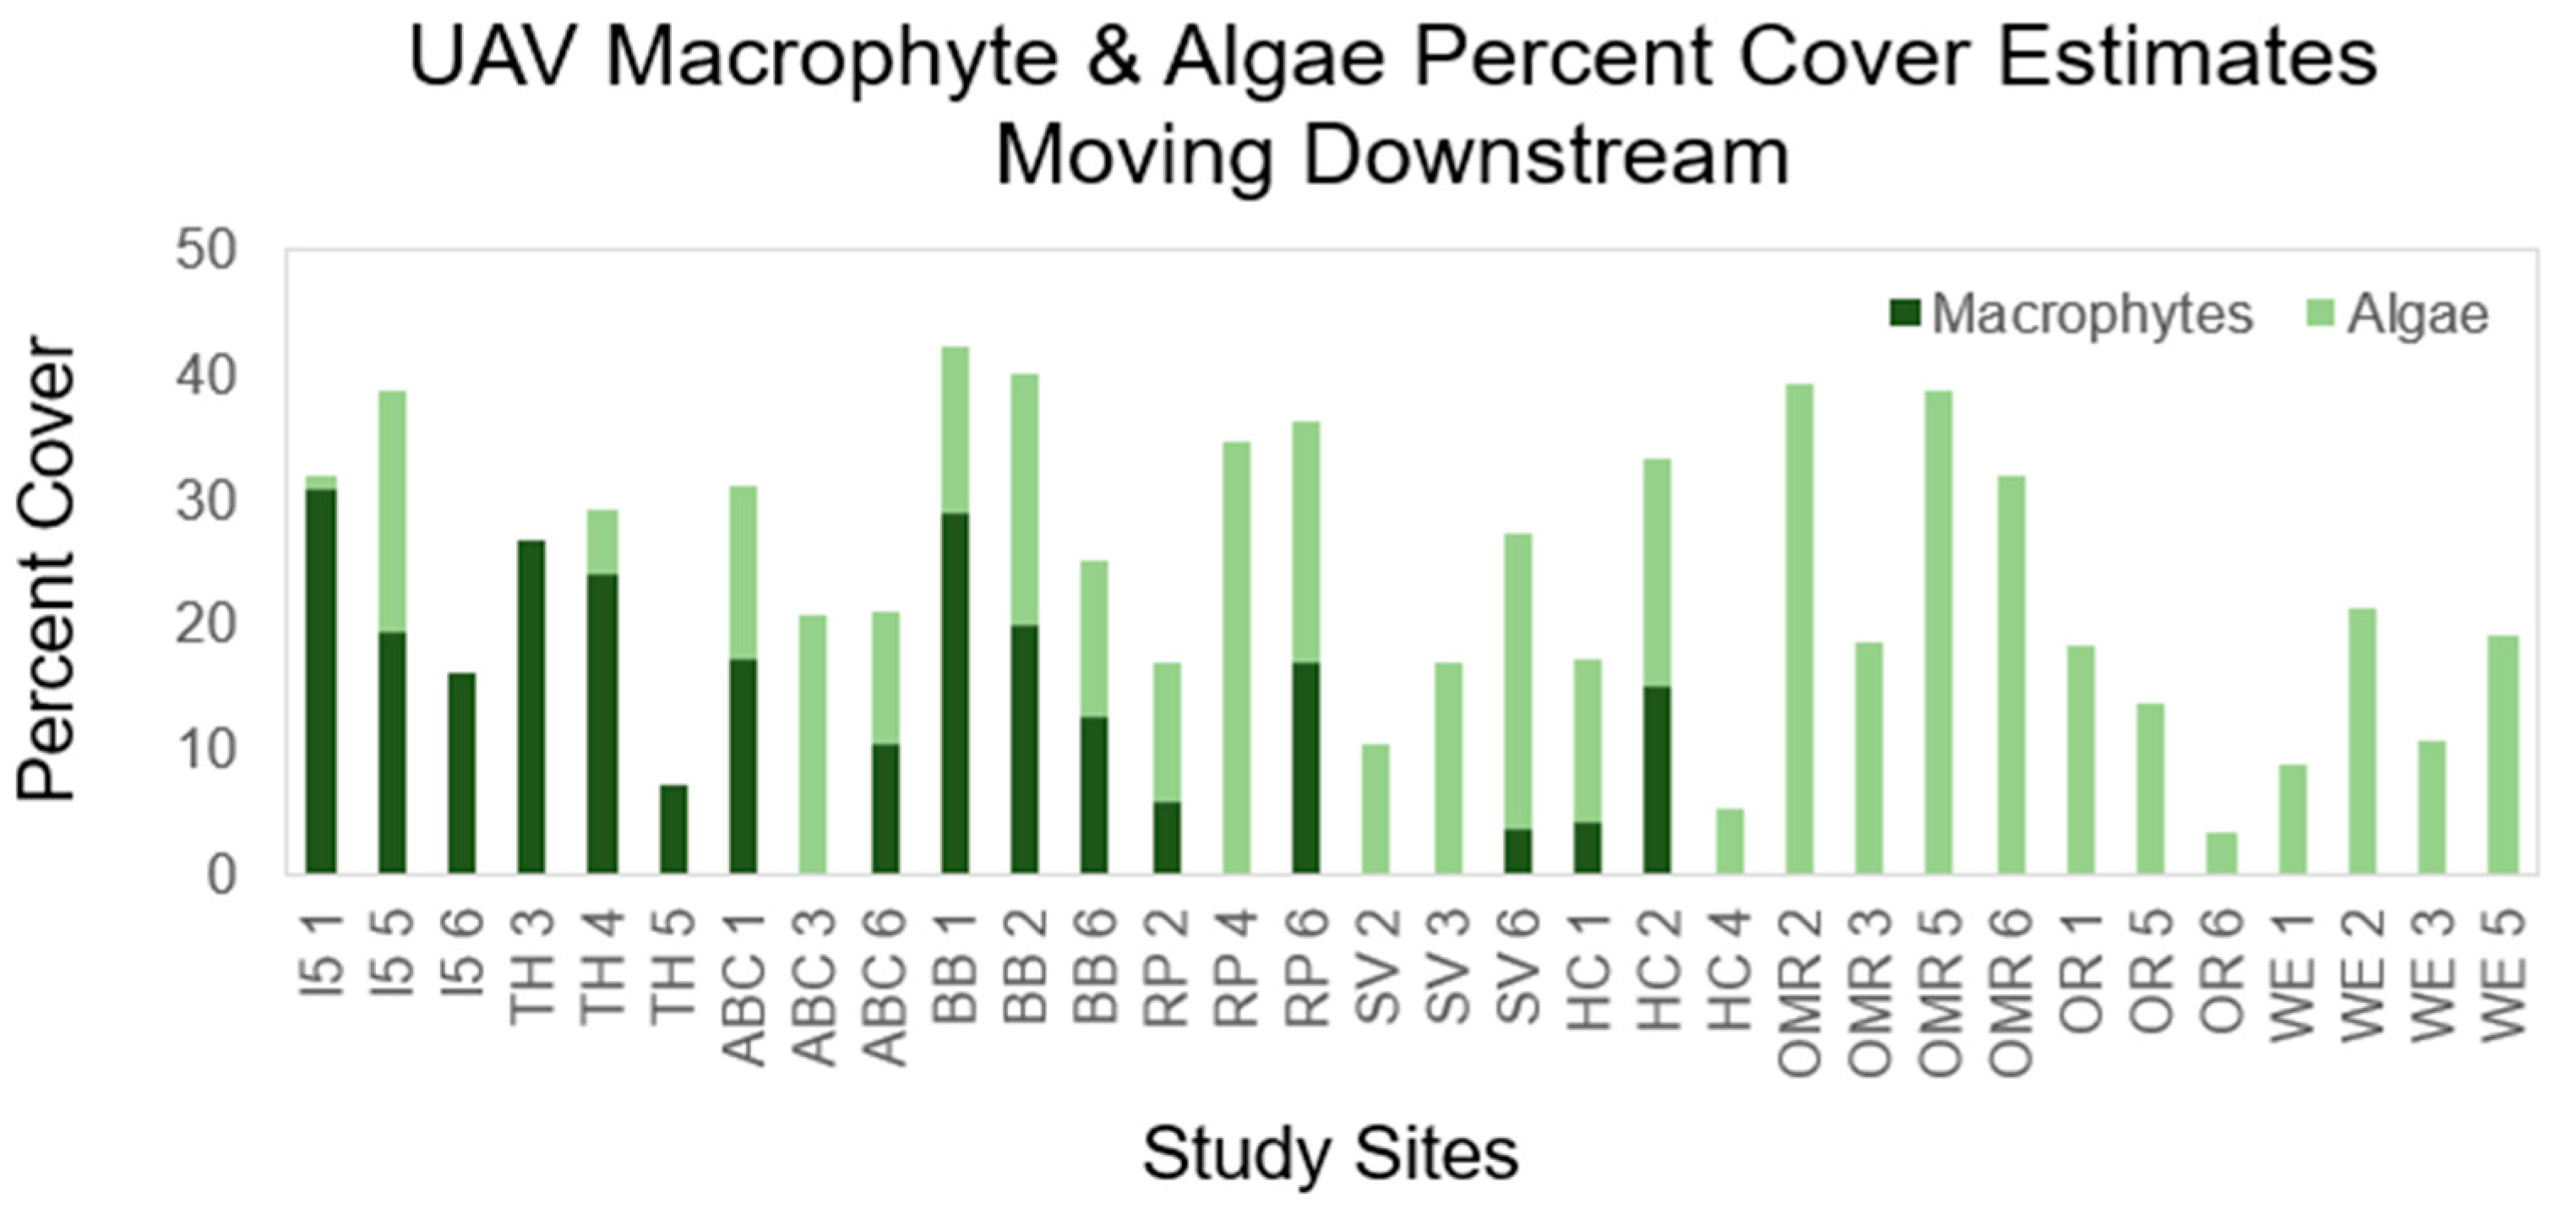
Figure 6.
Examples of low, medium, and high filamentous algae and rooted macrophyte percent cover in original UAV images (top row) and Random Trees classification results (bottom row). (A1–A2) Tree of Heaven site 5 (TH 5): low (0% algae, 7% macrophytes); (B1–B2) Brown Bear site 6 (BB 6): medium (13% algae, 13% macrophytes); (C1–C2) Old Man River site 2 (OMR 2): high (39% algae, 0% macrophytes).
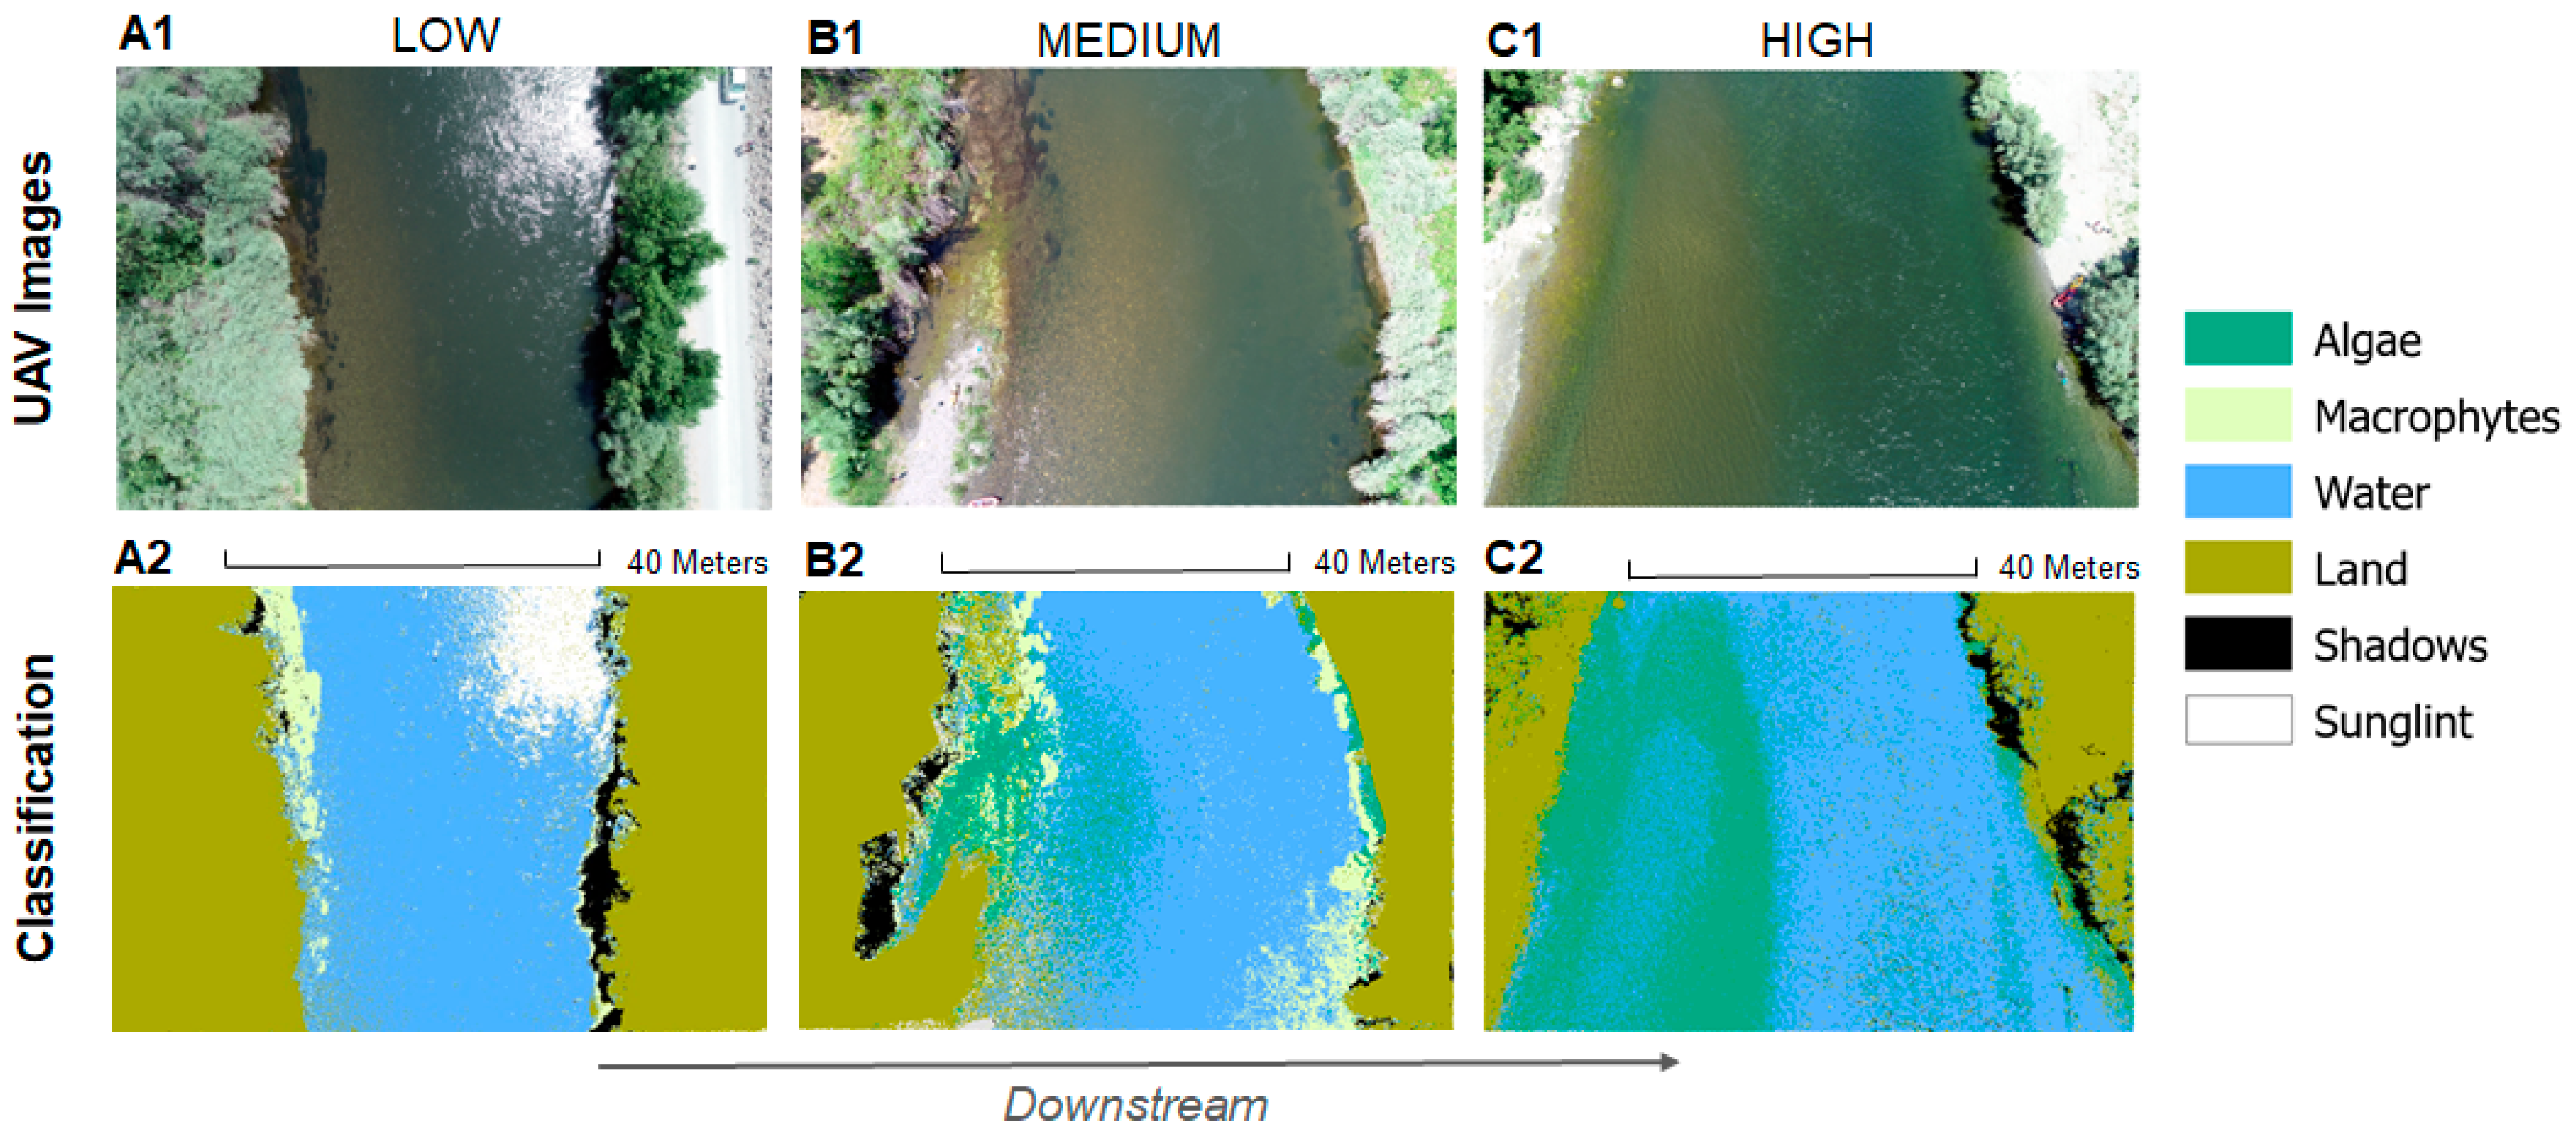
Figure 7.
Linear regression of UAV-based percent cover estimates and snorkel-based (in-situ) percent cover estimates of submerged filamentous algae and rooted macrophytes along 32 sites of the Klamath River below Iron Gate Dam.
Figure 7.
Linear regression of UAV-based percent cover estimates and snorkel-based (in-situ) percent cover estimates of submerged filamentous algae and rooted macrophytes along 32 sites of the Klamath River below Iron Gate Dam.
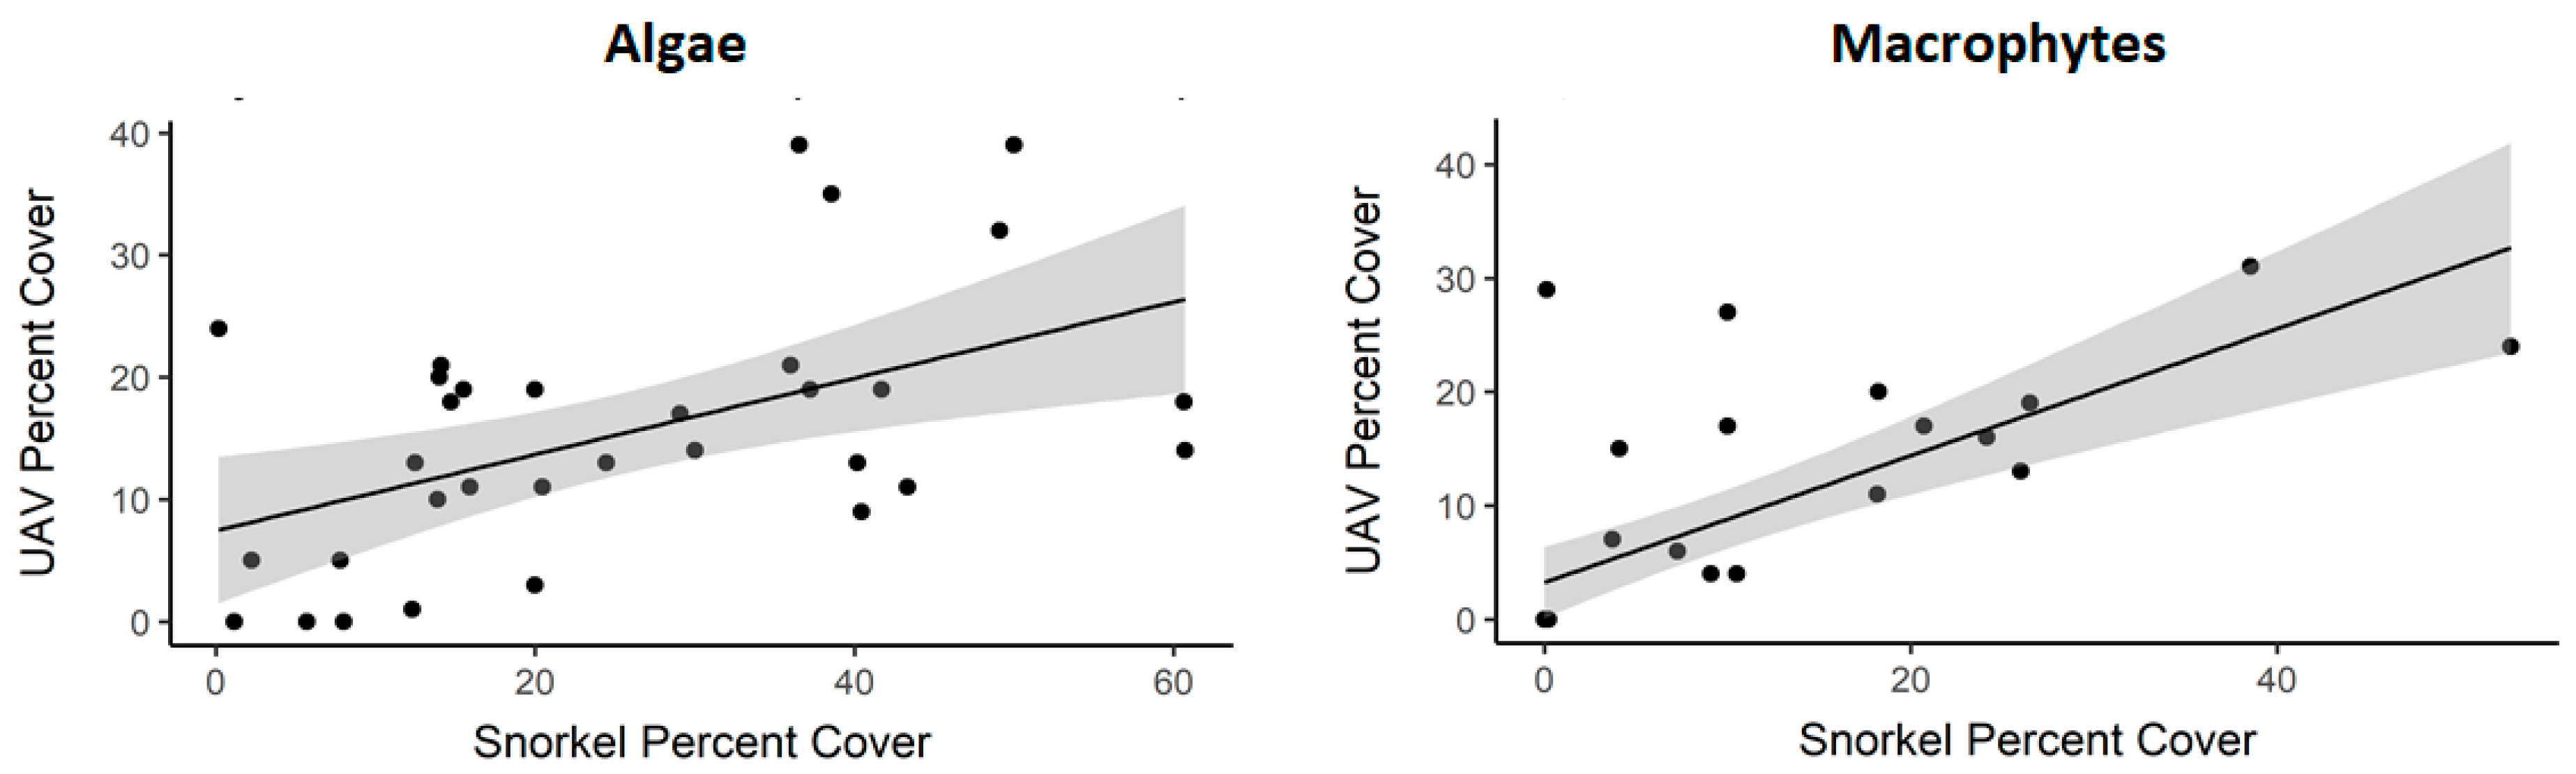
Table 1.
Error Matrix of the Random Trees classification results from all 32 images in this study.
| Error Matrix | Algae | Macro-phytes | Water | Land | Shadows | Sun Glint | Total | Commission Error |
|---|---|---|---|---|---|---|---|---|
| Algae | 209 | 4 | 58 | 11 | 1 | 2 | 285 | 27% |
| Macro-phytes | 7 | 91 | 47 | 5 | 3 | 0 | 153 | 41% |
| Water | 22 | 4 | 628 | 3 | 0 | 7 | 664 | 5% |
| Land | 9 | 1 | 23 | 89 | 4 | 9 | 135 | 34% |
| Shadows | 5 | 3 | 1 | 5 | 171 | 2 | 187 | 9% |
| Sun glint | 0 | 0 | 32 | 18 | 1 | 129 | 180 | 28% |
| Total | 252 | 103 | 789 | 131 | 180 | 149 | 1604 | |
| Omission Error | 17% | 12% | 20% | 32% | 5% | 13% | 82% |
Publisher’s Note: MDPI stays neutral with regard to jurisdictional claims in published maps and institutional affiliations. |
© 2020 by the authors. Licensee MDPI, Basel, Switzerland. This article is an open access article distributed under the terms and conditions of the Creative Commons Attribution (CC BY) license (http://creativecommons.org/licenses/by/4.0/).
Share and Cite
MDPI and ACS Style
Kislik, C.; Genzoli, L.; Lyons, A.; Kelly, M. Application of UAV Imagery to Detect and Quantify Submerged Filamentous Algae and Rooted Macrophytes in a Non-Wadeable River. Remote Sens. 2020, 12, 3332. https://doi.org/10.3390/rs12203332
AMA Style
Kislik C, Genzoli L, Lyons A, Kelly M. Application of UAV Imagery to Detect and Quantify Submerged Filamentous Algae and Rooted Macrophytes in a Non-Wadeable River. Remote Sensing. 2020; 12(20):3332. https://doi.org/10.3390/rs12203332
Chicago/Turabian StyleKislik, Chippie, Laurel Genzoli, Andy Lyons, and Maggi Kelly. 2020. "Application of UAV Imagery to Detect and Quantify Submerged Filamentous Algae and Rooted Macrophytes in a Non-Wadeable River" Remote Sensing 12, no. 20: 3332. https://doi.org/10.3390/rs12203332
Note that from the first issue of 2016, this journal uses article numbers instead of page numbers. See further details here.