Article

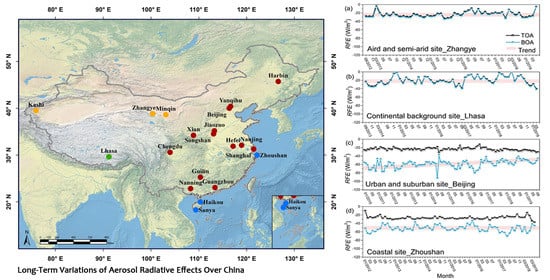
Aerosol Direct Radiative Effects over China Based on Long-Term Observations within the Sun–Sky Radiometer Observation Network (SONET)

1
State Environmental Protection Key Laboratory of Satellite Remote Sensing, Aerospace Information Research Institute, Chinese Academy of Sciences, Beijing 100101, China
2
China Meteorological Administration Training Center, Chinese Meteorological Administration, Beijing 100081, China
3
International Institute for Earth System Science, Nanjing University, Nanjing 210023, China
4
Institute of Earth Environment, Chinese Academy of Sciences, Xi’an 710061, China
5
School of Surveying and Land Information Engineering, Henan Polytechnic University, Jiaozuo 454003, China
6
School of Electronic Engineering and Automation, Guilin University of Electronic Technology, Guilin 541004, China
*
Author to whom correspondence should be addressed.
Remote Sens. 2020, 12(20), 3296; https://doi.org/10.3390/rs12203296
Submission received: 31 August 2020 / Revised: 7 October 2020 / Accepted: 8 October 2020 / Published: 10 October 2020

Abstract

:
To investigate aerosol radiative effects, the Sun–Sky Radiometer Observation Network (SONET) has performed long-term observations of columnar atmospheric aerosol properties at 20 distributed stations around China. The aerosol direct radiative forcing (RF) and efficiency (RFE, the rate at which the atmosphere is forced per unit of aerosol optical depth) were estimated using radiative transfer model simulations based on the ground-based observations dating back to 2009. Results of multi-year monthly average RF illustrated that: the dust-dominant aerosol population at arid and semi-arid sites exerted moderate cooling effects (−8.0~−31.2 W/m2) at the top and bottom of atmosphere (TOA and BOA); RF at continental background site was very weak (−0.8~−2.9 W/m2); fine-mode dominant aerosols at urban and suburban sites exerted moderate cooling effects (−9.3~−24.1 W/m2) at TOA but more significant cooling effects (−19.4~−50.6 W/m2) at BOA; RF at coastal sites was comparable with values of urban sites (−5.5~−19.5 W/m2 at TOA, and −15.6~−44.6 W/m2 at BOA), owing to combined influences by marine and urban–industrial aerosols. Differences between RFE at TOA and BOA indicated that coarse-mode dominant aerosols at arid, semi-arid, and continental background sites were less efficient to warm the atmosphere; but fine-mode dominant aerosols at urban, suburban, and coastal sites were shown to be more efficient to heat the atmosphere.

Graphical Abstract

1. Introduction

Aerosol particles in the atmosphere have substantial influences on the radiative equilibrium and energy budget of the Earth–atmosphere system via direct, semi-direct, and indirect effects [1,2]. The aerosol direct radiative effects, by absorbing and scattering of solar radiation, also called shortwave (0.3~5 µm) radiation, are commonly quantified as the aerosol solar direct radiative forcing (RF). It is defined as the difference of the net solar irradiance, with both gas molecules and aerosol particles present in the atmosphere, minus a reference case excluding aerosol particles. Estimations of aerosol direct radiative effects over a long timescale are important to evaluate the changes of climate. Extensive studies have reported the long-term trend, monthly, and seasonal variations of aerosol radiative effects over different regions around the world [2,3,4,5,6,7,8,9]. They provided valuable datasets to improve our knowledge of climate changes on the regional and global scales. As reported in previous researches, the atmospheric aerosol particles mainly exert cooling effects both at the top and bottom of the atmosphere (TOA and BOA) and an overall atmospheric warming effect of the entire atmospheric column (difference between TOA and BOA) on a long timescale [7,9]. However, the quantification of the aerosol radiative effects depends on aerosol loading, aerosol species (different microphysical and chemical properties), and is even susceptible to the surface properties, vertical structures of the atmosphere, and cloud conditions [10,11,12]. The local, instantaneous, and short-term (a few days to several months) quantities of aerosol radiative effects could differ dramatically (up to hundreds of W/m2), even with dynamic warming or cooling effects, owing to the spatial and temporal variations of atmospheric aerosols and surrounding conditions [7,12].
Large spatial and temporal heterogeneities of atmospheric aerosols and complex chemical compositions originating from various natural and anthropogenic sources make it a challenge to estimate the long-term effects and variations of aerosol radiative effects in China [13,14]. In recent years, numerous efforts have gone into quantifying aerosol direct radiative effects based on ground-based remote sensing measurements at different observation stations around China [14,15,16,17,18,19,20]. The Sun–Sky Radiometer Observation Network (SONET; www.sonet.ac.cn) is a representative ground-based aerosol observation network which is equipped with the Cimel sun–sky radiometer with extension of polarization measurements from ultraviolet to near infrared bands, to provide columnar atmospheric aerosol properties over China [14,21]. The extended capability of multi-wavelength polarization measurements gives it a unique advantage to study non-spherical aerosols, such as the dust particles widely distributed at the SONET stations around China [22,23]. The key aerosol parameters for estimation of radiative effects, including optical depth, single scattering albedo, asymmetry factor, and Ångström exponent of aerosol particles within the entire atmospheric column, can be obtained at broadly-distributed SONET sites for a long time, some of which have operated for over 10 years. Multi-year average aerosol radiative effects at different stations in three regions around China (i.e., the tropical region, the western and arid region, the central and eastern region) have been briefly discussed based on the SONET observations in a previous study [14]. It has given researchers a glance of the significant differences in aerosol RF and radiative forcing efficiency (RFE) at different stations. For example, it estimated aerosol RF multi-year averages at TOA and BOA at the heavily-polluted urban site of Beijing (−18.0 W/m2 at TOA and −46.0 W/m2 at BOA) up to 15 and 33 times stronger than that of the clean continental background site of Lhasa (−1.2 W/m2 at TOA and −1.4 W/m2 at BOA), respectively [14]. However, partly excluding the impact of aerosol loading (normalized by aerosol optical depth), RFE at TOA and BOA at the Beijing site (−23.5 W/m2 at TOA and −62.4 W/m2 at BOA) were only 1.4 and 3.3 times stronger than those of the Lhasa sites (−17.2 W/m2 at TOA and −18.7 W/m2 at BOA), respectively. It indicated that aerosol radiative effects deserve to be separately analyzed at different types of sites with different dominant aerosol species. Moreover, the long-term trend and annual variations of aerosol radiative effects, which provide useful insight into climate changes, cannot be reflected from the values of multi-year averages. The main objective of this study is to estimate the aerosol direct radiative effects and efficiencies based on the long-term observations at different types of sites within SONET. In addition to the statistics of multi-year averages, the annual cycle and long-term variations are further analyzed to study aerosol radiative characteristics comprehensively.
The paper is organized as follows: Section 2 gives a brief introduction of SONET and an overview of its long-term observations. Methods for estimating of aerosol RF and RFE are also included in this section. Section 3 presents the results of aerosol RF and RFE at 20 long-term observation stations within SONET. The overall multi-year averages, the annual cycles of multi-year monthly averages, and the long-term variations of monthly averages of aerosol radiative characteristics are discussed, respectively. Discussion and conclusions are given in Section 4.

2. Materials and Method

2.1. SONET Observations

SONET provides a long-term dataset of columnar atmospheric aerosol properties over China dating back to 2009 [14,21]. There are 20 long-term (>1 year) observation stations by 2019 (Table 1) and dozens of temporary (a few days to several months) observation stations within the SONET. In this study, aerosol direct radiative effects are estimated based on the measurements at the 20 long-term stations, which are grouped into four types (i.e., the arid and semi-arid sites, the continental background site, the urban and suburban sites, and the coastal sites), according to their geographical locations, climate, and aerosol characteristics (see Figure 1).Based on the comprehensive climatology study of the aerosol optical, physical, chemical, and radiative properties in previous researches [14,21], the arid and semi-arid sites (Minqin, Zhangye, and Kashi) are mainly dominated by the mineral dust aerosol particles. The continental background site (Lhasa) is also dominated by coarse mode particles, but with very low total mass concentration. The urban and suburban sites that account for the majority in SONET are identified as urban–industrial aerosols (Beijing, Yanqihu, Jiaozuo, Harbin, Hefei, Nanjing, Chengdu, Guilin, and Nanning), the mixtures of urban–industrial aerosols and dust aerosols (Songshan and Xian), as well as the mixtures of urban–industrial aerosols and marine aerosols (Shanghai and Guangzhou). Although the marine aerosols are prevailing in some seasons at the coastal sites (Sanya, Haikou, and Zhoushan), the influences of urban–industrial aerosols are also obvious; so, they are identified as the mixtures of marine aerosols and urban–industrial aerosols at the coastal sites as well [14].
The SONET is mainly equipped with the multi-wavelength polarized sun–sky radiometers CE318-DP (developed by Cimel Electronique), which conduct aerosol and water vapor measurements at nine channels with center wavelengths from 340 nm to 1640 nm [14,21,24]. The AErosol RObotic NETwork (AERONET) type processing and data quality assurance are performed by the SONET. The columnar atmospheric aerosol properties related to radiative effect estimation, including the aerosol optical depth (AOD), the single scattering albedo (SSA), the asymmetry factor (g) at four standard wavelengths bands (i.e., 440, 675, 870, and 1020 nm), and the Ångström exponent (AE) (440–870 nm), as well as the columnar water vapor (CWV) content obtained by measuring H2O absorption of direct solar radiation at the 936 nm channel, are routinely produced by the SONET [21]. The accuracies of SONET products have been evaluated in the previous study [14]. The average differences of AOD, AE, and SSA are only 0.002, 0.01, and 0.02 between the SONET and AERONET, respectively [14]. In this study, the highest quality products of aerosol properties following the SONET level 2.0 criteria are adopted in the radiative effect estimates at all sites, except for the continental background site Lhasa. Considering that the dominant very low aerosol loading at Lhasa prohibits level 2.0 inversion, the level 1.5 products are employed at this site as a balance between sufficient inversion records and quality [14].

2.2. Radiative Effect Estimation

Aerosol solar direct radiative forcing (RF) is defined as the difference of the net (downward minus upward) solar irradiances with, and without, aerosol particle presence. The concept of radiative forcing is adopted to keep consistent with radiative forcing efficiency (RFE) in literature [5,7,8,25,26]. It includes the effects of total (anthropogenic + natural) aerosol particles on the radiative fluxes in this study. Aerosol direct radiative forcing at the top and bottom of the atmosphere can be calculated as [27]:
RF TOA = Δ F TOA a Δ F TOA na ,
RF BOA = Δ F BOA a Δ F BOA na ,
Δ F = F down F up .
ΔF indicates the net irradiance. The superscripts ‘a’ and ‘na’ denote the atmospheric conditions with and without aerosol particles, respectively. F represents the solar irradiance. The superscripts ‘down’ and ‘up’ indicate the directions of solar irradiances (i.e., downward and upward, respectively). The quantities of RF, ΔF, and F all carry the units of W/m2.
When the aerosol direct radiative forcing is normalized by aerosol optical depth at 550 nm, the aerosol direct radiative forcing efficiencies at the TOA and BOA levels (i.e., RFETOA and RFEBOA, in units of W/m2) can be obtained as
RFE TOA = RF TOA / AOD 550 nm ,
RFE BOA = RF BOA / AOD 550 nm ,
where AOD550nm is calculated as
AOD 550 nm = ( 550 / λ ) AE AOD λ .
λ indicates a channel close to the 550 nm wavelength. The band with the central wavelength of 440 nm is adopted in this study. RFE represents the rate at which the atmosphere is forced per unit of aerosol optical depth [7]. This quantity is mostly insensitive to the aerosol loading, at least if a linear relation between radiative forcing and aerosol optical depth is assumed [12]. Thus, it is convenient for comparing the direct radiative effects of different types of aerosols [5,25].
The aerosol solar RF and RFE at the 20 SONET long-term observation sites under cloud-free sky conditions were estimated by the radiative transfer model simulations. The Santa Barbara DISORT (Discrete Ordinate Radiative Transfer) Atmospheric Radiative Transfer (SBDART) model was employed in this study [28], which is well suited for a wide variety of atmospheric radiative energy balance studies [6,8,12,14,27,28,29]. The broadband downward and upward irradiances in the solar spectrum (0.2~4.0 µm) at TOA and BOA were simulated by the SBDART model with, and without, aerosol presence. Good agreement between the SBDART simulations and the ground-based pyrheliometer and pyranometer observations of downward solar irradiances at the surface has been proved by some existing studies [8,12].
The main input parameters for the simulations are listed in Table 2. The averaged aerosol products, including AOD, SSA, and g at 440, 675, 870, and 1020 nm and AE (440–870 nm), retrieved from the sun–sky radiometer observations during day time, were used as alternatives of the daily average aerosol properties. The predefined mid-latitude summer and mid-latitude winter atmospheric profiles in the used radiative transfer model were selected according to the season of observation. The water vapor amount in the atmosphere was specified by the columnar water vapor content retrieved from the SONET observations. The broadband surface albedo in the solar spectrum was estimated from a five-year half-monthly averaged moderate resolution imaging spectroradiometer (MODIS) surface albedo product [23,30,31].
The aerosol radiative forcing and efficiencies were firstly calculated on an hourly basis. The daily average aerosol radiative forcing and efficiencies were estimated by taking the average of the 24 instantaneous hourly values. Taking the averages of overall RF and RFE daily averages of each site, the multi-year (long-term) average aerosol RF and RFE were obtained. The monthly average RF and RFE were deduced by averaging the daily average values month by month. The multi-year monthly average aerosol RF and RFE (in the order of month) were calculated as the averages of long-term daily average values in the same month.

3. Results

3.1. Multi-Year Average Aerosol Radiative Forcing and Efficiencies

The multi-year average aerosol radiative forcing and efficiencies at four different types of sites, and the corresponding values of each sites, are listed in Table 3. All sites showed negative values of multi-year average aerosol RF and RFE, indicating the cooling effects both at the top and bottom of atmosphere over a long-term scale. The continental background site exhibited very weak aerosol radiative effects both at TOA and BOA. The only site of this type, Lhasa, had the lowest (in absolute terms) multi-year average RF (−1.6 ± 2 W/m2 and −1.7 ± 2 W/m2 at TOA and BOA, respectively) among all 20 sites within SONET around China. There were only small differences among the multi-year RF values of the other three types of sites at TOA (i.e., −14.9 ± 9 W/m2 at the arid and semi-arid sites, −15.4 ± 8 W/m2 at the urban and suburban sites, and −13.6 ± 6 W/m2 at the coastal sites). But for BOA, they differed significantly, with the moderate radiative effects at the arid and semi-arid sites (−16.5 ± 10 W/m2), the strong effects at the urban and suburban sites (−36.0 ± 16 W/m2), and the coastal sites in between (−29.3 ± 12 W/m2). The strongest radiative effects with the RF average of −18.7 ± 10 W/m2 at TOA and −43.4 ± 18 W/m2 at BOA were obtained at Beijing (urban) site within SONET, which is in consistency with the results obtained in a previous study [14]. There was no significant difference in RFE at TOA among the four types of sites. As for BOA, the strong cooling efficiencies of radiative forcing can be found in the urban and suburban sites (−54.3 ± 14 W/m2) and the coastal sites (−53.8 ± 10 W/m2), but the moderate efficiencies took place in the arid and semi-arid sites (−24.6 ± 8 W/m2) and continental background site (−19.1 ± 15 W/m2). The highest absolute value of the multi-year average RFE at BOA within SONET was obtained at Shanghai (−65.3 ± 22 W/m2), which also agrees with the previous study [14].
Direct comparisons of aerosol RF and RFE obtained in this study with the results published in the open literature are quite difficult, because of different methodologies applying variable models (e.g., radiative transfer model, regional and global meteorological and climate models) with different inputs (e.g., range of spectral integration, aerosol and surface parameterization) [7,12]. Furthermore, the definitions of the quantities might be very different in the literature (e.g., daily average result estimated by taking the average of the 24 instantaneous hourly values or the average of the instantaneous values throughout the daytime; multi-year average result estimated by taking the average of daily average values or the average of instantaneous values in different periods of time). However, the reports of aerosol RF and RFE are still valuable, especially for the estimates based on widely-distributed stations with similar simulation conditions [7]. Based on the similar observations of SONET and AERONET, radiative forcing and efficiencies of some key aerosol types obtained in China in this study can be roughly compared with the corresponding results estimated in worldwide locations in previous studies [7,9]. As discussed above, the continental background site of Lhasa exerted very low cooling radiative effects with RF multi-year averages of −1.6 ± 2 W/m2 at TOA and −1.7 ± 2 W/m2 at BOA. According to the estimation based on the AERONET long-term observations, it was also reported that aerosol direct RFs at the representative background site Mauna Loa were very small all year around, with monthly average values varying from −1.0 to −1.5 W/m2 at TOA and from −2.0 to −3.5 W/m2 at BOA [9]. The consistency of the two results indicates the common feature of radiative effects at the continental background sites. Garcia et al. also reported the multi-year average aerosol RF and RFE of some key aerosol types at the AERONET mineral dust, continental background, and urban–industrial sites. The comparison of the exact values of the two groups of results (i.e., this study and Garcia et al.) cannot be conducted, because only AERONET observations within a limited range of solar zenith angle were considered in the previous estimations [7]. However, some similar behaviors can be observed between the two group of results, for example, very low cooling effects at the continental background sites (except under snow conditions with surface albedo greater than 0.3), and small differences of RFE among different types of aerosols at TOA.

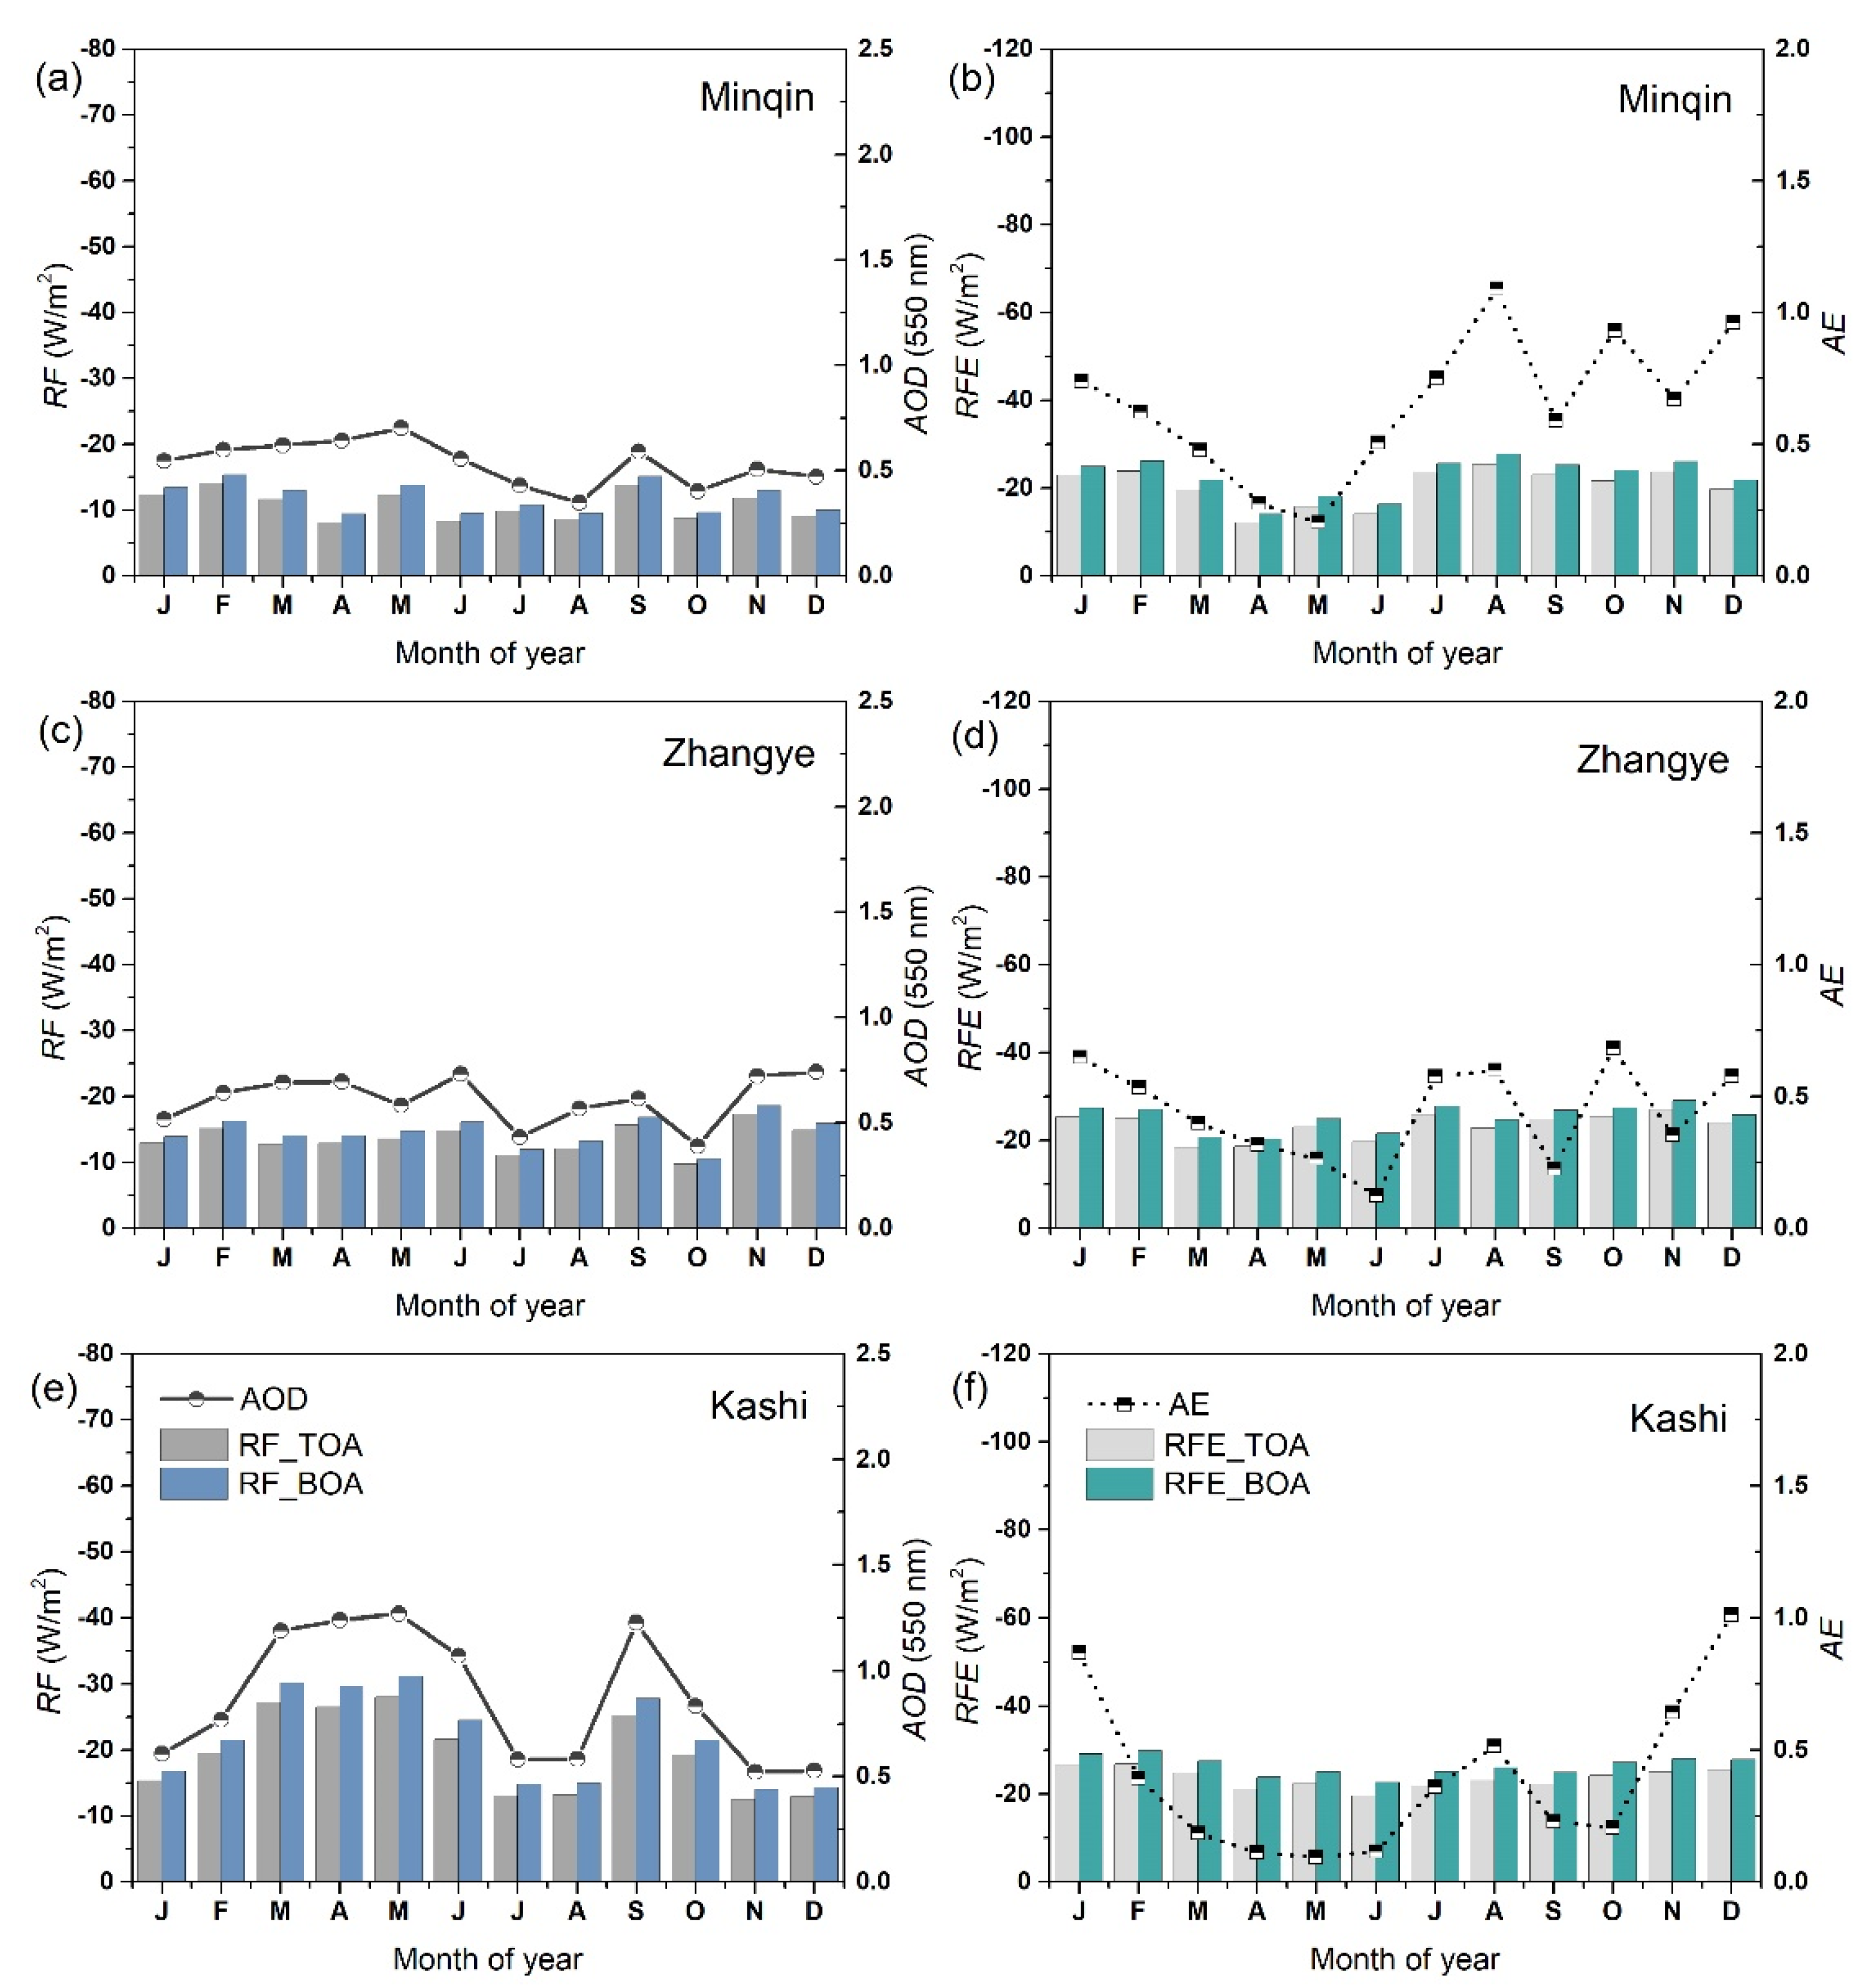
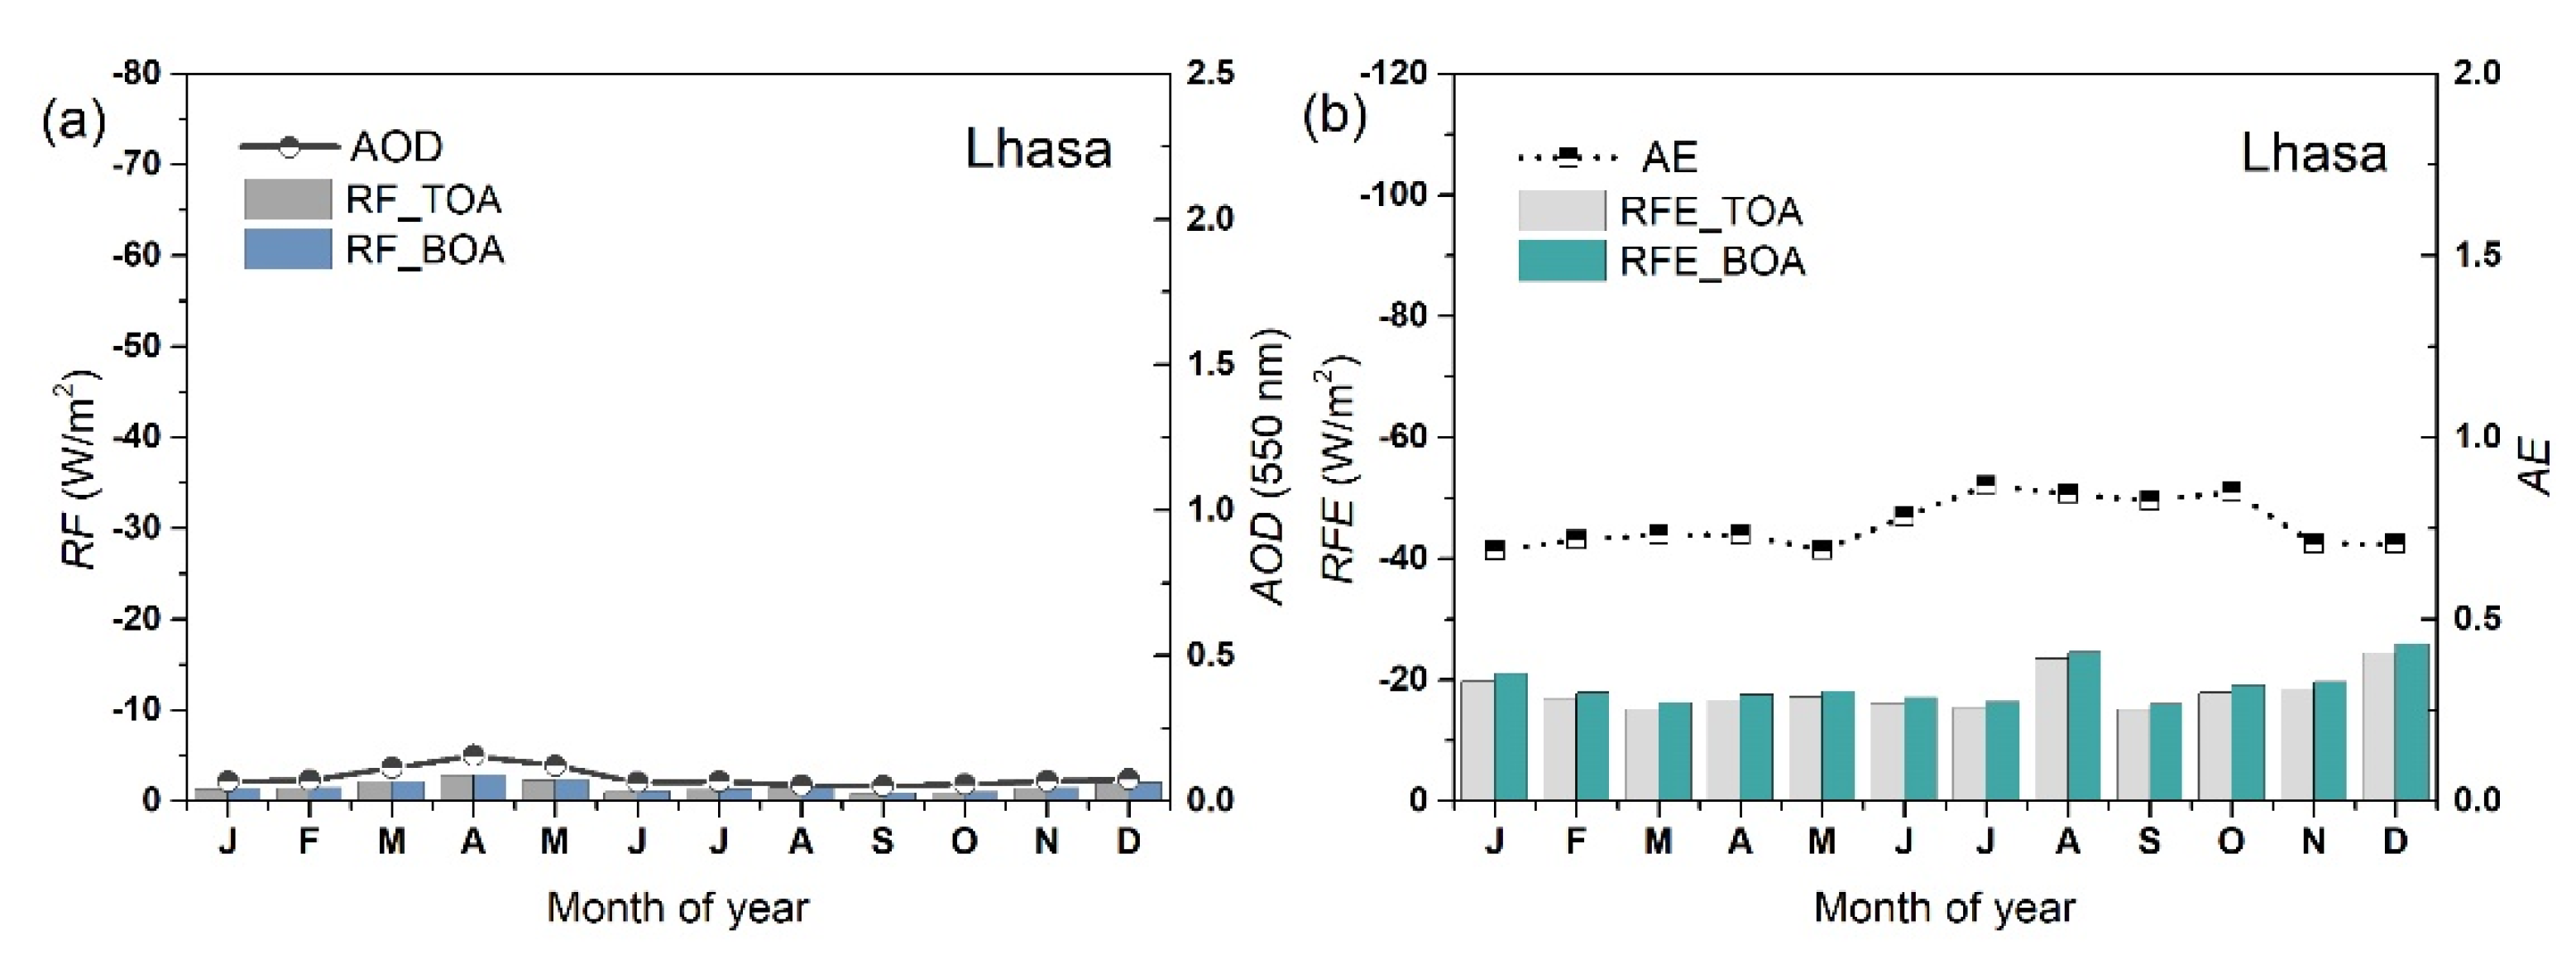
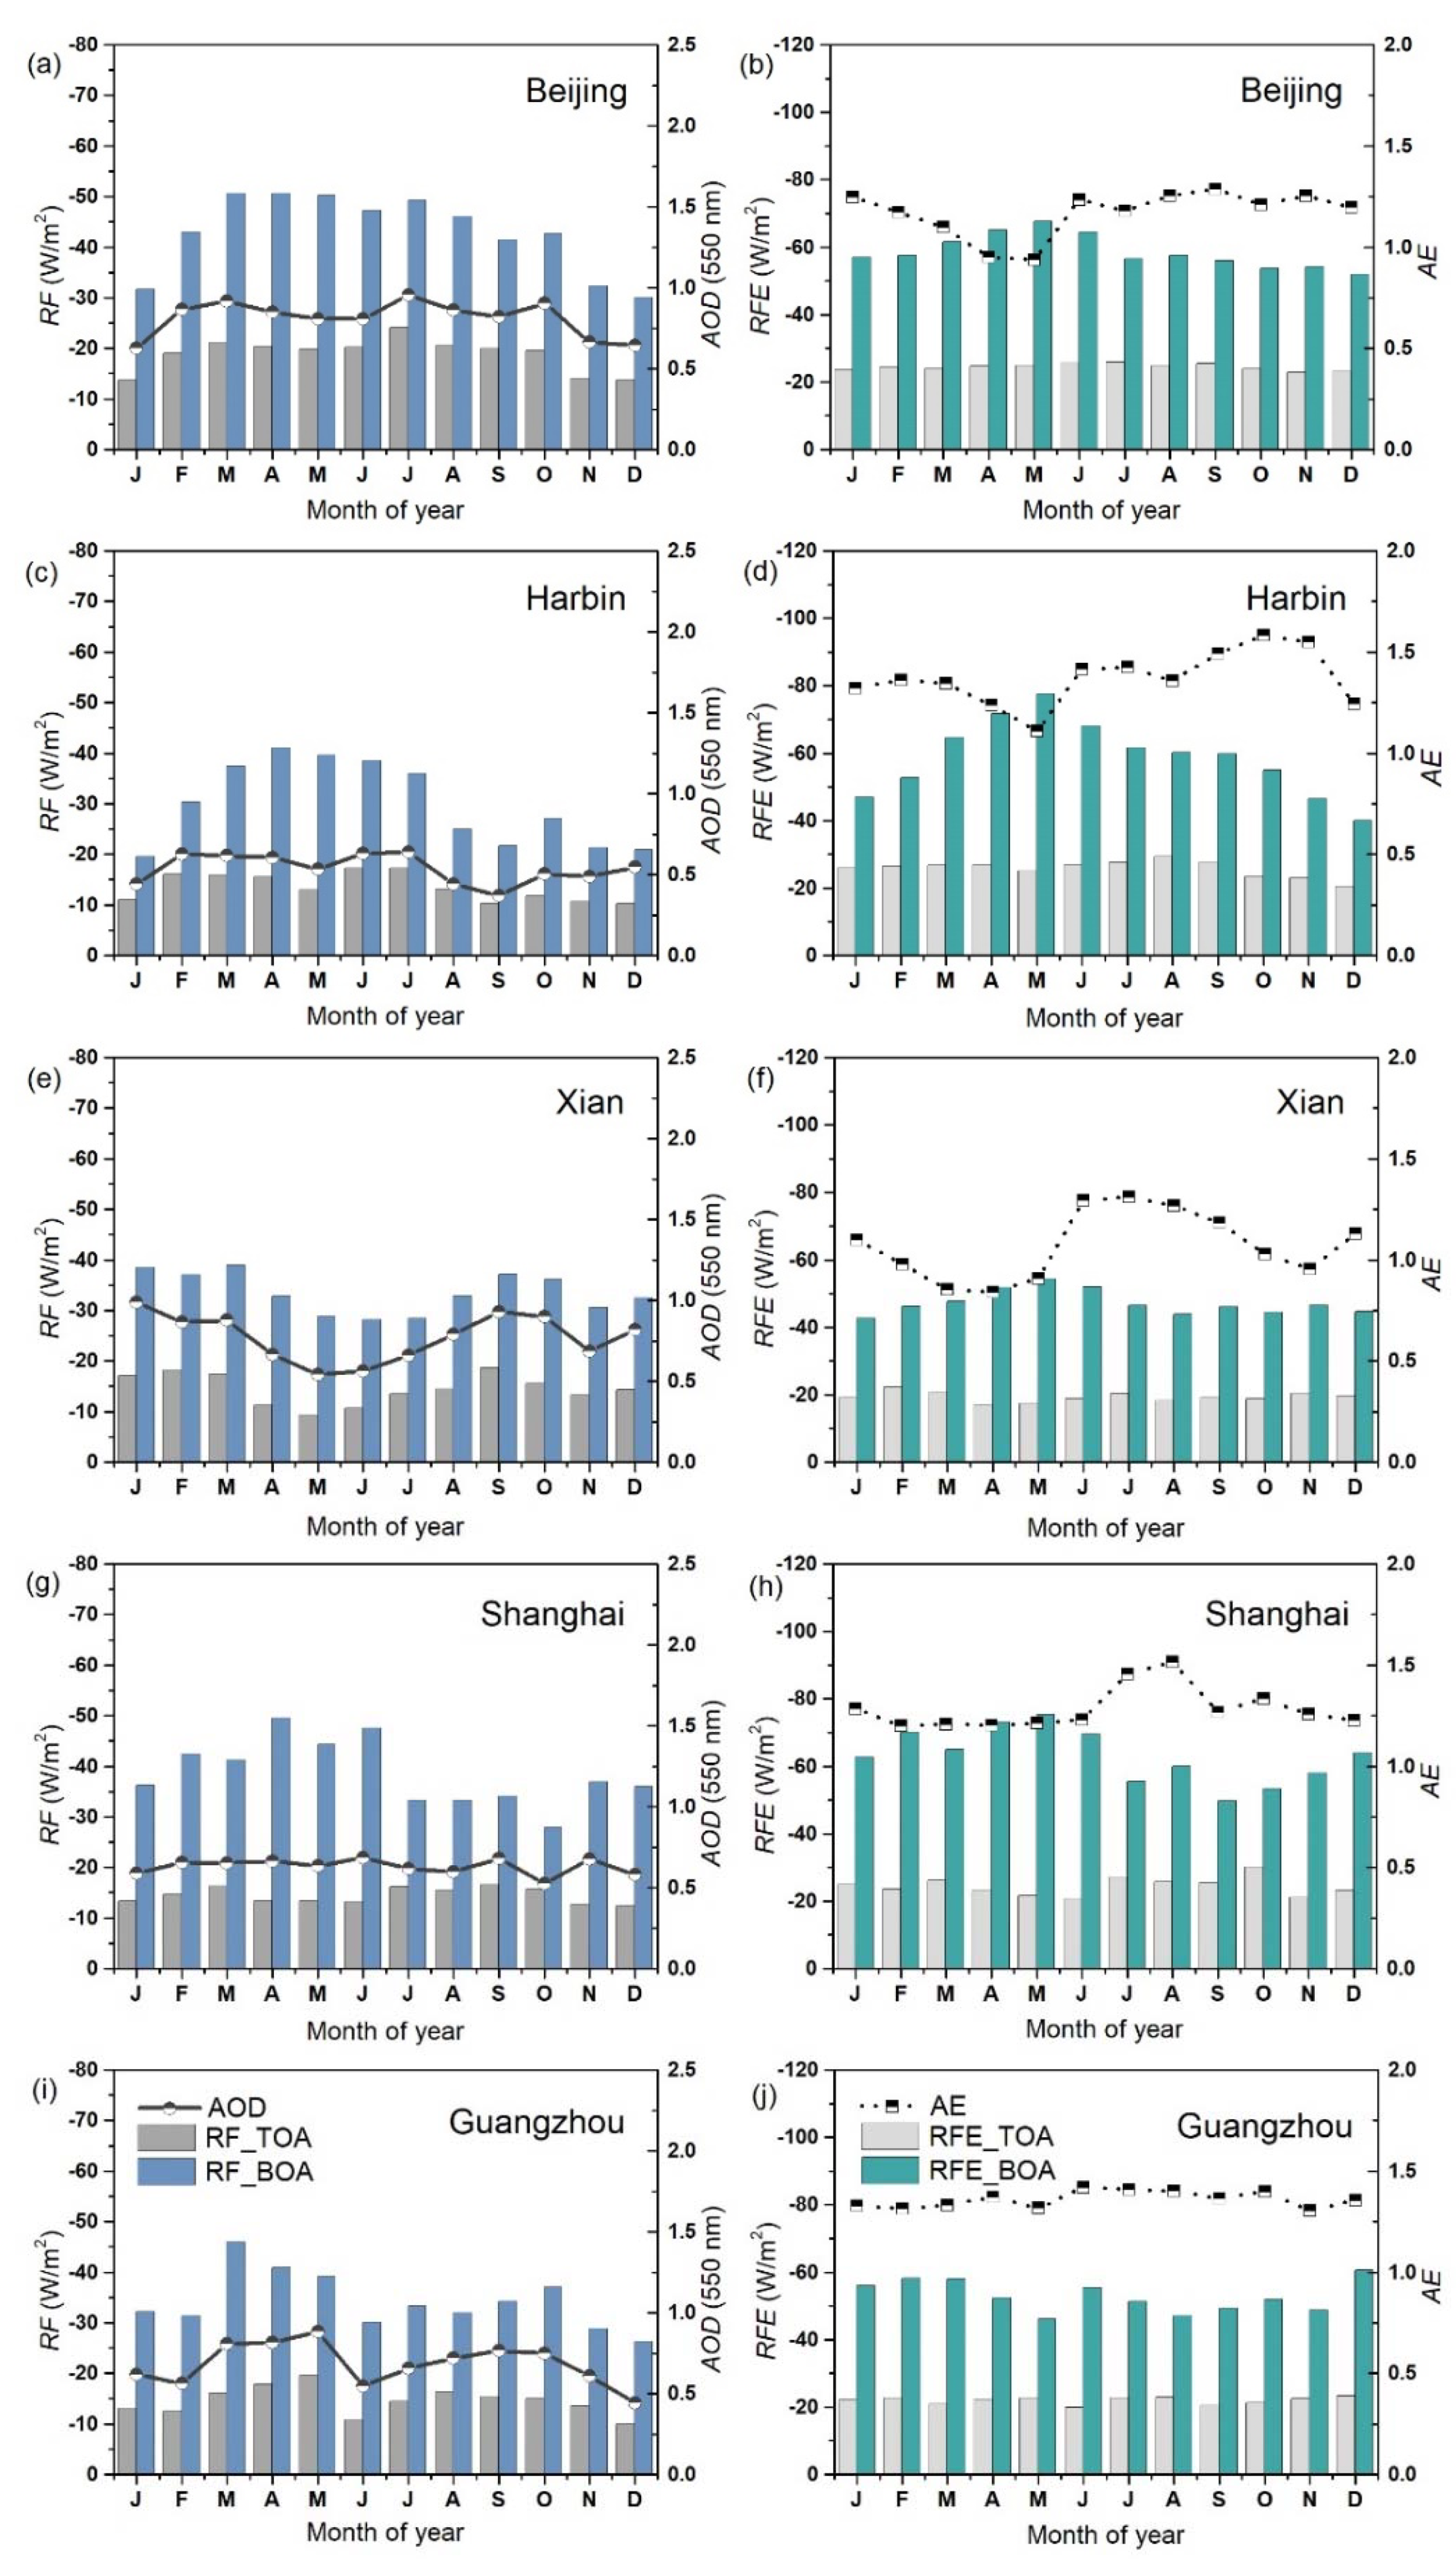
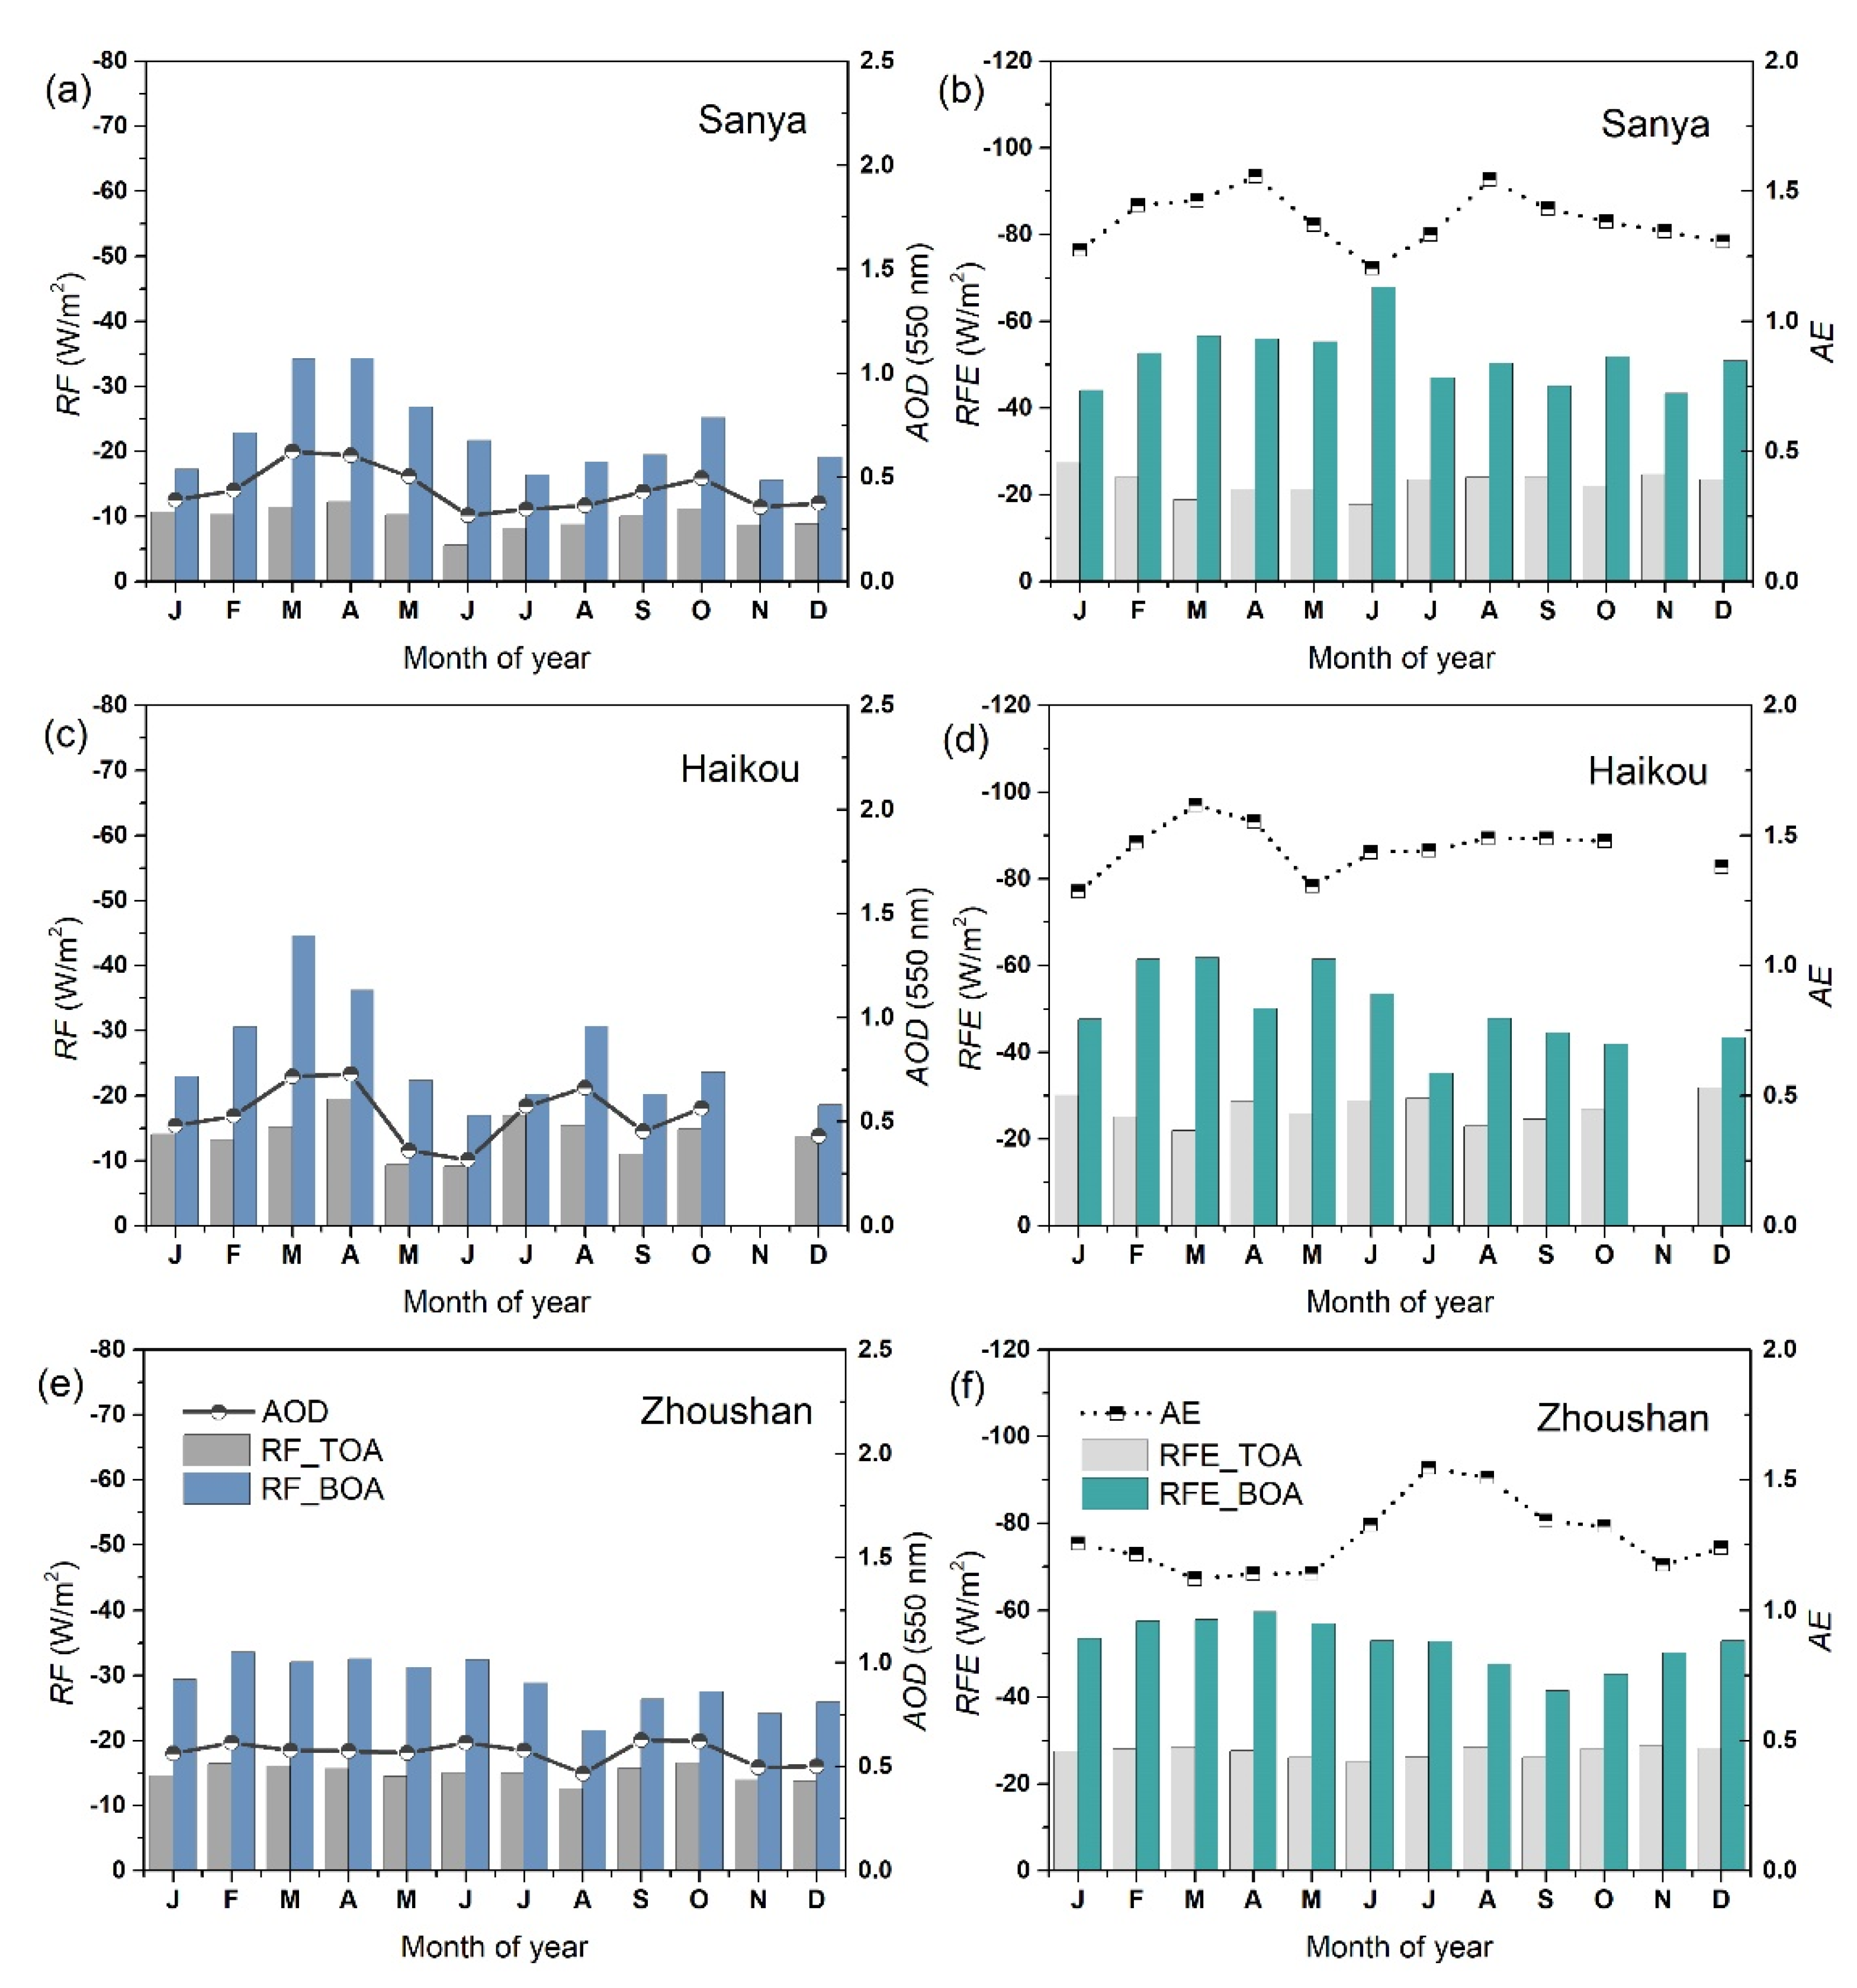
3.2. Annual Cycles of Aerosol Radiative Forcing and Efficiencies

Figure 2 shows the annual cycles of the aerosol RF and RFE and the corresponding AOD at 550 nm and AE (440–870 nm) at the arid and semi-arid sites which are influenced frequently by mineral dust. Generally, dust-dominant aerosol population exerted moderate monthly average cooling effects (−8.0~−31.2 W/m2) and efficiencies (−12.0~−29.7 W/m2) of radiative forcing at TOA and BOA at the Minqin, Zhangye, and Kashi sites. At Kashi, the AOD multi-year monthly averages were generally higher than those at Minqin and Zhangye, especially in March, April, and May (MAM). It is obvious that RF multi-year monthly averages were roughly associated with the variations of AOD. The higher aerosol loading at the Kashi site near the Taklimakan Desert corresponded to stronger cooling effects of radiative forcing, both at the top and bottom of the atmosphere, in comparison with the Minqin and Zhangye sites near the Gobi Desert. RF at Kashi also showed more obvious monthly variation than those at Minqin and Zhangye, with the strongest cooling effects in spring (i.e., MAM), and another peak in September. RFE (aerosol radiative forcing per unit of aerosol optical depth) are expected to reflect the direct radiative effects of different types of aerosols by eliminating the effects of aerosol loading, more or less [25]. Unlike RF, the multi-year monthly average values of RFE at the three dust dominant sites were analogous, even with significantly different aerosol loading. It is evident that RFE has a unique advantage to study the radiative effects of different aerosol types. The AE multi-year monthly averages were almost all less than 1.0, implying predominant dust particles at the arid and semi-arid sites. There was no obvious correlation between monthly trends of AE and RFE at these sites. It is also noticeable that the differences in RF and RFE between top and bottom of atmosphere (also known as solar radiative forcing and efficiencies in the atmosphere) were very small (<3.2 W/m2) at the arid and semi-arid sites.
Only one site (Lhasa) was identified as the continental background site in SONET. It is located on the Tibetan Plateau, far away from strong anthropogenic influences. The Lhasa site exhibited very low aerosol loading (AOD at 550 nm <0.16) and subtle changes of AOD and AE over the whole year. Figure 3 illustrates the effects of radiative forcing were very weak (−0.8~−2.9 W/m2). The RF multi-year monthly averages also varied with AOD and reached the peak in April with slight increasing of the AOD in spring. The Lhasa site was also dominated by coarse-mode particles with AE less than 1.0. Correspondingly, the RFE at Lhasa (−15.0~−25.8 W/m2) were moderate, and comparable with the coarse-mode dominant arid and semi-arid sites. The differences between the radiative forcing at the top and bottom of atmosphere were tiny (<0.2 W/m2 for RF and <1.4 W/m2 for RFE), suggesting aerosol particles at the clean continental background site presented very weak radiative effects in the atmosphere and were less efficient to warm the atmosphere.
Thirteen observation stations (65 percent) within the SONET are located in the urban and suburban areas. They are significantly influenced by anthropogenic aerosol pollutions. Among them, the Beijing, Harbin, Xian, Shanghai, and Guangzhou sites were selected from the Beijing–Tianjin–Hebei region, Heilongjiang–Jilin–Liaoning region, Fen–Wei plain, Yangtze River Delta region, and Pearl River Delta region, respectively, which are key regions for air pollution prevention and control in China. The annual cycles of the aerosol RF and RFE at the five typical urban sites are illustrated in Figure 4. For these urban sites, the multi-year monthly average values of AOD at 550 nm wavelength were greater than 0.5, and values of AE were greater than 1.0, principally, indicating the high aerosol loading and the dominant fine particles. From Figure 4, fine-mode dominant aerosol population exerted moderate cooling effects of radiative forcing (−9.3~−24.1 W/m2) at TOA, but more significant cooling effects (−19.4~−50.6 W/m2) at BOA. RFE multi-year monthly averages also showed only negative values both at TOA and BOA. It is remarkable that the differences between the RF values at TOA and BOA were very large (up to 36.2 W/m2), indicating the stronger warming effects of aerosol particles at the urban and suburban sites on the atmospheric dynamics than those at the arid and semi-arid sites and the continental background site. Correspondingly, the large differences (up to 53.5 W/m2) between the RFE values at the top and the bottom of atmosphere also can be observed at the urban and suburban sites, indicating dominance of the fine-mode aerosols were more efficient to warming the atmosphere.
For the same urban station, the annual cycles of RF at the top and bottom of atmosphere had similar patterns roughly correlated with the variations of AOD. They exhibited different monthly variations at different stations, especially clear for the RF at BOA. At Beijing, the effects of radiative forcing at BOA from November to January were obviously weaker than other months. At Shanghai and Guangzhou, the effects of radiative forcing at BOA were stronger from April to June, and from March to May, respectively. The absolute RF values at BOA were high from March to July at Harbin. Generally, the strongest cooling effects can be seen in spring for most of these urban sites (including Beijing, Harbin, Shanghai, and Guangzhou). In contrast, the negative RF values at BOA at Xian reached peak from January to March, which were in the heating season with enhanced anthropogenic influences (e.g., high emissions owing to coal consumption). There was no obvious monthly variation for the RFE at TOA, but the monthly patterns can also be observed in RFE at BOA at some urban sites. As a qualitative indicator of aerosol particle size, high AE values (mostly greater than 1.0) indicated aerosol particles at these urban sites were mainly dominated by fine particles. Weak negative correlations can be roughly observed between the RFE at BOA and AE at the five urban sites, but the correlation cannot be found at the arid, semi-arid, and continental background sites.
The Sanya, Haikou, and Zhoushan sites are located in the coastal region, which are influenced not only by marine aerosol particles, but also by urban–industrial aerosol particles originating from cities or towns nearby. From Figure 5, the multi-year monthly average values of AE (440–870 nm) at the coastal sites (>1.1) were comparable with the urban and suburban sites (see Figure 4), indicating that they were also dominated by fine-mode particles other than the coarse-mode sea salt particles. The three coastal sites showed high aerosol loading with AOD at 550 nm wavelength, changing around 0.5 during the whole year, which was also approximate to some urban and suburban sites. At the coastal sites, the multi-year monthly average values of RF varied from −5.5 W/m2 to −19.5 W/m2 at TOA, and from −15.6 W/m2 to −44.6 W/m2 at BOA. The monthly variations of RF at BOA were obvious at Sanya and Haikou, with the main peak in spring and secondary peak in October or August, corresponding to the changes of AOD. However, for radiative effects at Zhoushan, there was no obvious monthly change, especially for the RF at TOA. The values of RFE showed different variations during the whole year, in comparison with RF at the coastal sites. They roughly appeared as negative correlations with AE, just like the urban and suburban sites. The RFE multi-year monthly averages at TOA (from −17.6 W/m2 to −30.0 W/m2) and at BOA (−35.2 W/m2 to −67.9 W/m2) also presented large differences (up to 50.2 W/m2).

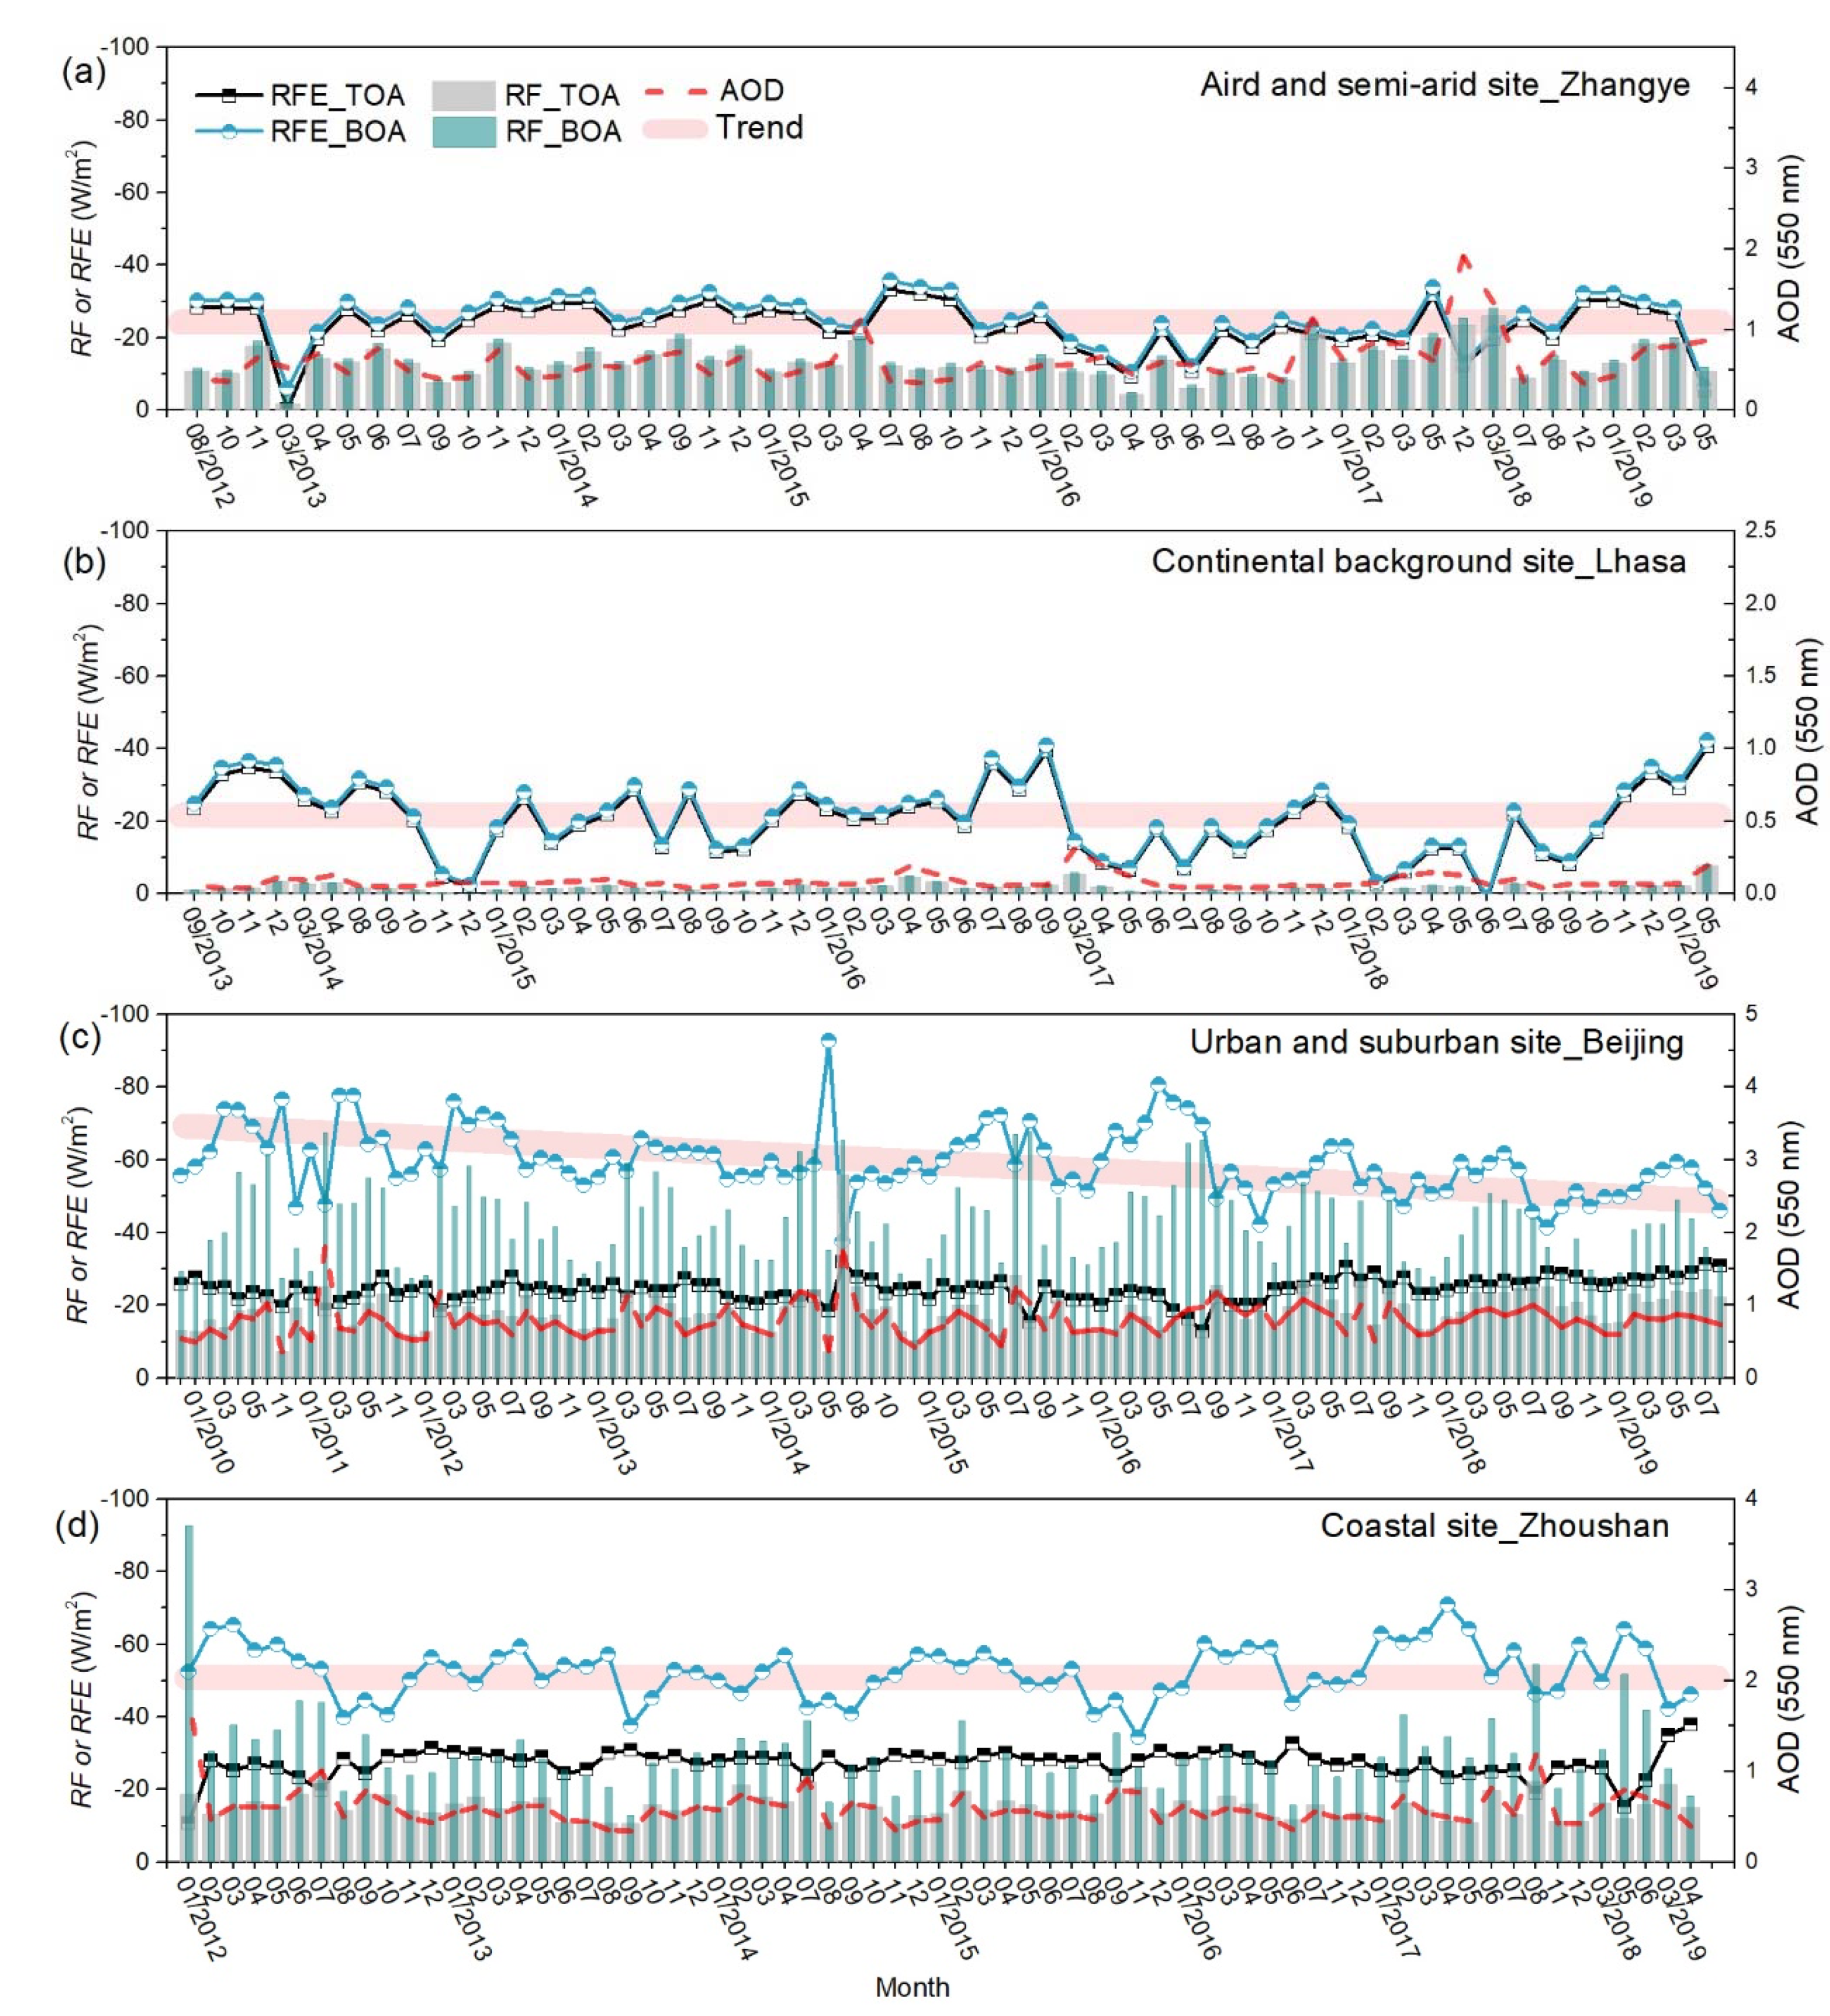
3.3. Long-Term Variations of Monthly Average Aerosol Radiative Forcing and Efficiencies

The variations of monthly average aerosol RF and RFE at the four types of selected sites with long-term observations lasted more than five years (including the arid and semi-arid site Zhangye, the continental background site Lhasa, the urban and suburban site Beijing, and the coastal site Zhoushan) are illustrated in Figure 6. Almost only negative monthly average values of RF and RFE, indicating mainly cooling effects of aerosol particles at the four types of sites, were estimated both at TOA and BOA. In addition, the RFs at BOA were always stronger than those at TOA (i.e., the differences between RFs at TOA and BOA were positive), suggesting the warming effects within the entire atmospheric column at the four types of sites. However, the intensities of the warming effects in the atmosphere were significantly different, which can be divided into two distinct groups (i.e., Zhangye and Lhasa in one group, Beijing and Zhoushan in another group). The former group is located at the arid, semi-arid, and continental background sites with very weak aerosol warming effects in the atmosphere and less warming efficiency (the differences between RFE at TOA and BOA were less than 5.8 W/m2 at Zhangye and less than 1.9 W/m2 at Lhasa). The latter group is located at the urban, suburban, and coastal sites with strong effects and more efficiency to warm the atmosphere (the differences between RFE at TOA and BOA reached up to 74.1 W/m2 at Beijing, and 49.0 W/m2 at Zhoushan). This can be partly attributed to dominant aerosol components at different types of sites. Previous study has illustrated that the fine-mode black carbon (BC) and brown carbon (BrC) components (with strong light absorbing effects to heat the atmosphere) at the urban, suburban, and coastal sites within SONET are obviously higher than those at the arid, semi-arid, and the continental background sites [14]. Then, fine-mode dominant aerosols at urban, suburban, and coastal sites were more efficient in warming the atmosphere (with large difference between RFE at TOA and BOA), in comparison to the coarse-mode dominant aerosols at arid, semi-arid, and continental background sites.
From Figure 6, it is obvious that aerosol RF monthly averages at TOA and BOA changed with fluctuation of aerosol optical depth. There were no significant trends in aerosol loadings over the observation time periods at the four sites. Thus, RFs at TOA and BOA also did not form clear trends over the observation time periods at these stations. As discussed above, RFE is mostly insensitive to AOD, and has the advantage to reflect aerosol radiative forcing of different types of particles. Then, RFE long-term monthly averages were analyzed. Generally, there was no obvious upward or downward trend in RFE at TOA and BOA at the Zhangye, Lhasa, and Zhoushan, as well as RFE at TOA at Beijing. In contrast, a downward trend can be observed in time series of monthly average RFE at BOA at the Beijing site (see Figure 6c). That indicates the aerosol cooling efficiency at the surface and the warming efficiency within the atmosphere all declined at Beijing over the past decade. This finding can also be supported by comparison with the previous reports on the long-term average aerosol radiative forcing efficiencies at the four sites (Table 4) [14]. Although the simulated solar spectrum ranges were not exact matches (i.e., 0.3~2.8 µm for the previous study, and 0.2~4.0 µm for this study), an existing study has demonstrated that it does not make a big difference in estimations of aerosol radiative forcing [12]. The RFE multi-year averages were calculated from the beginning of each site (Table 4) to 2016 in the previous study [14], but were extended to 2019 in this study. According to Table 4, there was an obvious absolute difference (3.0 W/m2) at Beijing between RFE at BOA reported by the previous study and this study. It is evident that the forcing efficiencies at BOA have declined, with the multi-year average values of RFE varying from −62.4 W/m2 to −59.4 W/m2.
The declining tendency of RFE at BOA at Beijing could not be attributed to the changes of total emission of aerosol particles, considering that RFE is mostly insensitive to aerosol loading, and AOD did not show a similar trend (Figure 6c). As discussed before, the fine-mode dominant aerosols at urban sites were more efficient (with large positive RFE values) to heat the atmosphere column and more efficient (with large negative RFE values) to cooling the bottom of atmosphere. It has been demonstrated by previous study that the long-term temporal distribution of BC shows a distinct declining trend at Beijing [32,33]. Therefore, the evolution of fine-mode light-absorbing components (e.g., BC) at Beijing is probably one of the major factors involved.

4. Discussion and Conclusions

The significant direct effects of absorbing and scattering of solar radiation by atmospheric aerosol particles, which are commonly quantified by the aerosol direct radiative forcing (RF), could result in regional and global climate changes. Estimates of aerosol direct radiative forcing over a long timescale are essential in evaluating the changes of climate. However, it is not an easy task to estimate the long-term effects and variations of aerosol radiative forcing in China accurately, due to the significant spatial and temporal heterogeneities of atmospheric aerosols, and complex chemical compositions. Estimations of aerosol direct radiative forcing by radiative transfer simulations are susceptible to aerosol properties of the entire atmospheric column (including the aerosol optical depth, the single scattering albedo, the asymmetry factor, and the Ångström exponent). The Sun–Sky Radiometer Observation Network (SONET) provides a dataset of columnar atmospheric aerosol properties with high accuracy at 20 distributed stations around China, dating back to 2009, that makes it possible to study the long-term aerosol RF based on the ground-based observations. This study concentrates on the long-term effects and variations of aerosol direct radiative forcing and efficiency in China, which were simulated by the SBDART model with the inputs of key aerosol parameters obtained by the SONET observations from the beginning of each site to 2019.
Generally, all SONET sites showed negative values of multi-year average aerosol RF and RFE, indicating the cooling effects both at the top and bottom of atmosphere over a long-term scale. The continental background site Lhasa had the lowest (in absolute terms) multi-year average RF (−1.6 ± 2 W/m2 at TOA and −1.7 ± 2 W/m2 at BOA), and the urban site Beijing had the strongest radiative effects (−18.7 ± 10 W/m2 at TOA and −43.4 ± 18 W/m2 at BOA) among all 20 sites within SONET around China. However, the urban site Shanghai had the strongest RFE multi-year average (−65.3 ± 22 W/m2) at BOA. The aerosol cooling effects at BOA were stronger than those at TOA (i.e., difference between RFs at TOA and BOA was positive), suggesting overall atmospheric warming effects of aerosols at different types of sites. However, the heating efficiencies of aerosols at different types of sites to the atmosphere were significantly different. The fine-mode light-absorbing components dominant at urban, suburban, and coastal sites were more efficient to warming the atmosphere (with large difference between RFEs at TOA and BOA), in comparison to the coarse-mode dominant aerosols (with stronger scattering effects) at the arid, semi-arid, and continental background sites.
As for long-term variations of monthly average values, aerosol RFs at TOA and BOA changed with fluctuation of aerosol optical depth. There were no clear trends in RFs and aerosol loadings over the observation time periods at the four typical sites (Zhangye, Lhasa, Zhoushan, and Beijing). However, there was a downward trend in aerosol RFE at BOA at the Beijing site, indicating the aerosol cooling efficiency at the surface and the warming efficiency within the atmosphere all declined at Beijing over the past decade. Considering that RFE is mostly insensitive to AOD and can reflect aerosol radiative forcing of different types of particles, the declining trend could not be attributed to the changes of aerosol loading, but is probably due to the decrease of fine-mode light-absorbing components (e.g., black carbon). The reason should be further investigated by adding more information on various atmospheric aerosol constituents, and even their precursor gases, over a long timescale in subsequent studies. Moreover, the observation periods at some SONET stations are still limited (less than five years). More systematic researches on trends of aerosol RF and RFE should be conducted on extended timescales in future.

Author Contributions

Conceptualization, Z.L. and L.L.; methodology, L.L.; formal analysis, L.L.; resources, K.L., H.X., Q.T., X.S., L.Y. and S.Y.; data curation, K.L. and H.X.; writing—original draft preparation, L.L.; writing—review and editing, L.L.; supervision, Y.W.; project administration, Z.L.; funding acquisition, L.L. and Z.L. All authors have read and agreed to the published version of the manuscript.

Funding

This research was supported by the National Natural Science Foundation of China (NSFC), (Grant No. 41871271, 41925019) and the Key Collaborative Research Program of the Alliance of International Science Organizations, (Grant No. ANSO-CR-KP-2020-09).

Acknowledgments

The authors acknowledge Wenqing Yang, Jianping Wang, Weibo Du, Yong Hu, Cailan Gong, Xiaofei Wang, Xiaobing Sun, Guangdong Lan, Yongqian Wang, Yang Zhang, Zhenghua Chen, Wei Zhao, and Bei Huang for maintaining the operations of the Minqin, Kashi, Shanghai, Harbin, Hefei, Guangzhou, Chengdu, Nanning, Sanya, and Zhoushan stations, respectively. We are grateful to the group of MODIS for making the surface albedo product available. The first author thanks Yang Ou for the help in data collection. The first author also wishes to thank Manfred Wendisch for the valuable suggestions on result analysis. We are grateful to the anonymous reviewers whose valuable comments and suggestions have helped us to improve the paper.

Conflicts of Interest

The authors declare no conflict of interest.

References

  1. IPCC. Climate Change 2007: The Physical Science Basis; Contribution of Working Group I to the Fourth Assessment Report of the Intergovernmental Panel on Climate Change; Cambridge University Press: Cambridge, UK; New York, NY, USA, 2007; pp. 29–32. [Google Scholar]
  2. Bergamo, A.; Tafuro, A.M.; Kinne, S.; De Tomasi, F.; Perrone, M.R. Monthly-averaged anthropogenic aerosol direct radiative forcing over the Mediterranean based on AERONET aerosol properties. Atmos. Chem. Phys. 2008, 8, 6995–7014. [Google Scholar] [CrossRef] [Green Version]
  3. Arkian, F.; Nicholson, S.E. Long-term variations of aerosol optical depth and aerosol radiative forcing over Iran based on satellite and AERONET data. Environ. Monitor. Assess. 2018, 190, 1–15. [Google Scholar] [CrossRef] [PubMed]
  4. Kim, N.K.; Kim, Y.; Kang, C. Long-term trend of aerosol composition and direct radiative forcing due to aerosols over Gosan: TSP, PM10, and PM2.5 data between 1992 and 2008. Atmos. Environ. 2011, 45, 6107–6115. [Google Scholar] [CrossRef]
  5. Elmetwally, M.; Alfaro, S.C.; Wahab, M.M.A.; Favez, O.; Mohamed, Z.; Chatenet, B. Aerosol properties and associated radiative effects over Cairo (Egypt). Atmos. Res. 2011, 99, 263–276. [Google Scholar] [CrossRef]
  6. Gharibzadeh, M.; Alam, K.; Abedini, Y.; Bidokhti, A.A.; Masoumi, A. Monthly and seasonal variations of aerosol optical properties and direct radiative forcing over Zanjan, Iran. J. Atmos. Sol. Terr. Phys. 2017, 164, 268–275. [Google Scholar] [CrossRef]
  7. Garcia, O.; Diaz, J.P.; Exposito, F.J.; Diaz, A.M.; Dubovik, O.; Derimian, Y.; Dubuisson, P.; Roger, J. Shortwave radiative forcing and efficiency of key aerosol types using AERONET data. Atmos. Chem. Phys. 2012, 12, 5129–5145. [Google Scholar] [CrossRef] [Green Version]
  8. Valenzuela, A.; Olmo, F.J.; Lyamani, H.; Anton, M.; Quirantes, A.; Aladosarboledas, L. Aerosol radiative forcing during African desert dust events (2005–2010) over Southeastern Spain. Atmos. Chem. Phys. 2012, 12, 10331–10351. [Google Scholar] [CrossRef] [Green Version]
  9. Yoon, S.; Won, J.; Omar, A.; Kim, S.W.; Sohn, B. Estimation of the radiative forcing by key aerosol types in worldwide locations using a column model and AERONET data. Atmos. Environ. 2005, 39, 6620–6630. [Google Scholar] [CrossRef]
  10. Wendisch, M.; Hellmuth, O.; Ansmann, A.; Heintzenberg, J.; Engelmann, R.; Althausen, D.; Eichler, H.; Muller, D.; Hu, M.; Zhang, Y. Radiative and dynamic effects of absorbing aerosol particles over the Pearl River Delta, China. Atmos. Environ. 2008, 42, 6405–6416. [Google Scholar] [CrossRef]
  11. Bierwirth, E.; Wendisch, M.; Ehrlich, A.; Heese, B.; Tesche, M.; Althausen, D.; Schladitz, A.; Muller, D.; Otto, S.; Trautmann, T. Spectral surface albedo over Morocco and its impact on radiative forcing of Saharan dust. Tellus B 2009, 61, 252–269. [Google Scholar] [CrossRef] [Green Version]
  12. Li, L.; Li, Z.; Chang, W.; Ou, Y.; Goloub, P.; Li, C.; Li, K.; Hu, Q.; Wang, J.; Wendisch, M. Aerosol solar radiative forcing near the Taklimakan Desert based on radiative transfer and regional meteorological simulations during the Dust Aerosol Observation-Kashi campaign. Atmos. Chem. Phys. 2020, 20, 10845–10864. [Google Scholar] [CrossRef]
  13. Bi, J.; Huang, J.; Hu, Z.; Holben, B.N.; Guo, Z. Investigating the aerosol optical and radiative characteristics of heavy haze episodes in Beijing during January of 2013. J. Geophys. Res. 2014, 119, 9884–9900. [Google Scholar] [CrossRef]
  14. Li, Z.; Xu, H.; Li, K.T.; Li, D.; Xie, Y.S.; Li, L.; Zhang, Y.; Gu, X.; Zhao, W.; Tian, Q.J. Comprehensive study of optical, physical, chemical, and radiative properties of total columnar atmospheric aerosols over China: An overview of sun–sky radiometer observation network (SONET) measurements. Bull. Am. Meteorol. Soc. 2018, 99, 739–755. [Google Scholar] [CrossRef]
  15. Che, H.; Xia, X.; Zhu, J.; Li, Z.; Dubovik, O.; Holben, B.N.; Goloub, P.; Chen, H.; Estelles, V.; Cuevasagullo, E. Column aerosol optical properties and aerosol radiative forcing during a serious haze-fog month over North China plain in 2013 based on ground-based sunphotometer measurements. Atmos. Chem. Phys. 2013, 14, 2125–2138. [Google Scholar] [CrossRef] [Green Version]
  16. Che, H.; Qi, B.; Zhao, H.; Xia, X.; Eck, T.F.; Goloub, P.; Dubovik, O.; Estelles, V.; Cuevasagullo, E.; Blarel, L. Aerosol optical properties and direct radiative forcing based on measurements from the China Aerosol Remote Sensing Network (CARSNET) in eastern China. Atmos. Chem. Phys. 2018, 18, 405–425. [Google Scholar] [CrossRef] [Green Version]
  17. Chen, W.; Yan, L.; Ding, N.; Xie, M.; Lu, M.; Zhang, F.; Duan, Y.; Zong, S. Analysis of aerosol radiative forcing over beijing under different air quality conditions using ground-based sun-photometers between 2013 and 2015. Remote Sens. 2016, 8, 510. [Google Scholar] [CrossRef] [Green Version]
  18. He, L.; Wang, L.; Lin, A.; Zhang, M.; Bilal, M.; Tao, M. Aerosol optical properties and associated direct radiative forcing over the Yangtze river basin during 2001–2015. Remote Sens. 2017, 9, 746. [Google Scholar] [CrossRef] [Green Version]
  19. Zhuang, B.; Wang, T.; Liu, J.; Che, H.; Han, Y.; Fu, Y.; Li, S.; Xie, M.; Li, M.; Chen, P. The optical properties, physical properties and direct radiative forcing of urban columnar aerosols in the Yangtze river delta, China. Atmos. Chem. Phys. 2018, 18, 1419–1436. [Google Scholar] [CrossRef] [Green Version]
  20. Qin, K.; Wang, L.; Xu, J.; Letu, H.; Zhang, K.; Li, D.; Zou, J.; Fan, W. Haze optical properties from long-term ground-based remote sensing over Beijing and Xuzhou, China. Remote Sens. 2018, 10, 518. [Google Scholar] [CrossRef] [Green Version]
  21. Li, Z.; Li, D.; Li, K.; Xu, H.; Cheng, X.; Chen, C.; Xie, Y.; Li, L.; Li, L.; Li, W.; et al. Sun-sky radiometer observation network with the extension of multi-wavelength polarization measurements. J. Remote Sens. 2015, 19, 496–520. [Google Scholar] [CrossRef]
  22. Dubovik, O.; Sinyuk, A.; Lapyonok, T.; Holben, B.N.; Mishchenko, M.I.; Yang, P.; Eck, T.F.; Volten, H.; Munoz, O.; Veihelmann, B. Application of spheroid models to account for aerosol particle nonsphericity in remote sensing of desert dust. J. Geophys. Res. 2006, 111. [Google Scholar] [CrossRef] [Green Version]
  23. Li, Z.; Goloub, P.; Dubovik, O.; Blarel, L.; Zhang, W.; Podvin, T.; Sinyuk, A.; Sorokin, M.G.; Chen, H.; Holben, B.N. Improvements for ground-based remote sensing of atmospheric aerosol properties by additional polarimetric measurements. J. Quant. Spectrosc. Radiat. Transf. 2009, 110, 1954–1961. [Google Scholar] [CrossRef]
  24. Li, L.; Li, Z.; Li, K.; Blarel, L.; Wendisch, M. A method to calculate Stokes parameters and angle of polarization of skylight from polarized CIMEL sun/sky radiometers. J. Quant. Spectrosc. Radiat. Transf. 2014, 149, 334–346. [Google Scholar] [CrossRef] [Green Version]
  25. Garcia, O.; Diaz, A.M.; Exposito, F.J.; Diaz, J.P.; Dubovik, O.; Dubuisson, P.; Roger, J.; Eck, T.F.; Sinyuk, A.; Derimian, Y. Validation of AERONET estimates of atmospheric solar fluxes and aerosol radiative forcing by ground-based broadband measurements. J. Geophys. Res. 2008, 113. [Google Scholar] [CrossRef]
  26. Li, F.; Vogelmann, A.M.; Ramanathan, V. Saharan dust aerosol radiative forcing measured from space. J. Clim. 2004, 17, 2558–2571. [Google Scholar] [CrossRef]
  27. Babu, S.S.; Satheesh, S.K.; Moorthy, K.K. Aerosol radiative forcing due to enhanced black carbon at an urban site in India. Geophys. Res. Lett. 2002, 29, 27-1–27-4. [Google Scholar] [CrossRef]
  28. Ricchiazzi, P.; Yang, S.; Gautier, C.; Sowle, D. SBDART: A Research and teaching software tool for plane-parallel radiative transfer in the Earth’s atmosphere. Bull. Am. Meteorol. Soc. 1998, 79, 2101–2114. [Google Scholar] [CrossRef] [Green Version]
  29. Sena, E.T.; Artaxo, P.; Correia, A.L. Spatial variability of the direct radiative forcing of biomass burning aerosols and the effects of land use change in Amazonia. Atmos. Chem. Phys. 2013, 13, 1261–1275. [Google Scholar] [CrossRef] [Green Version]
  30. Liang, S. Narrowband to broadband conversions of land surface albedo I Algorithms. Remote Sens. Environ. 2000, 76, 213–238. [Google Scholar] [CrossRef]
  31. Schaaf, C.B.; Gao, F.; Strahler, A.H.; Lucht, W.; Li, X.; Tsang, T.; Strugnell, N.C.; Zhang, X.; Jin, Y.; Muller, J.P. First operational BRDF, albedo nadir reflectance products from MODIS. Remote Sens. Environ. 2002, 83, 135–148. [Google Scholar] [CrossRef] [Green Version]
  32. Chen, Y.; Schleicher, N.; Fricker, M.; Cen, K.; Liu, X.L.; Kaminski, U.; Yu, Y.; Wu, X.F.; Norra, S. Long-term variation of black carbon and PM2.5 in Beijing, China with respect to meteorological conditions and governmental measures. Environ. Pollut. 2016, 212, 269–278. [Google Scholar] [CrossRef] [PubMed]
  33. Guo, B.; Wang, Y.; Zhang, X.; Che, H.; Yi, Z. Long-term variation of black carbon aerosol in China based on revised aethalometer monitoring data. Atmosphere 2020, 11, 684. [Google Scholar] [CrossRef]
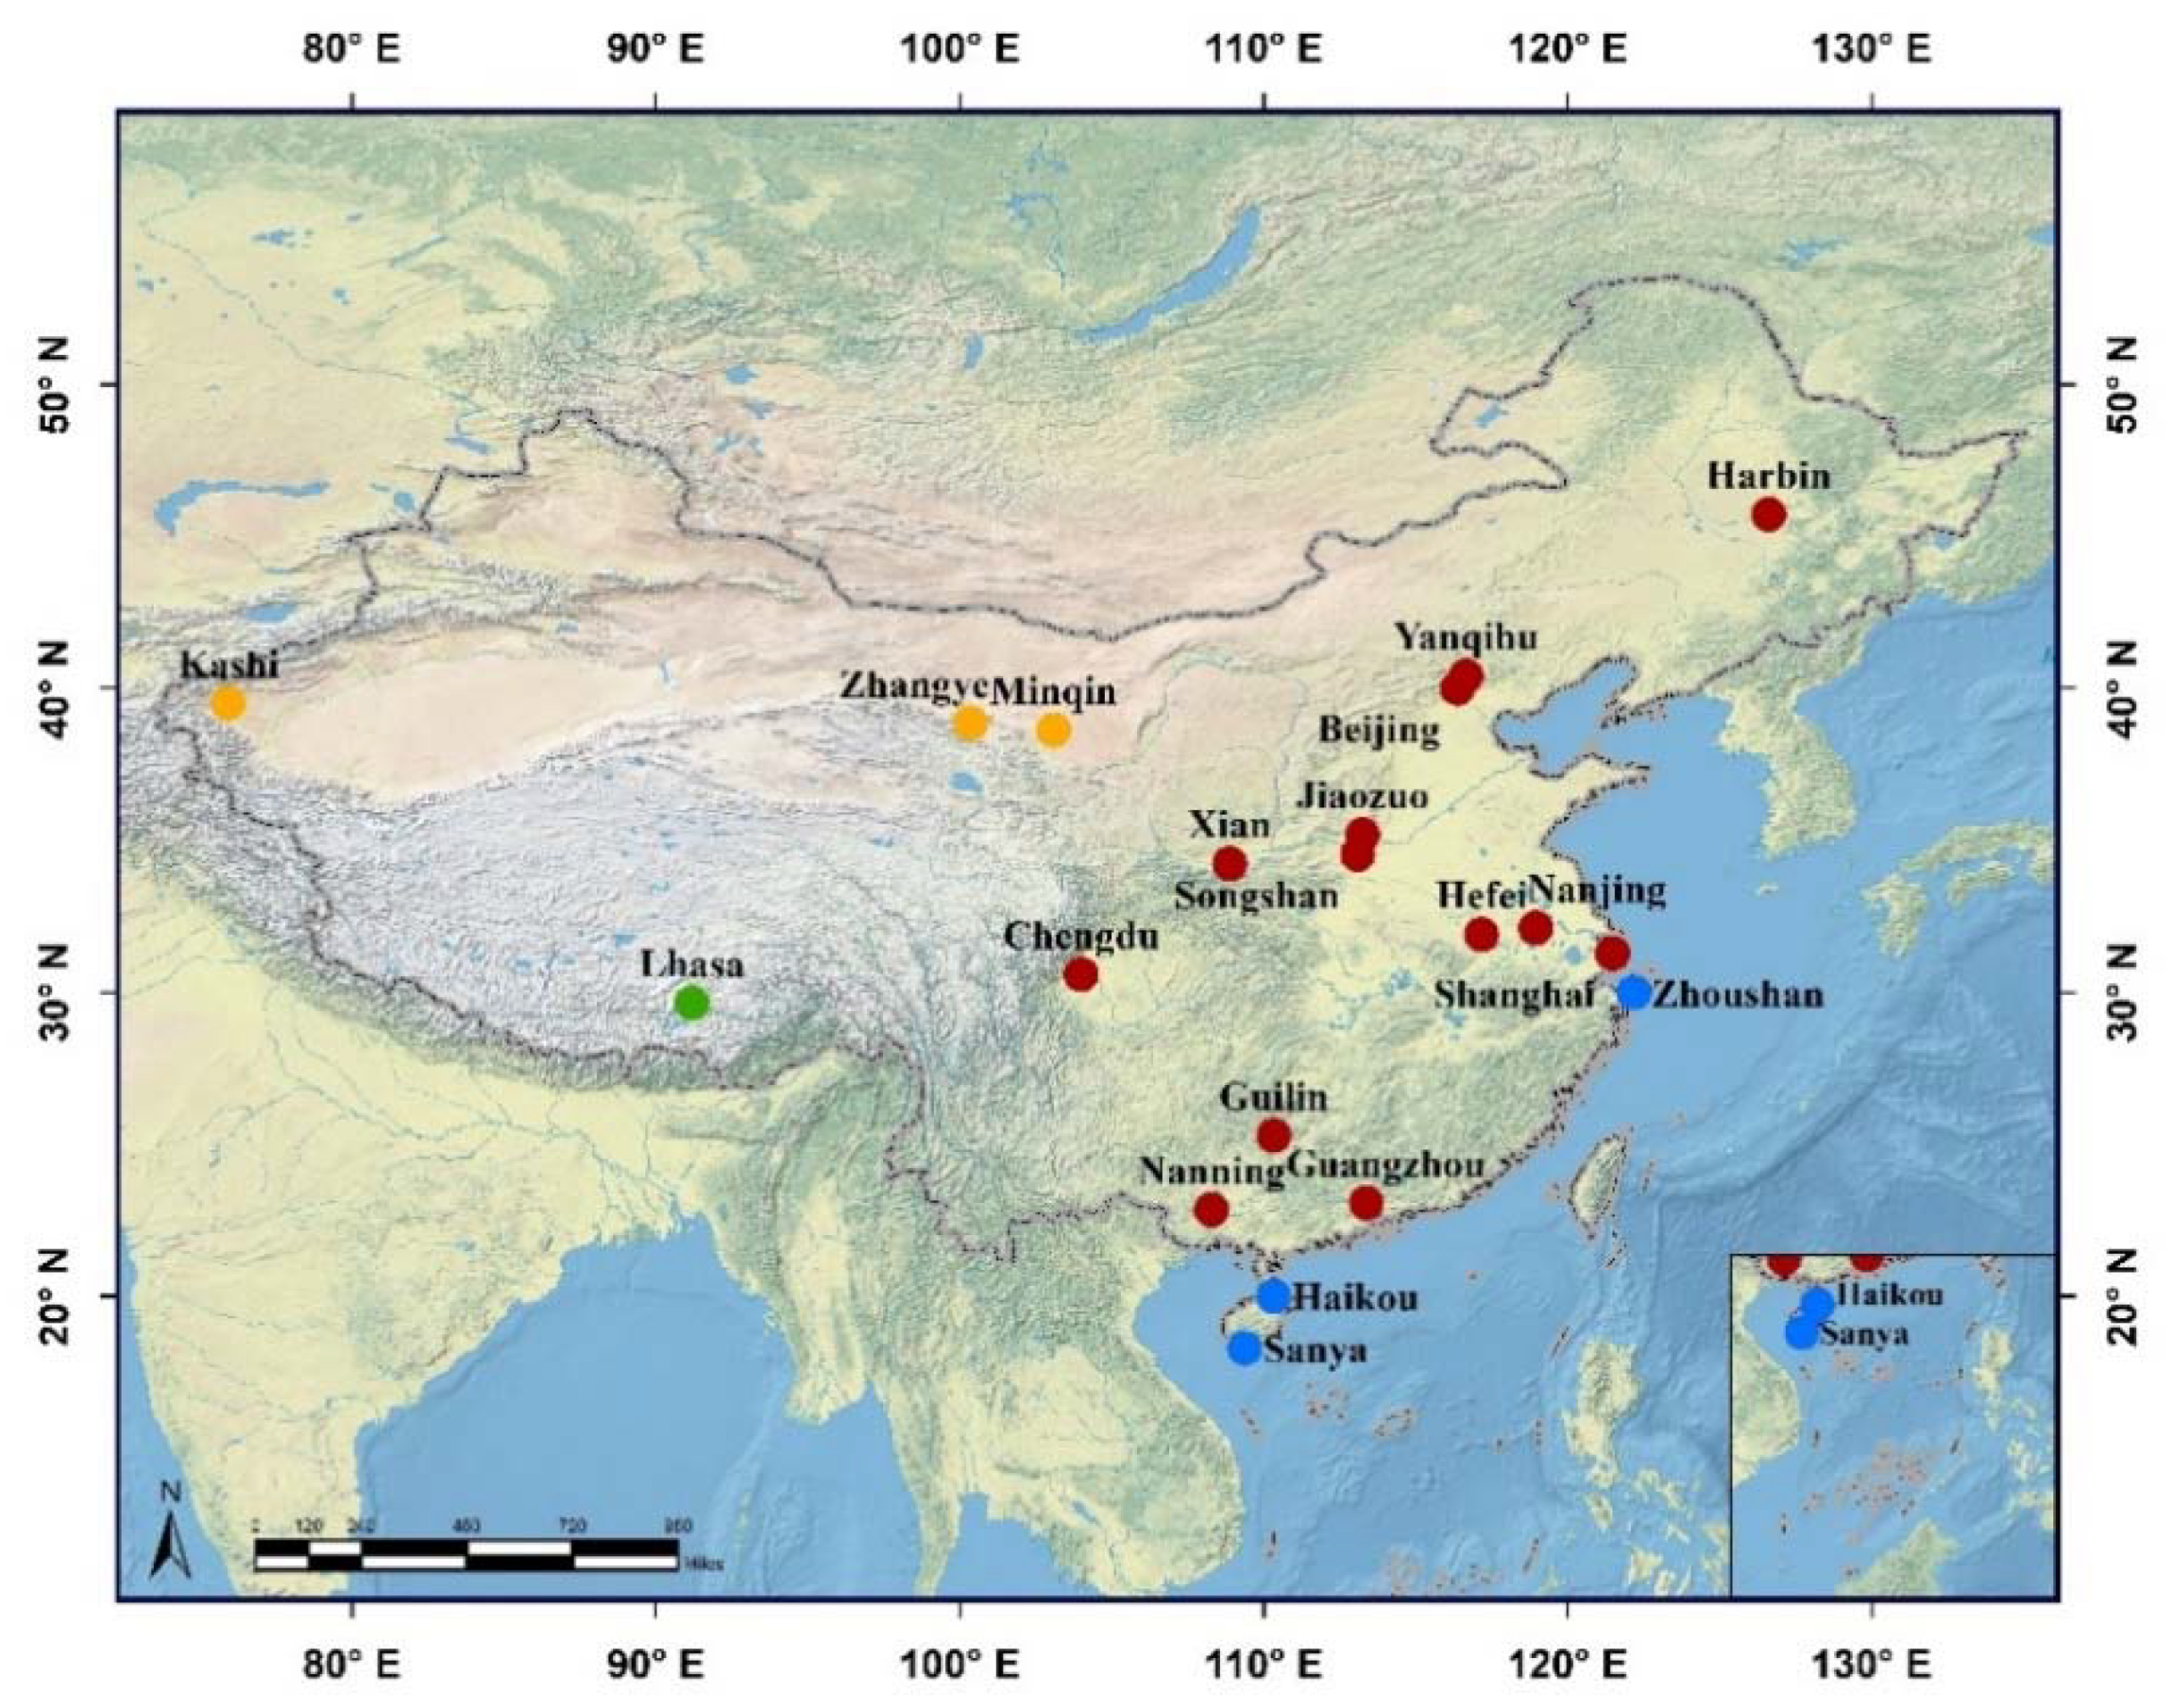
Figure 1. Geographical locations of the SONET long-term observation stations (orange dots: arid and semi-arid sites; green dot: continental background site; red dots: urban and suburban sites; blue dots: coastal sites).
Remotesensing 12 03296 g001
Figure 2. Multi-year monthly average aerosol radiative forcing (RF) and efficiencies (RFE) and corresponding aerosol optical depth (AOD) at 550 nm and Ångström exponent (AE) (440–870 nm) at the SONET arid and semi-arid sites. (a,b) Minqin; (c,d) Zhangye; (e,f) Kashi.
Remotesensing 12 03296 g002
Figure 3. As Figure 2, but for the SONET continental background site. (a) RF at Lhasa; (b) RFE at Lhasa.
Remotesensing 12 03296 g003
Figure 4. As Figure 2, but for the SONET urban and suburban sites. (a,b) Beijing; (c,d) Harbin; (e,f) Xian; (g,h) Shanghai; (i,j) Guangzhou.
Remotesensing 12 03296 g004
Figure 5. As Figure 2, but for the SONET coastal sites. (a,b) Sanya; (c,d) Haikou; (e,f) Zhoushan.
Remotesensing 12 03296 g005
Figure 6. Monthly average aerosol RF and RFE and corresponding AOD at 550 nm at four types of sites: (a) arid and semi-arid site Zhangye; (b) continental background site Lhasa; (c) urban and suburban site Beijing; (d) coastal site Zhoushan.
Remotesensing 12 03296 g006
Table 1. Overview of the Sun–Sky Radiometer Observation Network (SONET) long-term stations and corresponding time period of observations.
TypeStationLon (˚E)Lat (˚N)Alt (m)Time Period of ObservationNumber of Days
arid and semi-arid sitesMinqin103.038.61364.0February 2012–August 2019191
Zhangye100.338.81589.0August 2012–May 2019157
Kashi75.939.51320.0September 2013–July 2019264
continental background siteLhasa91.229.63678.0September 2013–May 2019906
urban and suburban sitesBeijing116.340.059.0December 2009–August 20191058
Yanqihu116.740.4100.0December 2015–September 2019289
Jiaozuo113.335.2113.0June 2016–February 2018233
Shanghai121.531.384.5March 2013–July 2019437
Harbin126.645.7223.0December 2013–April 2019323
Hefei117.231.936.0January 2013–August 2019550
Nanjing119.032.152.0May 2013–January 2019461
Guangzhou113.423.128.4October 2011–May 2019452
Songshan113.134.5475.0December 2013–August 2019560
Xian108.934.2389.0May 2012–November 2017578
Chengdu104.030.6510.0June 2013–August 2019354
Guilin110.325.3160.4July 2017–August 2019144
Nanning108.322.8158.0November 2016–January 2019102
coastal sitesSanya109.418.328.9September 2014–August 2019270
Haikou110.320.022.0March 2014–March 201698
Zhoushan122.129.929.0January 2012–April 2019409
Table 2. Parameters adopted in the simulations of aerosol radiative forcing in this study.
ParameterValueDescription
wavelengths0.2~4.0 µmsolar spectrum
aerosol propertiesAOD (440, 675, 870, 1020 nm)SONET daily average products
AE (440–870 nm)
SSA (440, 675, 870, 1020 nm)
g (440, 675, 870, 1020 nm)
atmospheric profilesmid-latitude summer/
mid-latitude winter
depending on season
water vapor contentCWVSONET daily average product
surface propertybroadband surface albedo MODIS surface albedo product
Table 3. Multi-year average aerosol radiative forcing and efficiencies estimated by the Santa Barbara DISORT Atmospheric Radiative Transfer (SBDART) model, based on the SONET long-term observations.
SiteAerosolRFTOA
(W/m2)
RFBOA
(W/m2)
RFETOA
(W/m2)
RFEBOA
(W/m2)
arid and semi-arid sites −14.9 ± 9−16.5 ± 10−22.2 ± 8−24.6 ± 8
 MinqinDU 1−10.7 ± 7−12.0 ± 7−18.5 ± 10−20.7 ± 10
 ZhangyeDU−13.6 ± 8−14.8 ± 8−22.5 ± 9−24.5 ± 9
 KashiDU−18.6 ± 11−20.7 ± 12−24.7 ± 5−27.5 ± 5
continental background site −1.6 ± 2−1.7 ± 2−18.0 ± 14−19.1 ± 15
 LhasaCB 2−1.6 ± 2−1.7 ± 2−18.0 ± 14−19.1 ± 15
urban and suburban sites −15.4 ± 8−36.0 ± 16−22.6 ± 6−54.3 ± 14
 BeijingUI 3−18.7 ± 10−43.4 ± 18−24.3 ± 5−59.4 ± 14
 YanqihuUI−16.8 ± 9−42.6 ± 17−21.5 ± 6−58.1 ± 15
 JiaozuoUI−16.7 ± 10−38.7 ± 13−19.5 ± 5−51.3 ± 14
 ShanghaiUI+MR 4−14.0 ± 9 −40.0 ± 22−23.9 ± 12−65.3 ± 22
 HarbinUI−14.0 ± 8−31.3 ± 15−25.8 ± 7−59.3 ± 16
 HefeiUI−14.1 ± 6−33.3 ± 12−23.1 ± 5−56.0 ± 12
 NanjingUI−14.1 ± 6−34.2 ± 12−22.4 ± 4−56.0 ± 11
 GuangzhouUI+MR−14.2 ± 6−33.8 ± 13−22.0 ± 4−53.6 ± 11
 SongshanUI+DU−14.5 ± 7−29.6 ± 10−21.3 ± 6−44.8 ± 7
 XianUI+DU−14.7 ± 8−33.9 ± 14−19.4 ± 5−46.8 ± 8
 ChengduUI−15.9 ± 9−35.7 ± 14−20.2 ± 9−46.4 ± 11
 GuilinUI−14.3 ± 6−26.2 ± 10−26.5 ± 3−49.5 ± 9
 NanningUI−14.2 ± 5−27.4 ± 9−26.2 ± 5−50.4 ± 8
coastal sites −13.6 ± 6−29.3 ± 12−25.3 ± 5−53.8 ± 10
 SanyaMR+UI−10.9 ± 4−28.7 ± 13−21.4 ± 5−54.0 ± 9
 HaikouMR+UI−14.8 ± 5−30.2 ± 14−26.3 ± 5−51.7 ± 11
 ZhoushanMR+UI−15.0 ± 6−29.4 ± 11−27.7 ± 4−54.2 ± 10
1 DU = dust aerosol; 2 CB = continental background aerosol; 3 UI = urban–industrial aerosol; 4 MR = marine aerosol.
Table 4. Comparison with previous reports on long-term average aerosol radiative forcing efficiencies at the four types of sites.
SiteTypeQuantityLi et al. [14]
(W/m2)
This Study
(W/m2)
Absolute Difference
(W/m2)
ZhangyeArid and semi-arid siteTime periodAugust 2012–October 2016August 2012–May 2019
RFETOA−22.3−22.50.2
RFEBOA−24.4−24.50.1
LhasaContinental background siteTime periodSeptember 2013–September 2016September 2013–May 2019
RFETOA−17.2−18.00.8
RFEBOA−18.7−19.10.4
BeijingUrban and suburban siteTime periodDecember 2009–November 2016December 2009–August 2019
RFETOA−23.5−24.30.8
RFEBOA−62.4−59.43.0
ZhoushanCoastal siteTime periodJanuary 2012–November 2016January 2012–April 2019
RFETOA−29.3−27.71.6
RFEBOA−53.7−54.20.5

