Ecological Risk Assessment Based on Land Cover Changes: A Case of Zanzibar (Tanzania)


1
Department of Computer Science and Information Technology, The State University of Zanzibar (SUZA), Zanzibar P.O. Box 146, Tanzania
2
NOVA Information Management School (NOVA IMS), Universidade Nova de Lisboa, 1070-312 Lisboa, Portugal
*
Author to whom correspondence should be addressed.
Remote Sens. 2020, 12(19), 3114; https://doi.org/10.3390/rs12193114
Submission received: 29 July 2020
/
Revised: 19 September 2020
/
Accepted: 21 September 2020
/
Published: 23 September 2020
(This article belongs to the Special Issue A Pluralistic Approach to Defining and Measuring Urban Sprawl and Its Impacts on Human Well-Being)
Abstract
:Land use and land cover (LULC) under improper land management is a major challenge in sub-Saharan Africa and has drastically affected ecological security. Addressing environmental impacts related to this challenge requires efficient planning strategies based on the measured information of land use patterns. This study assessed the ecological risk index (ERI) of Zanzibar based on LULC. A random forest classifier was used to classify three Landsat images of Zanzibar for the years 2003, 2009, and 2018. Then, a land change model was employed to simulate the LULC changes for 2027 under a business-as-usual (BAU), conservation, and extreme scenarios. Results showed that the built-up areas and farmland of Zanzibar Island have increased constantly, while the natural grassland and forest cover have decreased. The forest, agricultural, and grassland were highly fragmented into several small patches. The ERI of Zanzibar Island increased at a constant rate and, if the current trend continues, this index will increase by up to 8.9% in 2027 under an extreme scenario. If a conservation scenario is adopted, the ERI will increase by 4.6% whereas if a BAU policy is followed, this value will increase by 6.2%. This study provides authorities with useful information to understand better the ecological processes and LULC dynamics and prevent unmanaged growth and haphazard development of informal housing and infrastructure.
1. Introduction
In recent years, the ecological and environmental impacts caused by land transformation have been reported to grow at a very rapid rate and are considered to be a major problem around the globe [1,2]. These impacts are connected with the exploitation of natural resources, destruction of biodiversity as well as disturbing the ecosystem structure that offers essential services to mankind including nutrient cycling, pollination, predator control, carbon sequestration, and soil fertility [3]. According to [4], Africa and Asia are the areas with the highest ecological problems caused by land use and land cover (LULC) changes. The drivers of LULC changes such as overpopulation, improper control of land resources, together with poor economic situations have made these regions highly affected by ecological problems [5]. For instance, [6] showed that between 1975 to 2000, more than 16% of forest cover and 5% of woodland and grassland had been destroyed on the African continent. In East Africa including Zanzibar, 48% of the tree cover was destroyed from 1986 to 2015 due to the rapid rate of deforestation and expansion of casual agricultural activities [7]. Most of this destruction was attributed to the threat of an extremely limited number of natural resources, impairing agricultural lands, rising in irregular and unreliable urban areas as well as increasing in landscape fragility and ecological shock [8]. In this sense, appropriate methods in assessing both ecological health together with environmental quality are essential to achieve policy making objectives through land use planning [8,9]. Additionally, policies required to prevent or mitigate ecological impacts of environmental changes call for robust scientific evidence to provide effective solutions to regional ecological problems and promote the useful interaction of socio–economic–ecological development [10].
Assessing ecological risk conditions in the landscape through the analysis of LULC changes can be used to quantify the environmental effects of immediate and long-term damage or harm of certain stressors to an ecosystem at a regional scale [11]. The concepts of ecological risk assessment (ERA) began back to the 1980s as an assessment tool to evaluate the likelihood of the potential adverse effects of one or more stress factors on ecosystems [12,13,14]. These techniques can have an important role in formulating procedures to reduce negative shocks on ecosystem destruction as well as ensure proper management and precise spatial allocation of the natural resources [15]. These can also be used in providing spatially explicit assessment in several important areas including land cover, biodiversity, carbon sequestration, and climatic regulation as well as water and soil-related ecosystems [16,17,18].
ERA studies using LULC change maps have been applied in different areas around the globe. These have been developed to analyze the spatial-temporal distribution of landscape ERA in an watershed area [19], to identify the landscape fragmentation level of green spaces as a result of built-up expansion [20], to identify ecological networks and the most valued lands for protection [21], among many other examples that can be found in the literature. In all these cases, remote sensing techniques have been used as a preliminary stage to acquire the land information before performing further analysis on calculating ecological indices to assess the likelihood of ecosystems to collapse on a given landscape. The ultimate goal in performing ERA is to generate relevant planning information so that climatic and other ecological damages can be reduced to a minimum scale [22]. It seeks to use historical land information with that obtained from remote sensing to provide the scientific foundation for risk management in natural protection and biodiversity conservation, whose importance can serve in both the current and future sustainability of natural resources [23]. Ecosystem functioning indicators such as the landscape ecological risk index (ERI) can be calculated from LULC maps and provide an estimation of the environmental effects as well as long-term damage to ecosystems of a particular region [11]. It can also facilitate in maintaining sustainable development in natural resources and ensure the preservation of the integrity and stability of ecosystems, which is important for improving ecological security in fragile and intense ecosystem areas [24]. Different management alternatives are needed to incorporate scenarios in a science-policy interface for environmental assessments [25]. Thus, the use of plausible scenarios at regional scales may support sustainable development in a context of environmental changes on land systems [26,27,28].
Studies for assessing ecological problems in Africa are still very rare [5]. This is also influenced by insufficient data as well as the heterogeneity of the influencing factors. According to the review carried out by [5], Tanzania (including Zanzibar) is among the countries with fewer ecological assessment studies in Africa having found only eight studies in a period of twelve years (2004–2016) in the Web of Science indexed journals. We updated and extended this assessment for Zanzibar for the period of 2000–2019 and found only seven articles, and none of these assessed the ecological risk conditions of Zanzibar’s landscape. This is problematic since the ecological health condition of the Zanzibar landscape is brutally affected by a combination of human and natural pressures [29]. If not promptly checked, the complete extinction of endemic animals or plants together with intense changes in climatic conditions may occur in the near future [29]. Therefore, the aim of this study was to assess the current trends and future projection of the ecological risk of Zanzibar as a consequence of thee LULC changes. Specifically, we aim to:
- Produce LULC maps of Zanzibar Island for the years 2003, 2009, and 2018;
- Identify LULC changes and project them according to scenarios; and
- Estimate the ERI under different scenarios.
The outcome of this study may help in informing authorities to understand the ecological processes and land use dynamics of various land cover classes, along with preventing unmanaged growth and haphazard development of informal housing and infrastructure, which may result in a gradual deterioration of the environment and a decline in the quality of life and ecosystem services now and for future generations.
2. Study Area
Zanzibar (Figure 1) is a small coastal island of about 2461 km² in total, located at 39°05’E to 39°55’E and 4°45’S to 6°30’S in the Western Indian Ocean, where tourism and agricultural activities are the major economic sectors contributing about 28% and 40% of its GDP, respectively [30]. Zanzibar is part of the United Republic of Tanzania, and consists of two main islands—Unguja and Pemba—and almost 50 other small islets [31,32]. These two islands are located 40 km off the mainland coast of East Africa in the Indian Ocean. The two main islands are 50 km apart and are separated by the 700-meter-deep Pemba channel. However, the current study uses the term Zanzibar referring to the island of Unguja, as most of the people live on this island (Unguja) and because Zanzibar city is located on it.
According to the 2018 National Bureau of Statistics (NBS) census report, the overall population of Zanzibar Island (including Pemba) is about 1,348,776 people, and is growing at an annual rate of 3.4% [33]. Natural population growth is considered as the main agent for this high rapid rate, but other factors including the growth of the tourism industry and economic development have also attracted a significant number of migrants from the mainland of Tanzania and other parts of East Africa, making this island very densely populated (546 hab./km2).
Administratively, the Zanzibar Island (Ungula) is divided into three regions and six districts (Urban, West, Central, North A, North B, and Central). One-third of the population is concentrated within the small urban district covering the central parts of Zanzibar Town. Another one-third of the population is located within the West district. The remaining are distributed among the four other districts, occupying 86% of the land area. The Urban and West districts are the most developed districts, and have problems related to urbanization. Most agricultural and forest products are brought from other areas where the direct dependency on primary production is lower, though a gradual change towards rustic can already be seen in the West district. The four other districts can be characterized as more rural and primary production based, with less population pressure and lower development status. The lower incomes are compensated with domestic food and natural resource production, but still poverty and incapability are more present here than in the urban areas. Fishing is an important source of livelihoods in North A, South and Urban districts, while the people in South are less engaged to agricultural actions.
Zanzibar has a tropical climate with four distinct seasons: “Kaskazi” (the hot season, which is between December and February and associated with either little or no rains), “Masika” which is the long rainy season from March–May, “Kipupwe” (the cold season, with strong winds between June and September and “Vuli”, which is very short rainy season from October–December). The annual rainfall of the island ranges from 1600 mm for Unguja and 1900 mm for Pemba, respectively. The temperature ranges between 29 °C and 32 °C on average. Zanzibar Island was originally forested, but pressures like population increase, human habitation, and climate change have resulted in a widespread clearing of the forest and vegetation cover [34].
The land cover patterns around Zanzibar are generally distributed under two different soil classes, namely the deep soil and the coral rag areas. The deep soil areas are mainly attributed by permanent cultivation and forest, while the coral rag is characterized by cultivation and scrublands [31]. However, these areas are not stable in terms of land cover and biotope characteristics. The hilly deep soil areas are reported to be more vulnerable to soil erosion, high land use demand, and, simultaneously, face population pressure, which all influence the rapid and constant changes in land cover patterns and natural resources [32,34]. Alternatively, shifting cultivation in coral rag areas creates a constant element of change, which under the pressure of diminishing area due to commercial and conservation land use leads toward the deterioration of ecosystems and valuable natural resources [32].
3. Materials and Methods
3.1. Data and Pre-Processing
Data from different sources were used to achieve the objectives of this study (Table 1). In an initial phase, remotely sensed satellite images of Zanzibar from different years were obtained from the United States Geological Survey (USGS) website [35]. Three multispectral Landsat images of the years 2003, 2009, and 2018, with a spatial resolution of 30 m were selected for this study. A digital elevation model (DEM) with 30 m resolution was obtained from the Mapping for Development website [36]. Ancillary data, representing biophysical properties and considered to have an influence on land use changes, were used in this study. These datasets included roads, protected forests, buildings, and villages as well as the coastal region of Zanzibar and were downloaded from the Commission for Land Administration of Zanzibar [37]. All data had, or were converted into a World Geodetic System 1984, Universal Transverse Mercator Zone 37N projection system using 30 m spatial resolution.
The inclusion of independent variables in LULC change modeling is very important since these variables ensure that future LULC maps are always predicted with existing patterns and drivers of change in that region [38]. In this study, the selection of independent variables was based on reviews related to similar models from research conducted in other developing countries as well as the local circumstances of Zanzibar. In this sense, the variables slope, distance to the road, distance to the forest, distance to buildings, distance to the coast, and protected areas were selected as independent variables to simulate the future land cover change for Zanzibar City. The distance variables were processed in ESRI ArcGIS software [39] using the Euclidean distance tool. Slope was derived from the DEM using the Slope tool available in this software. Finally, the reclassification of the protected areas was carried out with the Reclassify tool.
The “Distance to roads” and “Distance to forests” were all connected to economic circumstances. The choice of distance to the forest in economic factors is connected with the fact that in Zanzibar, the customs of converting forested land into either built-up areas or farmland is one of the major reasons of land use dynamics, and this is highly caused by the economic situation of Zanzibar´s population [40]. This variable is also related to local spatial policies forbidding any construction or development activities in protected forest [34].
We considered “Distance to coast” and “Distance to buildings” as being connected with the social factors. In this case, the variable “Distance to coast” confirmed the global trend toward higher quantities of land use changes in coastal regions. The second variable “Distance to buildings” expresses the local social and planning conditions of Zanzibar, in which the houses are built relatively close to each other due to subdivisions of small landholdings. This phenomenon is also related to spatial interactions, provided that the land use changes are highly attracted by similar changes in their neighboring areas [40].
In the case of the “Protected areas” variable, it has been used to represent the local spatial policies that have either obstructed or indirectly stimulated land use dynamics [40]. Protected areas including protected forests, governmental agricultural fields as well as open and restricted zones were also used to represent the constraints of land cover changes in the study area. The protected areas data were obtained by reclassifying the 2012 Zanzibar LULC map, which was obtained from the Zanzibar Commission for Land (COLA) to create a Boolean map of 0 for protected areas and 1 for all other classes.
3.2. Methods
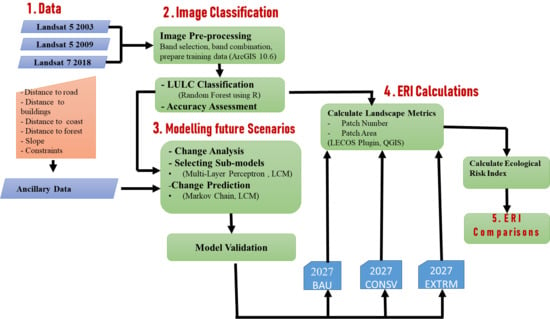
The overall methodology for this study was carried out in three phases (Figure 2). First, the LULC classification was performed using a random forest classifier to generate three LULC maps of 2003, 2009, and 2018. Several band combinations were tested to select the training polygons to be used in the classification phase, which employed bands 1, 2, 3, 4, 5, and 7 of the Landsat satellite images. Before carrying out image classification of the image for 2018, it was necessary to remove the stripes caused by the Landsat ETM+ sensor malfunction after May 31, 2003 [44]. Several authors have proposed methods for dealing with this issue [44,45]. In this paper, we followed the approach described in [46] since this method was available in QGIS 3.8. Second, the LULC maps for the future scenarios were modeled using Land Change Modeler (LCM) of the TerrSet 18.3 software. Third, the ERI for each map and each district of Zanzibar were calculated by first computing the landscape metrics using the LECOS plugin in QGIS 3.8, followed by applying the formulas for ERI assessment [11,23,47].
3.2.1. Image Classification and Accuracy Assessment
Training samples with five LULC classes including built-up, grassland, forest, wetland, and farmland were digitized based on each of the satellite images (i.e., 2003, 2009, and 2018) (Table 2, Table 3 and Table 4). Then, a random forest classifier algorithm (random forest) was employed in RStudio v3.5.3 (R Core Team, 2018) to produce land use maps for each year.
The random forest algorithm is a supervised machine learning algorithm that generates estimators that fit a number of decision trees on various subsets of the training dataset. The algorithm creates decision trees on data samples and then gets the prediction from each of them and finally selects the best solution by means of voting [48]. The random forest classifier is mainly used for classification problems, since it provides better results due to its capability of reducing the over-fitting problem by averaging the result [48]. In this case, the composite image for each year and its corresponding training samples were separately imported into the model algorithm to produce LULC maps for each year.
The produced LULC maps were then used to calculate the percentage changes for each LULC class in the study area (Equation (1)).
where LCC is the land cover change (%); LCf is the land cover area in the final map; and LCi is the land cover area in initial map.
The classification results for each of the classified images were validated through an accuracy assessment process using data points from classified satellite images, and then verified with the ground truth points collected from Google Earth [49]. The ground truth process was undertaken to ensure that the observation that appears in the classified images refers to what is actually on the ground by correlating it with the corresponding features on the image scene [50]. Two hundred ground truth points were collected in Google Earth using a stratified random sampling scheme for each year of the classified images (Table 3, Table 4 and Table 5). These ground truth points were then compared with the pixels of the classified images using ArcGIS 10.6. Finally, a confusion matrix for each of the classified images was generated and used to calculate the overall accuracy, producer’s accuracy, user’s accuracy as well as the kappa coefficient [51].
3.2.2. Description of Scenarios
The scenarios were modelled for 2027 because the modelling procedure considered the historical LULC changes between 2003 and 2009 to estimate the LULC map of 2018 (i.e., a 9-year timespan). Thus, an equivalent timespan was projected for the future (i.e. for 2027). The business as usual scenario for 2027 was modelled based on the existing land use policies, plans, and regulations in Zanzibar City. Therefore, the protected area constraint (Figure 3, left) that was designed to ensure that no land use change would happen in all the existing protected and restricted zones was employed in this scenario. The focus here was to have a clear understanding of what would have to happen in the future land cover change if nothing regarding the current land use policies and restrictions were to be changed in the study region.
The conservation scenario for 2027 was modelled by employing a constraint that prevents land use changes in all substantial agricultural areas and the high coral forest as well as in all restricted zones (Figure 3, right). The idea here was to conserve forest and substantial agricultural areas from being exploited by informal settlement and casual farming activities, which are considered to be the main agents for unreliable land cover changes in Zanzibar [40]. This scenario is also related to the local spatial policy of Zanzibar in forbidding the construction of buildings in open agricultural areas and restricted forest [31,40].
The extreme scenario for 2027 was modelled without employing any constraints and restriction policies so that land use changes were allowed in any area within the study region. The reason behind this was to analyze what would happen in the future if we ignored any protection measures and allowed land use changes to occur anywhere in the study region. In Zanzibar, the development and construction of buildings follows a random and unrestricted pattern being one of the major problems faced by urban planning [52].
3.2.3. Preparation of External (Independent) Variables
Before applying the LCM to model the scenarios of LULC changes, the external variables (constraints and factors) considered to influence or restrict the LULC changes in the study area were prepared.
Constraints are variables that restrict or limit land use changes in specific areas based on land use policies, rules, and regulations. These variables are expressed in the form of a Boolean map so that those areas that are restricted from land use changes are assigned a value of 0 (unsuitable), while areas in which land use changes are permitted, the value of 1 is assigned (suitable) [53]. Factors are the variables that influence the LULC changes depending on the appropriate activity under consideration. These variables are not reduced to simple Boolean constraints, and therefore, most commonly measured on a continuous scale [53].
The distance maps were imported to IDRISI Selva v17.02 from Clarklabs [54] and standardized into a continuous scale of suitability (Figure 4). Rescaling and standardizing the factors into a continuous scale of suitability helps in enhancing the performance and speed of multi criteria evaluation (MCE) [55]. The MCE module in IDRISI was optimized for speed using a 0–255-byte level of standardization [56], then the fuzzy standardization module in the scale of 0–255 with three different functions were used to rescale each of these variables [57].
In the case of the distance to forest, distance to buildings, and distance to coastline, a linear monotonically decreasing function with control points a = 0 (marking the location where suitability begins to rise above 0), and d (representing the highest distances of each variable obtained from the distance maps calculated in ArcGIS) = 12241, 6467, 12802, respectively, were used, implying that suitability decreases with distance. The distance to the coastline of the small island (North A) was calculated considering the distance to the coastline of Zanzibar main island. This was because the smaller island depends largely on the bigger island in terms of accessibility, thus the smaller the distance to coastal area is in the main island, the higher the level of suitability. Additionally, being such a small island, this variable would not be important in the modeling process (i.e., all cells were near the coast in the small island) if we calculated it separately for each island.
Since in Zanzibar there is a policy restricting any construction or development activities within a 20 m buffer from the road networks, a linear symmetric function with control point a = 0, b (indicates where suitability is high) = 20, c (indicates where suitability begins to drop again) = 20, and d = 10607 was applied for the distance to the roads. This means that the areas within 20 m were not suitable for LULC changes. However, areas between 20 m and 10,607 m, the suitability decreased with the highest suitability being near 20 m.
Finally, in the case of the slope variable, the sigmoidal monotonically decreasing function with control point a = 0 and c = 17 was used. In Zanzibar, all areas above 17% of slope were less suitable or invulnerable to LULC changes.
Two constraint maps were created in this study, one for the business as usual scenario and one for the other two scenarios (Figure 3). The constraint for the business as usual scenario was created by reclassifying the 2012 LULC map of Zanzibar island that was obtained from the Zanzibar Commission for Land (COLA) and assigned the value of 0 for those protected areas (to exclude them in the LULC changes), and 1 for all the other areas (suitable and more vulnerable for LULC changes). The constraint map for the conservation scenario was created by assigning the value of 0 for those protected areas and high coral forest cover as well as all subsidence agricultural sites. The focus was to exclude all these areas in future land cover changes. However, in all other areas, the value of 1 was assigned, implying that they are allowed for future LULC changes.
3.2.4. Modeling Future Scenarios
We modeled LULC for 2027 in three different scenarios based on the constraint maps. With the selected factors and a protected area constraint, the land cover for business as usual was simulated. The land cover for the conservation scenario was modeled by combining the selected factors and the conservation constraint. In the case of the extreme scenario, the 2027 land cover was modeled without employing any constraint (i.e., only the selected external factors were used). In this stage of modeling the future scenarios, three steps of analysis including change analysis, transition potentials, and change prediction were performed.
Change Analysis
A change analysis, which included the historical land cover maps as input, was carried out to examine the amount of gain and losses, net changes, and contributions to changes from each land cover class within the specified time period. First, the maps of 2003 and 2009 were used as input images to derive all historical information described above including the maps of gains and losses, contributions to net change, and transitions of land cover classes as well as the spatial trend of land use classes. The focus was to use these historical pieces of information to simulate the land cover map for 2018 so that it can be compared with the actual classified map of 2018 to estimate the predictive ability of the model (model validation). Then, the change analysis process was performed by employing the land use maps of 2009 and 2018 as input images. In this case, the objective was to acquire the same information described above to predict the land use maps for the 2027 scenarios.
Transition Potentials
The explanatory power for each external variable was tested as well as selecting transition sub-models that are relevant in the prediction of the future scenarios. Cramer’s power of all external variables was tested to identify all variables with a potential explanatory power. Cramer’s power ranges from 0 to 1, and only variables with values higher than 0.15 should be retained [56] (Table 5). Therefore, only three external factors including distance to buildings, distance to roads, and distance to coast, and one constraint map for each scenario (except for extreme scenario, where constraints were not employed) were used in the analysis.
All variables (factors and constraints) were combined into transition sub-models between 2003 and 2009. A multi-layer perceptron (MLP) was employed to generate the transition potentials for the 2018 land cover map prediction. The MLP computes a linear output from nonlinear inputs according to the weights by using a nonlinear activation function [58]. In this study, the MLP neural network was applied because of its capability of running up to nine transitions per sub-model as well as explanatory variables at once [56]. To achieve a better accuracy on the results of MLP, only major land cover transitions together with only the driver’s variables with higher Cramer’s power should be included in the transition sub-model [56]. Based on this principle, only six major transitions including grassland to built-up, forest to built-up, grassland to farmland, forest to grassland, forest to farmland, and farmland to grassland were selected in this study. Together with four selected variables, a MLP was employed with an accuracy of 68.4% to generate the transition potentials (Figure 5) that were then used by the Markov chain method to predict the land use map for the year 2018. The same procedures were applied to model the 2027 maps.
Change Prediction
The third stage in modeling future scenarios was to perform change prediction to a future specified date for the allocation of land cover changes. In this stage, the default procedure in LCM (Markov chain analysis) was applied to determine the amount of changes at a date of 2018 based on historical land cover maps of 2003–2009. Here, the algorithm determines exactly how much land is expected to transition from the later date (2009) to the prediction date (2018) based on a projection of the transition potentials maps that was generated [56].
3.2.5. Model Validation
To ensure the predictive ability and performance of the model. Model validation and calibration must be performed before starting the prediction of LULC changes for the specified date. Performing validation of the model is very important because the efficiency and usability of the model always depend on the output of the validation [59].
Since several studies have already proposed the use of the confusion matrix [60] in assessing the accuracy and performance of the model, we also computed the confusion matrix by performing cross-tabulation to compare the actual and simulated maps of 2018. The confusion matrix was then used to calculate the overall accuracy, user’s accuracies, producer´s accuracies, and kappa coefficient [51]. Additionally, two kappa coefficients variations were computed to gain more information on the performance of the model, Khisto and Klocation [61]. Khisto is used to measure the similarities in the number of cells between the simulated and reference maps. In other words, this kappa is responsible for measuring the quantitative similarity between two compared maps. Klocation is used to measure the similarities in the spatial distribution of classes but does not differentiate between classes that are close or distant and it is independent of the total number of cells per class.
3.2.6. Ecological Risk Indices
The ERI was computed for each LULC map as well as for each district of Zanzibar Island and then the results were compared. This stage was done in two phases. First, the landscape metrics (patch number and patch area) for each LULC map were calculated using LECOS plugin in QGIS 3.8. Second, the formulas described below were used to calculate the ERI for each map.
The ecological risk index (ERI) provides an indicator of the negative environmental impacts that may occur or are occurring due to one or more external factors [11,12,13,14] (Equation (2)).
where ERI is the ecological risk index of the risk area; Ak is the total area of kth region; Aki is the ith landscape area/class area; and Ri is the ith landscape/class loss index that can be calculated [19,23,47] (Equation (3)).
where Fi is the ecological fragility index that is referred to as the ability of a landscape to resist the human disturbance.
According to [38], and the knowledge of our study region, the Fi value of 5 for built-up, 4 for water body, 3 for grassland, 2 for farmland, and 1 for forest were used in this study. Additionally, for an effective result, these values were normalized before being used in the calculations of ERI.
Si is the landscape disturbance degree index of the ith landscape [19] (Equation (4)).
Ci is the landscape fragmentation reflecting the changes in landscape structure and ecological process (Equation (5)).
Ni is the landscape isolation and refers to the degree of separation of patches in a given landscape type (Equation (6)).
Di is the landscape dominance index that describes the dominance of patches in a given landscape (Equation (7)).
where ni is the patch number of the ith landscape; Qi is the ratio of the cell with the ith patch and total cell; Mi is the ratio of the number of ith patches to total patches; and Li is the ratio of the ith patch area to the total area. a, b, and c represent the weight of Ci, Ni, and Di, respectively, where a + b + c = 1 [47].
4. Results
4.1. Land Use Land Cover Maps and Changes 2003–2018
Figure 6 illustrates the LULC classified maps for the years 2003–2009. The visual interpretation of the classified images shows extensive changes in various land cover classes in the study region, especially the rapid expansion of the built-up area as well as a decrease in forest cover. The high increase in the built-up area was highly exposed in the eastern zone of the study region near the urban center of Zanzibar Island. Although the image for 2018 was preprocessed with the intention of removing the stripes [46], the classification results still showed some diagonal slashes in the eastern part of Zanzibar Island.
The assessment results for each of the produced land cover maps provided an overall accuracy ranging from 74% to 78%, and an overall kappa coefficient ranging from 0.68 to 0.71. On the other hand, the user’s and producer’s accuracies computed for each of the classified maps were all above 65%. These results indicate that the classified images have met an acceptable level of accuracy and thus they are satisfying for the study analysis.
The statistical results corresponding to LULC changes in the study area indicated that there is an extensive increase in the built-up area equivalent to the decrease in the forest cover (Table 6). The built-up area of Zanzibar Island has been expanding from 4132.44 ha in 2003 to 7201.35 ha in 2018. These areal changes in the built-up area make up a 42.6% increase in construction land for only a 15 year (2003–2018) period corresponding to a 2.84% annual increase. Farmland has also shown a progressive expansion with an increase of 31.7% (2.1% annually) of agricultural land. For the forest cover and wetland, the trends on their land cover changes showed a continuous decrease, in which 15.8% of forest cover (1.05% annually) and 24.6% of wetland (1.64% annually) disappeared. However, in the case of grassland, the trend did not show a smooth variation. This is because, in the first six years (2003–2009), the grassland of the study area decreased by 4.5%, followed by an increase of 7.48% in the following nine years (2009–2018). These rapid LULC changes of several land cover classes within the study region could be attributed by the improper way of managing the land including the high rate of informal settlement, casual farming methods as well as the higher level of deforestation activities in Zanzibar [40].
4.2. Scenarios
The model validation was performed by comparing the simulated map and actual map of 2018 (Figure 7).
The cross-tabulation results obtained after comparing the actual and simulated map of 2018 are shown in Table 7. The overall accuracy of the model was 75% and had a kappa coefficient of 0.65. In almost all classes, the user’s and producer’s accuracies were above 65%, indicating a good level of accuracy. However, the user’s and producer’s accuracies for grassland and farmland were lower (58% and 63%, respectively). These lower producer’s and user’s accuracies for these two classes can be explained by the spectral property similarities [62].
The validation results for the other two kappa coefficients can be observed in Table 8. Results for both Klocation and Khisto were above 0.65, implying that the prediction in both quantities of the pixel and spatial distribution of the classes had a good level of accuracy.
The LULC results for the three modeled scenarios (Figure 8) indicates that the landscape structure in Zanzibar Island will experience rapid and extensive changes by 2027. The maps for business as usual and the extreme scenarios depict a massive and random increase in the built-up areas for the entire study region, especially near the coastal and touristic areas of Nungwi and Kiwengwa (northern and western part of Zanzibar). This random distribution of built-up area can be highly connected with the current trend of informal settlements in a large part of Zanzibar Island.
The land cover change for the built-up area will increase in the range of 20–31% by 2027 (Table 9 and Figure 9). The conservation scenario shows an increase of 20%, while the extreme scenario shows an increase of 31%. The forest cover will increase by 3.87% in the conservation scenario while in the other two scenarios (“business as usual” and “extreme scenario”), the forest will decrease. The conservation scenario presents a higher decrease of wetlands (−14%) when compared with the other scenarios (“business as usual” and “extreme scenario”).
4.3. Ecological Risk Assessment
Table 10 summarizes the ERI results for each LULC class in the period 2003–2018. The ERI for some land use classes like built-up and grassland have experienced an increasing trend. However, the ERI for other land use classes like forest and farmland does not show a smooth trend. For example, the trend of ERI for the forest cover increased from 0.008 in 2003 to 0.009 for 2009, and then dropped to 0.007 in 2018. The ERI for the farmland was 0.0018 in 2003 and 2009, and then increased to 0.020 in 2018. In addition, the built-up area and farmland showed high fragmentation and isolation indices (Ci and Ni, respectively) implying that a large part of the landscape has been affected by sprawling buildings and casual farming activities. The fragmentation (Ci) and isolation (Ni) indices for the wetland, forest and grassland were lower when compared to those of the farmland and built-up area. However, they showed an increasing trend, implying that the landscape structure of Zanzibar City is suffering progressive disturbances.
The results in Table 11 show that the fragmentation (Ci) and isolation (Ni) indices related to conservation scenarios were lower when compared to the extreme and business as usual scenarios. In the conservation scenario, there was a higher dominance index (Di) for the forest cover. In the case of business as usual and extreme scenarios, the overall ERI showed an increasing trend in fragmentation (Ci), isolation (Ni), and loss (Ri) indices in almost all land use classes.
The results show that if the conservation scenario is implemented, the overall ERI in the study region will increase by 4.6%, which is less than the business as usual scenario (6.2%) (Table 12 and Figure 10). This is possible since the conservation scenario ensures the protection of agricultural and forest patches to be fragmented as well as reduce the risk of having many small patches in the study region, which are the main reasons for the destruction of the landscape structure as well as the rising overall ERI in the landscape. The extreme scenario showed a very high increase in ERI trend when compared to the business as usual and conservation scenarios. However, we noticed that, although there were no constraints in the extreme scenario, its ERI is more likely to be applicable in Zanzibar, even more than that of business as usual. This is due to the fact that in Zanzibar, the development and construction of buildings in a random way and without following restrictions and government regulations are one of the major problems faced by urban planning. In summary, the overall ERI of the study area showed an increasing trend from 2003 to 2027 whereas there was also a significant change (mostly increasing) in the number of patches, fragmentation (Ci), and isolation (Ni) indices as well as a continuous decrease in the greatest patch area for the forest, farmland, and grassland.
4.4. Distribution of Ecological Risk Index Per district
When comparing the distributions of ERI at a district level (Table 13 and Figure 11), we found that the districts Urban-west, North A, and North B experienced the highest and progressively increasing ERI values, while the ERI for the Urban district seemed to be stable. The extensive increases in ERI for these three districts could be highly influenced by the high rate of casual agricultural activities and tourism activities as well as informal housing in these regions.
In the case of the three future scenarios, the results show that the extreme scenario provided higher ERI increases in almost all districts of Zanzibar, especially in North A and North B where the increase in ERI values, corresponding to the extreme scenario, were 23.5% and 17.92, respectively. The conservation scenario showed moderate ERI results in almost five districts of Zanzibar, except for the North A district, which showed higher increases in ERI for all of the 2027 scenarios.
5. Discussion
The findings in this research support the evidence of a recent study that found that the rapid land use changes in Zanzibar have imposed an intensive degradation on the ecosystems of Zanzibar [29]. The main drivers (i.e., informal housing, high rate of casual farming, and improvised planning in the tourism sector) behind this intensive degradation are increasing, uncontrolled, and poorly managed [30]. During the first stages of analyzing land use dynamics, we have realized that Zanzibar City has experienced a trend of rapid land use changes and extensive built-up expansion, mostly in areas near existing buildings and some of the coastal zones. These changes are easily observable by visual comparison of the generated LULC maps for the different years. The distance to the buildings and distance to coast variables support this observation as they provided higher Crammer’s values, ensuring that these variables have a great influence on land cover dynamics in Zanzibar. Evidence has been clearly exposed by increasing the fragmentation index (Ci), isolation index (Ni), loss index (Ri) as well as overall ERI of the entire landscape. In order to reduce such types of threats, more systematic approaches in ecological assessment are required. Cooperative research among research groups, land planners, and all other stakeholders including the tourism sector should be highly enforced as a tool to monitor and recommend a long-term plan for sustainable ecosystems in Zanzibar.
In future scenarios, the findings have proven that disobeying land policies and regulations can negatively influence the ecological conditions of Zanzibar in the future. This has been shown by the results of the extreme scenario, which was the worst when compared to the other scenarios. The conservation scenario has shown little influence on directing future land cover changes and ecological risk control. These results were only moderate and, therefore, it is important for the government to take a special effort on setting up new land use approaches such as promoting the densification of vertical buildings rather than relying on one-floor horizontal buildings. If the current trend continues, the built-up area of Zanzibar City will be expanded more than 40% by 2027. The larger part of the agricultural and forested land has already been fragmented to housing parcels. The negative environmental effects relevant to land resources such as loss of natural forests, open cropland, and wetlands have been observed in Zanzibar [52]. The government should enforce restrictions and impose strong land policies, leaving the remaining land cover classes to stop being further destroyed. These land use changes and extensive built-up expansion should slow or decline in the future. However, the situation is difficult to deal with because of the poor quality of housing and minimum government efforts to enforce the optimal usage of land resources on Zanzibar Island [64]. Other important aspects such as population increase, the pressure of economic development and, particularly of the tourism sector, also need to be dealt with by the government to ensure sustainable land use policies for Zanzibar.
The scenarios used in this study were designed to show how different policies may impact the ecological risk in Zanzibar. These scenarios, designed by the authors of this study, aimed primarily at stressing differences and were supported by a coherent narrative [65] aiming to facilitate initial discussions with stakeholders regarding land use planning. Thus, this study contributes with preliminary results so that an informed discussion with stakeholders can take place more effectively in Zanzibar or in other islands/coastal areas with similar contexts. Future versions of this study would benefit from the inclusion of stakeholders in an early stage to incorporate information that would make the scenarios more realistic (e.g., identification of other drivers not used in this study) [66,67]. The results obtained in this study are not easily comparable with studies of other islands since very few studies have addressed the impact of landcover changes in islands [68]. However, the methodology described in this study, which is based on free data and tools, can easily be extended and adapted to other locations with similar characteristics.
It is important to highlight that in this study, we assessed the ERIs of Zanzibar Island with land cover change using freely available satellite and ancillary data. This process requires consistent and accurate land cover data for the purpose of providing reliable and accurate information. However, acquiring free satellite images with the desired standard and at the desired time was challenging. This is due to the geographical region of Zanzibar Island, making the most of their satellite images being covered with clouds. To have a more interesting time span for the study, we used an ETM+ image for 2018. The procedure followed [46] for filling the data gaps of the SLC-off image, caused by a hardware error, with data from a SLC-on image was not completely successful. This may have impacted some of the results obtained for the land cover changes as well as for modeling future scenarios. However, we believe that this impact was not so important because only the eastern part of Zanzibar Island—with low levels of urbanization—was affected by this problem and the accuracy of assessment results were acceptable. In future works, these results can be improved by using more accurate and updated data such as Sentinel−2 as well as performing additional analysis such as comparing the evolution of the calculated indices inside and outside the protected areas to understand how effective these environmental protection instruments are [69].
6. Conclusions
This study provides the first assessment of the ecological risk conditions for Zanzibar based on land cover changes and associated impacts. Remote sensing and spatial modeling techniques enabled us to assess the trend of land cover changes from 2003 to 2018 and to project three different management scenarios for 2027. Results indicate that the overall ecological risk index of Zanzibar City has been constantly growing from 2003 to 2018. We also found that a conservation management scenario had the lowest ecological risk when compared to the other scenarios. However, the ecological risk for this scenario is also increasing for 2027. These results are worrying since all scenarios are degrading its ecological risk index. These findings call for the urgency of effective sustainable land use policies for Zanzibar so that a systematic balance between economy and sustainable ecosystems can be achieved. The methodology and results used in this study can provide useful insights to land use planners and policymakers regarding the current trends and future projection of land cover changes in Zanzibar, the factors driving these changes as well as the effects in ecological health. This study can easily be extended and used as a monitoring instrument to provide useful information for defining sustainable land use policies in Zanzibar or any other location dealing with the same kind of problems.
Author Contributions
Conceptualization, H.O. and P.C.; Methodology, H.O. and P.C.; Validation, H.O. and P.C.; Formal analysis, H.O. and P.C.; Data curation, H.O.; Writing—original draft preparation, H.O.; Writing—review and editing, H.O. and P.C.; Project administration, H.O. All authors have read and agreed to the published version of the manuscript.
Funding
This work was partially supported by national funds through FCT (Fundação para a Ciência e a Tecnologia) under the project UIDB/04152/2020-Centro de Investigação em Gestão de Informação (MagIC) and by the research project ASEBIO–Assessment of Ecosystem Services and Biodiversity in Portugal, funded by the Portuguese Science Foundation–FCT (PTDC/CTA-AMB/28438/2017).
Acknowledgments
The authors would like to thank the reviewers and the editor for the constructive comments made which allowed to improve this manuscript.
Conflicts of Interest
The authors declare no conflict of interest.
References
- Shan, W.; Jin, X.; Ren, J.; Wang, Y.; Xu, Z.; Fan, Y.; Gu, Z.; Hong, C.; Lin, J.; Zhou, Y. Ecological environment quality assessment based on remote sensing data for land consolidation. J. Clean. Prod. 2019, 239, 118126. [Google Scholar] [CrossRef]
- Qiu, L.; Pan, Y.; Zhu, J.; Amable, G.S.; Xu, B. Integrated analysis of urbanization-triggered land use change trajectory and implications for ecological land management: A case study in Fuyang, China. Sci. Total Environ. 2019, 660, 209–217. [Google Scholar] [CrossRef] [PubMed]
- Benton, T.G.; Solan, M.; Travis, J.M.J.; Sait, S.M. Microcosm experiments can inform global ecological problems. Trends Ecol. Evol. 2007, 22, 516–521. [Google Scholar] [CrossRef]
- Belay, T.; Mengistu, D.A. Land use and land cover dynamics and drivers in the Muga watershed, Upper Blue Nile basin, Ethiopia. Remote Sens. Appl. Soc. Environ. 2019, 15, 100249. [Google Scholar] [CrossRef]
- Wangai, P.W.; Burkhard, B.; Müller, F. A review of studies on ecosystem services in Africa. Int. J. Sustain. Built Environ. 2016, 5, 225–245. [Google Scholar] [CrossRef] [Green Version]
- Brink, A.B.; Eva, H.D. Monitoring 25 years of land cover change dynamics in Africa: A sample based remote sensing approach. Appl. Geogr. 2009, 29, 501–512. [Google Scholar] [CrossRef]
- Acheampong, E.O.; Macgregor, C.J.; Sloan, S.; Sayer, J. Deforestation is driven by agricultural expansion in Ghana’s forest reserves. Sci. Afr. 2019, 5, e00146. [Google Scholar] [CrossRef]
- Winowiecki, L.; Vågen, T.-G.; Huising, J. Effects of land cover on ecosystem services in Tanzania: A spatial assessment of soil organic carbon. Geoderma 2016, 263, 274–283. [Google Scholar] [CrossRef] [Green Version]
- Pettit, C.; Pullar, D. A Way Forward for Land-Use Planning to Achieve Policy Goals by Using Spatial Modelling Scenarios. Environ. Plan. B Plan. Des. 2004, 31, 213–233. [Google Scholar] [CrossRef] [Green Version]
- Wang, J.; He, T.; Lin, Y. Changes in ecological, agricultural, and urban land space in 1984–2012 in China: Land policies and regional social-economical drivers. Habitat Int. 2018, 71, 1–13. [Google Scholar] [CrossRef]
- Zhang, X.; Shi, P.; Luo, J. Landscape ecological risk assessment of the Shiyang river basin. Commun. Comput. Inf. Sci. 2013, 399, 98–106. [Google Scholar]
- USEPA. National Management Measures to Control Nonpoint Source Pollution from Agriculture; United States Environmental Protection Agency: Washington, DC, USA, 2003.
- Hakanson, L. An ecological risk index for aquatic pollution control.a sedimentological approach. Water Res. 1980, 14, 975–1001. [Google Scholar] [CrossRef]
- Hunsaker, C.T.; Graham, R.L.; Suter, G.W.; O’Neill, R.V.; Barnthouse, L.W.; Gardner, R.H. Assessing ecological risk on a regional scale. Environ. Manag. 1990, 14, 325–332. [Google Scholar] [CrossRef]
- De Araujo Barbosa, C.C.; Atkinson, P.M.; Dearing, J.A. Remote sensing of ecosystem services: A systematic review. Ecol. Indic. 2015, 52, 430–443. [Google Scholar] [CrossRef]
- Fernández-Guisuraga, J.M.; Calvo, L.; Fernández-García, V.; Marcos-Porras, E.; Taboada, Á.; Suárez-Seoane, S. Efficiency of remote sensing tools for post-fire management along a climatic gradient. For. Ecol. Manag. 2019, 433, 553–562. [Google Scholar] [CrossRef]
- Alizade Govarchin Ghale, Y.; Baykara, M.; Unal, A. Investigating the interaction between agricultural lands and Urmia Lake ecosystem using remote sensing techniques and hydro-climatic data analysis. Agric. Water Manag. 2019, 221, 566–579. [Google Scholar] [CrossRef]
- Xiao, J.; Chevallier, F.; Gomez, C.; Guanter, L.; Hicke, J.A.; Huete, A.R.; Ichii, K.; Ni, W.; Pang, Y.; Rahman, A.F.; et al. Remote sensing of the terrestrial carbon cycle: A review of advances over 50 years. Remote Sens. Environ. 2019, 233, 111383. [Google Scholar] [CrossRef]
- Jin, X.; Jin, Y.; Mao, X. Ecological risk assessment of cities on the Tibetan Plateau based on land use/land cover changes–Case study of Delingha City. Ecol. Indic. 2019, 101, 185–191. [Google Scholar] [CrossRef]
- Tian, Y.; Jim, C.Y.; Tao, Y.; Shi, T. Landscape ecological assessment of green space fragmentation in Hong Kong. Urban For. Urban Green. 2011, 10, 79–86. [Google Scholar] [CrossRef]
- McNeeley, S.M.; Even, T.L.; Gioia, J.B.M.; Knapp, C.N.; Beeton, T.A. Expanding vulnerability assessment for public lands: The social complement to ecological approaches. Clim. Risk Manag. 2017, 16, 106–119. [Google Scholar] [CrossRef]
- Aurand, D. The application of ecological risk assessment principles to dispersant use planning. Spill Sci. Technol. Bull. 1995, 2, 241–247. [Google Scholar] [CrossRef]
- Xue, L.; Zhu, B.; Wu, Y.; Wei, G.; Liao, S.; Yang, C.; Wang, J.; Zhang, H.; Ren, L.; Han, Q. Dynamic projection of ecological risk in the Manas River basin based on terrain gradients. Sci. Total Environ. 2019, 653, 283–293. [Google Scholar] [CrossRef] [PubMed]
- Zang, Z.; Zou, X.; Zuo, P.; Song, Q.; Wang, C.; Wang, J. Impact of landscape patterns on ecological vulnerability and ecosystem service values: An empirical analysis of Yancheng Nature Reserve in China. Ecol. Indic. 2017, 72, 142–152. [Google Scholar] [CrossRef]
- Nicholson, E.; Fulton, E.A.; Brooks, T.M.; Blanchard, R.; Leadley, P.; Metzger, J.P.; Mokany, K.; Stevenson, S.; Wintle, B.A.; Woolley, S.N.C.; et al. Scenarios and Models to Support Global Conservation Targets. Trends Ecol. Evol. 2019, 34, 57–68. [Google Scholar] [CrossRef] [PubMed] [Green Version]
- Martinez-Harms, M.J.; Bryan, B.A.; Figueroa, E.; Pliscoff, P.; Runting, R.K.; Wilson, K.A. Scenarios for land use and ecosystem services under global change. Ecosyst. Serv. 2017, 25, 56–68. [Google Scholar] [CrossRef] [Green Version]
- Niquisse, S.; Cabral, P.; Rodrigues, Â.; Augusto, G. Ecosystem services and biodiversity trends in Mozambique as a consequence of land cover change. Int. J. Biodivers. Sci. Ecosyst. Serv. Manag. 2017, 13, 297–311. [Google Scholar] [CrossRef] [Green Version]
- Levrel, H.; Cabral, P.; Feger, C.; Chambolle, M.; Basque, D. How to overcome the implementation gap in ecosystem services? A user-friendly and inclusive tool for improved urban management. Land Use Policy 2017, 68, 574–584. [Google Scholar] [CrossRef]
- Staehr, P.A. Managing human pressures to restore ecosystem health of zanzibar coastal waters. J. Aquac. Mar. Biol. 2018, 7, 59–70. [Google Scholar] [CrossRef] [Green Version]
- WB. Integrated Strategic Action Plan Zanzibar: A Pathway to Tourism for All; WB: Washington, DC, USA, 2019; pp. 1–58. [Google Scholar]
- RGZ Zanzibar Food Security and Nutrition Policy; The Revolutionary Government of Zanzibar: Zanzibar, Tanzania, 2008; p. 72.
- Myers, G.A. Social construction of peri-urban places and alternative planning in Zanzibar. Afr. Aff. 2010, 109, 575–595. [Google Scholar] [CrossRef] [Green Version]
- National Bureau of Statistics The United Republic of Tanzania. National Population Projections Office of the Chief Government Statistician Ministry of Finance and Planning Zanzibar National Bureau of Statistics Ministry of Finance and Planning; National Bureau of Statistics: Dar es Salaam, Tanzania, 2018.
- Kukkonen, M.; Käyhkö, N. Spatio-temporal analysis of forest changes in contrasting land use regimes of Zanzibar, Tanzania. Appl. Geogr. 2014, 55, 193–202. [Google Scholar] [CrossRef]
- United States Geological Survey Earth Explorer. Available online: https://earthexplorer.usgs.gov/ (accessed on 15 November 2018).
- RCMRD Mapping for Development. Available online: https://opendata.rcmrd.org/ (accessed on 20 November 2018).
- ZanSDI. Available online: http://zansdi.environment.fi (accessed on 20 November 2018).
- Kleemann, J.; Baysal, G.; Bulley, H.N.N.; Fürst, C. Assessing driving forces of land use and land cover change by a mixed-method approach in north-eastern Ghana, West Africa. J. Environ. Manag. 2017, 196, 411–442. [Google Scholar] [CrossRef] [PubMed]
- ESRI ArcGIS 10.6.1; ESRI: Redlands, CA, USA, 2018.
- Kukkonen, M.O.; Muhammad, M.J.; Käyhkö, N.; Luoto, M. Urban expansion in Zanzibar City, Tanzania: Analyzing quantity, spatial patterns and effects of alternative planning approaches. Land Use Policy 2018, 71, 554–565. [Google Scholar] [CrossRef]
- Jokar Arsanjani, J.; Helbich, M.; Kainz, W.; Darvishi Boloorani, A. Integration of logistic regression, Markov chain and cellular automata models to simulate urban expansion. Int. J. Appl. Earth Obs. Geoinf. 2013, 21, 265–275. [Google Scholar] [CrossRef]
- Liu, M.; Hu, Y.; Chang, Y.; He, X.; Zhang, W. Land Use and Land Cover Change Analysis and Prediction in the Upper Reaches of the Minjiang River, China. Environ. Manag. 2009, 43, 899–907. [Google Scholar] [CrossRef]
- Zhao, K.; Jackson, R.B. Biophysical forcings of land-use changes from potential forestry activities in North America. Ecol. Monogr. 2014, 84, 329–353. [Google Scholar] [CrossRef]
- Aghamohamadnia, M.; Abedini, A. A morphology-stitching method to improve Landsat SLC-off images with stripes. Geod. Geodyn. 2014, 5, 27–33. [Google Scholar] [CrossRef] [Green Version]
- Chen, J.; Zhu, X.; Vogelmann, J.E.; Gao, F.; Jin, S. A simple and effective method for filling gaps in Landsat ETM+ SLC-off images. Remote Sens. Environ. 2011, 115, 1053–1064. [Google Scholar] [CrossRef]
- Graser, A.; Olaya, V. Processing: A Python Framework for the Seamless Integration of Geoprocessing Tools in QGIS. ISPRS Int. J. Geo-Infor. 2015, 4, 2219–2245. [Google Scholar] [CrossRef]
- Zhang, F.; Yushanjiang, A.; Wang, D. Ecological risk assessment due to land use/cover changes (LUCC) in Jinghe County, Xinjiang, China from 1990 to 2014 based on landscape patterns and spatial statistics. Environ. Earth Sci. 2018, 77, 1–16. [Google Scholar] [CrossRef]
- Gislason, P.O.; Benediktsson, J.A.; Sveinsson, J.R. Random forests for land cover classification. Pattern Recognit. Lett. 2006, 27, 294–300. [Google Scholar] [CrossRef]
- Google Google Earth. Available online: https://www.google.com/earth (accessed on 15 November 2018).
- Tilahun, A. Accuracy Assessment of Land Use Land Cover Classification using Google Earth. Am. J. Environ. Prot. 2015, 4, 193–198. [Google Scholar] [CrossRef]
- Congalton, R.G.; Green, K. Assessing the Accuracy of Remotely Sensed Data; CRC Press: Boca Raton, FL, USA, 2019; ISBN 9780429052729. [Google Scholar]
- Ali, M.H.; Sulaiman, M.S. The Causes and Consequences of the Informal Settlements in Zanzibar. Shap. Chang. 2006, 8–13. [Google Scholar]
- Eastman, J. Multi-criteria evaluation and GIS. In Geographical Information Systems; John Wiley and Sons: New York, NY, USA, 1999. [Google Scholar]
- Clarklabs IDRISI Selva. Available online: https://clarklabs.org/ (accessed on 15 November 2018).
- Hirscher, M.; Schweizer, E.; Weller, M.; Kronmüller, H. Internal friction in NiAl single crystals. Philos. Mag. Lett. 1996, 74, 189–194. [Google Scholar] [CrossRef]
- Eastman, J.R. IDRISI Andes Tutorial; Clark Labs., Clark University: Worcester, MA, USA, 2006; p. 284. [Google Scholar]
- Araya, Y.H.; Cabral, P. Analysis and Modeling of Urban Land Cover Change in Setúbal and Sesimbra, Portugal. Remote Sens. 2010, 2, 1549–1563. [Google Scholar] [CrossRef] [Green Version]
- Gardner, M.W.; Dorling, S.R. Artificial neural networks (the multilayer perceptron)—A review of applications in the atmospheric sciences. Atmos. Environ. 1998, 32, 2627–2636. [Google Scholar] [CrossRef]
- van Vliet, J.; Bregt, A.K.; Brown, D.G.; van Delden, H.; Heckbert, S.; Verburg, P.H. A review of current calibration and validation practices in land-change modeling. Environ. Model. Softw. 2016, 82, 174–182. [Google Scholar] [CrossRef]
- Congalton, R.G. Accuracy assessment and validation of remotely sensed and other spatial information. Int. J. Wildl. Fire 2001, 10, 321–328. [Google Scholar] [CrossRef] [Green Version]
- Pontius, R.G. Statistical methods to partition effects of quantity and location during comparison of categorical maps at multiple resolutions. Photogramm. Eng. Remote Sens. 2002, 68, 1041–1058. [Google Scholar]
- Melville, B.; Lucieer, A.; Aryal, J. Assessing the impact of spectral resolution on classification of lowland native grassland communities based on field spectroscopy in Tasmania, Australia. Remote Sens. 2018, 10, 308. [Google Scholar] [CrossRef] [Green Version]
- Landis, J.R.; Koch, G.G. The Measurement of Observer Agreement for Categorical Data. Biometrics 1977, 33, 159. [Google Scholar] [CrossRef] [Green Version]
- Ameyibor, S.; Basteck, T.; Bierbaum, C.; Frommeld, N.; Giaourakis, N.; Hackenbroch, K.; Kirchberg, A.; Kutsch, A.; Mendel, M.; Schlichting, S.; et al. Informal Settlements Development on Zanzibar A Study on the Community Based Provision of Storm Water Management Participants; Spring Working Paper; SPRING Centre University of Dortmund: Dortmund, Germany, 2003; Volume 21. [Google Scholar]
- Raskin, P.D. Global Scenarios: Background Review for the Millennium Ecosystem Assessment. Ecosystems 2005, 8, 133–142. [Google Scholar] [CrossRef]
- Guerry, A.D.; Ruckelshaus, M.H.; Arkema, K.K.; Bernhardt, J.R.; Guannel, G.; Kim, C.-K.; Marsik, M.; Papenfus, M.; Toft, J.E.; Verutes, G.; et al. Modeling benefits from nature: Using ecosystem services to inform coastal and marine spatial planning. Int. J. Biodivers. Sci. Ecosyst. Serv. Manag. 2012, 8, 107–121. [Google Scholar] [CrossRef] [Green Version]
- Cabral, P.; Feger, C.C.; Levrel, H.; Chambolle, M.M.; Basque, D. Assessing the impact of land-cover changes on ecosystem services: A first step toward integrative planning in Bordeaux, France. Ecosyst. Serv. 2016, 22, 318–327. [Google Scholar] [CrossRef] [Green Version]
- Medeiros, R.; Cabral, P. Dynamic modeling of urban areas for supporting integrated coastal zone management in the South Coast of São Miguel Island, Azores (Portugal). J. Coast. Conserv. 2013, 17, 805–811. [Google Scholar] [CrossRef]
- Cabral, P.; Santos, J.A.; Augusto, G. Monitoring Urban Sprawl and the National Ecological Reserve in Sintra-Cascais, Portugal: Multiple OLS Linear Regression Model Evaluation. J. Urban Plan. Dev. 2011, 137, 346–353. [Google Scholar] [CrossRef]
Figure 1.
Study area in Zanzibar.

Figure 2.
Methodological framework.
Figure 3.
Business as usual (left) and conservation scenarios constraints (right).

Figure 4.
Standardized factors.

Figure 5.
Transition potentials (TP) 2003–2009.

Figure 6.
Land Use Land Cover maps for the years 2003, 2009, and 2018.

Figure 7.
Land cover maps for 2018 actual (left) and simulated (right).

Figure 8.
Simulated Land Use Land Cover maps for 2027.

Figure 9.
Comparisons of Land Use Land Cover changes (%) from 2018 to 2027 for all scenarios.

Figure 10.
Trends of overall ERI from 2003–2027 (EXTRM: Extreme; BAU: Business as usual; CONSV: Conservation).
Figure 10.
Trends of overall ERI from 2003–2027 (EXTRM: Extreme; BAU: Business as usual; CONSV: Conservation).

Figure 11.
Trend of Ecological Risk Index (ERI) per district 2003–2027 (EXTRM: Extreme; BAU: Business as usual; CONSV: Conservation).
Figure 11.
Trend of Ecological Risk Index (ERI) per district 2003–2027 (EXTRM: Extreme; BAU: Business as usual; CONSV: Conservation).


Table 1.
Base data used in the study.
| Dataset | Description | Resolution | Source |
|---|---|---|---|
| Landsat 7 ETM+ | Raster, Row = 064, path = 166, Date: 14/01/2003 | 30 m | www.earthexplorer.usgs.gov/ |
| Landsat 5 TM | Raster, Row = 064, path = 166, Date: 1/07/2009 | 30 m | www.earthexplorer.usgs.gov/ |
| Landsat 7 ETM+ | Raster, Row = 064, path = 166, Date: 18/07/2018 | 30 m | www.earthexplorer.usgs.gov/ |
| Digital Elevation Model | Raster | 30 m | http://opendata.rcmrd.org |
| Roads | Vector | - | www.zansdi.environment.fi |
| Buildings | Vector | - | www.zansdi.environment.fi |
| Forests | Vector | - | www.zansdi.environment.fi |
| Coastline | Vector | - | www.zansdi.environment.fi |
| 2012 Zanzibar LULC | Vector | - | www.zansdi.environment.fi |
Table 2.
Training polygons, samples, and testing points for 2003.
| Class | Number of Training Polygons | Pixel-Based on Training Samples | Testing Points Used for Accuracy Assessment |
|---|---|---|---|
| Built-up | 23 | 5608 | 40 |
| Farmland | 26 | 29,379 | 40 |
| Forest | 28 | 132,683 | 50 |
| Grassland | 32 | 48,101 | 50 |
| Wetland | 17 | 1011 | 20 |
Table 3.
Training polygons, samples and testing points for year 2009.
| Class | Number of Training Polygons | Pixel-Based on Training Samples | Testing Points Used for Accuracy Assessment |
|---|---|---|---|
| Built-up | 28 | 22,054 | 40 |
| Farmland | 22 | 28,459 | 50 |
| Forest | 34 | 117,049 | 50 |
| Grassland | 26 | 41,083 | 50 |
| Wetland | 11 | 1383 | 20 |
Table 4.
Training polygons, samples and testing points for year 2018.
| Class | Number of Training Polygons | Pixel-Based on Training Samples | Testing Points Used for Accuracy Assessment |
|---|---|---|---|
| Built-up | 34 | 11,823 | 40 |
| Farmland | 27 | 20,897 | 50 |
| Forest | 38 | 100,082 | 50 |
| Grassland | 26 | 42,086 | 50 |
| Wetland | 22 | 1011 | 20 |
Table 5.
Cramer’s power for external variables.
| Explanatory Variable | Overall Cramer’s V |
|---|---|
| Distance to buildings | 0.29 |
| Distance to roads | 0.18 |
| Distance to coastal area | 0.17 |
| Distance to forests | 0.14 |
| Slope | 0.07 |
| Restricted areas | 0.19 |
Table 6.
LULC class shares in (ha) for 2003, 2009, and 2018 and % changes between 2003 and 2018.
| LULC Classes | Area (ha) (2003) | Area (ha) (2009) | Area (ha) (2018) | % Changes (2003–2009) | % Changes (2009–2018) | % Changes (2003–2018) |
|---|---|---|---|---|---|---|
| Built-up | 4132.44 | 5081.94 | 7201.35 | 18.68 | 29.43 | 42.62 |
| Forest | 73,329.39 | 69,460.56 | 61,692.03 | −5.28 | −11.18 | −15.87 |
| Farmland | 22,171.77 | 27,669.15 | 29,206.17 | 24.79 | 5.26 | 31.73 |
| Grassland | 56,569.41 | 54,107.73 | 58,484.43 | −4.55 | 7.48 | 3.27 |
| Wetland | 1925.55 | 1809.18 | 1544.58 | −6.43 | −17.13 | −24.66 |
Table 7.
Cross tabulation of actual (columns) against simulated (rows) LULC for 2018.
| Built-Up | Forest | Farmland | Grassland | Wetland | Total | User´s Accuracy | |
|---|---|---|---|---|---|---|---|
| Built-up | 80,911 | 8244 | 2075 | 4044 | 82 | 95,356 | 84% |
| Forest | 839 | 216,510 | 13,339 | 75,508 | 96 | 306,292 | 70% |
| Farmland | 5137 | 17,318 | 115,300 | 43,183 | 3 | 180,941 | 63% |
| Grassland | 3617 | 3256 | 19,520 | 173,609 | 4 | 20,0006 | 86% |
| Wetland | 18 | 36 | 57 | 91 | 2005 | 2207 | 90% |
| Total | 90,522 | 245,364 | 150,291 | 296,435 | 2190 | 784,802 | |
| Producer’s accuracy | 89% | 88% | 76% | 58% | 91% |
Table 8.
Model validation (Kappa statistics). Kappa value of <0.00 = poor; 0.00–0.20 = slight; 0.21–0.40 = fair; 0.41–0.60 = moderate; 0.61–0.80 = substantial; 0.81–1.00 = almost perfect [63].
Table 8.
Model validation (Kappa statistics). Kappa value of <0.00 = poor; 0.00–0.20 = slight; 0.21–0.40 = fair; 0.41–0.60 = moderate; 0.61–0.80 = substantial; 0.81–1.00 = almost perfect [63].
| KIndicator | Value |
|---|---|
| Khisto | 0.83 |
| Klocation | 0.77 |
| Kappa = Khisto × Klocation | 0.64 |
Table 9.
Areal changes from 2018–2027 under the three scenarios (BAU: business as usual scenario; CONSV: conservation scenario; EXTRM: extreme scenario).
Table 9.
Areal changes from 2018–2027 under the three scenarios (BAU: business as usual scenario; CONSV: conservation scenario; EXTRM: extreme scenario).
| Area in ha | % Changes 2018−2027 | ||||||
|---|---|---|---|---|---|---|---|
| LULC Classes | 2018 | 2027BAU | 2027 CONSV | 2027 EXTRM | BAU | CONSV | EXTRM |
| Built-up | 7201.35 | 9593.55 | 9060.03 | 10,568.88 | 24.9 | 20.5 | 31.9 |
| Forest | 61692 | 57,556.53 | 68,466.42 | 60,250.59 | −6.703 | 3.9 | −2.3 |
| Farmland | 29,206.2 | 27,389.25 | 36,601.11 | 33,765.84 | −6.2 | 20.2 | 13.5 |
| Grassland | 58,484.4 | 62,134.65 | 57,933.81 | 57,034.62 | 5.9 | −0.9 | −2.5 |
| Wetland | 1544.58 | 1454.58 | 1354.86 | 1418.4 | −5.8 | −14.0 | −8.2 |
Table 10.
Ecological risk indices for land cover classes of 2003–2018 (Ci: fragmentation index; Ni: isolation index); Di: dominance index; Si: disturbance degree index; Fi: ecological fragility index; Ri: loss index; ERI: ecological risk index).
Table 10.
Ecological risk indices for land cover classes of 2003–2018 (Ci: fragmentation index; Ni: isolation index); Di: dominance index; Si: disturbance degree index; Fi: ecological fragility index; Ri: loss index; ERI: ecological risk index).
| LULC Classes | Year | Area (ha) | No of Patches | Greatest Patch (ha) | Ci | Ni | Di | Si | Fi | Ri | ERI |
|---|---|---|---|---|---|---|---|---|---|---|---|
| Built-up | 2003 | 4132.4 | 4775 | 1988.28 | 1.16 | 3.32 | 0.03 | 1.69 | 0.333 | 0.564 | 0.015 |
| 2009 | 5081.9 | 6115 | 3489.22 | 1.20 | 3.16 | 0.03 | 1.64 | 0.333 | 0.548 | 0.018 | |
| 2018 | 72,01.4 | 7012 | 5269.32 | 0.97 | 3.31 | 0.04 | 1.28 | 0.333 | 0.427 | 0.020 | |
| Forest | 2003 | 73,329 | 14608 | 36,821.16 | 0.20 | 0.33 | 0.34 | 0.25 | 0.067 | 0.017 | 0.008 |
| 2009 | 69,461 | 17472 | 32,742.63 | 0.25 | 0.38 | 0.32 | 0.30 | 0.067 | 0.020 | 0.009 | |
| 2018 | 61,692 | 13689 | 30,967.18 | 0.22 | 0.38 | 0.29 | 0.27 | 0.067 | 0.018 | 0.007 | |
| Farmland | 2003 | 22,172 | 21180 | 2198.07 | 0.96 | 1.31 | 0.13 | 0.98 | 0.133 | 0.130 | 0.018 |
| 2009 | 27,669 | 20,033 | 3858.71 | 0.72 | 1.02 | 0.15 | 0.75 | 0.133 | 0.101 | 0.018 | |
| 2018 | 29,206 | 20,841 | 6535.44 | 0.71 | 0.98 | 0.16 | 0.74 | 0.133 | 0.099 | 0.020 | |
| Grassland | 2003 | 56,569 | 14,601 | 22,190.31 | 0.26 | 0.42 | 0.27 | 0.31 | 0.267 | 0.082 | 0.029 |
| 2009 | 54,108 | 23,568 | 20,135.7 | 0.44 | 0.56 | 0.27 | 0.46 | 0.267 | 0.122 | 0.042 | |
| 2018 | 58,484 | 29,352 | 11,209.79 | 0.50 | 0.58 | 0.30 | 0.51 | 0.267 | 0.135 | 0.050 | |
| Wetland | 2003 | 1925.6 | 171 | 176.86 | 0.09 | 1.35 | 0.008 | 0.46 | 0.2 | 0.092 | 0.001 |
| 2009 | 1809.2 | 146 | 146.12 | 0.08 | 1.33 | 0.007 | 0.45 | 0.2 | 0.0895 | 0.001 | |
| 2018 | 1544.6 | 127 | 157.86 | 0.08 | 1.45 | 0.006 | 0.49 | 0.2 | 0.097 | 0.001 |
Table 11.
Ecological risk indices for the 2027 scenarios (Ci: fragmentation index; Ni: isolation index); Di: dominance index; Si: disturbance degree index; Fi: ecological fragility index; Ri: loss index; ERI: ecological risk index).
Table 11.
Ecological risk indices for the 2027 scenarios (Ci: fragmentation index; Ni: isolation index); Di: dominance index; Si: disturbance degree index; Fi: ecological fragility index; Ri: loss index; ERI: ecological risk index).
| LULC Classes | Scenario | Area (ha) | No of Patches | Greatest Patch (ha) | Ci | Ni | Di | Si | Fi | Ri | ERI |
|---|---|---|---|---|---|---|---|---|---|---|---|
| Built-up | BAU | 9593.55 | 6794 | 5603.04 | 0.71 | 1.71 | 0.050 | 0.94 | 0.333 | 0.314 | 0.0191 |
| Conservation | 9060.03 | 6693 | 5391.09 | 0.72 | 1.79 | 0.048 | 0.99 | 0.333 | 0.329 | 0.0188 | |
| Extreme | 10,568.9 | 7288 | 4338.81 | 0.73 | 1.82 | 0.055 | 0.90 | 0.333 | 0.300 | 0.0201 | |
| Forest | BAU | 57,556.5 | 14,992 | 24,601.05 | 0.26 | 0.42 | 0.265 | 0.31 | 0.067 | 0.021 | 0.0075 |
| Conservation | 68,466.4 | 13,941 | 32,808.24 | 0.20 | 0.34 | 0.309 | 0.26 | 0.067 | 0.017 | 0.0074 | |
| Extreme | 60,250.6 | 21,613 | 28,998.9 | 0.36 | 0.49 | 0.286 | 0.39 | 0.067 | 0.026 | 0.0099 | |
| Farmland | BAU | 27,389.3 | 22,205 | 1810.25 | 0.81 | 1.08 | 0.148 | 0.83 | 0.133 | 0.110 | 0.0191 |
| Conservation | 36,601.1 | 21,960 | 2073.8 | 0.60 | 0.81 | 0.1869 | 0.62 | 0.133 | 0.083 | 0.0191 | |
| Extreme | 33,765.8 | 25,146 | 1928.93 | 0.74 | 0.93 | 0.179 | 0.74 | 0.133 | 0.099 | 0.0212 | |
| Grassland | BAU | 62134.7 | 33,375 | 30,906.9 | 0.5371 | 0.58 | 0.311 | 0.53 | 0.267 | 0.141 | 0.0554 |
| Conservation | 57,933.8 | 32,366 | 30,845.88 | 0.5587 | 0.61 | 0.292 | 0.55 | 0.267 | 0.147 | 0.0537 | |
| Extreme | 57,034.6 | 31,642 | 30,017.61 | 0.5548 | 0.62 | 0.287 | 0.54 | 0.267 | 0.146 | 0.0527 | |
| Wetland | BAU | 1454.58 | 125 | 249.84 | 0.0859 | 1.53 | 0.006 | 0.51 | 0.2 | 0.102 | 0.0009 |
| Conservation | 1354.86 | 185 | 249.84 | 0.1365 | 1.99 | 0.006 | 0.68 | 0.2 | 0.136 | 0.0012 | |
| Extreme | 1418.4 | 185 | 249.84 | 0.1304 | 1.91 | 0.006 | 0.65 | 0.2 | 0.130 | 0.0012 |
Table 12.
Overall ecological risk index changes (%) from 2003 to 2027 (BAU: Business as usual; EXTRM: Extreme; CONSV: Conservation).
Table 12.
Overall ecological risk index changes (%) from 2003 to 2027 (BAU: Business as usual; EXTRM: Extreme; CONSV: Conservation).
| Year/Scenario | Overall ERI | % Changes |
|---|---|---|
| 2003 | 0.0714 | - |
| 2009 | 0.0867 | 17.7 |
| 2018 | 0.0957 | 9.4 |
| BAU | 0.1020 | 6.2 |
| EXTRM | 0.1050 | 8.9 |
| CONSV | 0.1002 | 4.6 |
Table 13.
Ecological Risk Index changes by district 2003–2027.
| District | Trend of ERI Change (%) | ||||
|---|---|---|---|---|---|
| 2003–2009 | 2009–2018 | 2018–2027 BAU | 2018–2027 EXTREME | 2018–2027 CONSERVATION | |
| North A | 16.63 | 8.95 | 18.51 | 23.45 | 17.13 |
| North B | 9.89 | 14.78 | 13.51 | 17.92 | 2.79 |
| Central | 10.37 | 4.39 | 10.82 | 8.64 | 1.82 |
| South | 10.37 | 10.63 | 10.94 | 8.35 | 3.67 |
| West | 14.57 | 23.41 | 5.39 | 11.61 | 6.93 |
| Urban | −1.35 | 5.27 | 0.24 | 2.19 | 0.49 |
© 2020 by the authors. Licensee MDPI, Basel, Switzerland. This article is an open access article distributed under the terms and conditions of the Creative Commons Attribution (CC BY) license (http://creativecommons.org/licenses/by/4.0/).
Share and Cite
MDPI and ACS Style
Omar, H.; Cabral, P. Ecological Risk Assessment Based on Land Cover Changes: A Case of Zanzibar (Tanzania). Remote Sens. 2020, 12, 3114. https://doi.org/10.3390/rs12193114
AMA Style
Omar H, Cabral P. Ecological Risk Assessment Based on Land Cover Changes: A Case of Zanzibar (Tanzania). Remote Sensing. 2020; 12(19):3114. https://doi.org/10.3390/rs12193114
Chicago/Turabian StyleOmar, Hassan, and Pedro Cabral. 2020. "Ecological Risk Assessment Based on Land Cover Changes: A Case of Zanzibar (Tanzania)" Remote Sensing 12, no. 19: 3114. https://doi.org/10.3390/rs12193114
Note that from the first issue of 2016, this journal uses article numbers instead of page numbers. See further details here.