Surface Properties Linked to Retrieval Uncertainty of Satellite Sea-Ice Thickness with Upward-Looking Sonar Measurements


1
Satellite Oceanography Laboratory, Russian State Hydrometeorological University, 195196 Saint Petersburg, Russia
2
Helmholtz Centre for Polar and Marine Research, Alfred Wegener Institute, 27570 Bremerhaven, Germany
3
Finnish Meteorological Institute, Marine research, FI-00100 Helsinki, Finland
*
Author to whom correspondence should be addressed.
Remote Sens. 2020, 12(18), 3094; https://doi.org/10.3390/rs12183094
Submission received: 4 August 2020
/
Revised: 8 September 2020
/
Accepted: 16 September 2020
/
Published: 22 September 2020
(This article belongs to the Section Ocean Remote Sensing)
Abstract
:One of the key sources of uncertainties in sea ice freeboard and thickness estimates derived from satellite radar altimetry results from changes in sea ice surface properties. In this study, we analyse this effect, comparing upward-looking sonar (ULS) measurements in the Beaufort Sea over the period 2003–2018 to sea ice draft derived from Envisat and Cryosat-2 data. We show that the sea ice draft growth underestimation observed for the most of winter seasons depends on the surface properties preconditioned by the melt intensity during the preceding summer. The comparison of sea ice draft time series in the Cryosat-2 era indicates that applying 50% retracker thresholds, used to produce the European Space Agency’s Climate Change Initiative (CCI) product, provide better agreement between satellite retrievals and ULS data than the 80% threshold that is closer to the expected physical waveform interpretation. Our results, therefore, indicate compensating error contributions in the full end-to-end sea-ice thickness processing chain, which prevents the quantification of individual factors with sea-ice thickness/draft validation data alone.
1. Introduction
Satellite radar altimeter measurements are widely used to retrieve sea ice thickness in the Arctic region at the basin-wide scale—e.g., [1,2,3,4,5]. The applied methods are based on sea ice freeboard retrieval under assumption that Ku-band radar signal backscatter from the snow-ice interface. The sea ice freeboard is defined as a height of the ice surface above the local sea level and determined from comparison of elevation measurements over sea ice floes and leads—i.e., cracks in the ice. The freeboard measurements are then converted to sea ice thickness, assuming hydrostatic equilibrium of floating ice. Therefore, uncertainties in sea ice thickness (SIT) estimates stem from freeboard retrieval and freeboard to thickness conversion. One of the main sources of uncertainties in sea ice freeboard retrieval is associated with snow properties [6,7,8]. Depending on snow temperature and salinity, the scattering horizon may migrate within the snow pack, which impacts the surface elevation estimates. Another uncertainty is related to the possible underestimation of the sea level, since specular returns identified as the measurements in leads dominate the radar echo even being hundreds meters off-nadir [9]. Increased surface roughness associated with ridges and hummocks can be the reason for one more error source as it impacts the scattering surface elevation and prevents the accurate identification of the mean sea ice surface [10]. The largest uncertainties in sea ice freeboard to thickness conversion are related to the lack of knowledge about snow depth and sea ice density. Snow climatology, based on measurements of drifting stations during the second half of 20th century [11], is still used as the main source of snow depth and density data. Variability of the sea ice density is also poorly known, and the fixed values evaluated—e.g., in [12]—are usually used for the sea ice thickness retrieval.
Thus, the validation of different retrieval algorithms is highly important for the evaluation of the sea ice thickness product quality, as well as the future evolution of sea-ice thickness algorithms. Sea ice draft measurements of the moored upward-looking sonars (ULS) [13,14,15] and Operation IceBridge (OIB) airborne measurements of sea ice freeboard and snow depth [16] are the main data sources used to validate satellite altimeter-based sea ice thickness. OIB airborne measurements were acquired every year in late spring by lidar and snow radar and can be used to perform direct validation of the sea ice freeboard retrievals along the airborne tracks over the western part of the Arctic. The ULS data from the Beaufort Sea Exploration Project (BGEP) provide continuous measurements of the sea ice draft—i.e., portion of the sea ice below the sea level, over mooring sites and allow the validation of temporal changes of sea ice thickness estimates. Since draft observations represent the main portion of the sea ice thickness, the ULS data allow an end-to-end validation of satellite SIT product, but do not provide information about sea ice freeboard.
In this work we use BGEP ULS measurements to analyse satellite radar altimeter retrievals derived by the algorithm described in [3] and applied to produce SIT data records in the frame of the European Space Agency’s Sea Ice Climate Change Initiative (CCI). The CCI Phase 2 (CCI-2) SIT product was validated by Kern et al. [17], where the comparison of the gridded sea ice draft estimated using radar altimeter observations from Envisat and Cryosat-2 (CS2) satellites with, in particular, the BGEP ULS measurements, is provided. A strong correlation between CS2 retrievals and BGEP ULS measurements is reported in several studies—e.g., in [5,18,19,20]. In continuation of this work, we present a detailed description of seasonal and inter-annual changes in the discrepancies between satellite-derived estimates and the BGEP ULS data. Further, the origin of these discrepancies is analysed in conjunction with the satellite and geophysical parameters.
2. Materials and Methods
2.1. Radar Altimeter Data
Sea ice freeboard and thickness are retrieved from the Envisat pulse-limited radar altimeter measurements (2002–2012) and SAR mode beam-limited Cryosat-2 (CS2) radar altimeter data (2010–2019) by the approach that minimizes seasonally dependent inter-mission bias [3,21,22]. Sea ice freeboard is estimated from the difference between elevations measured in leads and over sea ice surface by applying the threshold first-maximum retracker algorithm, which uses a percentage threshold of the waveform’s first-maximum power return to identify retracking point [23]. While the fixed 50% threshold is used to retrack CS2 waveforms both for lead and sea ice surfaces, an adaptive threshold, which depends on waveform shape parameters, is applied to the Envisat measurements over sea ice to form consistent sea ice freeboard time series [3]. The choice of the threshold percentage is shown to affect the retrieved elevation, depending on surface properties [10,23]. Therefore, to evaluate the effect of the freeboard retrieval algorithm, we computed sea ice freeboard and corresponding thickness by applying an 80% threshold to the CS2 data over leads and sea ice floes. For the conversion of sea ice freeboard to thickness, we used snow climatology [11] modified over first-year ice [24] and ice-type dependent sea ice density [12] in accordance with the CCI algorithm [25].
Since wet snow and the formation of melt ponds in summer prevents the retrieval of sea ice freeboard by radar altimetry, the satellite estimates are limited to the period from October to April. For comparison with the ULS measurements, we calculated monthly mean sea ice freeboard and thickness using the along-track estimates within the 200 km radius of the mooring locations following the approach used in [18].
2.2. Upward-Looking Sonar Data
The Beaufort Gyre Exploration Project (BGEP) presently provides the sea ice draft measurements for 15 winter seasons from 2003–2004 to 2017–2018 (https://www.whoi.edu/beaufortgyre). The measurements from the four (A, B, C, and D) moored ULS located in the Beaufort Sea (Figure 1) are available for different time periods (Table 1). Data from the mooring A are the only ULS measurements available for the entire period of observations, while there are data gaps during the winter seasons 2005–2006 and 2009–2010 for the mooring B, and data from the moorings C and D are available to the season 2007–2008 and from the season 2006–2007, respectively. Thus, data from the moorings A, B, and D are available for the entire period of CS2 measurements, while the moorings providing measurements over the period of Envisat observations vary from year to year.
The ULSs operate from around 50 m below the surface with a frequency 420 kHz (beamwidth 1.8 deg) and measures sea ice draft every 2 s within the 2 m footprint with the accuracy of individual range measurement of ±5 cm. For comparison with the estimates derived from the radar altimeter data we calculated monthly mean sea ice draft, excluding measurements of less than 10 cm, as they may represent leads.
3. Results and Discussion
3.1. Satellite-Derived vs. ULS-Measured Sea Ice Draft
A monthly averaged sea ice draft, estimated as a difference between sea ice thickness and freeboard retrieved from satellite altimeter data, was compared with the BGEP ULS sea ice draft measurements. We consider two satellite sea ice draft monthly time series: (1) related to the mooring A, and (2) calculated as a mean of sea ice draft monthly values related to all moorings where ULS data are available during the specific winter season. The availability of the ULS measurements from the mooring A over almost the entire period of satellite observations gives us a consistent time series, while combining data from all moorings provides time series that are less noisy than those based on just one mooring.
Figure 2 presents a comparison of the ULS measurements with three satellite-derived sea ice draft estimates: one from Envisat (drEnv) and two from CS2 with elevations retrieved using 50% (drCS2_50) and 80% (drCS2_80) retracker thresholds. The differences between the ULS sea ice draft measurements (druls) and consistent time series of drEnv and drCS2_50 are comparatively small on average. The mean (root-mean-square (rms)) of sea ice draft differences, drEnv–druls and drCS2_50–druls, are −0.12 m (0.38 m) and 0.07 m (0.21 m) when comparing data for the mooring A, and −0.18 m (0.34 m) and 0.08 m (0.19 m) when combining data from all moorings. The 80% threshold on the leading-edge of the waveform corresponds to larger range and consequently lower freeboard estimate, since the higher threshold has a larger impact over sea ice waveforms than the narrow lead waveforms. Therefore, the estimates of sea ice draft drCS2_80 are, as expected, lower than those of drCS2_50 with the mean (rms) differences drCS2_80–druls of −0.42 m (0.47 m) and −0.44 m (0.49 m).
Figure 2a,b show that the satellite data reasonably reproduce sea ice draft growth of about 1–1.5 m during the winter season in the area of the BGEP mooring sites. However notable deviations between satellite retrievals and ULS measurements are revealed from time series of the differences between these datasets (Figure 2c,d). In particular, the winter sea ice growth is underestimated for the most of seasons, as represented by the decrease in differences during winter. The mean seasonal change rate of the difference drEnv–druls is −7.2 cm/month and −4.9 cm/month for the mooring A and for combined data from all moorings, respectively. For the CS2 estimates, the larger underestimation of seasonal sea ice draft growth is observed for the drCS2_80 draft: mean seasonal change rate of the difference drCS2_80–druls is −7.6 cm/month for the mooring A and −6.5 cm/month for all moorings. A corresponding seasonal change in the difference drCS2_50–druls is on average −4.8 cm/month and −3.8 cm/month.
Inter-annual variability of the differences between satellite-derived sea ice draft estimates and ULS measurements is revealed, particularly in abrupt shifts between winter seasons 2007–2008 and 2008–2009, and from 2011–2012 to 2013–2014 (Figure 2c,d). As well as the underestimation of seasonal growth the inter-annual variability of the sea ice draft differences observed during the CS2 observation period is larger for the drCS2_80 estimates, as compared to the drCS2_50 data. Moreover, the time series obtained using combined data from all moorings (Figure 2d) suggest that there is a relationship between inter-annual changes and change rates of the sea ice draft difference, especially for the drCS2_80–druls values. In particular, the lowest seasonal mean sea ice draft differences during the seasons 2013–2014 and 2014–2015 correspond to the lowest underestimation of seasonal draft growth.
3.2. Waveform Parameters and Sea Ice Freeboard Retrievals
The observed seasonal and inter-annual discrepancies between satellite-derived and ULS-measured sea ice draft can result from the convoluted uncertainties in sea ice freeboard retrieval and freeboard to thickness conversion. Aiming to reveal the effect of the former, we formed monthly time series of the radar altimeter waveform parameters—leading edge width (LeW) and pulse peakiness (PP) derived, following [3,23], which can be used to characterize the sea ice surface properties in the vicinity of the moorings (Figure 3). For the CS2 observation period, we also calculated the difference fbCS2_80–fbCS2_50—i.e., the difference between monthly mean sea ice freeboards used for estimating drafts drCS2_50 and drCS2_80 (Figure 2c,d). In the following sections, we use this difference as a measure for freeboard retrieval uncertainty.
For most of the winter seasons, an increase in the LeW and decrease in PP during winter reflect a change in the radar altimeter echo waveforms to a more diffuse shape. This represents primarily a sea ice surface roughness increase with an increase in the fraction of deformed ice and pressure ridges, and also an increase in volume scattering due to snow depth growth. Sea ice freeboard difference fbCS2_80–fbCS2_50 is, as expected, always negative, as the lower height of sea ice floes are estimated with the 80% retracker threshold. During winter seasons the fbCS2_80–fbCS2_50 values typically becomes more negative following changes in the LeW and PP parameters [23]. Seasonal changes in the differences fbCS2_80–fbCS2_50 can be attributed to an increase in the distance between 50% and 80% thresholds for the waveforms with a more flattened leading edge. This is consistent with the conclusion reported by Landy et al. [10], in that location on the leading edge, corresponding to the mean surface elevation within the footprint, depends on the sea ice surface roughness. Seasonal decrease in fbCS2_80–fbCS2_50 in the area of BGEP moorings location is not observed only during the 2013–2014 and 2014–1015 seasons, which is in agreement with small seasonal changes in the LeW and PP (Figure 2c,d and Figure 3). In addition, the most negative seasonal mean differences fbCS2_80–fbCS2_50 observed during these winters correspond to the highest (lowest) values of LeW (PP) which suggests a relationship between the inter-annual variability of these parameters.
The link between seasonal mean and the seasonal change rate in the LeW, PP and fbCS2_80–fbCS2_50 is assessed by calculating correlation coefficients for each parameter (Table 2). The correlation between the mean and the change rate for the October-to-April period is significant at the 95% confidence level for the PP, for the sea ice freeboard difference fbCS2_80–fbCS2_50 and for the LeW derived from the CS2 data (marked with bold in Table 2). Even higher correlations are estimated between October–November mean and the change during winter seasons. Thus, we conclude that changes in surface characteristics during winter are primarily controlled by its initial conditions that are set after the preceding summer season. After intensive summer melting, a decrease in multiyear ice fraction and snow depth result in levelling sea ice surface and a decrease in volume scattering that is reflected in low LeW and high PP values. Then, the LeW rapidly increases (and PP decreases) during winter due to strong contrast between initial and subsequent surface properties as a result of surface roughness increase and snow accumulation. In the case of relatively cold summers, the surface characteristics during winter show no significant change with respect to initial conditions and changes in the waveform parameters are small.
It should be noted that a strong relationship between the mean and the change in the surface characteristic over mooring sites is indicated despite the fact that we do not account for the sea ice drift. A spatial consistency between seasonally mean and seasonal change rate for the LeW and PP parameters in the vicinity of the BGEP moorings is illustrated in the examples of 2005–2006 and 2008–2009 seasons for Envisat and the 2011–2012 and 2013–2014 seasons for CS2 in Figure 4 and Figure 5, respectively. Figure 5 also indicates spatial agreement between waveform parameters and the difference in fbCS2_80–fbCS2_50. The winters of 2005–2006 and 2013–2014 correspond to predominantly high values of LeW (low PP) in the BGEP area, while, during winters 2008–2009 and 2011–2013, mostly low LeW (high PP) is observed. Figures show that spatial distributions of PP’s seasonally mean and seasonal change rate are in agreement for both Envisat and CS2, while for the LeW they are in good agreement only for CS2. The seasonal mean and changes in the sea ice freeboard difference fbCS2_80–fbCS2_50 also agree with each other, as well as with distribution of the LeW and PP waveform parameters derived from CS2 data. Thus, the consistency of spatial distributions is in agreement with the consistency of the corresponding time series for the mooring locations (Table 2).
3.3. Impact of Sea Ice Freeboard Retrieval Uncertainly on Sea Ice Draft Estimates
Time series on Figure 2c,d and Figure 3 show that a seasonal decrease in the differences between sea ice drafts derived from satellites and measured by ULS observed during most of the winter seasons is consistent with seasonal increase in the LeW and decrease in the PP and fbCS2_80–fbCS2_50 values. An agreement in inter-annual variability between all these characteristics can also be noted—e.g., from consistency of the low mean sea ice draft differences, especially the drCS2_80–druls, and the high (low) LeW (PP) values during 2013–2014 and 2014–2015 seasons. This suggests that sea ice freeboard retrieval uncertainties, to a large extent, can explain the seasonal and inter-annual variations of the differences between satellite-derived and ULS-measured sea ice draft. This is supported by the fact that, as well as for the LeW, PP and fbCS2_80–fbCS2_50, the correlation of seasonal changes and the mean values in the beginning of winter season are significant at the 95% confidence level for sea ice draft differences drEnv–druls and drCS2_80–druls (Table 2). Low correlation for the differences drCS2_50–druls indicates that the sea ice draft drCS2_50 is less affected by the variations in freeboard uncertainties.
To evaluate the impact of sea ice freeboard uncertainties on draft estimates, we calculated the correlation of the LeW and PP parameters derived from Envisat and CS2 data over sea ice surface as well as the sea ice freeboard difference fbCS2_80–fbCS2_50 with the corresponding differences between satellite and ULS sea ice drafts. Table 3 presents the correlation coefficients of October to April and October to November means, as well as the October to April seasonal change rate between sea ice draft differences and the corresponding LeW, PP and fbCS2_80–fbCS2_50 values. The highest correlation is observed for the difference drCS2_80–druls—all correlation coefficients between seasonal change rates are significant at the 95% confidence level, and notable correlations are also observed between the October and November means. For the differences drCS2_50–druls the correlation is much lower and significant only between seasonal change rates when comparing with the PP for the mooring A. For Envisat data, a sharp change in sea ice draft difference after summer 2008 is not reflected in the time series of waveform parameters, resulting in modest correlations between the drEnv–druls and the LeW and PP parameters, though statistically significant correlations are still observed when comparing October to April means using data from all moorings.
The results presented in Table 2 and Table 3 suggest that uncertainty in sea ice freeboard retrievals impacts seasonal and inter-annual discrepancies between the satellite-derived sea ice draft drCS2_80 and the draft measured by the ULS, while the relationship for the differences between drEnv–druls and drCS2_50–druls is observed only in part. The found relationships can be attributed to the change in surface properties during winter that is driven by the initial conditions formed after melt season. The greater seasonal change in surface properties, as represented by the change in the difference fbCS2_80–fbCS2_50 and waveform parameters, the larger the underestimation of seasonal sea ice draft growth. The small underestimation of sea ice draft growth for the seasons 2013–2014 and 2014–2015 corresponds to the lowest change in the LeW, PP and fbCS2_80–fbCS2_50 values.
The lower seasonal growth of the drCS2_80 as compared to the drCS2_50 could be attributed to the different effect of surface roughness [10] and snow accumulation [26] on elevation retrieval—the 80% retracker threshold corresponds to the lower level of scattering horizon and the estimates of ice floe elevation are less affected by the surface ridges and snow properties. This effect can explain the observed better agreement of the sea ice drafts druls and drCS2_80 in the beginning of the winter seasons and with the drCS2_50 in the end. After summer melting in the autumn months, when the sea ice in the area of the BGEP moorings is predominantly less deformed first-year ice (FYI), the better elevation estimates are provided with the retracker threshold closer to the peak of signal power, as suggested by Wingham et al. [27] for the CS2 measurements in SAR mode. In contrast, under increased roughness and snow cover in the end of winter season, the elevations are better represented by the estimates derived using the 50% retracker threshold. The drCS2_80 is underestimated in the autumn months only in 2013 and 2014, when the LeW (PP) is high (low), indicating increased roughness during the entire winter season.
However, using the retracker threshold closer to the waveform peak is supposed to provide, on average, more accurate surface elevation estimates from the radar altimeter measurements in SAR mode over sea ice [27]. Therefore, the better agreement between the drCS2_50 and druls in terms of the mean difference, rms of the difference and seasonal sea ice draft growth cannot be explained only by the uncertainties in sea ice freeboard retrieval. In particular, the comparison of satellite estimates derived using threshold-based retracking algorithms and physical model indicate that sea ice freeboard, retrieved by applying the 50% retracker threshold, is overestimated over multiyear ice (MYI), and reproduced [10] or underestimated [28] over FYI. The seasonal changes of the differences fbCS2_80–fbCS2_50 are primarily caused by changes in the sea ice surface properties, while the application of the two different retracker thresholds for lead waveforms has a minor impact on our analysis. Lead waveforms are characterized by high PP, and echo power at the leading edge is concentrated in a few range bins at most. We, therefore, assume that choosing either a 50% or 80% threshold results in a small offset for the respective freeboard values that is constant over the winter season but does not change the divergence between the two freeboard estimates that is primarily controlled by the increasing LeW over ice surfaces.
To evaluate the effect of the sea ice type on the draft estimates derived using different retracker thresholds, we used the data on the MYI fraction, provided by the Ocean and Sea Ice Satellite Application Facility, and for the SIT retrieval in the course of satellite altimeter data processing. Figure 6 shows, as expected, that time series of the MYI fraction over BGEP mooring sites increases during most of the winter seasons, providing information about the dependence of the sea ice draft estimates on the sea ice type. In contrast to the analysis of the sea ice freeboard reported in [10,28], the sea ice draft difference drCS2_50–druls indicates that the satellite-derived draft is overestimated in the beginning of winter season and becomes closer to the ULS-measured draft with the increase in MYI fraction.
Another possible reason for the observed underestimation of seasonal growth of the SIT derived from satellite radar altimetry can be associated with the fact that the underestimation of seasonal growth of the SIT derived from satellite radar altimetry is also associated with incorrect accounting for the lower speed of radar wave propagation in snow that is applied in the course of freeboard retrieval [29]. However, this effect is too small to explain the observed differences between satellite and ULS sea ice draft.
3.4. Impact of Sea Ice Freeboard to Thickness Conversion on Sea Ice Draft Estimates
Based on comparison of the drCS2_50 and drCS2_80 time series with the ULS data, we argue that the uncertainties related to the conversion of freeboard to thickness should significantly impact the satellite-derived draft estimates. The thickness () is calculated from the hydrostatic equilibrium equation:
where is sea ice freeboard, is snow depth, and , and are the densities of water, ice and snow. The largest uncertainties in the SIT estimates, along with those related to the sea ice freeboard retrieval, are associated with poor knowledge about snow depth and sea ice density [30,31]. In principle, the underestimation of the sea ice draft seasonal growth can be attributed to an underestimation of the seasonal snow depth growth by Warren climatology [11], used in the hydrostatic equilibrium equation to account for the snow loading and potentially changes in bulk sea-ice density.
The largest underestimation of the sea ice draft seasonal growth is observed for the drCS2_80 that correlates with seasonal changes of the LeW and PP and fbCS2_80–fbCS2_50 parameters (Table 3). Assuming that the underestimation of the sea ice draft seasonal growth is caused by the underestimation of snow depth growth in climatological data, the seasonal changes in the waveform parameters and the difference in fbCS2_80–fbCS2_50 should also, apparently, result from snow accumulation during winter. However, in this case, reasonably reproduced seasonal sea ice draft growth during winters 2013–2014 and 2014–2015 could not result from low snow accumulation indicated by the observed small seasonal change in the LeW, PP and fbCS2_80–fbCS2_50. Moreover, it is unlikely that Warren climatology underestimates the snow depth growth for most of the winter seasons over the considered time-periods of satellite and ULS observations.
The uncertainties in the sea ice density result from using fixed values representing typical densities of the FYI and MYI [12]. Belter et al. [15] showed that the strongest underestimation of the sea ice draft derived from the CS2 data corresponds to an increase in the sea ice deformation. Assuming that the ULS measures the distance to the underside of the blocky sea ice structures, one needs to consider the significant sea-water filled pore spaces in the density as well. In contrast, consolidated multi-year ice ridges may have a different bulk density closer to the level ice densities than their young unconsolidated counterparts. Therefore, since sea ice deformation increases during the winter seasons, as indicated from changes in waveform parameters, this may lead to a seasonal increase in the underestimation of sea ice density and, hence, SIT estimates. This effect could also explain inter-annual changes in the difference between satellite-derived and ULS-measured draft. In particular, the sharp change in sea ice draft difference after summer 2008 could be due to the systematic underestimation of sea ice density of heavily deformed ice during preceding years, though time series of the waveform parameters derived from Envisat measurements do not reflect significant change in surface properties. It should be noted that, in contrast to snow depth, which also affects the sea-ice freeboard estimate, sea-ice density is a parameter solely relevant in the freeboard to thickness conversion. Therefore, better agreement between the druls and drCS2_50 can be attributed to the systematic underestimating of sea ice density and its change over the winter season combined with the overestimating of the freeboard frCS2_50 with the two error contribution partly compensating each other.
3.5. Effect of Summer Conditions and Sea Ice Type on Sea Ice Draft Estimates
To investigate the initial conditions that precede winter seasons we examined monthly-averaged sea surface temperature (SST) in the area of the BGEP moorings obtained from the ERA-5 reanalysis data provided by the European Centre for Medium-Range Weather Forecasts for the 0.25° × 0.25° grids. For comparison with the difference between satellite retrievals and ULS measurements, we used the SST data averaged within the radius of 200 km around mooring locations.
When the ocean is covered by sea ice, the SST in ERA-5 reanalysis is set to 271.46K and, therefore, does not provide any valuable information for winter months. In summer, at least part of the area surrounding BGEP moorings have open water, and SST data can be used as a measure of melt intensity (Figure 6). To characterize the sea ice surface during winter season, we also used time series of MYI fraction that, in particular, strongly depends on melt intensity in the preceding summer. Figure 2c,d and Figure 6 clearly show that, for example, a large increase in the sea ice draft difference drEnv–druls between the 2007–2008 and 2008–2009 seasons corresponds to the high SST in summer 2008, while a decrease in the differences drCS2_50–druls and drCS2_80–druls between 2012–2013 and 2013–2014 seasons agree with cold summer conditions in summer 2013. Figure 6 also shows that the sea ice type during winter seasons following summers 2008 and 2013 is predominantly FYI and MYI, respectively.
Table 4 presents correlation coefficients of the differences between satellite and ULS sea ice drafts with July and August SST and with mean and change in MYI fraction during winter season. In addition to correlations for the three considered satellite-derived sea ice draft estimates, Table 4 presents correlations for the combined time series derived from inter-mission consistent sea ice drafts, the drEnv and drCS2_50, by averaging values during the overlap period. The sea ice draft differences after summer 2008 remained relatively high for the rest of the drEnv–druls and for the whole drCS2_50–druls time series, which may indicate some persistent change in sea ice conditions influencing the results of the sea ice thickness retrieval procedure. Since it may prevent evaluation of the relationships for the entire time series the correlations are calculated, in addition, for time series formed from the differences between adjacent points of the original time series. Similar to the comparison with the LeW, PP, and fbCS2_80–fbCS2_50 parameters, the relationship is most consistent for the sea ice draft difference drCS2_80–druls, and the largest correlation coefficients are observed for October–November mean differences. Correlation for the drEnv–druls is similar for October–November and October–April mean values, but it is statistically significant only for time series formed from the differences between adjacent points. The notable effect of using this type of time series is seen also for the combined sea ice draft time series that provides a significant correlation at 95% confidence level for the mean draft differences. The lowest relationship is estimated for the difference drCS2_50–druls with notable correlation observed only between their seasonally mean values and summer SST when combining data from all moorings.
The correlation of seasonal changes is lower for all differences between satellite and ULS sea ice drafts, although limited spatial consistency between mean values and seasonal change rates still can be noted for the MYI fraction from the examples in Figure 4 and Figure 5. Relatively high surface roughness, detected from the LeW, PP and fbCS2_80–fbCS2_50 distributions corresponds to predominant MYI in the BGEP area during the 2005–2006 and 2013–2014 winter seasons. This is consistent with the maps of SST in the preceding July and August indicating that most of the BGEP area remained covered by sea ice during summers 2005 and 2013 (Figure 7). In contrast, less deformed sea ice during the 2008–2009 and 2011–2012 seasons is consistent with the FYI in the 2008–2009 and 2011–2012 seasons and with the warmer sea surface in the summers of 2008 and 2011.
4. Conclusions
In this study, we used the BGEP ULS measurements in the Beaufort Sea for the period 2003–2018 to validate sea ice draft time series derived from the Envisat and CS2 satellite radar altimeter data by the algorithm used to produce the ESA CCI-2 SIT climate data record. The effect of sea ice freeboard uncertainties due to changes in surface properties on the sea ice draft satellite estimates was analysed using time series of the waveform parameters and the difference between sea ice freeboards retrieved from CS2 data by applying 50%, as used for the CCI-2 SIT product, and 80% retracker thresholds. Time series indicate that all satellite retrievals underestimated seasonal sea ice draft growth during most of winter seasons over the considered time period. The seasonal mean and seasonal changes in the difference between satellite-derived and ULS-measured sea ice draft are found to be linked with the sea ice surface properties preconditioned by the melt intensity during the preceding summer. The best agreement with the ULS data in terms of bias, rms of the differences and underestimation of sea ice draft growth during winter is indicated for the results derived using the 50% retracker threshold of the existing CCI climate data record. Since more accurate elevation estimates from the CS2 measurements in SAR mode are supposed to be provided by the 80% retracker threshold, this result can be attributed to the combined effect of overestimating sea ice freeboard and underestimating sea ice density used for the conversion of freeboard to thickness on SIT estimates.
Sea ice retrievals from the satellite radar altimetry using different algorithms, based on the threshold-based retracker approach [5,19,23] and physical model [4,10,28], provide a range of sea ice freeboard and thickness estimates—e.g., [20,32]. The impact of surface properties on satellite-derived sea ice retrievals and the analysis of its origin presented in this study may be used for the evaluation and future development of retrieval algorithms.
Author Contributions
All authors (K.K.; S.H.; E.R.) were involved in conceptualization, methodology, software development; K.K. performed data processing (RSF, grant №19-17-00236), carried out formal analysis and wrote the original manuscript draft (State assignment №0763-2020-0005); all authors contributed to the review and editing of the original draft. All authors have read and agreed to the published version of the manuscript.
Funding
This research was funded by the Russian Science Foundation, grant number 19-17-00236 and by the Ministry of Science and Higher Education of Russia, State assignment №0763-2020-0005.
Acknowledgments
Authors would like to thank three anonymous referees for their comments that helped to improve the manuscript.
Conflicts of Interest
The authors declare no conflict of interest.
References
- Laxon, S.; Peacock, N.; Smith, D. High interannual variability of sea ice thickness in the Arctic region. Nature 2003, 425, 947–950. [Google Scholar] [CrossRef]
- Tilling, R.L.; Ridout, A.; Shepherd, A.; Wingham, D.J. Increased Arctic sea ice volume after anomalously low melting in 2013. Nat. Geosci. 2015, 8, 643–646. [Google Scholar] [CrossRef] [Green Version]
- Paul, S.; Hendricks, S.; Ricker, R.; Kern, S.; Rinne, E. Empirical parametrization of Envisat freeboard retrieval of Arctic and Antarctic sea ice based on CryoSat-2: Progress in the ESA Climate Change Initiative. Cryosphere 2018, 12, 2437–2460. [Google Scholar] [CrossRef] [Green Version]
- Kurtz, N.T.; Galin, N.; Studinger, M. An improved CryoSat-2 sea ice freeboard retrieval algorithm through the use of waveform fitting. Cryosphere 2014, 8, 1217–1237. [Google Scholar] [CrossRef] [Green Version]
- Kwok, R.; Cunningham, G.F. Variability of Arctic sea ice thickness and volume from CryoSat-2. Philos. Trans. R. Soc. Math. Phys. Eng. Sci. 2015, 373, 20140157. [Google Scholar] [CrossRef] [PubMed]
- Willatt, R.; Laxon, S.; Giles, K.; Cullen, R.; Haas, C.; Helm, V. Ku-band radar penetration into snow cover on Arctic sea ice using airborne data. Ann. Glaciol. 2011, 52, 197–205. [Google Scholar] [CrossRef] [Green Version]
- Kwok, R. Simulated effects of a snow layer on retrieval of CryoSat-2 sea ice freeboard. Geophys. Res. Lett. 2014, 41, 5014–5020. [Google Scholar] [CrossRef]
- Nandan, V.; Geldsetzer, T.; Yackel, J.; Mahmud, M.; Scharien, R.; Howell, S.; King, J.; Ricker, R.; Else, B. Effect of Snow Salinity on CryoSat-2 Arctic First-Year Sea Ice Freeboard Measurements: Sea Ice Brine-Snow Effect on CryoSat-2. Geophys. Res. Lett. 2017, 44, 10419–10426. [Google Scholar] [CrossRef] [Green Version]
- Armitage, T.W.K.; Davidson, M.W.J. Using the Interferometric Capabilities of the ESA CryoSat-2 Mission to Improve the Accuracy of Sea Ice Freeboard Retrievals. IEEE Trans. Geosci. Remote Sens. 2014, 52, 529–536. [Google Scholar] [CrossRef]
- Landy, J.C.; Petty, A.A.; Tsamados, M.; Stroeve, J.C. Sea Ice Roughness Overlooked as a Key Source of Uncertainty in CryoSat-2 Ice Freeboard Retrievals. J. Geophys. Res. Ocean. 2020, 125, e2019JC015820. [Google Scholar] [CrossRef]
- Warren, S.G.; Rigor, I.G.; Untersteiner, N.; Radionov, V.F.; Bryazgin, N.N.; Aleksandrov, Y.I. Snow Depth on Arctic Sea Ice. J. Clim. 1999, 12, 16. [Google Scholar] [CrossRef]
- Alexandrov, V.; Sandven, S.; Wahlin, J.; Johannessen, O.M. The relation between sea ice thickness and freeboard in the Arctic. Cryosphere 2010, 4, 373–380. [Google Scholar] [CrossRef] [Green Version]
- Krishfield, R.; Proshutinsky, A. BGOS ULS Data Processing Procedure; Woods Hole Oceanographic Institution: Woods Hole, MA, USA, 2006; 14p. [Google Scholar]
- Hansen, E.; Gerland, S.; Granskog, M.A.; Pavlova, O.; Renner, A.H.H.; Haapala, J.; Løyning, T.B.; Tschudi, M. Thinning of Arctic sea ice observed in Fram Strait: 1990–2011: Thinning of Arctic Sea Ice. J. Geophys. Res. Ocean. 2013, 118, 5202–5221. [Google Scholar] [CrossRef] [Green Version]
- Belter, H.J.; Krumpen, T.; Hendricks, S.; Hoelemann, J.; Janout, M.A.; Ricker, R.; Haas, C. Satellite-based sea ice thickness changes in the Laptev Sea from 2002 to 2017: Comparison to mooring observations. Cryosphere 2020, 14, 2189–2203. [Google Scholar] [CrossRef]
- Kurtz, N.T.; Farrell, S.L.; Studinger, M.; Galin, N.; Harbeck, J.P.; Lindsay, R.; Onana, V.D.; Panzer, B.; Sonntag, J.G. Sea ice thickness, freeboard, and snow depth products from Operation IceBridge airborne data. Cryosphere 2013, 7, 1035–1056. [Google Scholar] [CrossRef] [Green Version]
- Kern, S.; Khvorostovsky, K.; Skourup, H. European Space Agency Sea Ice Climate Change Initiative: D4.1 Product Validation and Intercomparison Report (PVIR-SIT)—SICCI-PVIR-SIT; Technical Report; European Space Agency: Paris, France, 2018; 193p. [Google Scholar]
- Laxon, S.W.; Giles, K.A.; Ridout, A.L.; Wingham, D.J.; Willatt, R.; Cullen, R.; Kwok, R.; Schweiger, A.; Zhang, J.; Haas, C.; et al. CryoSat-2 estimates of Arctic sea ice thickness and volume. Geophys. Res. Lett. 2013, 40, 732–737. [Google Scholar] [CrossRef] [Green Version]
- Tilling, R.L.; Ridout, A.; Shepherd, A. Estimating Arctic sea ice thickness and volume using CryoSat-2 radar altimeter data. Adv. Space Res. 2018, 62, 1203–1225. [Google Scholar] [CrossRef]
- Sallila, H.; Farrell, S.L.; McCurry, J.; Rinne, E. Assessment of contemporary satellite sea ice thickness products for Arctic sea ice. Cryosphere 2019, 13, 1187–1213. [Google Scholar] [CrossRef] [Green Version]
- Hendricks, S.; Paul, S.; Rinne, E. ESA Sea Ice Climate Change Initiative (Sea_Ice_cci): Northern Hemisphere Sea Ice Thickness from the Envisat Satellite on a Monthly Grid (L3C), v2.0; Centre for Environmental Data Analysis: Oxfordshire, UK, 2018; Available online: https://catalogue.ceda.ac.uk/uuid/f4c34f4f0f1d4d0da06d771f6972f180 (accessed on 10 July 2020).
- Hendricks, S.; Paul, S.; Rinne, E. ESA Sea Ice Climate Change Initiative (Sea_Ice_cci): Northern Hemisphere Sea Ice Thickness from the CryoSat-2 Satellite on a Monthly Grid (L3C), v2.0; Centre for Environmental Data Analysis: Oxfordshire, UK, 2018; Available online: https://catalogue.ceda.ac.uk/uuid/ff79d140824f42dd92b204b4f1e9e7c2 (accessed on 10 July 2020).
- Ricker, R.; Hendricks, S.; Helm, V.; Skourup, H.; Davidson, M. Sensitivity of CryoSat-2 Arctic sea-ice freeboard and thickness on radar-waveform interpretation. Cryosphere 2014, 8, 1607–1622. [Google Scholar] [CrossRef] [Green Version]
- Kurtz, N.T.; Farrell, S.L. Large-scale surveys of snow depth on Arctic sea ice from Operation IceBridge. Geophys. Res. Lett. 2011, 38. [Google Scholar] [CrossRef]
- Paul, S.; Hendricks, S.; Rinne, E. European Space Agency Sea Ice Climate Change Initiative: D2.1 Sea Ice Thickness Algorithm Theoretical Basis Document (ATBD)—SICCI-P2-ATBD(SIT); Technical Report; European Space Agency: Paris, France, 2017; 50p. [Google Scholar]
- Ricker, R.; Hendricks, S.; Perovich, D.K.; Helm, V.; Gerdes, R. Impact of snow accumulation on CryoSat-2 range retrievals over Arctic sea ice: An observational approach with buoy data. Geophys. Res. Lett. 2015, 42, 4447–4455. [Google Scholar] [CrossRef] [Green Version]
- Wingham, D.J.; Francis, C.R.; Baker, S.; Bouzinac, C.; Brockley, D.; Cullen, R.; de Chateau-Thierry, P.; Laxon, S.W.; Mallow, U.; Mavrocordatos, C.; et al. CryoSat: A mission to determine the fluctuations in Earth’s land and marine ice fields. Adv. Space Res. 2006, 37, 841–871. [Google Scholar] [CrossRef]
- Laforge, A.; Fleury, S.; Dinardo, S.; Garnier, F.; Remy, F.; Benveniste, J.; Bouffard, J.; Verley, J. Toward improved sea ice freeboard observation with SAR altimetry using the physical retracker SAMOSA+. Adv. Space Res. 2020, in press. [Google Scholar] [CrossRef]
- Mallett, R.D.C.; Lawrence, I.R.; Stroeve, J.C.; Landy, J.C.; Tsamados, M. Brief communication: Conventional assumptions involving the speed of radar waves in snow introduce systematic underestimates to sea ice thickness and seasonal growth rate estimates. Cryosphere 2020, 14, 251–260. [Google Scholar] [CrossRef] [Green Version]
- Zygmuntowska, M.; Rampal, P.; Ivanova, N.; Smedsrud, L.H. Uncertainties in Arctic sea ice thickness and volume: New estimates and implications for trends. Cryosphere 2014, 8, 705–720. [Google Scholar] [CrossRef] [Green Version]
- Kern, S.; Khvorostovsky, K.; Skourup, H.; Rinne, E.; Parsakhoo, Z.S.; Djepa, V.; Wadhams, P.; Sandven, S. The impact of snow depth, snow density and ice density on sea ice thickness retrieval from satellite radar altimetry: Results from the ESA-CCI Sea Ice ECV Project Round Robin Exercise. Cryosphere 2015, 9, 37–52. [Google Scholar] [CrossRef] [Green Version]
- Yi, D.; Kurtz, N.; Harbeck, J.; Kwok, R.; Hendricks, S.; Ricker, R. Comparing Coincident Elevation and Freeboard From IceBridge and Five Different CryoSat-2 Retrackers. IEEE Trans. Geosci. Remote Sens. 2019, 57, 1219–1229. [Google Scholar] [CrossRef]
Figure 1.
Location of the A, B, C and D moorings with the upward looking sonar measurements in the Beaufort Sea.
Figure 1.
Location of the A, B, C and D moorings with the upward looking sonar measurements in the Beaufort Sea.

Figure 2.
Time series of (a,b) sea ice draft retrieved from Envisat and Cryosat-2 satellite radar altimeter data and ULS measurements, and (c,d) their differences and the differences between sea ice freeboard obtained from Cryosat-2 by different retrackers over the ULS mooring locations (in meters). Time series are (a,c) related to the mooring A and are (b,d) calculated as a mean of sea ice draft monthly values related to all moorings where ULS data are available during specific winter season.
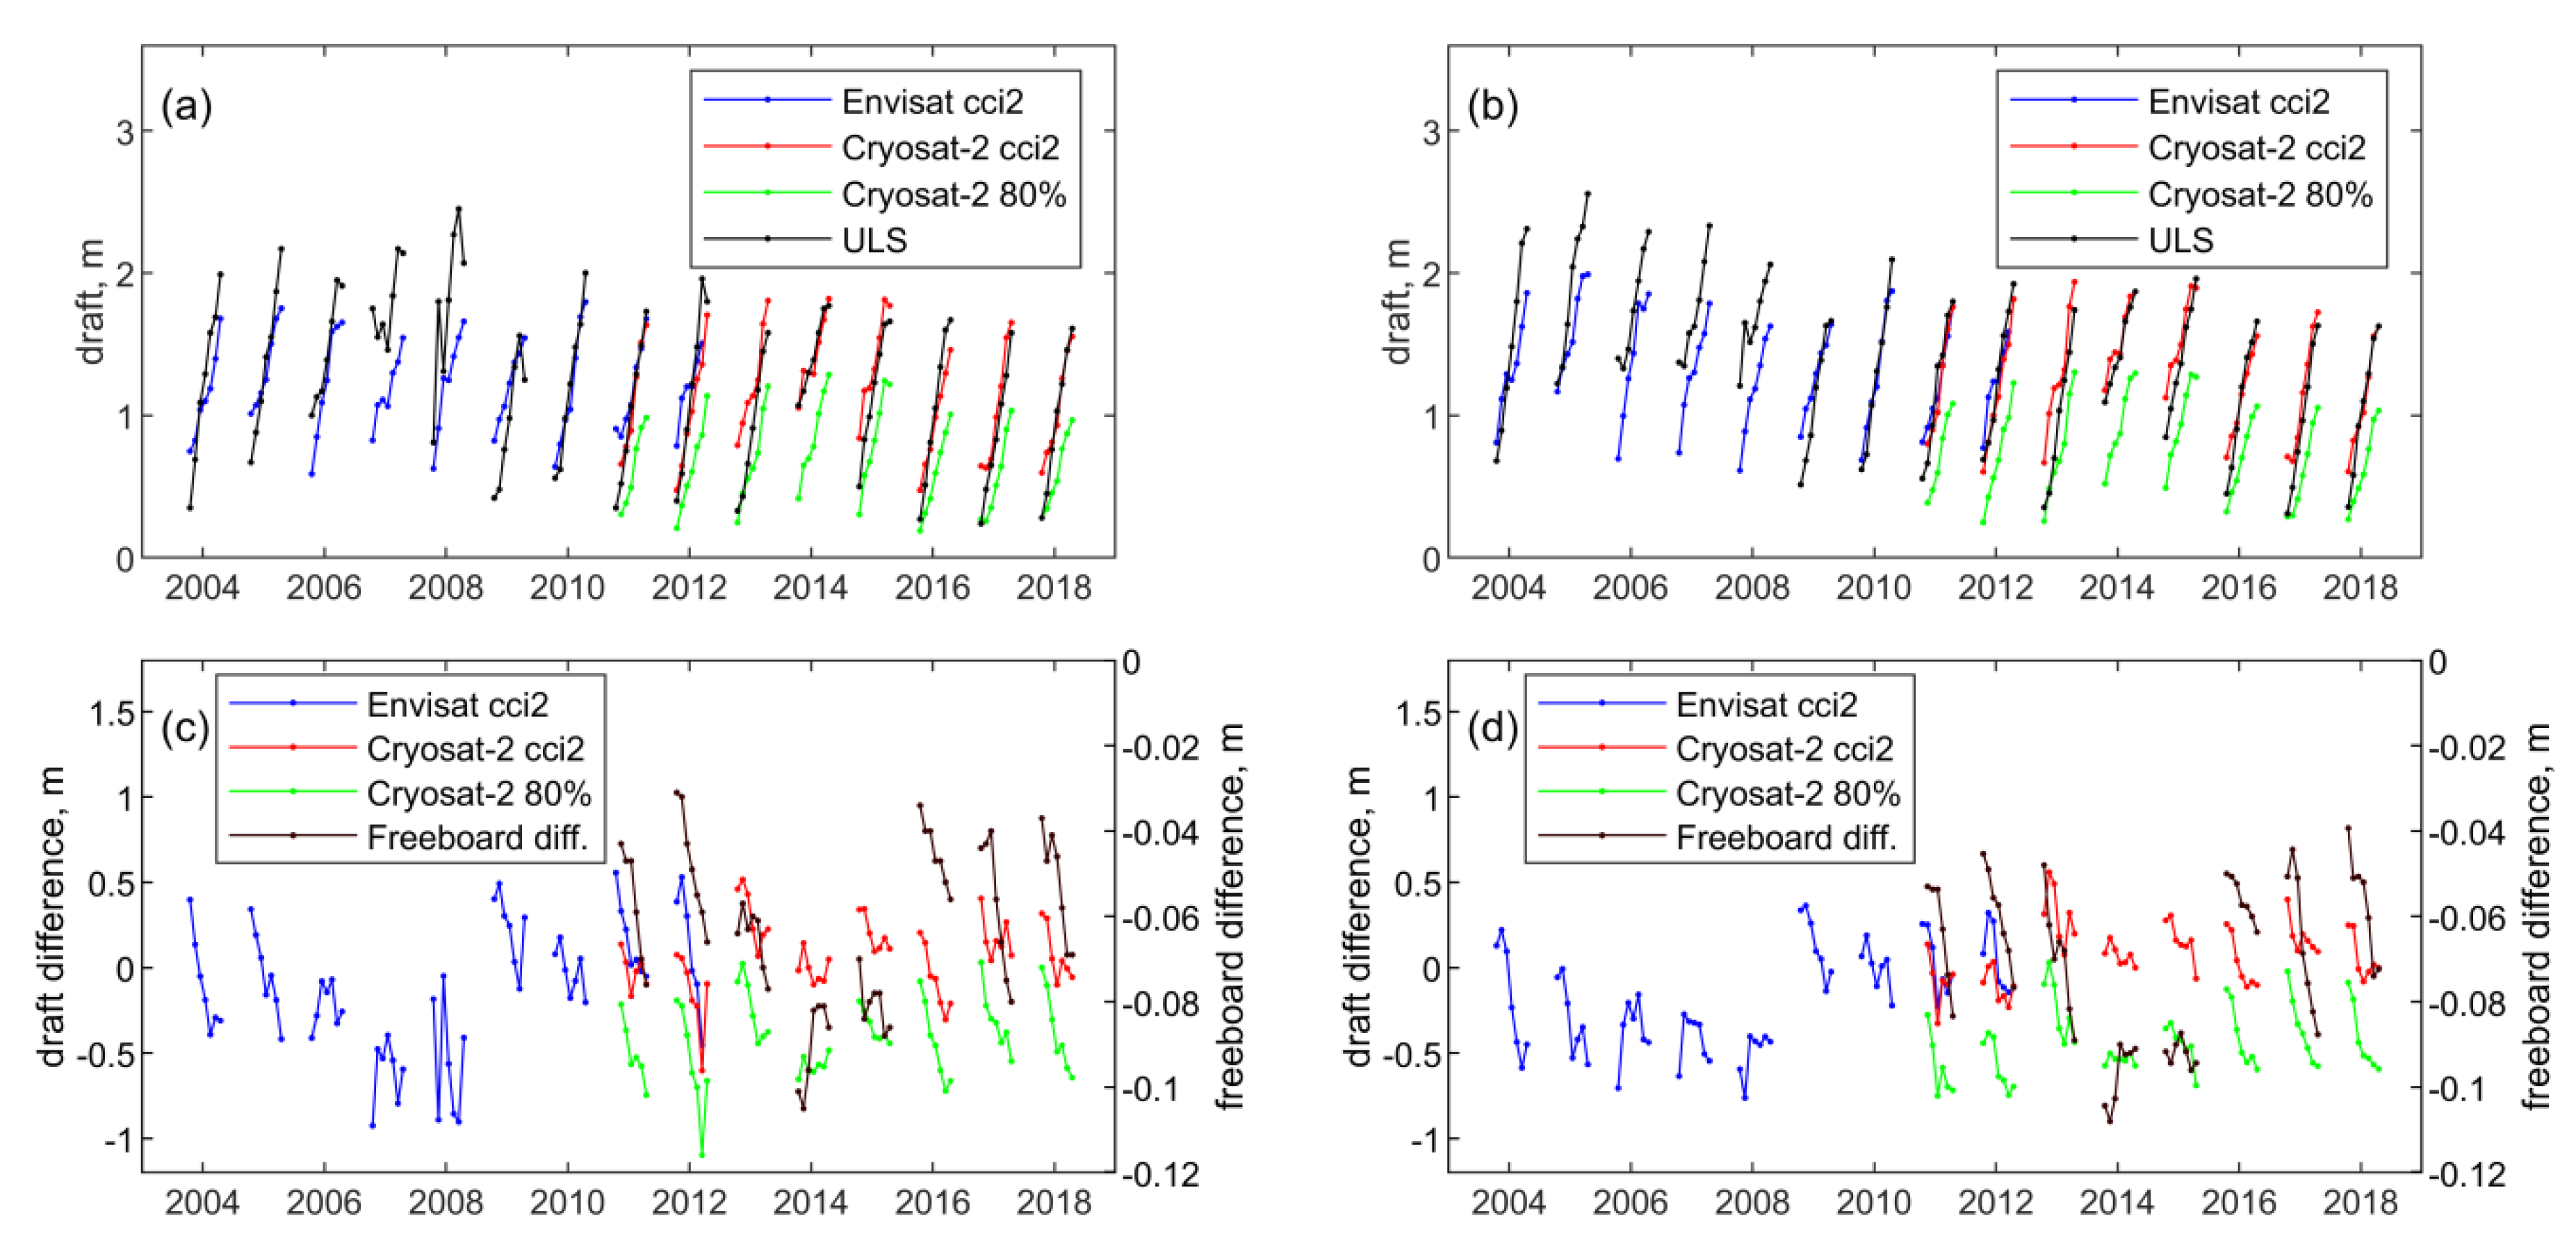
Figure 3.
Time series of (a–d) leading edge width (in range bins) and (e–h) pulse peakiness (unitless) derived from (a,b,e,f) Envisat and (c,d,g,h) Cryosat-2 data over the ULS mooring locations. Time series are (a,c,e,g) related to the mooring A and (b,d,f,h) calculated as a mean of sea ice draft monthly values related to all moorings, where ULS data are available during specific winter seasons.

Figure 4.
Change rate and mean of the Envisat LeW (in range bins·month−1 and in range bins) and PP (in month−1 and unitless), and multiyear ice MYI fraction (in month−1 and unitless) for 2005–2006 and 2008–2009 winter seasons mapped on 25 × 25 km2 EASE grids. Black dots depict location of the moorings.

Figure 5.
Change rate and mean of the Cryosat-2 LeW (in range bins·month−1 and in range bins), PP (in month−1 and unitless) and the difference between sea ice freeboards retrieved using 50% and 80% retracker thresholds (in meters·month−1 and in meters), and MYI fraction (in month−1 and unitless) for 2011–2012 and 2013–2014 seasons mapped on 25 × 25 km2 EASE grids. Black dots depict location of the moorings.

Figure 6.
Time series of sea surface temperature (in Kelvin) and MYI fraction over the ULS mooring locations. Time series are (a) related to the mooring A and (b) calculated as a mean of sea ice draft monthly values related to all moorings where ULS data are available during specific winter season.
Figure 6.
Time series of sea surface temperature (in Kelvin) and MYI fraction over the ULS mooring locations. Time series are (a) related to the mooring A and (b) calculated as a mean of sea ice draft monthly values related to all moorings where ULS data are available during specific winter season.

Figure 7.
Sea surface temperature in July and August 2005, 2008, 2011 and 2013 from ERA-5 reanalysis dataset. Black dots depict location of the moorings.
Figure 7.
Sea surface temperature in July and August 2005, 2008, 2011 and 2013 from ERA-5 reanalysis dataset. Black dots depict location of the moorings.


Table 1.
Availability of the ULS data for BGEP moorings in different winter seasons.
| A | B | C | D | |
|---|---|---|---|---|
| 2003–2004 | ● | ● | ● | |
| 2004–2005 | ● | ● | ● | |
| 2005–2006 | ● | ● | ||
| 2006–2007 | ● | ● | ● | ● |
| 2007–2008 | ● | ● | ● | ● |
| 2008–2009 | ● | ● | ● | |
| 2009–2010 | ● | ● | ||
| 2010–2011 | ● | ● | ● | |
| 2011–2012 | ● | ● | ● | |
| 2012–2013 | ● | ● | ● | |
| 2013–2014 | ● | ● | ● | |
| 2014–2015 | ● | ● | ● | |
| 2015–2016 | ● | ● | ● | |
| 2016–2017 | ● | ● | ● | |
| 2017–2018 | ● | ● | ● |
Table 2.
Correlation coefficients between means (October-to-April and October-to-November) and October-to-November change rates for the LeW and PP radar altimeter waveform parameters derived from Envisat and Cryosat-2 data, for sea ice draft differences (drEnv–druls, drCS2_50–druls, drCS2_80–druls) and sea ice freeboard difference fbCS2_80–fbCS2_50 estimated using data from the mooring A and data from all mooring sites. Correlation coefficients that are significant at the 95% confidence level are denoted in bold.
| October–April Mean × October–April Change Rate | October–November Mean × October–April Change Rate | |||
|---|---|---|---|---|
| Mooring A | All Moorings | Mooring A | All Moorings | |
| LeWEnv | −0.63 | −0.05 | −0.83 | −0.32 |
| PPEnv | −0.72 | −0.81 | −0.92 | −0.96 |
| drEnv–druls | −0.59 | −0.62 | −0.76 | −0.86 |
| LeWCS2 | −0.94 | −0.87 | −0.97 | −0.94 |
| PPCS2 | −0.94 | −0.96 | −0.98 | −0.99 |
| fbCS2_80–fbCS2_50 | −0.81 | −0.78 | −0.91 | −0.89 |
| drCS2_50–druls | 0.22 | −0.33 | −0.16 | −0.56 |
| drCS2_80–druls | −0.12 | −0.39 | −0.76 | −0.82 |
Table 3.
Correlation coefficients between differences of satellite-derived and ULS-measured sea ice drafts (drEnv–druls, drCS2_50–druls, drCS2_80–druls) and the waveform parameters (LeW and PP) and sea ice freeboard differences fbCS2_80–fbCS2_50 for October-to-April means, October-to-November means and October-to-April change rates, estimated using data from the mooring A and data from all mooring sites. Correlation coefficients that are significant are at the 95% confidence level are denoted in bold.
| October–April Mean | October–November Mean | October–April Change Rate | ||||
|---|---|---|---|---|---|---|
| Mooring A | All Moorings | Mooring A | All Moorings | Mooring A | All Moorings | |
| drEnv–druls × | ||||||
| LeWEnv | −0.49 | −0.71 | −0.61 | −0.40 | −0.63 | 0.26 |
| PPEnv | 0.51 | 0.68 | 0.60 | 0.35 | 0.56 | −0.24 |
| drCS2_50–druls × | ||||||
| LeWCS2 | 0.53 | 0.47 | 0.23 | 0.15 | −0.69 | −0.24 |
| PPCS2 | −0.61 | −0.52 | −0.37 | −0.25 | 0.80 | 0.34 |
| fbCS2_80–fbCS2_50 | −0.36 | −0.33 | −0.02 | 0.02 | 0.33 | 0.05 |
| drCS2_80–druls × | ||||||
| LeWCS2 | 0.13 | 0.00 | −0.56 | −0.55 | −0.98 | −0.93 |
| PPCS2 | −0.22 | −0.06 | 0.41 | 0.44 | 0.89 | 0.81 |
| fbCS2_80–fbCS2_50 | 0.05 | −0.15 | 0.74 | 0.69 | 0.86 | 0.88 |
Table 4.
Correlation coefficients between differences of satellite-derived and ULS-measured sea ice drafts (drEnv–druls, drCS2_50–druls and drCS2_80–druls) as well as combined time series derived from the differences between drEnv–druls and drCS2_50–druls, and the MYI fraction and SST in July and August for October-to-April means, October-to-November means and October-to-April change rates, estimated using data from the mooring A and data from all mooring sites. Correlation coefficients presented in columns 1 and 2 are derived from original time series and from time series formed using the differences between adjacent points of the original time series. Correlation coefficients significant at the 95% confidence level are denoted in bold.
| Parameter | October–April Mean | October–November Mean | October–April Change Rate | |||||||||
|---|---|---|---|---|---|---|---|---|---|---|---|---|
| Mooring A | All Moorings | Mooring A | All Moorings | Mooring A | All Moorings | |||||||
| 1 | 2 | 1 | 2 | 1 | 2 | 1 | 2 | 1 | 2 | 1 | 2 | |
| drEnv–druls × | ||||||||||||
| MYI fraction | −0.33 | −0.17 | −0.55 | −0.55 | −0.51 | −0.36 | −0.69 | −0.71 | −0.10 | −0.38 | −0.69 | −0.16 |
| SST July | 0.44 | 0.85 | 0.50 | 0.97 | 0.33 | 0.79 | 0.40 | 0.91 | 0.04 | −0.02 | −0.20 | −0.75 |
| SST August | 0.60 | 0.88 | 0.69 | 0.95 | 0.55 | 0.87 | 0.58 | 0.91 | −0.24 | −0.23 | −0.34 | −0.79 |
| drCS2_50–druls × | ||||||||||||
| MYI fraction | 0.07 | −0.18 | 0.06 | −0.35 | −0.35 | −0.60 | −0.27 | −0.59 | −0.05 | −0.09 | −0.48 | −0.64 |
| SST July | 0.47 | 0.51 | 0.73 | 0.77 | 0.33 | 0.29 | 0.66 | 0.65 | 0.30 | 0.64 | −0.13 | 0.29 |
| SST August | 0.32 | 0.43 | 0.53 | 0.59 | 0.41 | 0.37 | 0.56 | 0.53 | −0.24 | 0.20 | −0.30 | 0.15 |
| drCS2_80–druls × | ||||||||||||
| MYI fraction | −0.29 | −0.46 | −0.34 | −0.67 | −0.92 | −0.94 | −0.84 | −0.89 | 0.33 | −0.08 | −0.27 | −0.69 |
| SST July | 0.54 | 0.37 | 0.79 | 0.57 | 0.37 | 0.10 | 0.72 | 0.47 | −0.05 | 0.32 | −0.44 | −0.18 |
| SST August | 0.57 | 0.38 | 0.80 | 0.55 | 0.74 | 0.25 | 0.85 | 0.48 | −0.54 | 0.06 | −0.63 | −0.16 |
| Combined × | ||||||||||||
| MYI fraction | −0.15 | −0.17 | −0.35 | −0.48 | −0.40 | −0.44 | −0.53 | −0.67 | −0.13 | −0.23 | −0.59 | −0.20 |
| SST July | 0.45 | 0.77 | 0.54 | 0.90 | 0.35 | 0.69 | 0.46 | 0.82 | 0.06 | 0.14 | −0.18 | −0.51 |
| SST August | 0.54 | 0.78 | 0.66 | 0.80 | 0.56 | 0.81 | 0.62 | 0.81 | −0.28 | −0.14 | −0.29 | −0.61 |
© 2020 by the authors. Licensee MDPI, Basel, Switzerland. This article is an open access article distributed under the terms and conditions of the Creative Commons Attribution (CC BY) license (http://creativecommons.org/licenses/by/4.0/).
Share and Cite
MDPI and ACS Style
Khvorostovsky, K.; Hendricks, S.; Rinne, E. Surface Properties Linked to Retrieval Uncertainty of Satellite Sea-Ice Thickness with Upward-Looking Sonar Measurements. Remote Sens. 2020, 12, 3094. https://doi.org/10.3390/rs12183094
AMA Style
Khvorostovsky K, Hendricks S, Rinne E. Surface Properties Linked to Retrieval Uncertainty of Satellite Sea-Ice Thickness with Upward-Looking Sonar Measurements. Remote Sensing. 2020; 12(18):3094. https://doi.org/10.3390/rs12183094
Chicago/Turabian StyleKhvorostovsky, Kirill, Stefan Hendricks, and Eero Rinne. 2020. "Surface Properties Linked to Retrieval Uncertainty of Satellite Sea-Ice Thickness with Upward-Looking Sonar Measurements" Remote Sensing 12, no. 18: 3094. https://doi.org/10.3390/rs12183094
Note that from the first issue of 2016, this journal uses article numbers instead of page numbers. See further details here.