Nation-Scale Mapping of Coastal Aquaculture Ponds with Sentinel-1 SAR Data Using Google Earth Engine
by
Zhe Sun
1,2, 
Juhua Luo
1,*,
Jingzhicheng Yang
1,2,
Qiuyan Yu
3,
Li Zhang
4,
Kun Xue
1 and
Lirong Lu
1,2 1
Key Laboratory of Watershed Geographic Sciences, Nanjing Institute of Geography and Limnology, Chinese Academy of Sciences, Nanjing 210008, China
2
University of Chinese Academy of Sciences, Beijing 100049, China
3
Plant and Environmental Sciences, New Mexico State University, Skeen Hall Room N127 Box 30003 MSC 3Q, Las Cruces, NM 88003, USA
4
Key Laboratory of Digital Earth Sciences, Aerospace Information Research Institute, Chinese Academy of Sciences, Beijing 100194, China
*
Author to whom correspondence should be addressed.
Remote Sens. 2020, 12(18), 3086; https://doi.org/10.3390/rs12183086
Submission received: 15 July 2020
/
Revised: 9 September 2020
/
Accepted: 16 September 2020
/
Published: 21 September 2020
(This article belongs to the Special Issue Remote Sensing for Fisheries and Aquaculture)
Abstract
:Global rapid expansion of the coastal aquaculture industry has made great contributions to enhance food security, but has also caused a series of ecological and environmental issues. Sustainable management of coastal areas requires the explicit and efficient mapping of the spatial distribution of aquaculture ponds. In this study, a Google Earth Engine (GEE) application was developed for mapping coastal aquaculture ponds at a national scale with a novel classification scheme using Sentinel-1 time series data. Relevant indices used in the classification mainly include the water index, texture, and geometric metrics derived from radar backscatter, which were then used to segment and classify aquaculture ponds. Using this approach, we classified aquaculture ponds for the full extent of the coastal area in Vietnam with an overall accuracy of 90.16% (based on independent sample evaluation). The approach, enabling wall-to-wall mapping and area estimation, is essential to the efficient monitoring and management of aquaculture ponds. The classification results showed that aquaculture ponds are widely distributed in Vietnam’s coastal area and are concentrated in the Mekong River Delta and Red River delta (85.14% of the total area), which are facing the increasing collective risk of climate change (e.g., sea level rise and salinity intrusion). Further investigation of the classification results also provides significant insights into the stability and deliverability of the approach. The water index derived from annual median radar backscatter intensity was determined to be efficient at mapping water bodies, likely due to its strong response to water bodies regardless of weather. The geometric metrics considering the spatial variation of radar backscatter patterns were effective at distinguishing aquaculture ponds from other water bodies. The primary use of GEE in this approach makes it replicable and transferable by other users. Our approach lays a solid foundation for intelligent monitoring and management of coastal ecosystems.
1. Introduction
Aquaculture is an important source of food, nutrition, income, and livelihood for hundreds of millions of people around the world [1,2]. Driven by the increasing human population, the need to improve social-economic benefits and the escalating protein demands, aquaculture has been one of the fastest-growing food production sectors in the world over the past decades [3,4,5]. While making significant contributions to global food security and social-economic development, expansion of aquaculture inevitably leads to a series of environmental problems such as natural habitat destruction [6], ecosystem degradation [7,8], water eutrophication [9,10,11,12], and landscape fragmentation [5,13]. Although other food production sectors (e.g., agriculture, rangeland and forests) have been extensively studied as a major part of global food systems, the journey with aquaculture is only now starting. As experience with aquaculture grows worldwide, sustainable management of aquaculture is required to incorporate accurate monitoring of aquaculture [5,14]. The first and also fundamental question is where the aquaculture ponds are and how much area has been used for aquaculture. Thus, an accurate, quantitative, and spatially explicit assessment of the distribution of aquaculture ponds is crucial to local, regional and global efforts aimed at improving the sustainability of the aquaculture industry, reducing food insecurity and enhancing ecosystem resilience.
Remote sensing has the ability of repetitive observation and large-scale spatial coverage, which could meet the requirements of accurate and rapid monitoring of aquaculture ponds, and is suitable for mapping the spatial distribution of aquaculture ponds at a large scale [15]. Optical sensors have been widely exploited to map aquaculture ponds at multiple scales such as Landsat TM/ETM+/OLI, ASTER, Rapid-eye, QuickBird, and WorldView-2 [13,15,16,17,18,19,20,21,22,23,24,25,26,27,28]. Optical satellites have advantages of long time sequences and can be used for long-time dynamic monitoring. Ren et al. [21] explored the long-term changes of aquaculture areas in the Yellow River Delta during the past 30 years using Landsat MSS/TM/OLI. However, the implementation of optical images is limited for areas with frequent cloud cover such as Southeast Asian areas because optical bands cannot penetrate cloud [5,29,30]. In addition, aquaculture ponds can be challenging to identify from coarse-resolution images because of their relatively small size. Nevertheless, high-resolution images providing enough spatial information are generally lower in temporal resolution and are very expensive, which greatly impedes their application in aquaculture pond detection at a large scale across time [31]. In summary, reliable retrieval of aquaculture ponds for a large area with remote sensing techniques requires data with frequent time series, high resolution, and ability to penetrate cloud cover.
Compared with optical sensors, radar imagery such as satellite synthetic aperture radar (SAR) systems from sensors operating in longer wavelengths has the capability of penetrating cloud and alleviating the influence of cloud on satellite images [29]. Sentinel-1 satellites, providing open and free SAR images worldwide at high temporal and spatial resolution [32], have the potential to accurately map aquaculture ponds at a large scale. SAR images can distinguish water bodies based on the return strengths of radar waves because SAR backscatters from smooth water surfaces are very low/weak. At present, Sentinel-1 SAR images have been widely used in water-related applications such as flood mapping [33,34,35], water change detection [32,36,37], and soil moisture monitoring [38,39]. Aquaculture ponds are distinct rectangular shallow water enclosed by dikes or levees and can be detected with radar imagery based on the high contrast between the smooth water surface (low radar backscatters) and the rougher non-water surface (high radar backscatters). Some researchers have used radar images to map aquaculture ponds in tropical areas [29,40]. However, these methods did not pay enough attention to a series of problems, namely seasonal water bodies, hill shades, discontinuous streams, and isolated ponds, which may cause the failure of large-scale applications. Currently, the detection of aquaculture ponds depends largely on single images and ignores the distinct seasonal characteristics, which may confuse aquaculture ponds with rice fields or salt ponds [41,42]. Additionally, rivers could be blocked and form discontinuous streams, which can be easily mistaken as aquaculture ponds because of its geometric features. Furthermore, most existing studies may fail to distinguish aquaculture ponds with farmland reservoirs or isolated ponds due to their similar spectral and geometrical features [40]. In short, the detection of aquaculture ponds with SAR images still lacks a method for efficient mapping at a large scale.
In this context, our main objective was to develop an approach for mapping nation-scale coastal aquaculture ponds. Our approach leverages Sentinel-1 SAR data to extract topographical, geometric, and texture characteristics of aquaculture ponds, and eventually retrieve their distribution and spatial variability in the coastal area of Vietnam. Furthermore, we interpret our results to answer the following questions: (1) What are the challenges in the accurate detection of aquaculture ponds at a national scale? (2) How can the presented method settle the challenges to facilitate the monitoring of aquaculture ponds? (3) How would the mapping of aquaculture ponds contribute to the monitoring and management of aquaculture in Vietnam by providing the spatial distribution of coastal aquaculture ponds? Answers to these questions should indicate how our approach contributes a useful tool for the reliable mapping of aquaculture ponds using remote sensing images, its transferability to other regions, and its role toward the sustainable management of aquaculture.
2. Materials and Methods
2.1. Study Area
According to the Food and Agriculture Organization (FAO) (Rome, Italy), Vietnam is a major aquaculture country in the world and its total aquaculture production ranked fourth in the world in 2014 [2]. The aquaculture production of Vietnam is now larger than capture production [43]. Due to the superior geographical conditions, Vietnam has hundreds of species of fish, shrimp, crab, and other economic aquatic products. At present, it has developed a variety of aquaculture modes mainly based on pond culture, supplemented by fish culture in rice fields, animal husbandry, and mangrove aquaculture. The aquaculture in the coastal zone of Vietnam is predicted to increase as a result of climate change, and up to 70% of the Mekong Delta’s agricultural land could be subject to saline intrusion this century, which would switch the current rice fields into shrimp farms [44,45]. While aquaculture ponds are playing a critical role in feeding Vietnam’s growing population and making billions of dollars through exporting fish and shrimps, the expansion of aquaculture ponds has diminished Vietnam’s mangrove forests and caused freshwater and seawater pollution [10,46,47].
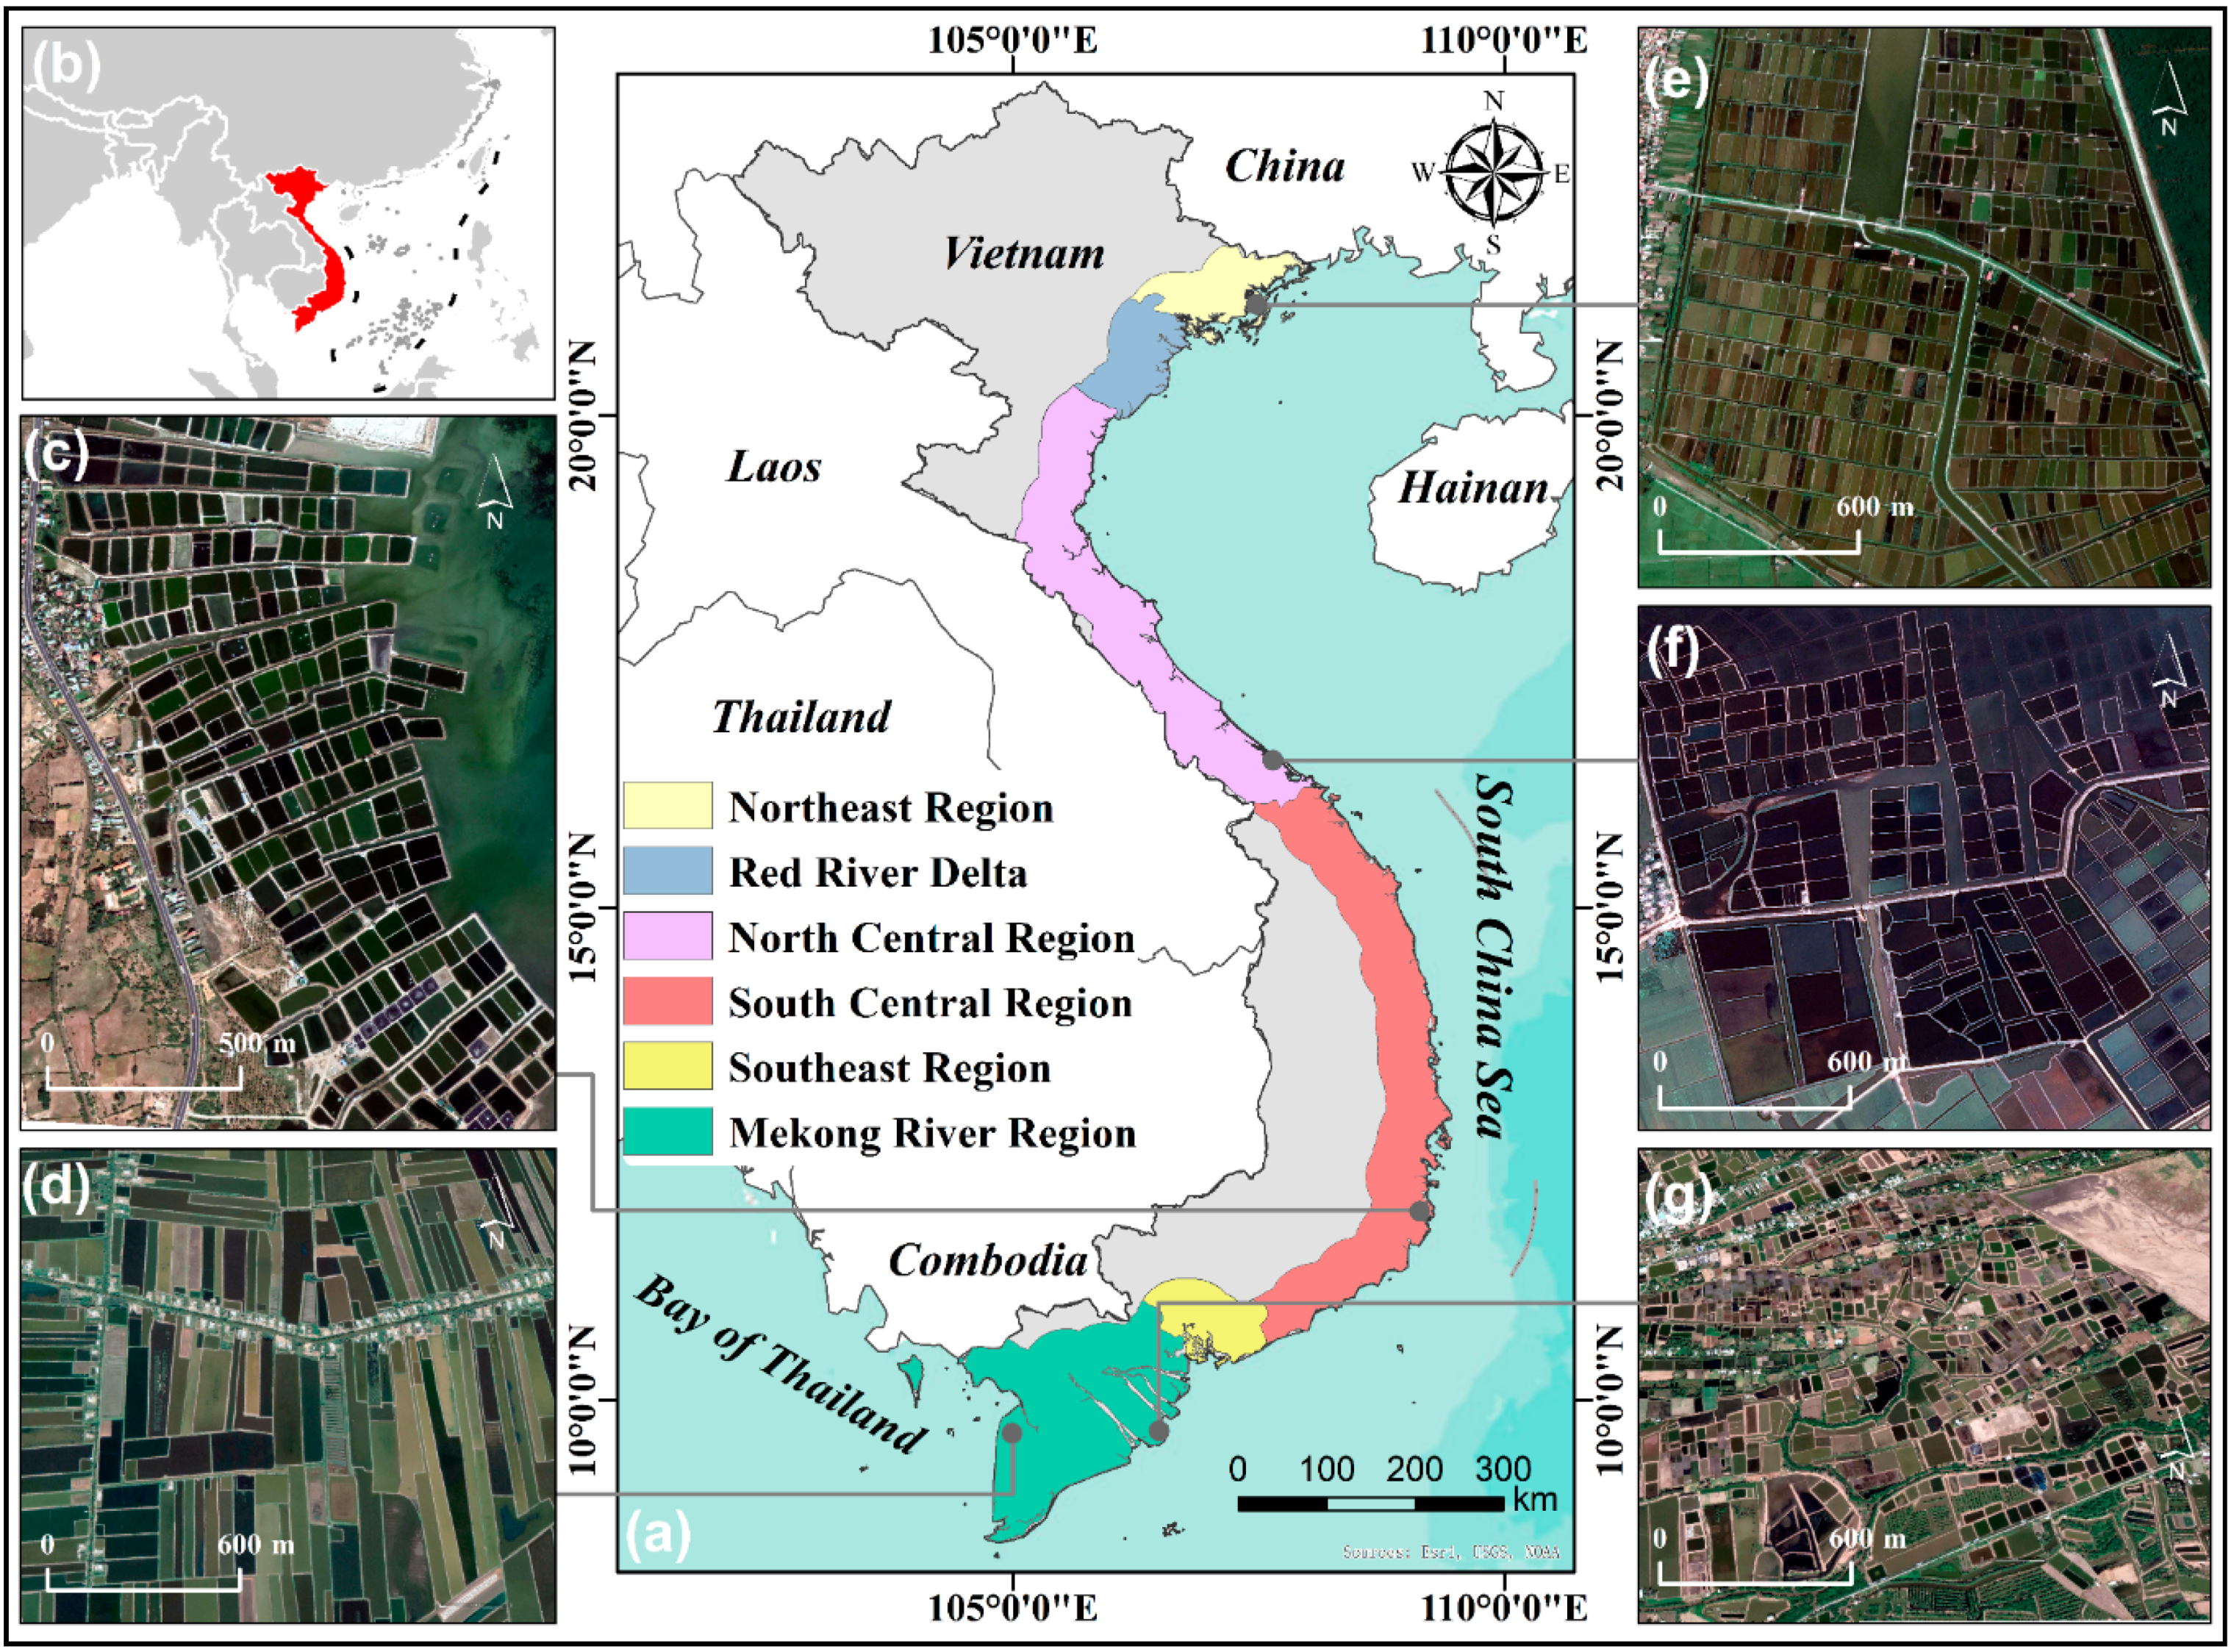
Since aquaculture ponds are expanding at an unexpected rate along the coastline and are escalating the challenges of ecosystem conservation, we focused on the aquaculture ponds within 50 km offshore from the coastline [13]. Thus, the study area was a 50-km inland buffer zone from Vietnam’s coastline (8°10′~21°57′N, 102°09′~109°30′E) and covers a total area of approximately 141,326.53 km2 (about 43% of Vietnam’s total area; Figure 1). The study area is dominated by lowland and water resources are abundant, which have created countless lagoons, estuaries, and deltas, making it ideal for developing aquaculture ponds. Based on the location, the study area was divided into six sub-regions: Northeast Region (NR), Red River Delta (RRD), Southeast Region (SR), North Central Region (NCR), South Central Region (SCR), and the Mekong River Delta (MRD).
2.2. Software Tools
The method described in the presented paper was designed and implemented using Google Earth Engine (GEE). The GEE, a cloud-based geospatial processing computing platform, allows for geospatial data retrieval, processing, and analysis from local to the planetary scale [48]. It can be accessed using either the web-based code editor (Earth Engine Code Editor) or the open source python interface (e.g., Google Colab). GEE has the ability to reduce the technical and infrastructural requirements for geospatial analysis of large areas and long-time series, which makes it possible to rapidly and accurately process various amounts of satellite data. We used GEE for remote sensing data retrieval, preprocessing, classification, accuracy assessment, and to derive a map of aquaculture ponds.
2.3. Methods
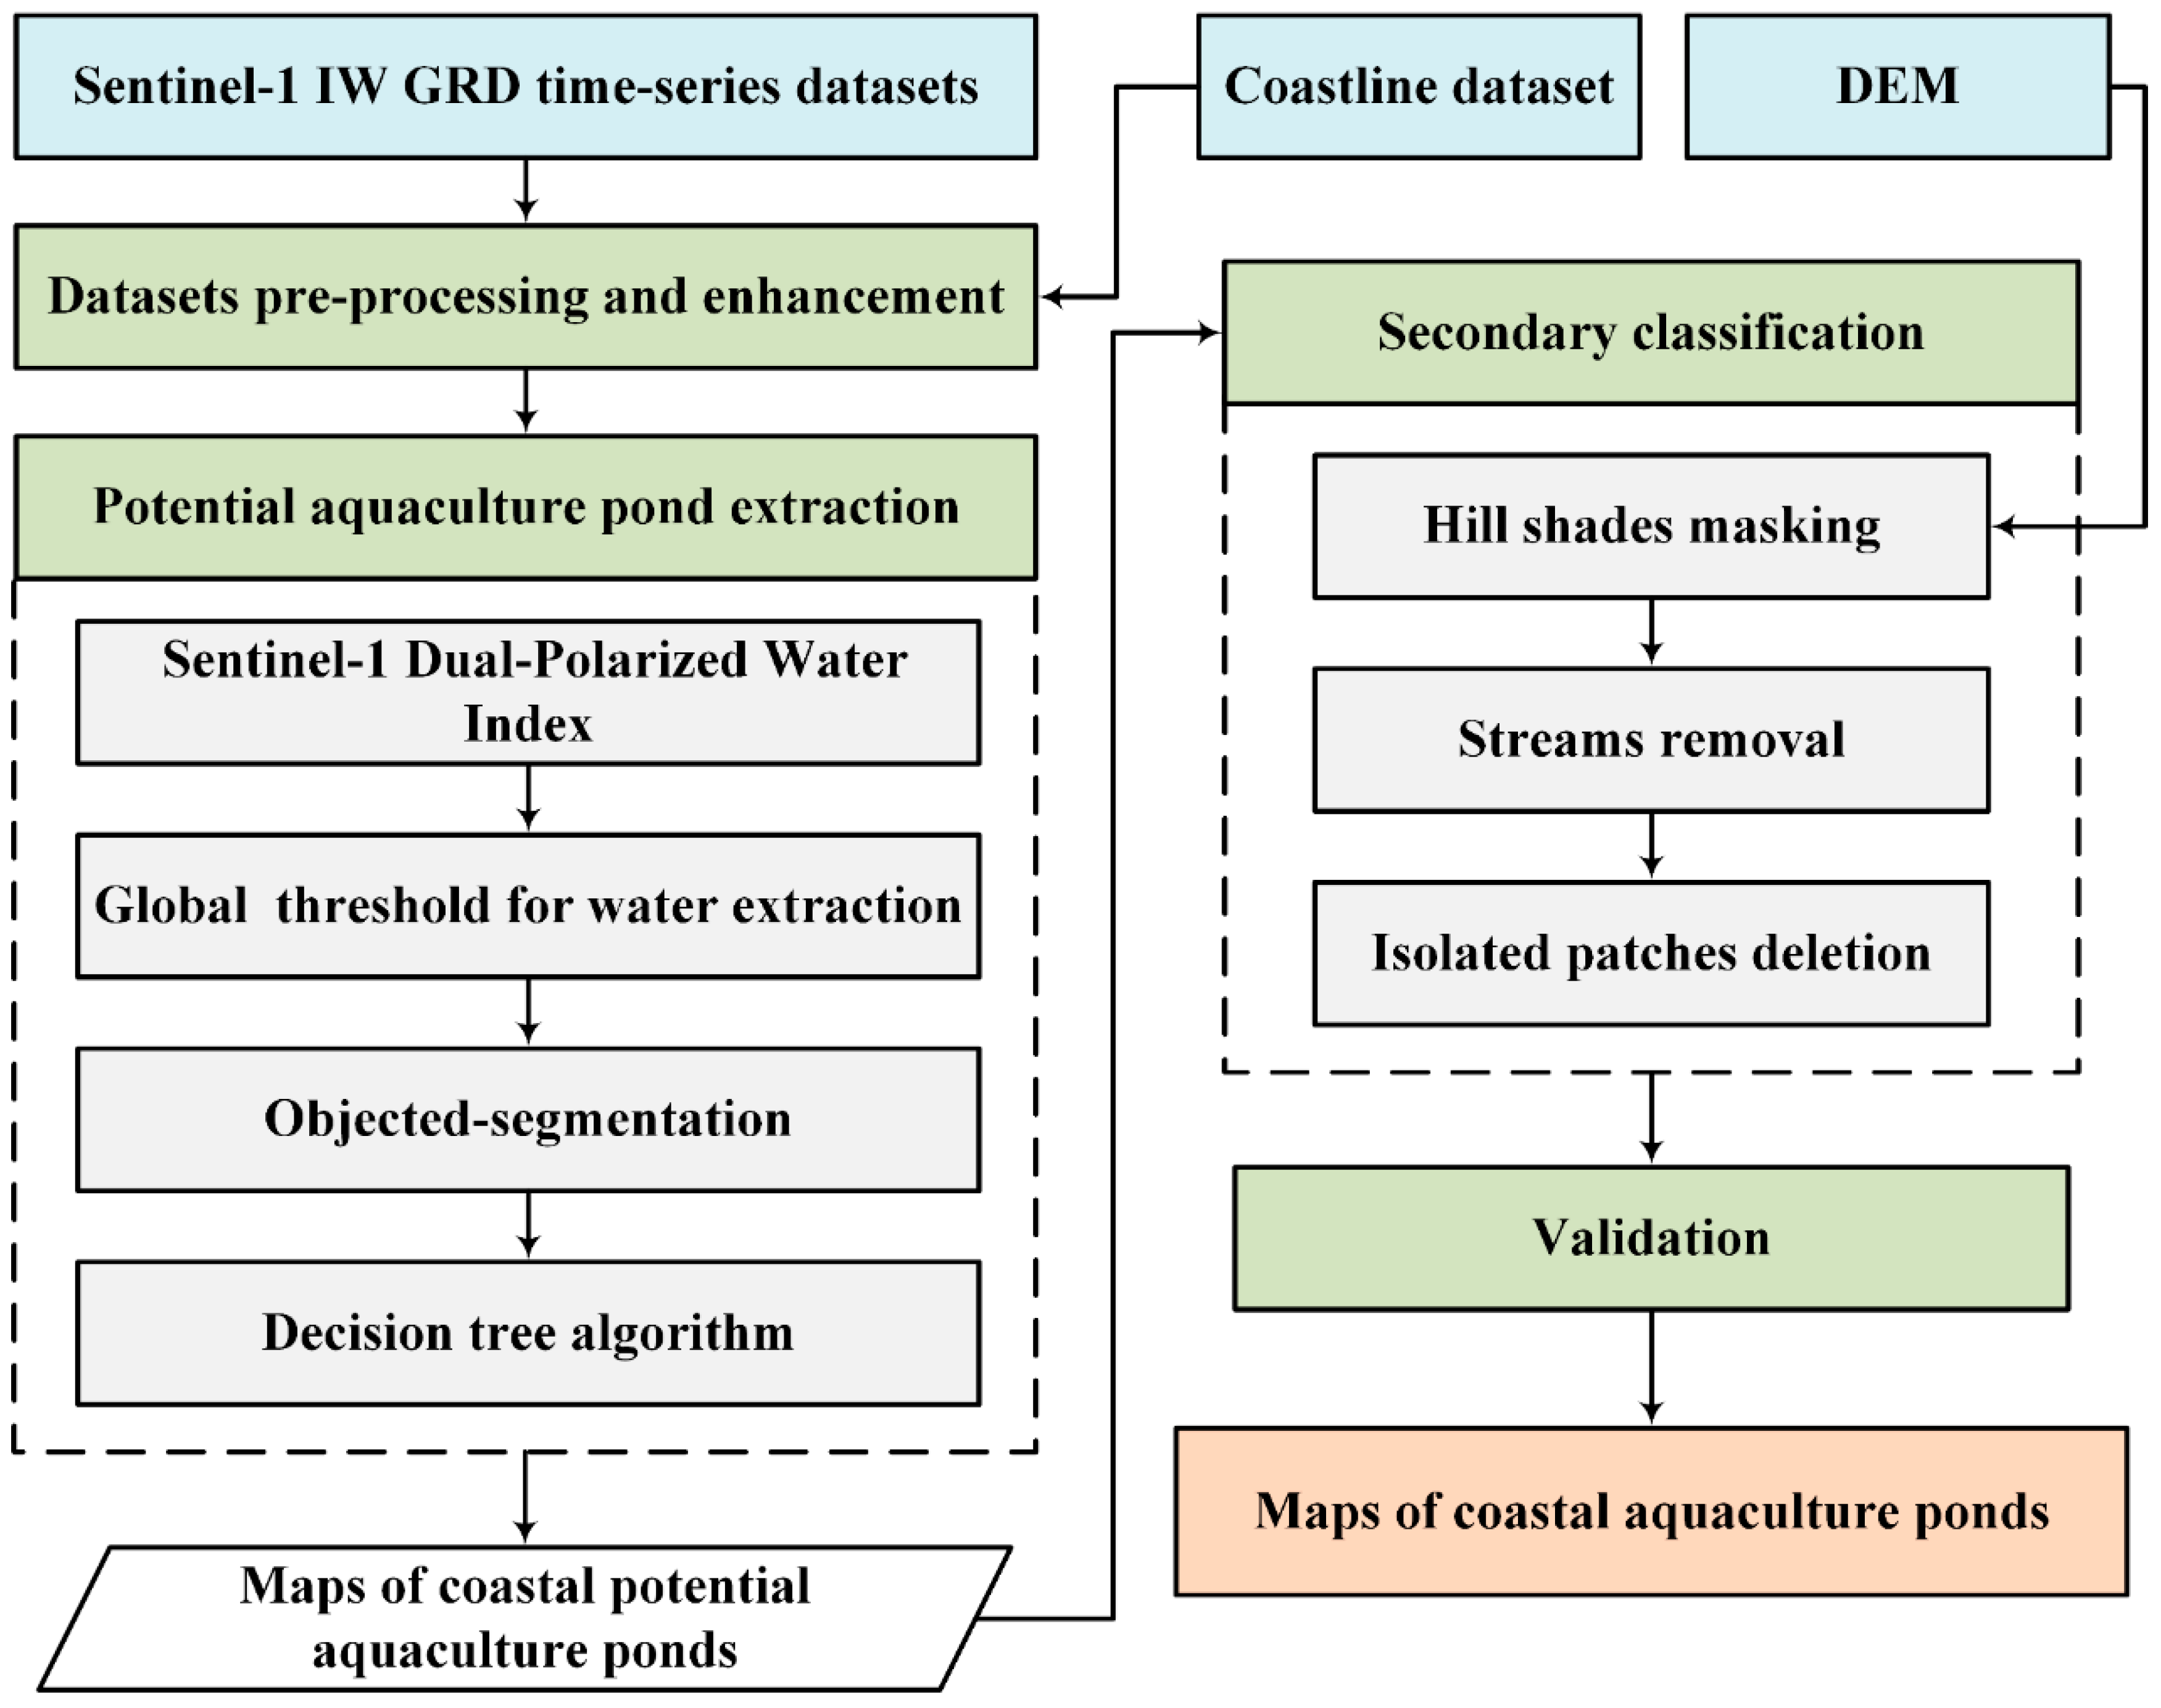
Figure 2 illustrates the steps in mapping aquaculture ponds using Sentinel-1 SAR images. It comprises four major sections: (1) data preparation, (2) extraction of potential aquaculture ponds, (3) secondary classification, and (4) accuracy assessment.
2.3.1. Data Preparation and Enhancement
Sentinel-1 SAR data
Using the Google Earth Engine code editor, we retrieved all Sentinel-1 data (C-band Synthetic Aperture Radar with a frequency of 5.405 GHz), within 2020 (1 January–30 April), covering the entire study area. Sentinel-1 C-band SAR instruments support operations in single-polarization (VV and HH) and dual-polarization (VV + VH and HH + HV). In our study, we collected a total of 410 dual-polarized (VV + VH) images with the Interferometric Wide Swath and Ground Range Detected (GRD) format. Sentinel-1 data with the GRD format were detected, multi-looked, and projected to ground range using an Earth ellipsoid model, which has a spatial resolution of 5 m by 20 m with a ground sampling distance of 10 m [49]. All the Sentinel-1 images were collected by the GEE platform, which had been preprocessed using the European Space Agency’s (ESA) Sentinel-1 Toolbox including orbit restitution, thermal noise removal, terrain correction, and radiometric calibration [50].
Instead of using the original images, the median images of VV and VH were calculated as a median value composite using the images from January to April, respectively. Compared with the original images, using median images could reduce the impact of speckle noise and enhance the permanent or stable low scatters. In addition, median images were able to differentiate aquaculture ponds from seasonal regulated water areas because the water level in aquaculture ponds was consistent throughout the year.
Training and validation datasets
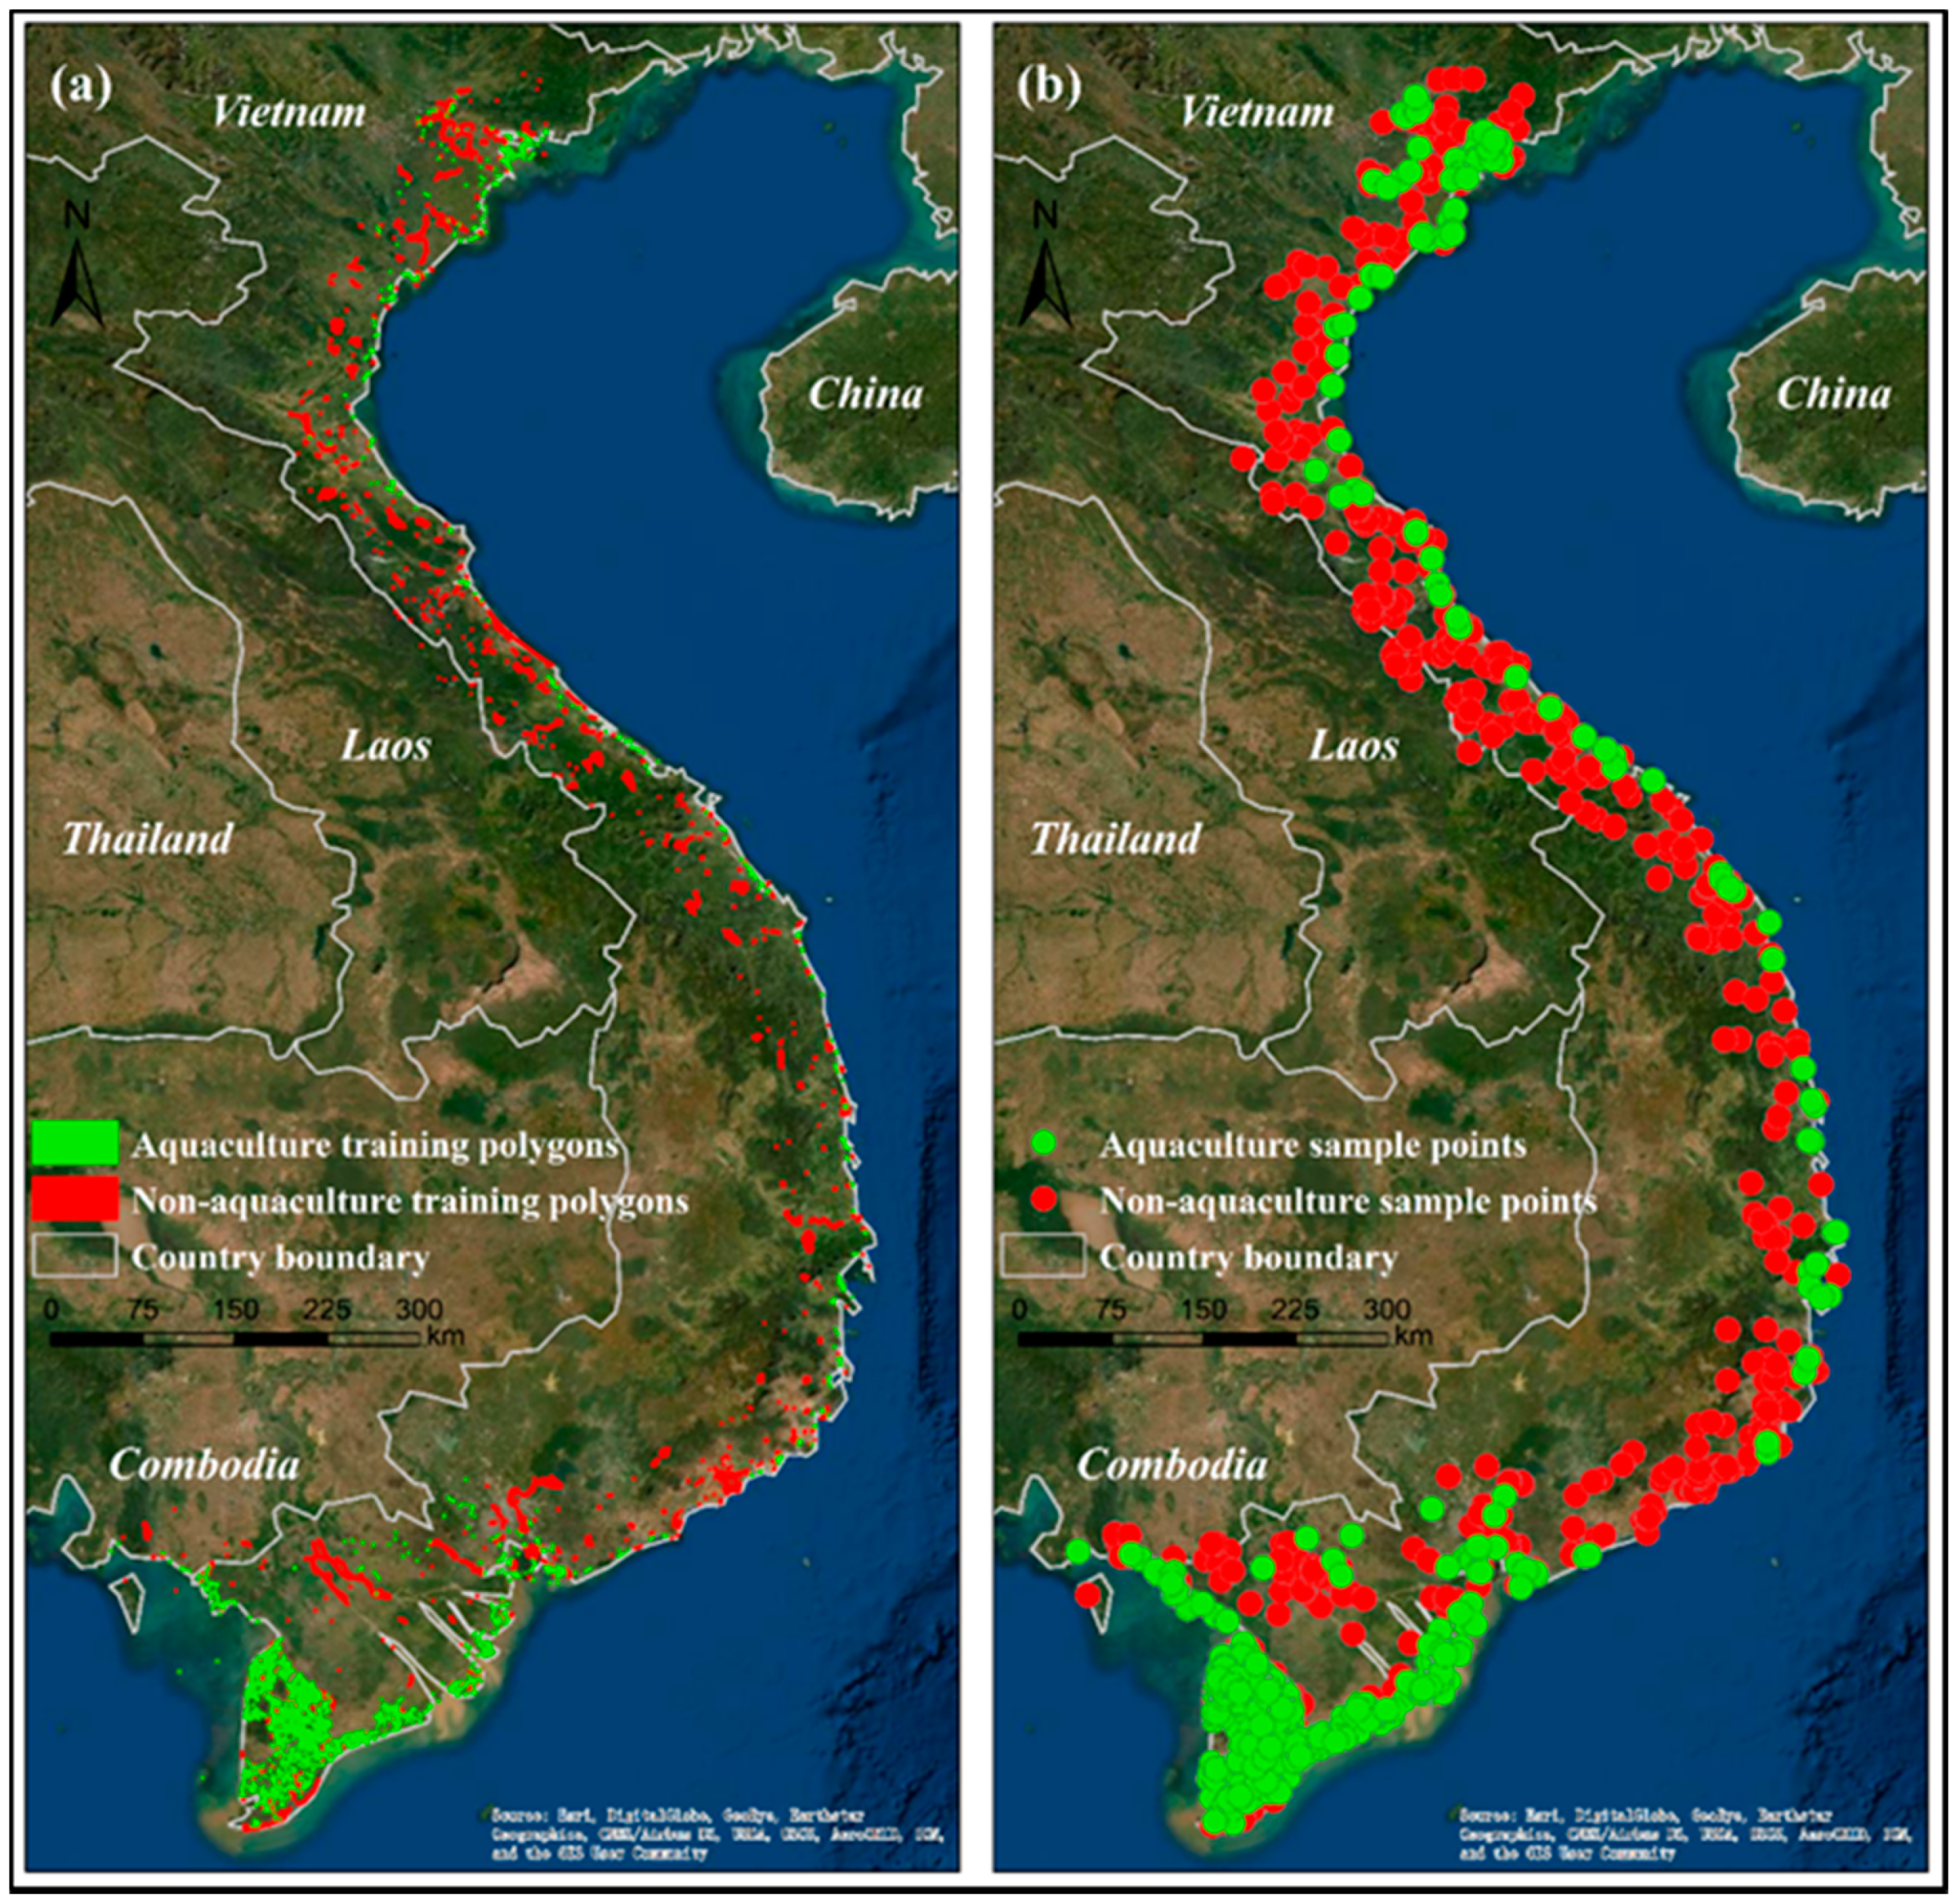
We constructed two independent datasets including 3500 training polygons (i.e., 1200 aquaculture polygons and 1000 non-aquaculture polygons) and 1200 validation points (i.e., 600 aquaculture points and 600 non-aquaculture points) (Figure 3a,b). Training polygon datasets were used to obtain the class features and corresponding thresholds for the decision tree and validation point datasets were utilized to assess accuracy.
Training polygon datasets were acquired by visual interpretation from Sentinel-1 images. We first obtained water objects derived from Sentinel-1 images and then attributed their properties (aquaculture polygons or non-aquaculture polygons) by referencing the high-resolution optical images in Google Earth. Aquaculture ponds are mainly water bodies closed by dams, so they have obvious water characteristics. Due to their constituent and distribution characteristics, aquaculture ponds have obvious distinctions from other objects in the image including darker colors, regular shapes (mainly rectangular), and distribution in rich water areas. Based on the above features, the principles and rules used to pick up the training polygons were as follows: (1) the training polygons should be distributed evenly in the study area; (2) their sizes and shapes should be representative in the whole study area; (3) their locations should be representative such as located in estuaries, shorelines, and near rivers. Furthermore, expert experience and knowledge are also very important when selecting the training polygons. Based on the above criteria and methods, the training polygons sets were collected.
Moreover, validation datasets were obtained by stratified random sampling on high-resolution optical images from Google Earth for the accuracy assessment.
Ancillary datasets
We used some ancillary datasets to define our study sites and assist the classification. For example, we implemented a high spatial resolution (30 m) map (Credit: Laboratory of Digital Earth Sciences, Aerospace Information Research Institute, Chine Academy of Sciences) with a detailed coastline to mask sea and regions not included in the study area. We also used the digital elevation model (DEM) (acquired by the Shuttle Radar Topography Mission with 30 m spatial resolution) to remove the effects of hillshade, which may very likely lead to misclassification of aquaculture ponds because hillshade can induce similar returns as ponds in Sentinel-1 images.
2.3.2. Extraction of Potential Aquaculture Ponds
Since aquaculture ponds are mainly shallow water bodies, they can be easily confused with other water bodies including lakes, reservoirs, and rivers. Therefore, we conducted the mapping of aquaculture ponds by two steps: retrieving potential aquaculture ponds and then secondary classification to catch the “true” aquaculture ponds.
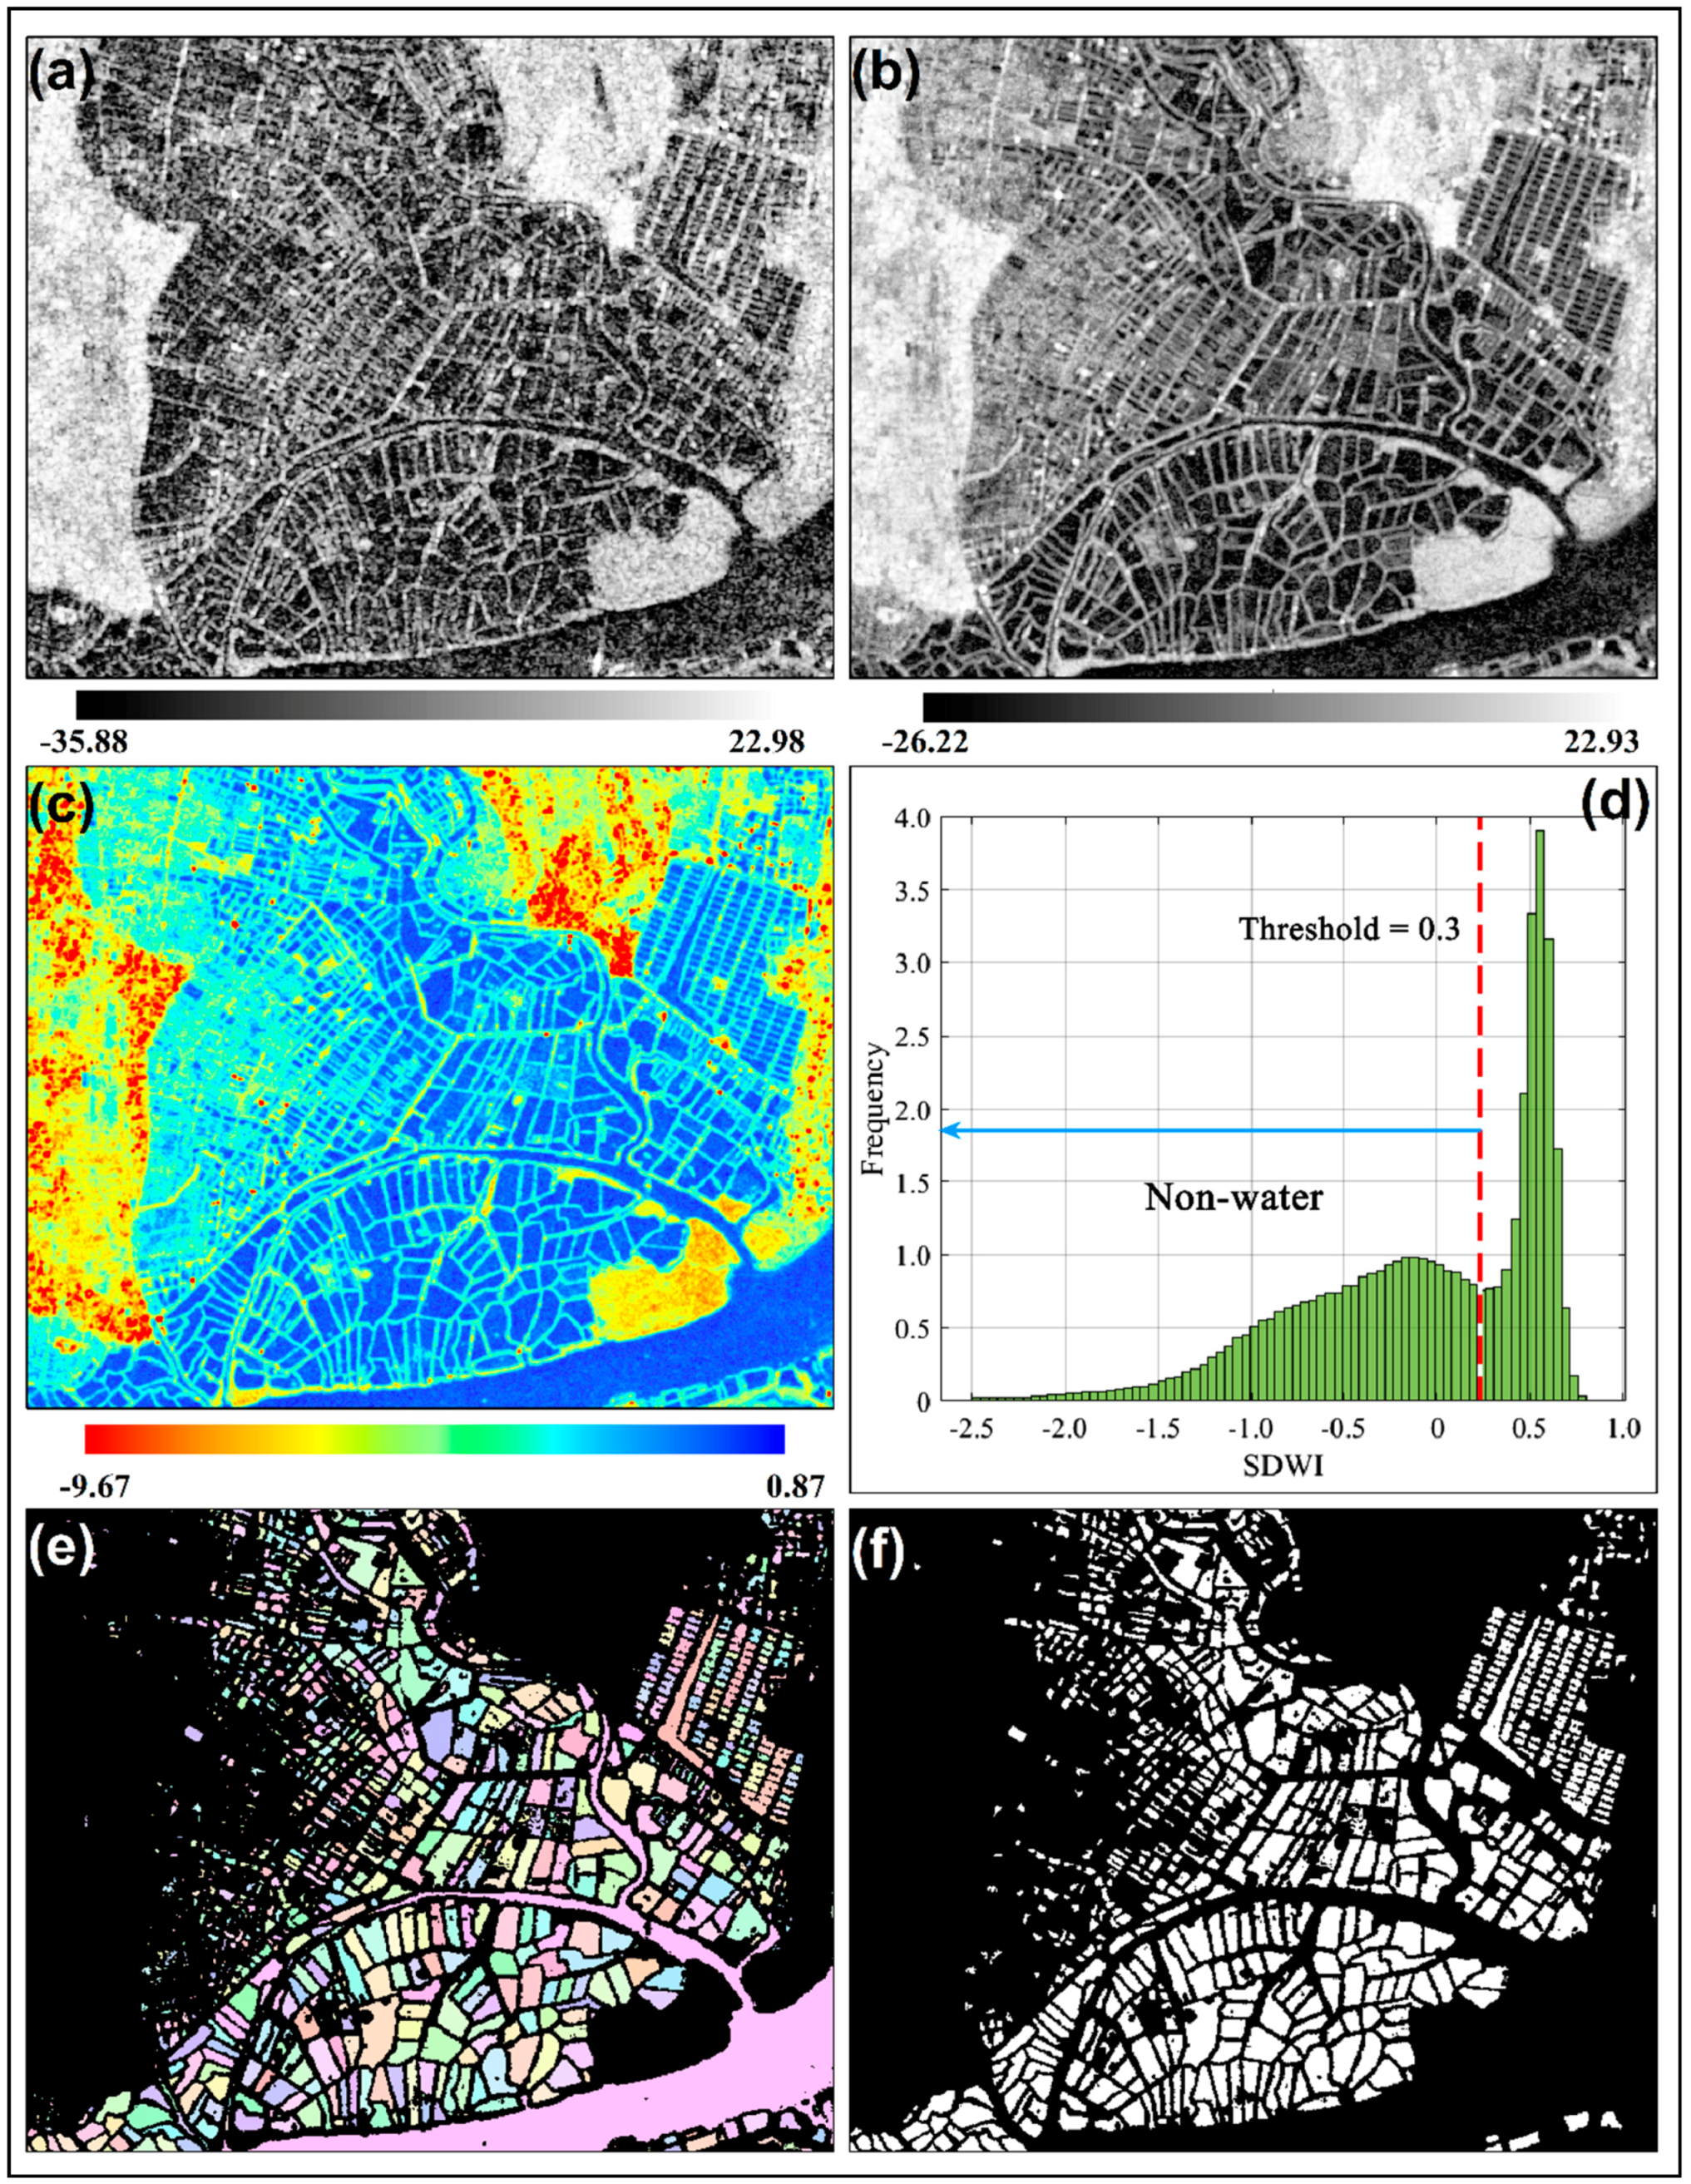
To find the potential aquaculture ponds from satellite images, we adopted the integration of object-based segmentation and decision tree classification. A water index specifically developed for Sentinel-1 dual-polarized bands (Sentinel-1 Dual-Polarized Water Index, SDWI [51]) was utilized to capture shallow water. Fully considering the signal difference between water and other objects in dual-polarized bands, SDWI can enhance the water body information and simultaneously eliminate the effect of soil and vegetation. SDWI (Equation (1)) can efficiently extract low-backscatter water bodies under complex conditions [51], and thus can be used to map aquaculture ponds. We computed a threshold on SDWI to define shallow water bodies. Since water and the other ground objects can create two distinct modes on the histogram of SDWI, we used the valley (SDWI = 0.3) between the two peaks in the histogram of training polygons as the threshold to separate water and the other objects. The pixels were classified as water body when SDWI was greater than 0.3
where VV and VH represent the pixel value in VV median images and VH median images. The logarithmic function is used to make the value of VV and VH more manageable and comparable for different ground objects.
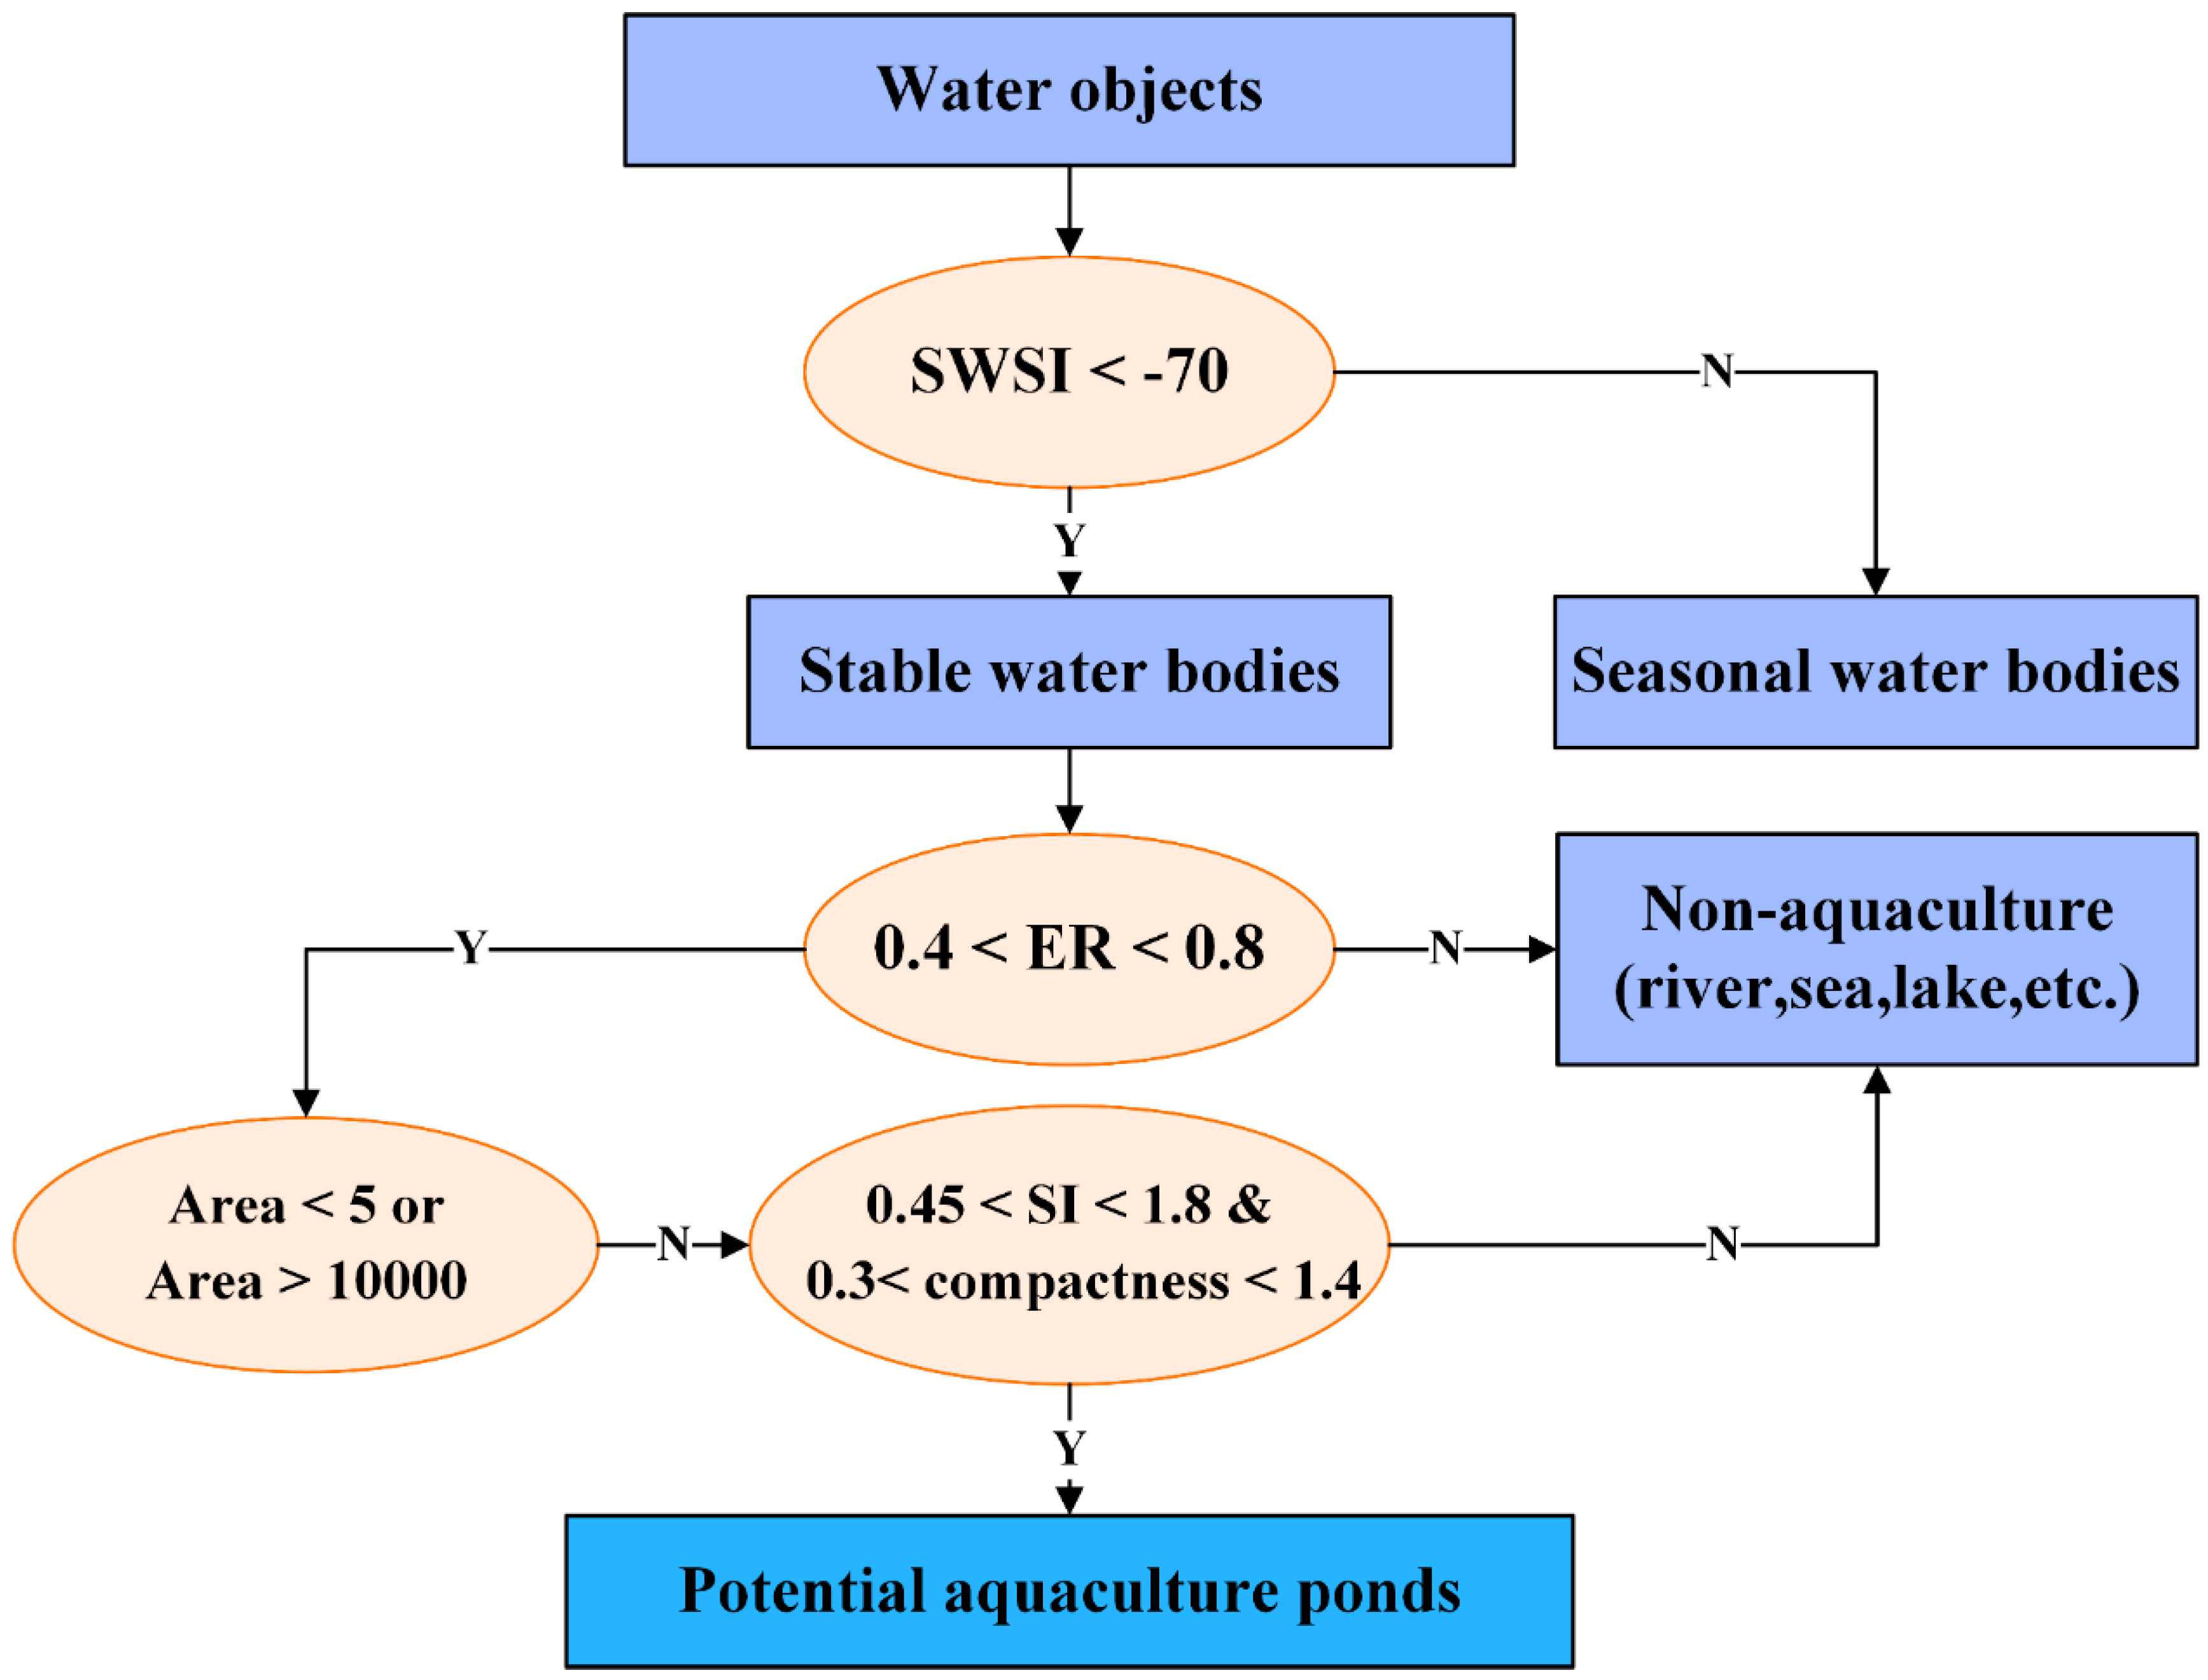
The connected component segmentation (CCS) algorithm was chosen for obtaining the objects of water bodies. The CCS algorithm approach detects objects by considering the connectivity of focal pixels with neighboring pixels (e.g., eight neighbors), where the connected pixels are merged into the same objects [52]. We then generated a total of six metrics for segmented objects representing the geometric and texture features (Table 1). Among the six metrics, five of them have been widely used to measure the geometry of objects including area, perimeter, shape index (SI), compactness, and extent ratio (ER) [53,54,55]. Since seasonal water bodies including paddy fields and salt ponds are generally characterized by rough surface with distinctive high backscatters in the dry season, the pixels of seasonal water bodies are normally coarser than that of aquaculture ponds. To distinguish aquaculture ponds from seasonal water bodies, we constructed and adopted the seasonal water sensitivity index (SWSI) computed with gray level co-occurrence matrix (GLCM) to enhance the seasonal features [56,57,58]. We used the (ee.glcmTexture) function in the GEE to obtain texture features. In this step, the kernel is a 3 × 3 square, resulting in four GLCMs with offsets (−1, −1), (0, −1), (1, −1), and (−1, 0). Next, the four directional bands for each feature were averaged to one band. Based on the function, the GLCMs of the median composition of the VV image and VH image were calculated. Finally, the sum average (Savg) of each GLCM was selected to construct the SWSI.
2.3.3. Secondary Classification
Based on the potential aquaculture ponds, we employed a secondary classification to exclude non-aquaculture objects including hillshade, discontinuous rivers, and isolated ponds, which have similar geometric and texture characteristics as aquaculture ponds.
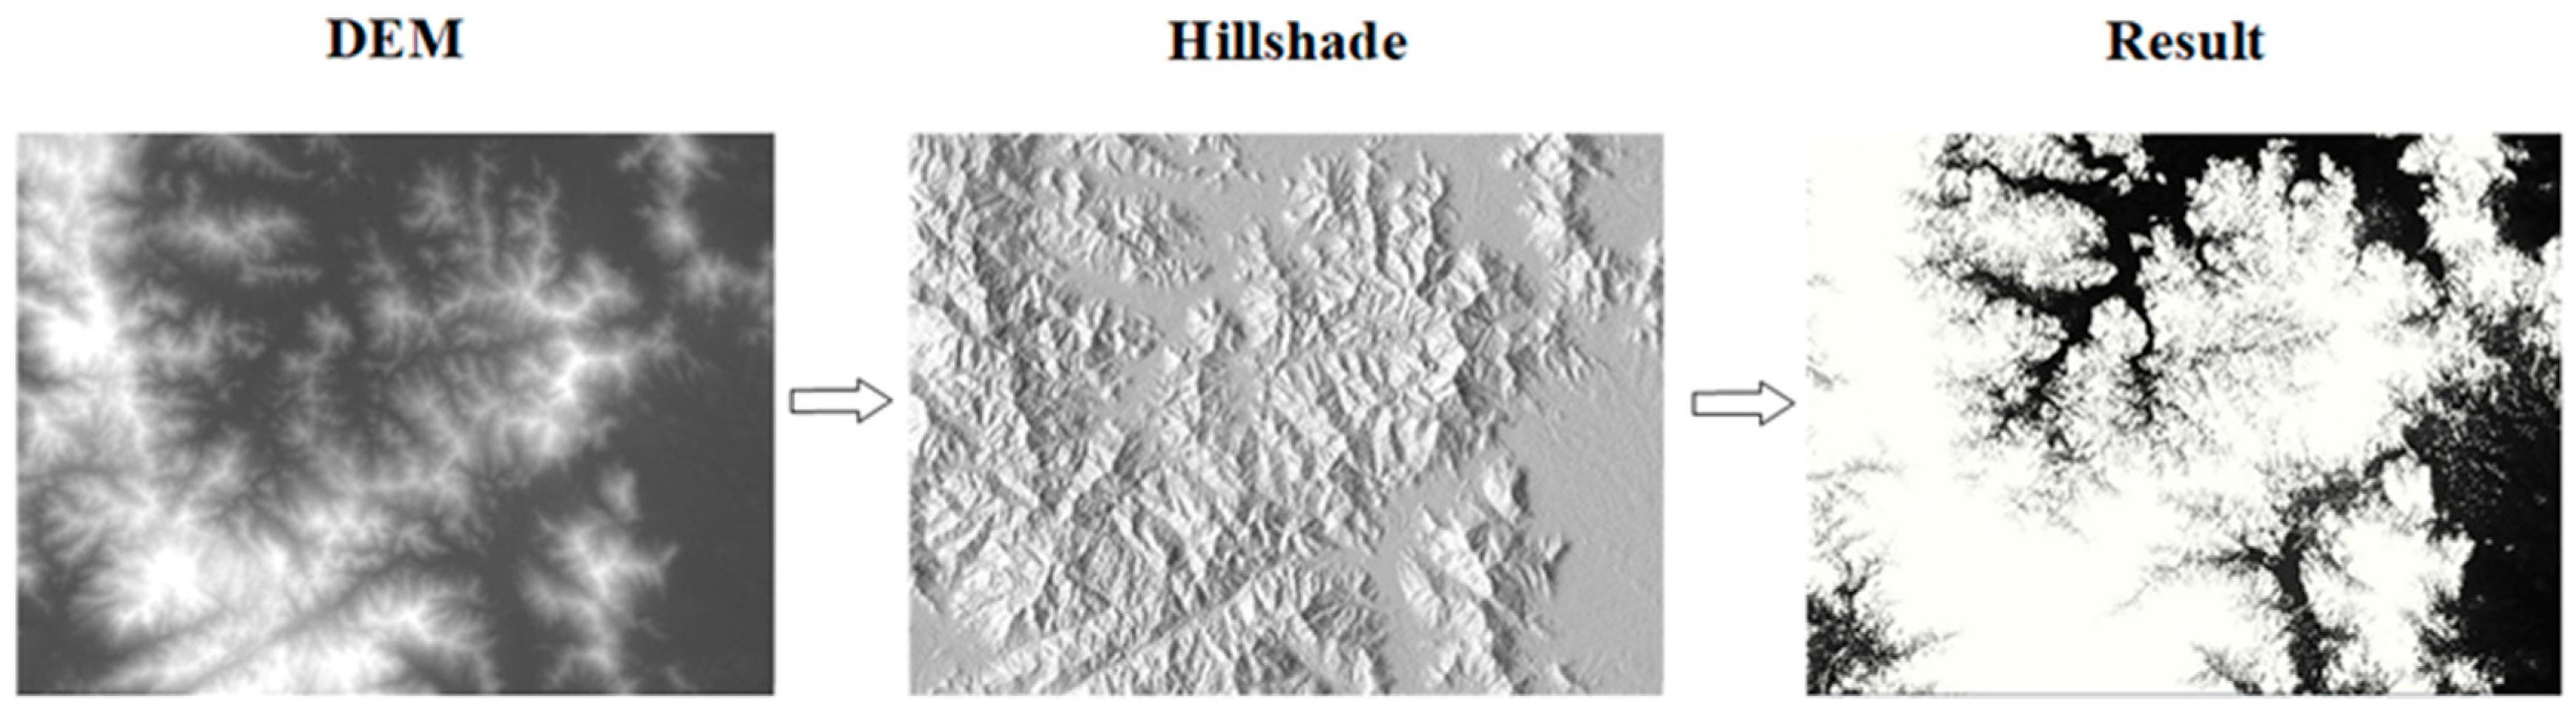
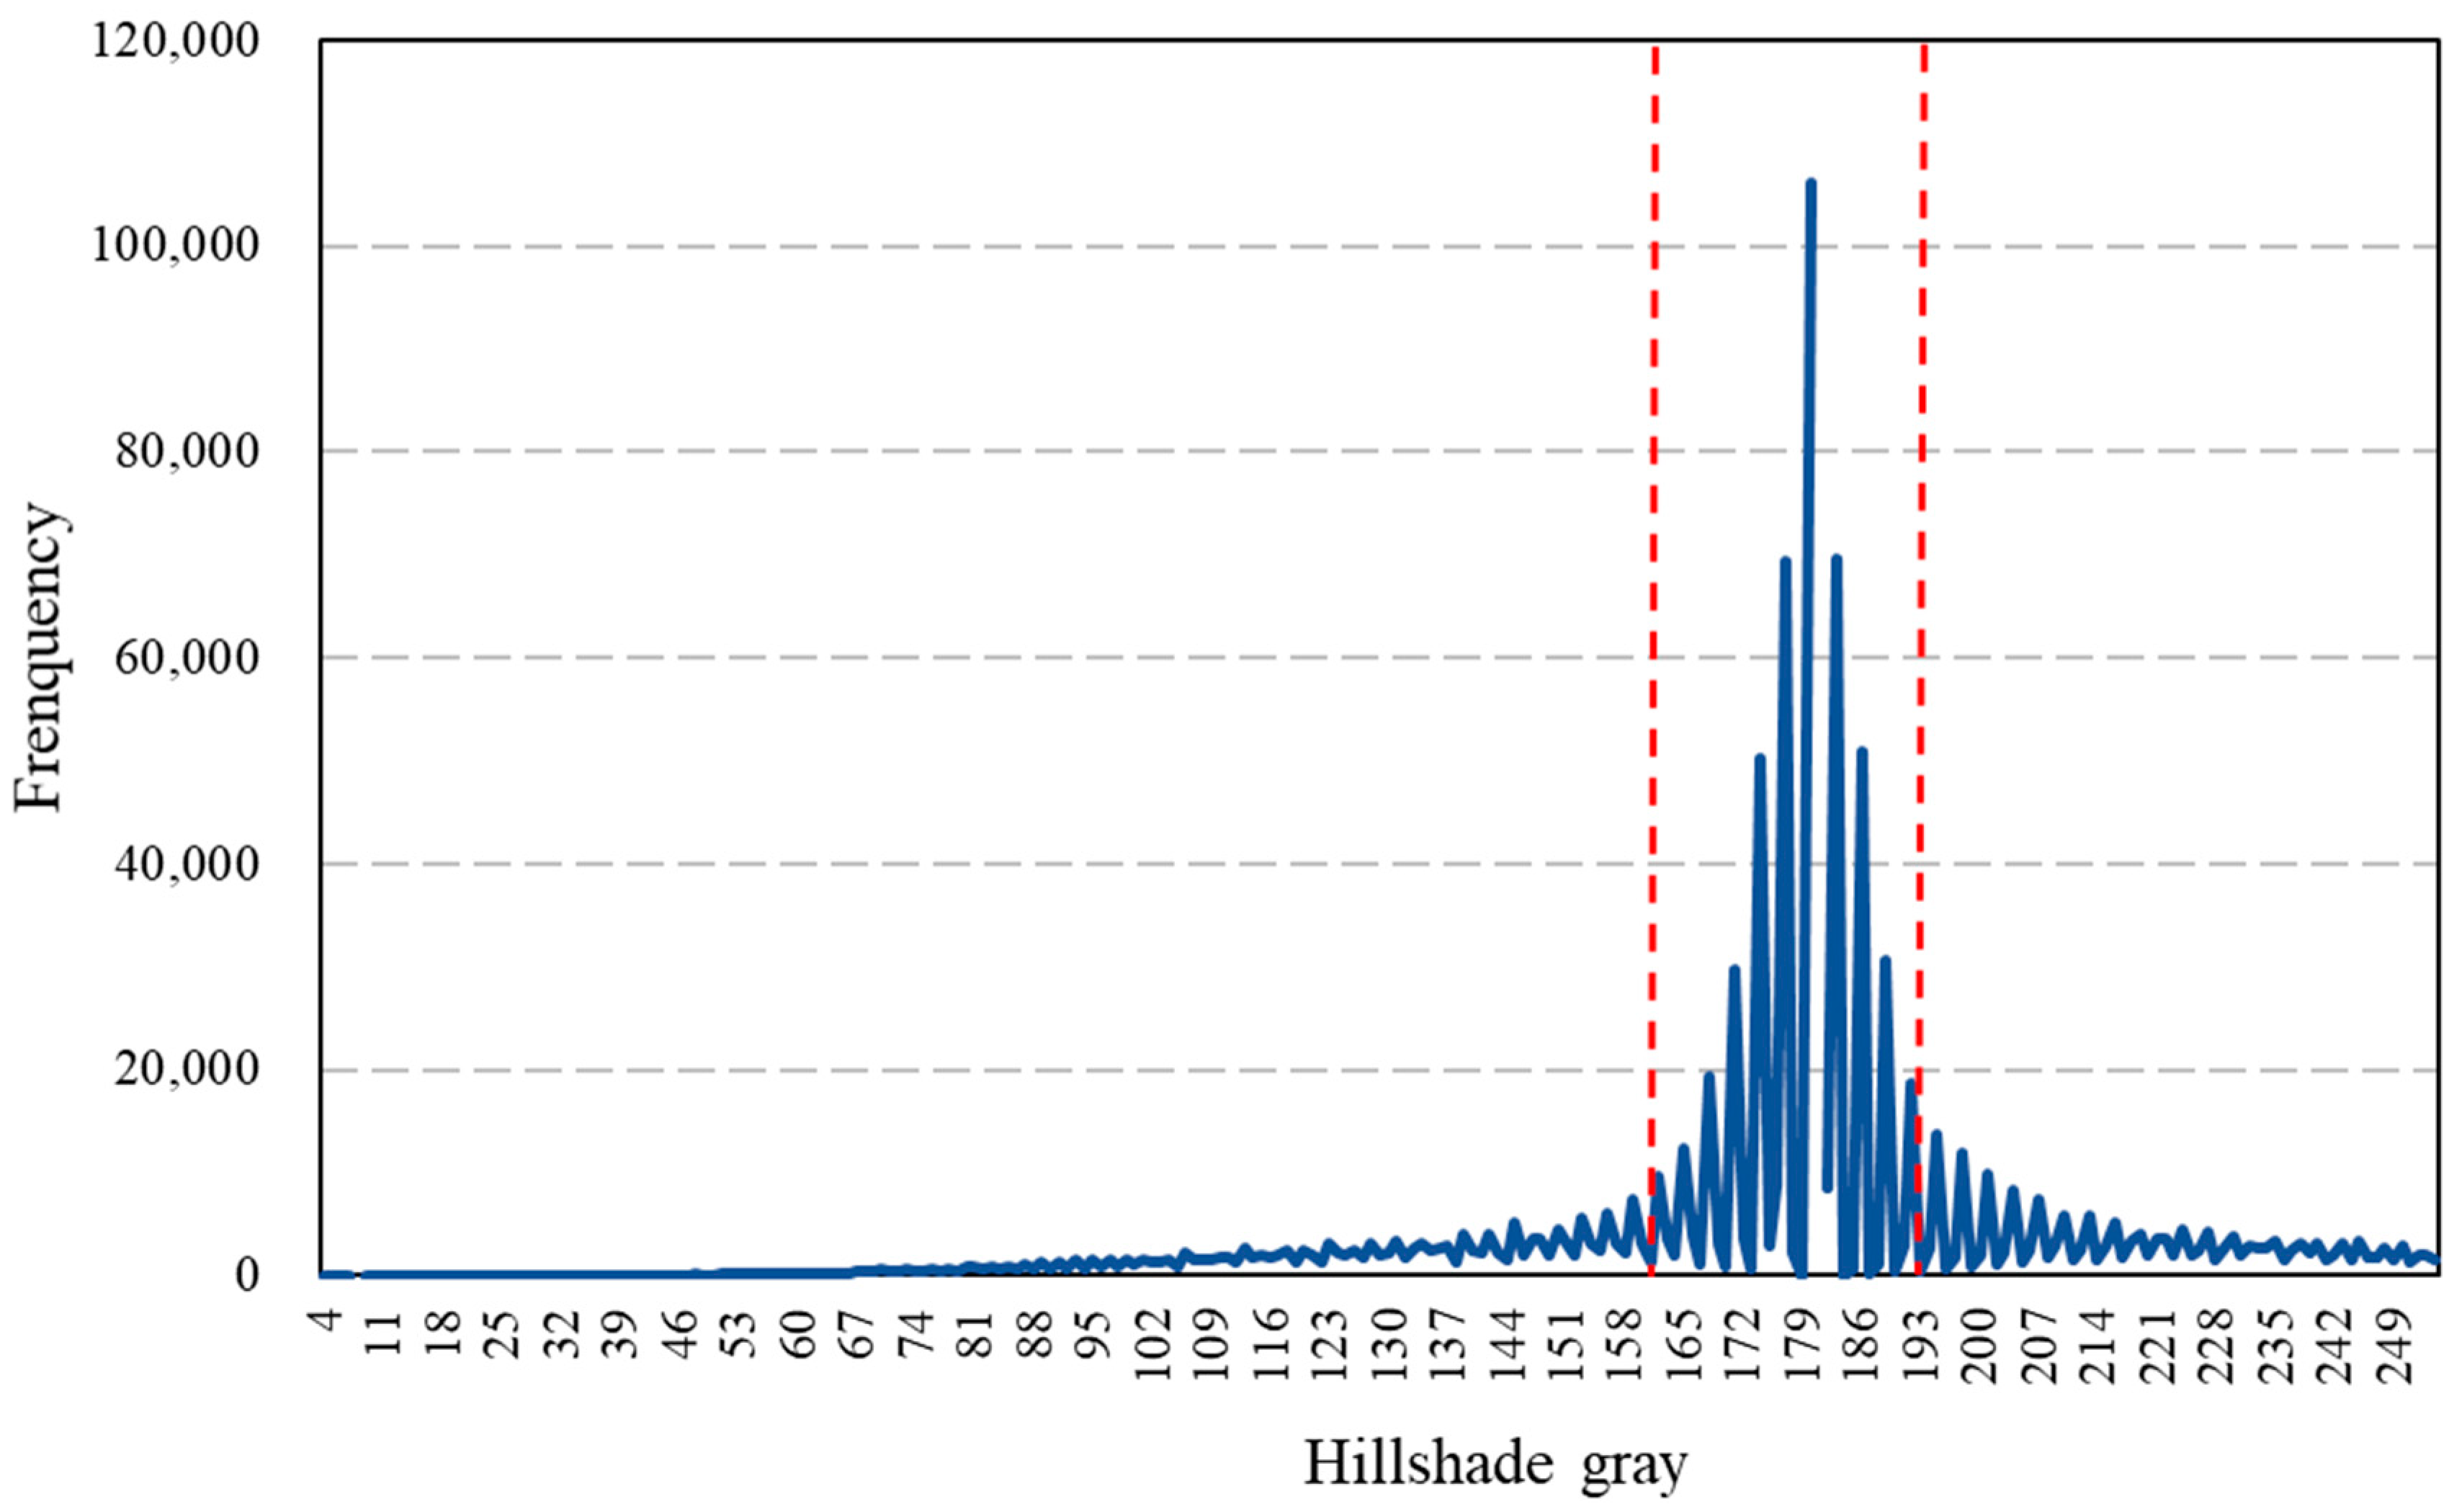
First, we identified and excluded hillshade objects from potential aquaculture ponds (Figure 5). Hillshade information was acquired using the hillshade function (ee.Terrain.hillshade) in the GEE. The input of function was DEM provided by the global SRTM Version 3.0 dataset with a spatial resolution of 30 m. The default of 270 degrees and 45 degrees were set as the input of azimuth and elevation, respectively. The final hillshade map was obtained by threshold segmentation. In order to obtain the optimal threshold, a histogram was obtained by selecting some regions of interest (Figure 6). The histogram showed an obvious unimodal feature, with a mean value (M) of 176.70 and a standard deviation (SD) of 33.76. Therefore, the threshold for extracting the hillshade map was determined by M ± 0.5SD (i.e., pixels with gray values between 159.82 and 193.58 were not hillshade, but the others with gray > 193.58 and gray < 159.82 were hillshade). We then used the hillshade map to remove hillshade from potential aquaculture ponds.
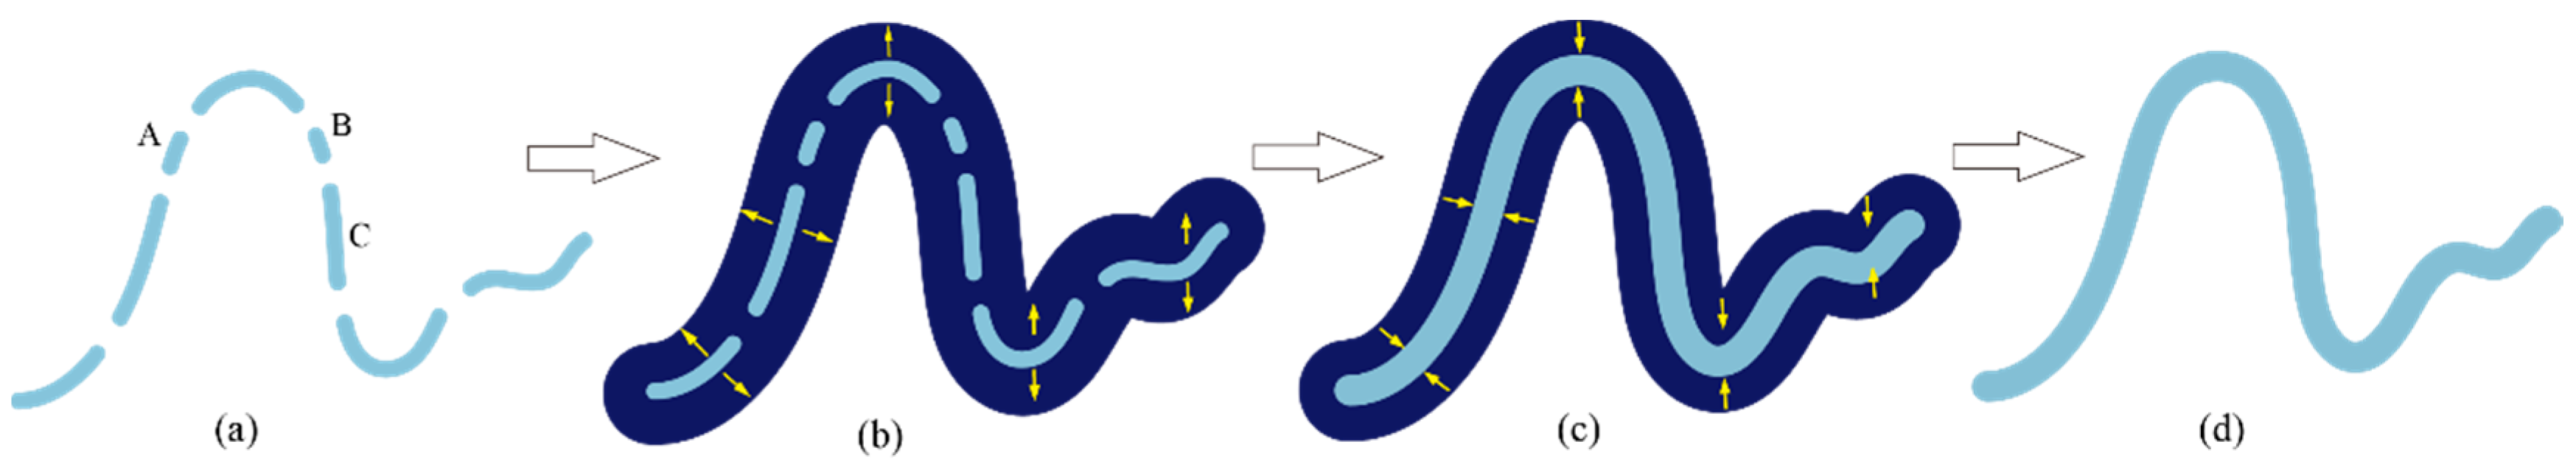
In the process of the decision tree classification above, some discontinuous streams could be misclassified as aquaculture ponds due to their similar shape and spectral characteristics in SAR images (like A and B in Figure 7a). A morphological technique was then chosen to remove the discontinuous streams (Figure 7). First, all potential stream objects were dilated to fill the gaps between subsections of streams by creating an inside and outside buffer for each object (Figure 7b). Then, we eroded the dilation objects by creating an inside buffer for each object (Figure 7c) and obtained the continuous streams (Figure 7d). The continuous streams could be easily excluded because of their specific geometric characteristics using geometric features such as the shape index.
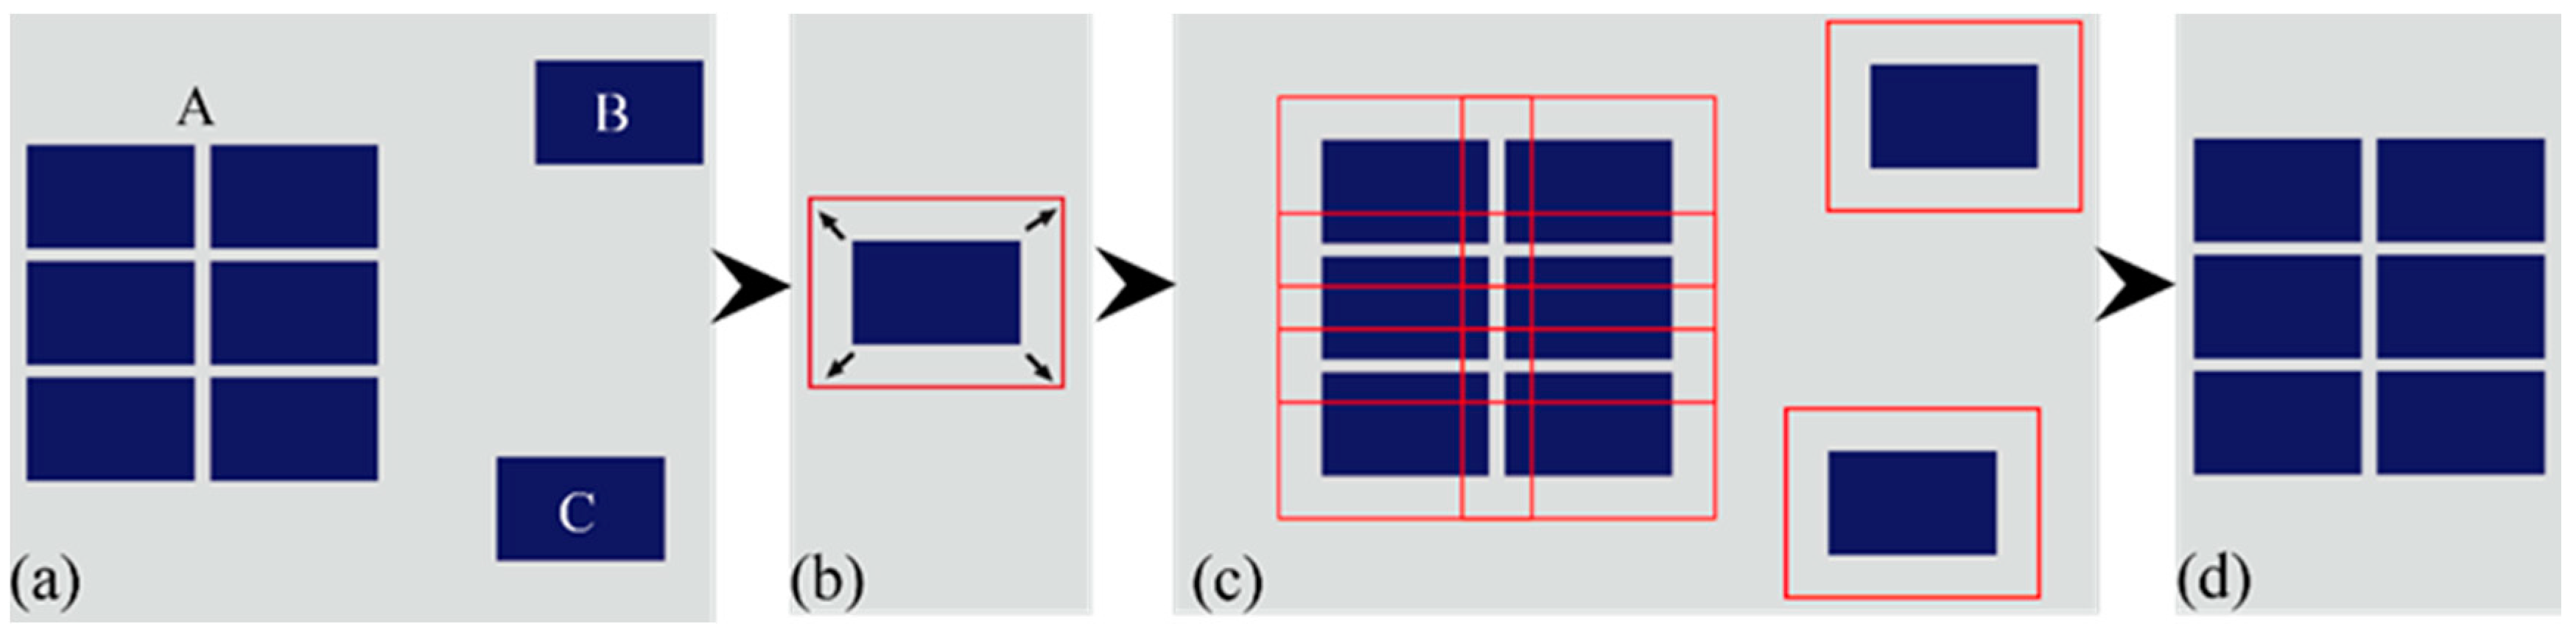
The last step was to remove regular lakes, farm reservoirs, and impounding reservoirs from the potential aquaculture pond layer. Aquaculture ponds bisected by narrow and glittering dams or roads generally present an agglomeration distribution (e.g., A in Figure 8a), while most of the lakes and reservoirs are isolated (e.g., B and C in Figure 8a). Therefore, a step searching neighborhood features was used to remove the non-aquaculture objects from potential aquaculture pond objects because aquaculture ponds are generally located close to each other (Figure 8).
2.3.4. Accuracy Assessment
Accuracy assessment for aquaculture ponds was performed based on the validation sets. A confusion matrix was calculated and standard performance measures (i.e., overall accuracy, producer’s and user’s accuracy) were derived from the matrix [59].
3. Results
3.1. Mapping and Validation of Aquaculture Ponds
Based on the validation sample sets, the user’s, producer’s accuracy (UA and PA) and the overall accuracy (OA) were obtained (Table 3). The OA and Kappa coefficient were 90.16% and 0.8, respectively.
Figure 9 shows an example of the result of each step including processed images, segmentation, and classification results. Compared with the original SAR image (Figure 9a), the median image (Figure 9b) can largely improve the representation of water because noise on single images has been removed. Based on median images, the water index SDWI was calculated (Figure 9c) and has the capability to enhance the difference between water (high values) and other objects (low values), which corresponded to the two modes in the histogram (Figure 9d). Then, through a simple dip test, the threshold was obtained from the histogram of SDWI (SDWI > 0.3) to get the water body pixels. We then conducted the CCS algorithm to obtain the objects of water bodies (Figure 9e). Finally, through rule construction derived from training polygons (Figure 3a) and decision tree execution, potential aquaculture ponds were extracted (Figure 9f).
Aquaculture ponds were then classified with a secondary classification based on the above results of potential aquaculture ponds. As shown in Figure 10, aquaculture ponds were largely clustered and occupied the water-rich areas along the rivers or the coast. Seasonal water bodies such as rice farms were much smaller in size and located away from rivers and coastal areas. Isolated water bodies such as lakes, reservoirs, and farmland reservoirs were also identified and distributed randomly.
3.2. Spatial Distribution of Coastal Aquaculture Ponds
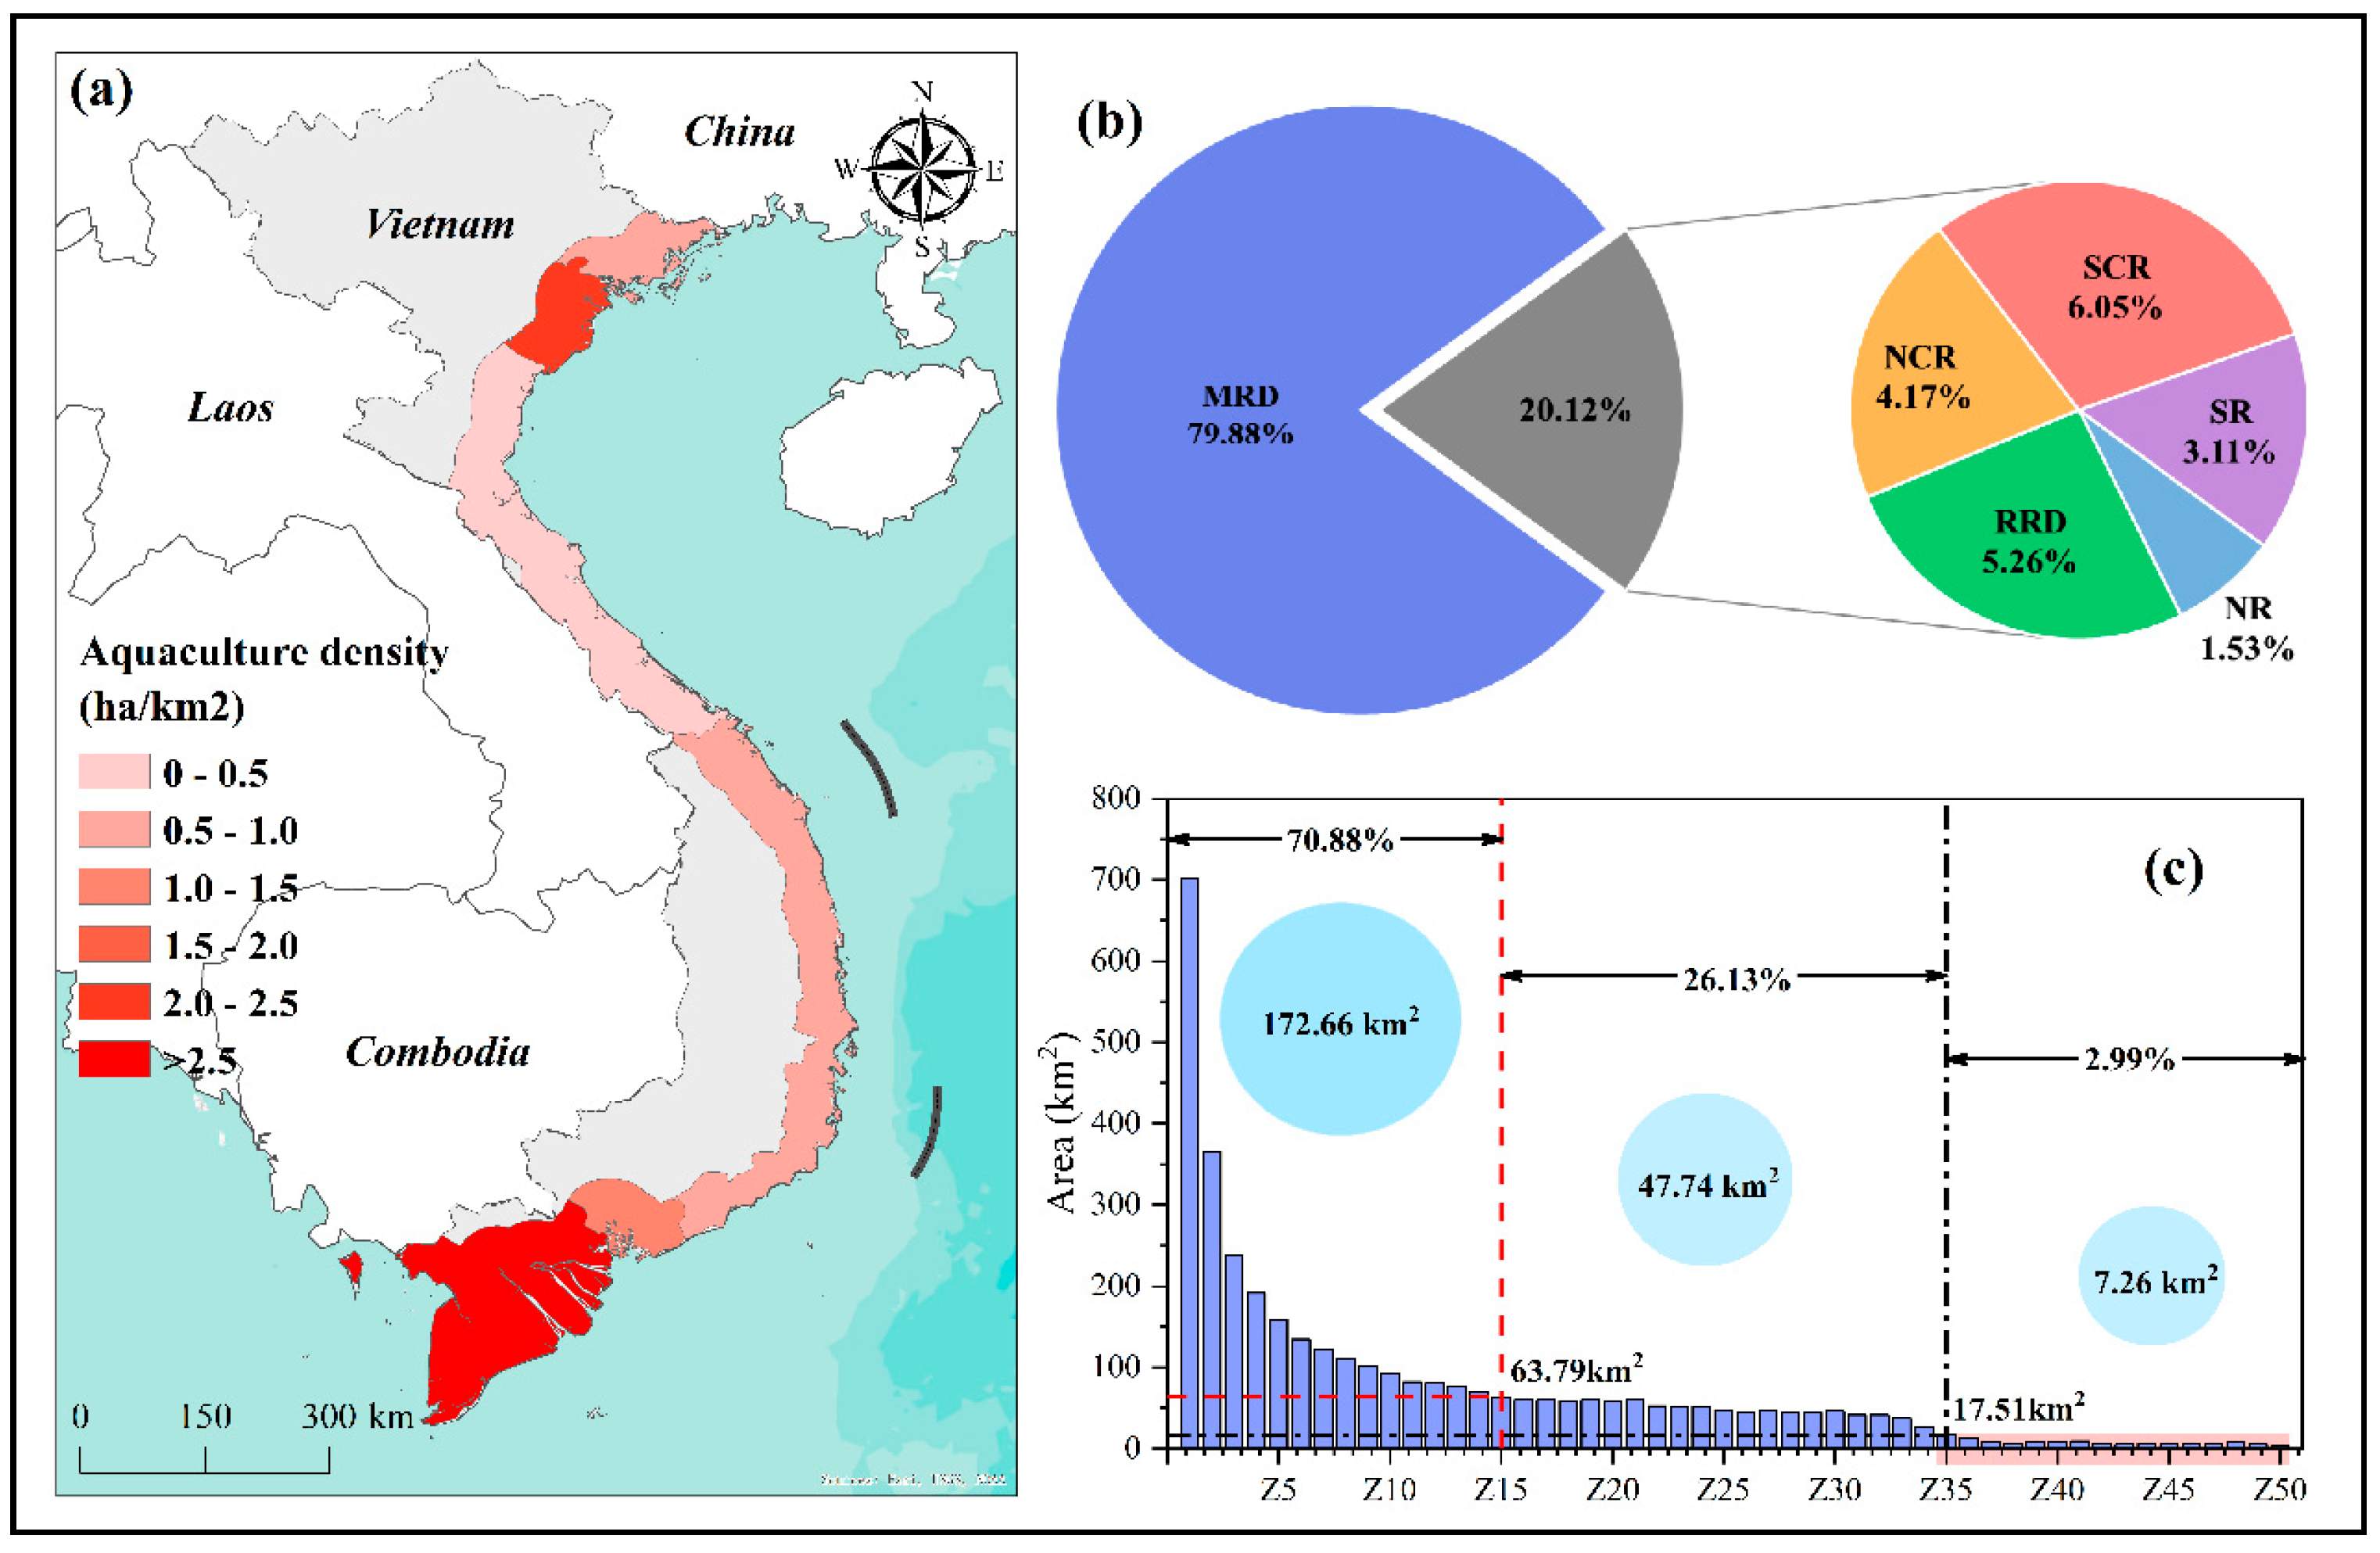
The distribution of coastal aquaculture ponds in Vietnam in 2020 showed very high spatial variability concentrated in the north and south (e.g., MRD and RRD) and very few in central regions (e.g., SCR) (Figure 11). The total area of aquaculture ponds was 4262.94 km2, with the largest area in the MRD (3405.05 km2), followed by SCR (257.89 km2), RRD (224.33 km2), NCR (177.94 km2), SR (132.67 km2), and NR (65.08 km2). The proportional area of aquaculture ponds in each region is shown in Figure 12b. Aquaculture ponds concentrated most of the landscape in MRD and RRD, accounting for about 85.14% of total area, while they covered a small proportion (less than 10%) in other regions.
Among the six sub-regions, MRD had the largest area and density of aquaculture ponds (7.95 ha/km2), and NCR had a minimum density of 0.42 ha/km2 (Figure 12a). The density of NR, RRD, SCR, and SR was also small, about 0.63 ha/km2, 2.02 ha/km2, 0.54 ha/km2 and 1.28 ha/km2, respectively.
We also examined the spatial distribution of aquaculture ponds along their distance to the coastline by computing the area of ponds in every 1 km buffer zone of the coastline (Figure 12c). Aquaculture ponds were mostly distributed within 15 km from the coastline, accounting for 70.88% of the total area, with highly varied pond area ranging from 701.22 km2 to 63.79 km2. Between the distance of 15 km and 35 km from the coastline, the area of aquaculture ponds rapidly decreased and only covered 26.13% of the total area with an average pond area of 47.74 km2. In regions away from the coastline (distance greater than 35 km), aquaculture ponds were very few and the mean area of aquaculture ponds was only 7.26 km2, accounting for only 2.99% of the total area.
4. Discussion
In this study, we proposed an approach for mapping aquaculture ponds at a national scale using Sentinel-1 SAR images with the Google Earth Engine (GEE) platform. The application in mapping aquaculture ponds in Vietnam showed high accuracy. Our result of aquaculture ponds showed the spatial heterogeneity of aquaculture ponds and provides significant information for monitoring and managing aquaculture and coastal ecosystems.
4.1. A Transferable Approach
Our classification framework could be generalized to map aquaculture ponds at a large scale in other areas. Our approach identified aquaculture ponds as objects with low radar backscatter values and a clustering pattern in space. Through capturing the surface roughness, radar backscatter images are efficient at recognizing water bodies. However, other water bodies can be easily misclassified as aquaculture ponds with only the backscatter information [41]. Through a refined process incorporating the geometric and texture metrics, our approach can exclude seasonal water bodies such as rice farms, river segmentations, lakes, and reservoirs. With the high spatial resolution of Sentinel−1 SAR images, we were able to identify very small ponds that had been neglected using coarser resolution images such as Landsat [5,14]. Our results can enhance the feasibility and application of SAR images for mapping aquaculture farms with a better understanding of the role of temporal images and the geometric features of radar backscatters. The approach presented is available via GEE code application and can be easily transferred to map aquaculture ponds in other regions, making it possible to map aquaculture ponds at regional and even global scales.
Several uncertainties should be considered when applying our approach to other regions. First, a longer time series data frame should be considered such as data covering the entire year from January to December. In this study, we only had access to the data from January to April in 2020 because most of the aquaculture ponds in coastal zones covered by water all year round in Southeast Asia such as Vietnam. Therefore, our datasets did not affect the mapping accuracy. Although most rice farms only conserve water part of the year, some irrigation reservoirs have water year-round and are easily misclassified as aquaculture ponds. Additionally, the misclassification could also lie in the temporal change that rice farms may have been converted to aquaculture ponds when the SAR data were acquired. In addition, the method for removing discontinuous rivers might fail where aquaculture ponds with loss of dividing dam clusters. Therefore, specific thresholds need to be changed in some special places. There might exist some other circumstances leading to the misidentification of aquaculture ponds that were not presented in this study.
4.2. Implications for Sustainable Management of Aquaculture and Ecosystem Conservation
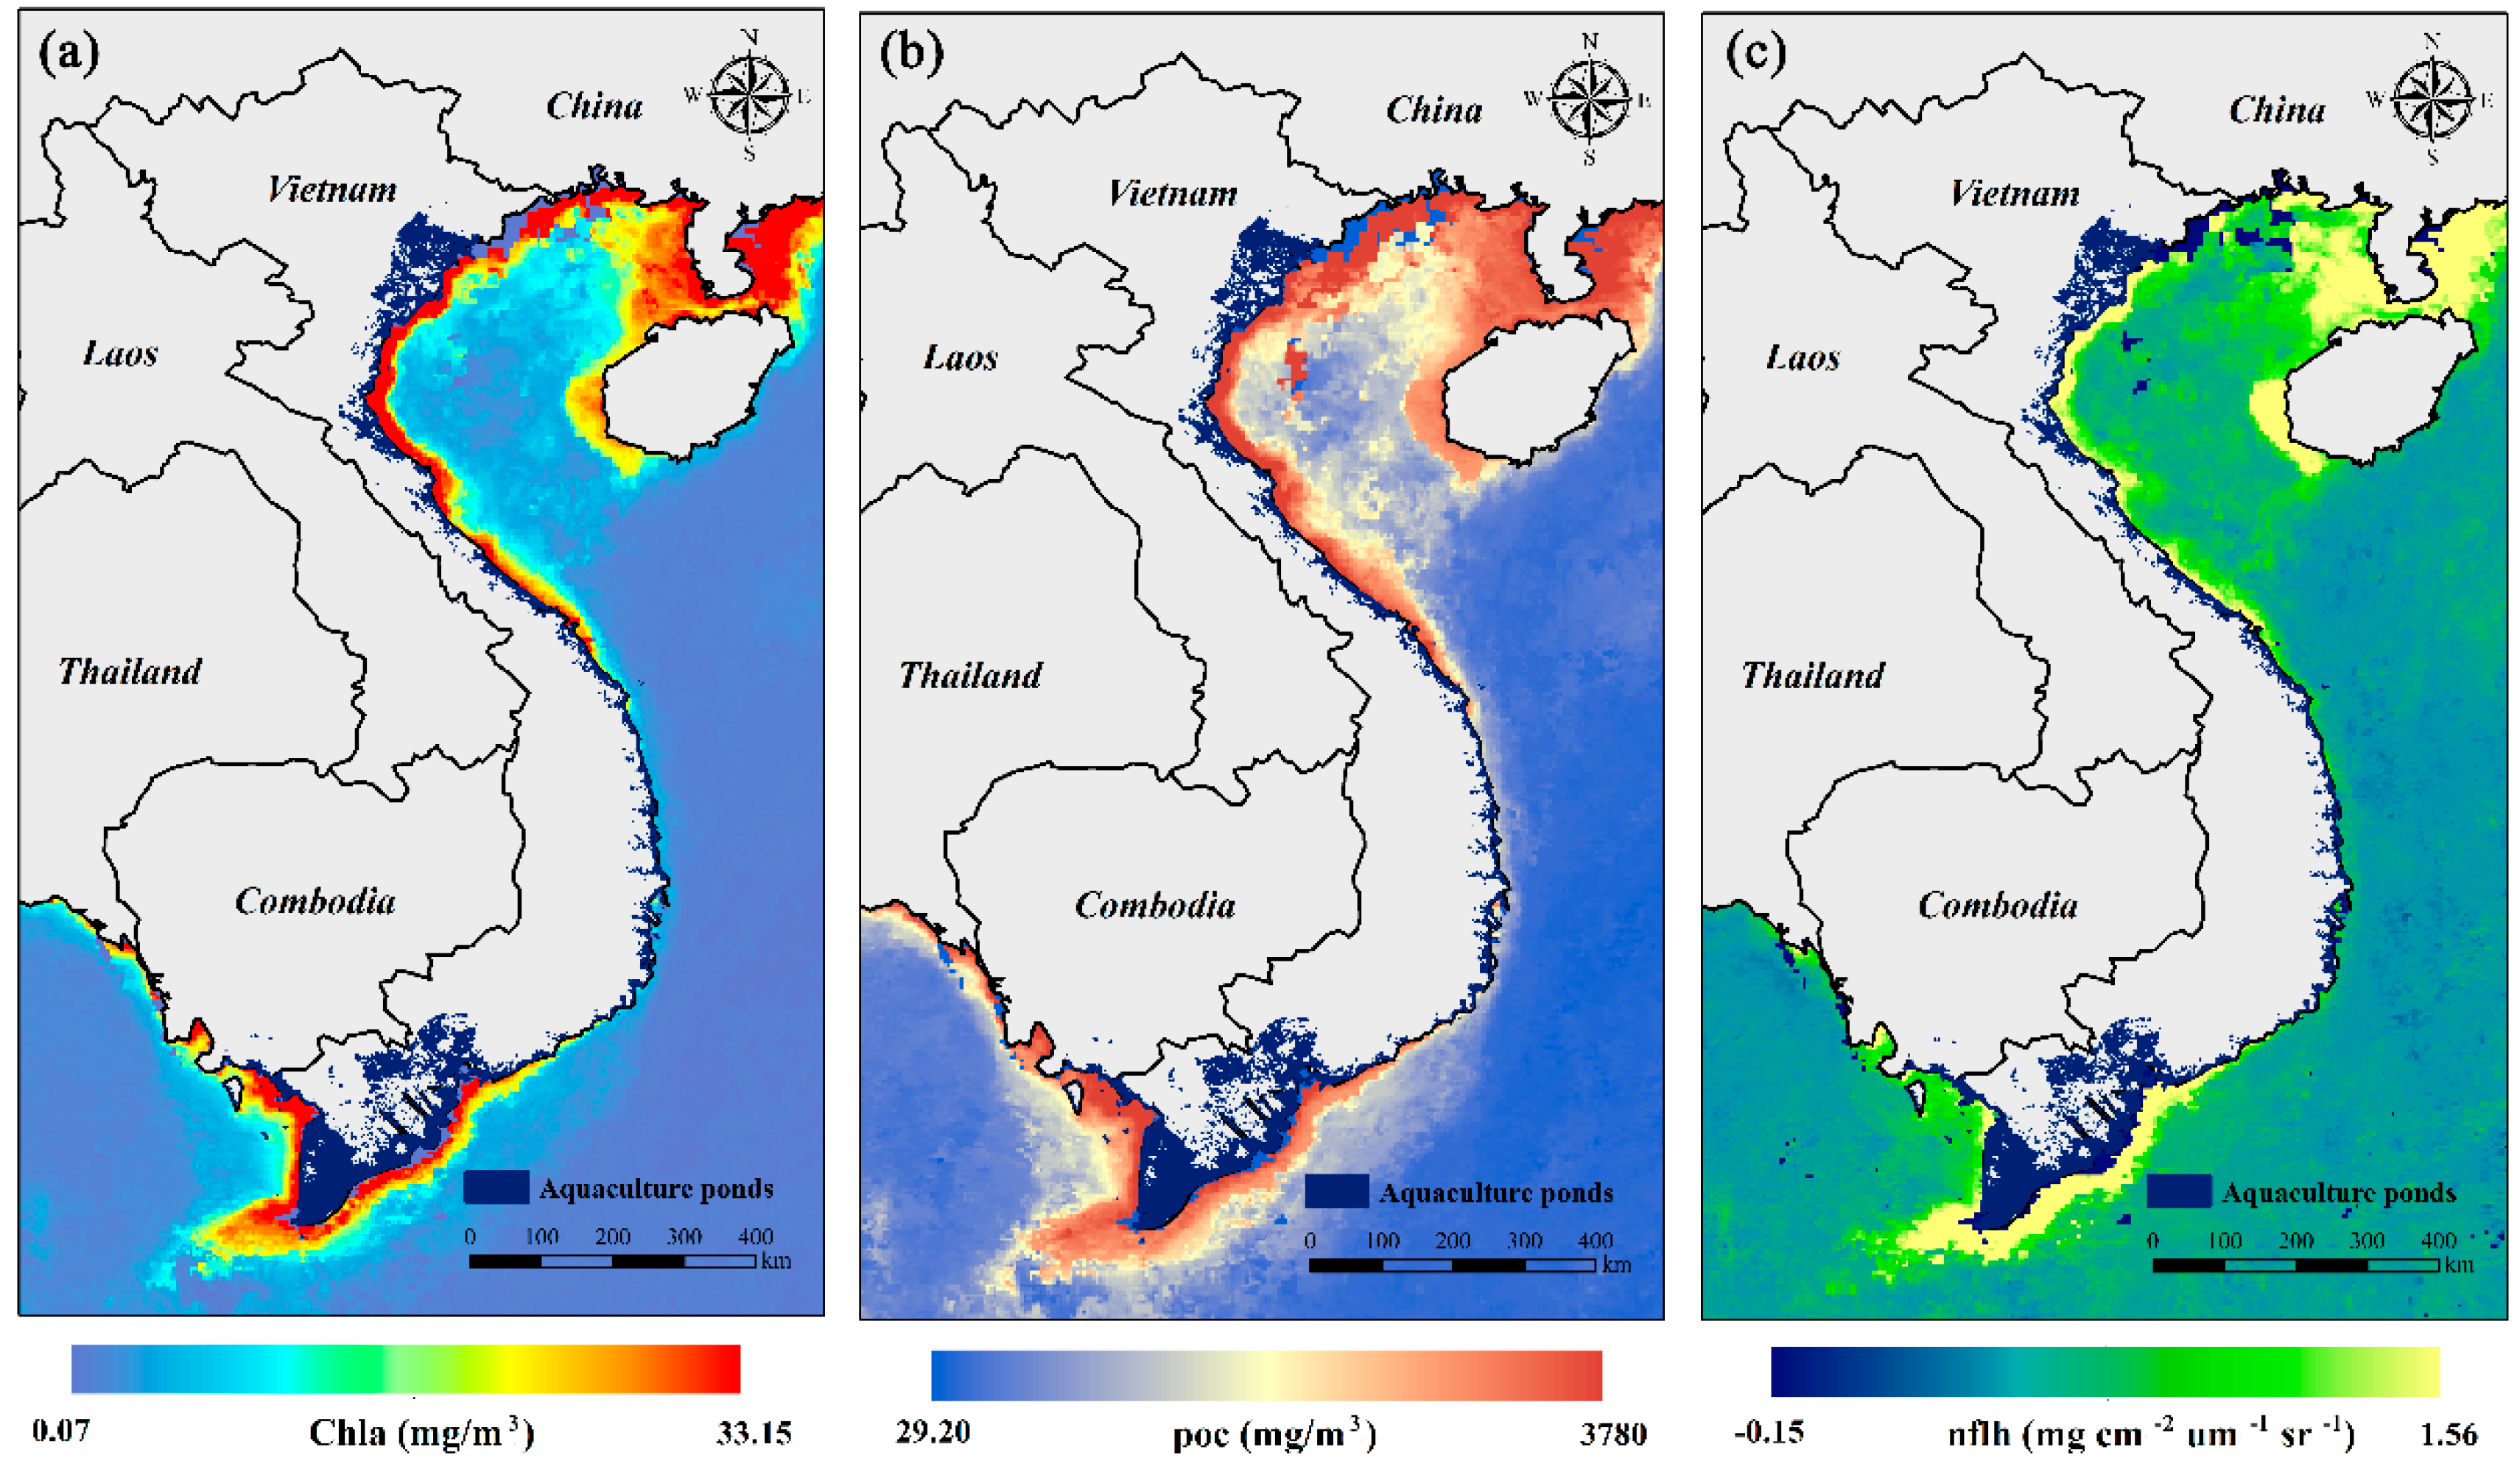
We have witnessed the spatial heterogeneity of aquaculture ponds along Vietnam’s coastal regions through the application of our approach. Further exploration of our mapping results can provide significant insights into the sustainable development of aquaculture, coastal area management, and protection of the coastal ecosystems. Current programs focus on global fisheries, for example, the FAO provides statistical data on the yield and export rate. However, limited attention is paid to the sustainable planning and management of the aquaculture ponds, likely due to the lack of statistical standards and methods. The explicit spatial distribution of aquaculture ponds at a large scale is a first crucial step toward supporting better decision-making for aquaculture management and ecosystem conservation. For example, our maps could provide the status of aquaculture along the coastal area. Aquaculture ponds have taken the space of the near coastal region in Vietnam, especially in the northern and southern coast (Figure 12), by replacing rice fields, mangroves, and natural water bodies [7,28,60]. Shifting from rice fields to aquaculture ponds (e.g., shrimp farms) could be a way to mitigate the risk of sea level rise and salinity intrusion. With the increasing demand of human nutrients and the government’s hope to improve social and economic benefits, aquaculture is predicted to increase continuously. In this context, the untreated waste from aquaculture [9,60] and the damage on natural ecosystems such as replacing mangroves may push the coastal environment to its sustainable limitation and lead the ecosystem to another state that may be difficult to reverse, for example, harmful algal blooms and dead zones. Figure 13 shows that along the coastal line of Vietnam, the water quality is poor where there is a large area of aquaculture ponds. Therefore, the spatial distribution of aquaculture ponds is fundamental for the investigation of environmental problems and ecosystem conservation [5,12,27,61,62].
5. Conclusions
Since sustainable and efficient aquaculture management is one of the most important challenges for coastal ecosystem conservation, the accurate mapping of aquaculture ponds is a crucial first step toward understanding the spatial heterogeneity and supporting better decision-making for ecosystem conservation and aquaculture management. In this paper, we presented an approach to efficiently and accurately map aquaculture ponds over the coastal region of Vietnam. The approach relied on the use of radar backscatters from Sentinel-1 SAR images with a novel classification scheme. The workflow was implemented entirely on the Google Earth Engine platform to leverage the computation power and the ease of data-access. This application, based on Google Earth Engine, can be easily transferred and applied by potential users to other regions for the same purpose.
With this approach, we were able to map the aquaculture ponds with very high accuracy along the coastal region of Vietnam. The successful implementation of our approach indicates that median radar backscatter with the dual-polarized (VV + VH) is efficient for extracting water bodies. However, the accurate mapping of aquaculture ponds needs more information such as geometry and texture to remove other objects with a similar return on the radar backscatter. Our approach is designed to fill the need for accurate mapping of aquaculture ponds and can be applied from a local to regional scale.
Author Contributions
Conceptualization, Z.S. and J.L.; Methodology, Z.S. and J.L.; Software, Z.S.; Validation, L.L. and J.Y.; Formal analysis, J.Y.; Resources, L.Z.; Writing—original draft preparation, Z.S.; Writing—review and editing, J.L., Q.Y., and K.X.; Supervision, J.L.; Funding acquisition, L.Z. All authors have read and agreed to the published version of the manuscript.
Funding
This research was funded by the Strategic Priority Research Program of the Chinese Academy of Sciences, grant number XDA19030302, the National Natural Science Foundation of China, grant number 41971314 and the Major Science and Technology Program for Water Pollution Control and Treatment, grant number 2017ZX07603001.
Acknowledgments
We would also like to thank ESA for providing free access to the Sentinel-1 radar data; the USGS for providing the free global SRTMGL1 1 arc second data; the AIRI for the high resolution coastline dataset; and the Google Earth Engine platform for providing access to the Sentinel-1 data processing.
Conflicts of Interest
The authors declare no conflict of interest.
References
- Stiller, D.; Ottinger, M.; Leinenkugel, P. Spatio-Temporal Patterns of Coastal Aquaculture Derived from Sentinel-1 Time Series Data and the Full Landsat Archive. Remote Sens. 2019, 11, 1707. [Google Scholar] [CrossRef] [Green Version]
- Food and Agriculture Organization (FAO). The State of World Fisheries and Aquaculture 2016; FAO: Rome, Italy, 2016. [Google Scholar]
- Joffre, O.M.; Poortvliet, P.M.; Klerkx, L. To cluster or not to cluster farmers? Influences on network interactions, risk perceptions, and adoption of aquaculture practices. Agric. Syst. 2019, 173, 151–160. [Google Scholar] [CrossRef]
- Porporato, E.M.D.; Pastres, R.; Brigolin, D. Site Suitability for Finfish Marine Aquaculture in the Central Mediterranean Sea. Front. Mar. Sci. 2020, 6, 772. [Google Scholar] [CrossRef] [Green Version]
- Ottinger, M.; Clauss, K.; Kuenzer, C. Aquaculture: Relevance, distribution, impacts and spatial assessments—A review. Ocean Coast. Manag. 2016, 119, 244–266. [Google Scholar] [CrossRef]
- Afroz, T.; Alam, S. Sustainable shrimp farming in Bangladesh: A quest for an Integrated Coastal Zone Management. Ocean Coast. Manag. 2013, 71, 275–283. [Google Scholar] [CrossRef]
- Dewalt, B.R.; Vergne, P.; Hardin, M. Shrimp Aquaculture Development and the Environment: People, Mangroves and Fisheries on the Gulf of Fonseca, Honduras. World Dev. 1996, 24, 1193–1208. [Google Scholar] [CrossRef]
- Peng, Y.; Chen, G.; Li, S.; Liu, Y.; Pernetta, J.C. Use of degraded coastal wetland in an integrated mangrove–aquaculture system: A case study from the South China Sea. Ocean Coast. Manag. 2013, 85, 209–213. [Google Scholar] [CrossRef]
- Burford, M.A.; Costanzo, S.D.; Dennison, W.C.; Jackson, C.J.; Jones, A.B.; McKinnon, A.D.; Preston, N.P.; Trott, L.A. A synthesis of dominant ecological processes in intensive shrimp ponds and adjacent coastal environments in NE Australia. Mar. Pollut. Bull. 2003, 46, 1456–1469. [Google Scholar] [CrossRef] [Green Version]
- Loisel, H.; Vantrepotte, V.; Ouillon, S.; Ngoc, D.D.; Herrmann, M.; Tran, V.; Mériaux, X.; Dessailly, D.; Jamet, C.; Duhaut, T.; et al. Assessment and analysis of the chlorophyll- a concentration variability over the Vietnamese coastal waters from the MERIS ocean color sensor (2002–2012). Remote Sens. Environ. 2017, 190, 217–232. [Google Scholar] [CrossRef]
- Nguyen, T.T.N.; Nemery, J.; Gratiot, N.; Strady, E.; Tran, V.Q.; Nguyen, A.T.; Aime, J.; Peyne, A. Nutrient dynamics and eutrophication assessment in the tropical river system of Saigon—Dongnai (southern Vietnam). Sci. Total Environ. 2019, 653, 370–383. [Google Scholar] [CrossRef]
- Troell, M.; Rönnbäck, P.; Halling, C.; Kautsky, N.; Buschmann3, A. Ecological engineering in aquaculture: Use of seaweeds for removing nutrients from intensive mariculture. J. Appl. Phycol. 1999, 11, 89–98. [Google Scholar] [CrossRef]
- Ren, C.; Wang, Z.; Zhang, Y.; Zhang, B.; Chen, L.; Xi, Y.; Xiao, X.; Doughty, R.B.; Liu, M.; Jia, M.; et al. Rapid expansion of coastal aquaculture ponds in China from Landsat observations during 1984–2016. Int. J. Appl. Earth Obs. Geoinf. 2019, 82, 101902. [Google Scholar] [CrossRef]
- Duan, Y.; Li, X.; Zhang, L.; Chen, D.; Liu, S.A.; Ji, H. Mapping national-scale aquaculture ponds based on the Google Earth Engine in the Chinese coastal zone. Aquaculture 2020, 520, 734666. [Google Scholar] [CrossRef]
- Alexandridis, T.K.; Topaloglou, C.A.; Lazaridou, E.; Zalidis, G.C. The performance of satellite images in mapping aquacultures. Ocean Coast. Manag. 2008, 51, 638–644. [Google Scholar] [CrossRef]
- Ottinger, M.; Kuenzer, C.; Liu, G.; Wang, S.; Dech, S. Monitoring land cover dynamics in the Yellow River Delta from 1995 to 2010 based on Landsat 5 TM. Appl. Geogr. 2013, 44, 53–68. [Google Scholar] [CrossRef]
- Sridhar, P.N.; Surendran, A.; Ramana, I.V. Auto-extraction technique-based digital classification of saltpans and aquaculture plots using satellite data. Int. J. Remote Sens. 2008, 29, 313–323. [Google Scholar] [CrossRef]
- Fu, Y.; Deng, J.; Ye, Z.; Gan, M.; Wang, K.; Wu, J.; Yang, W.; Xiao, G. Coastal Aquaculture Mapping from Very High Spatial Resolution Imagery by Combining Object-Based Neighbor Features. Sustainability 2019, 11, 637. [Google Scholar] [CrossRef] [Green Version]
- Li, F.; Liu, K.; Tang, H.; Liu, L.; Liu, H. Analyzing Trends of Dike-Ponds between 1978 and 2016 Using Multi-Source Remote Sensing Images in Shunde District of South China. Sustainability 2018, 10, 3504. [Google Scholar] [CrossRef] [Green Version]
- Proisy, C.; Viennois, G.; Sidik, F.; Andayani, A.; Enright, J.A.; Guitet, S.; Gusmawati, N.; Lemonnier, H.; Muthusankar, G.; Olagoke, A.; et al. Monitoring mangrove forests after aquaculture abandonment using time series of very high spatial resolution satellite images: A case study from the Perancak estuary, Bali, Indonesia. Mar. Pollut. Bull. 2018, 131, 61–71. [Google Scholar] [CrossRef] [Green Version]
- Ren, C.; Wang, Z.; Zhang, B.; Li, L.; Chen, L.; Song, K.; Jia, M. Remote Monitoring of Expansion of Aquaculture Ponds Along Coastal Region of the Yellow River Delta from 1983 to 2015. Chin. Geogr. Sci. 2018, 28, 430–442. [Google Scholar] [CrossRef] [Green Version]
- Virdis, S.G. An object-based image analysis approach for aquaculture ponds precise mapping and monitoring: A case study of Tam Giang-Cau Hai Lagoon, Vietnam. Environ. Monit. Assess. 2014, 186, 117–133. [Google Scholar] [CrossRef] [PubMed]
- Zhang, T.; Yang, X.; Hu, S.; Su, F. Extraction of Coastline in Aquaculture Coast from Multispectral Remote Sensing Images: Object-Based Region Growing Integrating Edge Detection. Remote Sens. 2013, 5, 4470–4487. [Google Scholar] [CrossRef] [Green Version]
- Cheng, B.; Liang, C.; Liu, X.; Liu, Y.; Ma, X.; Wang, G. Research on a novel extraction method using Deep Learning based on GF-2 images for aquaculture areas. Int. J. Remote Sens. 2020, 41, 3575–3591. [Google Scholar] [CrossRef]
- Cui, B.; Fei, D.; Shao, G.; Lu, Y.; Chu, J. Extracting Raft Aquaculture Areas from Remote Sensing Images via an Improved U-Net with a PSE Structure. Remote Sens. 2019, 11, 2053. [Google Scholar] [CrossRef] [Green Version]
- Han, M.; Yang, X.; Jiang, E. An Extreme Learning Machine based on Cellular Automata of edge detection for remote sensing images. Neurocomputing 2016, 198, 27–34. [Google Scholar] [CrossRef]
- Hazarika, M.K.; Samarakoon, L.; Honda, K.; Thanwa, J.; Pongthanapanich, T.; Boonsong, K. Monitoring and impact assessment of shrimp farming in the East Coast of Thailand using remote sensing and GIS. Int. Arch. Photogramm. Remote Sens. 2000, 33, 504–511. [Google Scholar]
- Pattanaik, C.; Prasad, S.N. Assessment of aquaculture impact on mangroves of Mahanadi delta (Orissa), East coast of India using remote sensing and GIS. Ocean Coast. Manag. 2011, 54, 789–795. [Google Scholar] [CrossRef]
- Ottinger, M.; Clauss, K.; Kuenzer, C. Large-Scale Assessment of Coastal Aquaculture Ponds with Sentinel-1 Time Series Data. Remote Sens. 2017, 9, 440. [Google Scholar] [CrossRef] [Green Version]
- Arvor, D.; Daher, F.R.G.; Briand, D.; Dufour, S.; Rollet, A.-J.; Simões, M.; Ferraz, R.P.D. Monitoring thirty years of small water reservoirs proliferation in the southern Brazilian Amazon with Landsat time series. ISPRS J. Photogramm. Remote Sens. 2018, 145, 225–237. [Google Scholar] [CrossRef]
- Jayanthi, M.; Thirumurthy, S.; Nagaraj, G.; Muralidhar, M.; Ravichandran, P. Spatial and temporal changes in mangrove cover across the protected and unprotected forests of India. Estuar. Coast. Shelf Sci. 2018, 213, 81–91. [Google Scholar] [CrossRef]
- Obida, C.B.; Blackburn, G.A.; Whyatt, J.D.; Semple, K.T. River network delineation from Sentinel-1 SAR data. Int. J. Appl. Earth Obs. Geoinf. 2019, 83, 101910. [Google Scholar] [CrossRef]
- Agnihotri, A.K.; Ohri, A.; Gaur, S.; Shivam; Das, N.; Mishra, S. Flood inundation mapping and monitoring using SAR data and its impact on Ramganga River in Ganga basin. Environ. Monit. Assess. 2019, 191, 760. [Google Scholar] [CrossRef] [PubMed]
- Ruzza, G.; Guerriero, L.; Grelle, G.; Guadagno, F.M.; Revellino, P. Multi-Method Tracking of Monsoon Floods Using Sentinel-1 Imagery. Water 2019, 11, 2289. [Google Scholar] [CrossRef] [Green Version]
- Schumann, G.J.P.; Neal, J.C.; Mason, D.C.; Bates, P.D. The accuracy of sequential aerial photography and SAR data for observing urban flood dynamics, a case study of the UK summer 2007 floods. Remote Sens. Environ. 2011, 115, 2536–2546. [Google Scholar] [CrossRef]
- Zhang, Y.; Zhang, G.; Zhu, T. Seasonal cycles of lakes on the Tibetan Plateau detected by Sentinel-1 SAR data. Sci. Total Environ. 2020, 703, 135563. [Google Scholar] [CrossRef] [PubMed]
- Ahmad, W.; Kim, D. Estimation of flow in various sizes of streams using the Sentinel-1 Synthetic Aperture Radar (SAR) data in Han River Basin, Korea. Int. J. Appl. Earth Obs. Geoinf. 2019, 83, 101930. [Google Scholar] [CrossRef]
- Ezquerro, P.; Tomas, R.; Bejar-Pizarro, M.; Fernandez-Merodo, J.A.; Guardiola-Albert, C.; Staller, A.; Sanchez-Sobrino, J.A.; Herrera, G. Improving multi-technique monitoring using Sentinel-1 and Cosmo-SkyMed data and upgrading groundwater model capabilities. Sci. Total Environ. 2020, 703, 134757. [Google Scholar] [CrossRef] [PubMed] [Green Version]
- Hornacek, M.; Wagner, W.; Sabel, D.; Truong, H.-L.; Snoeij, P.; Hahmann, T.; Diedrich, E.; Doubkova, M. Potential for High Resolution Systematic Global Surface Soil Moisture Retrieval via Change Detection Using Sentinel-1. IEEE J. Sel. Top. Appl. Earth Obs. Remote Sens. 2012, 5, 1303–1311. [Google Scholar] [CrossRef]
- Ottinger, M.; Clauss, K.; Kuenzer, C. Opportunities and challenges for the estimation of aquaculture production based on earth observation data. Remote Sens. 2018, 10, 1076. [Google Scholar] [CrossRef] [Green Version]
- Prasad, K.; Ottinger, M.; Wei, C.; Leinenkugel, P. Assessment of Coastal Aquaculture for India from Sentinel-1 SAR Time Series. Remote Sens. 2019, 11, 357. [Google Scholar] [CrossRef] [Green Version]
- Singha, M.; Dong, J.; Zhang, G.; Xiao, X. High resolution paddy rice maps in cloud-prone Bangladesh and Northeast India using Sentinel-1 data. Sci. Data 2019, 6, 26. [Google Scholar] [CrossRef] [PubMed]
- Food and Agriculture Organzation (FAO). The State of World Fisheries and Aquaculture 2018; FAO: Rome, Italy, 2018. [Google Scholar]
- Veettil, B.K.; Quang, N.X.; Thu Trang, N.T. Changes in mangrove vegetation, aquaculture and paddy cultivation in the Mekong Delta: A study from Ben Tre Province, southern Vietnam. Estuar. Coast. Shelf Sci. 2019, 226, 106273. [Google Scholar] [CrossRef]
- Vo, T.Q.; Kuenzer, C.; Oppelt, N. How remote sensing supports mangrove ecosystem service valuation: A case study in Ca Mau province, Vietnam. Ecosyst. Serv. 2015, 14, 67–75. [Google Scholar] [CrossRef]
- Veettil, B.K.; Ward, R.D.; Quang, N.X.; Trang, N.T.T.; Giang, T.H. Mangroves of Vietnam: Historical development, current state of research and future threats. Estuar. Coast. Shelf Sci. 2019, 218, 212–236. [Google Scholar] [CrossRef]
- Tran, L.X.; Fischer, A. Spatiotemporal changes and fragmentation of mangroves and its effects on fish diversity in Ca Mau Province (Vietnam). J. Coast. Conserv. 2017, 21, 355–368. [Google Scholar] [CrossRef]
- Gorelick, N.; Hancher, M.; Dixon, M.; Ilyushchenko, S.; Thau, D.; Moore, R. Google Earth Engine: Planetary-scale geospatial analysis for everyone. Remote Sens. Environ. 2017, 202, 18–27. [Google Scholar] [CrossRef]
- Perrou, T.; Garioud, A.; Parcharidis, I. Use of Sentinel-1 imagery for flood management in a reservoir-regulated river basin. Front. Earth Sci. 2018, 12, 506–520. [Google Scholar] [CrossRef]
- Google Developers. Sentinel-1 Algorithms. Google Earth Engine API. 2019. Available online: http://develpoers.google.com/earth-engine/Sentinel1 (accessed on 6 February 2019).
- Jia, S.; Xue, D.; Li, C.; Zheng, J.; Li, W. Study on new method for water area information extraction based on Sentinel—1 data. Yangtze River 2019, 50, 5. [Google Scholar]
- Samet, H. Connected component labeling using quadtrees. JACM 1981, 28, 15. [Google Scholar] [CrossRef] [Green Version]
- Chen, Y.Q.; Nixon, M.S.; Thomas, D.W. Statistical geometrical features for texture classification. Pattern Recognit. 1995, 28, 16. [Google Scholar] [CrossRef]
- Mao, D.; Wang, Z.; DU, B.; Li, L.; Tian, Y.; Jia, M.; Zeng, Y.; Song, K.; Jiang, M.; Wang, Y. National wetland mapping in China: A new product resulting from objectbased and hierarchical classification of Landsat 8 OLI images. ISPRS J. Photogramm. Remote Sens. 2020, 164, 15. [Google Scholar] [CrossRef]
- Montero, R.S. State of the art of compactness and circularity measures. Int. Math. Forum 2009, 4, 32. [Google Scholar]
- Haralick, R.M.; Shanmugam, K.; Dinstein, I.H. Textural features for image classification. IEEE Trans. Syst. Man Cybern. 1973, 6, 12. [Google Scholar] [CrossRef] [Green Version]
- Conners, R.W.; Trivedi, M.M.; Harlow, C.A. Segmentation of a high-resolution urban scene using texture operators. Comput. Vis. Graph. Image Process. 1984, 25, 38. [Google Scholar] [CrossRef]
- Sánchez-Ruiz, S.; Moreno-Martínez, Á.; Izquierdo-Verdiguier, E.; Chiesi, M.; Maselli, F.; Gilabert, M.A. Growing stock volume from multi-temporal landsat imagery through google earth engine. Int. J. Appl. Earth Obs. Geoinf. 2019, 83, 10. [Google Scholar] [CrossRef]
- Congalton, R.G.; Green, K. Assessing the Accuracy of Remotely Sensed Data: Principles and Practices; CRC Press: Boca Raton, FL, USA, 2019. [Google Scholar]
- Carrasquilla-Henao, M.; González Ocampo, H.A.; Luna González, A.; Rodríguez Quiroz, G. Mangrove forest and artisanal fishery in the southern part of the Gulf of California, Mexico. Ocean Coast. Manag. 2013, 83, 75–80. [Google Scholar] [CrossRef]
- Paezosuna, F. Shrimp aquaculture development and the environment in the Gulf of California ecoregion. Mar. Pollut. Bull. 2003, 46, 806–815. [Google Scholar] [CrossRef]
- Islam, M.S.; Jahangir Sarker, M.; Yamamoto, T.; Abdul Wahab, M.; Tanaka, M. Water and sediment quality, partial mass budget and effluent N loading in coastal brackishwater shrimp farms in Bangladesh. Mar. Pollut. Bull. 2004, 48, 471–485. [Google Scholar] [CrossRef]
Figure 1.
An overview of the study area and high-resolution Google Earth true-color images of aquaculture ponds in coastal Vietnam. (a) The study area and its six sub-regions. (b) Location of Vietnam. (c) Example spot of aquaculture ponds along the coastline in South Central Region. (d) Intensive aquaculture ponds in Mekong River Delta. (e) Aquaculture ponds in the intertidal zone in Northeast Region. (f) Aquaculture ponds in shallow water in the North Central Region. (g) Extensive aquaculture ponds in Mekong River Delta.
Figure 2.
Flowchart of the aquaculture pond extraction procedure. The data (blue boxes) were used to produce the map of coastal aquaculture ponds (orange box) through four major steps (green boxes).
Figure 2.
Flowchart of the aquaculture pond extraction procedure. The data (blue boxes) were used to produce the map of coastal aquaculture ponds (orange box) through four major steps (green boxes).
Figure 3.
Distribution of training polygons (the number of aquaculture polygons and non-aquaculture polygons were 2500 and 1000, respectively) (a) and the validation sample points (the number of each class was 600) (b).
Figure 3.
Distribution of training polygons (the number of aquaculture polygons and non-aquaculture polygons were 2500 and 1000, respectively) (a) and the validation sample points (the number of each class was 600) (b).
Figure 4.
Decision tree for mapping potential aquaculture ponds with geometric and texture features (Note: Y = Yes; N = No).
Figure 4.
Decision tree for mapping potential aquaculture ponds with geometric and texture features (Note: Y = Yes; N = No).
Figure 5.
Flowchart of extracting hill shades. Note: White areas are the regions where hillshade exists.
Figure 5.
Flowchart of extracting hill shades. Note: White areas are the regions where hillshade exists.
Figure 6.
Histogram of hillshade gray in the regions of interest.
Figure 7.
Schematic flowchart of removing streams from potential aquaculture ponds. (a) Schematic diagram of discontinuous streams (A, B and C are discontinuous streams with a similar shape as aquaculture ponds); (b) the result of dilation; (c) the result of erosion; (d) continuous streams.
Figure 7.
Schematic flowchart of removing streams from potential aquaculture ponds. (a) Schematic diagram of discontinuous streams (A, B and C are discontinuous streams with a similar shape as aquaculture ponds); (b) the result of dilation; (c) the result of erosion; (d) continuous streams.

Figure 8.
Schematic flowchart of isolated patch deletion. (a) Schematic diagram of the distribution of aquaculture ponds (A) and isolated ponds (B and C) (b) buffer all ponds with 50 m; (c) examine whether there are ponds within the buffer zone; (d) remove ponds with no other ponds falling in its buffer zone.

Figure 9.
Resultant maps of the extraction process for some potential aquaculture ponds. (a) Original VV image (data acquired by 1/4/2020); (b) median image of VV band; (c) SDWI image; (d) Histogram of SDWI, a threshold was obtained to differentiate. (e) The segmentation result of water bodies (colors); (f) potential aquaculture ponds (white).
Figure 10.
Two examples (A,B) of classification results of aquaculture ponds and other water bodies in the Red River Delta.
Figure 10.
Two examples (A,B) of classification results of aquaculture ponds and other water bodies in the Red River Delta.

Figure 11.
Distribution of coastal aquaculture ponds in Vietnam in 2020. (a) Distribution across the whole study area; (b–d) show the three examples of the classification results of aquaculture ponds; (e–g) show the classification results overlapping the Sentinel-1 VV images.
Figure 11.
Distribution of coastal aquaculture ponds in Vietnam in 2020. (a) Distribution across the whole study area; (b–d) show the three examples of the classification results of aquaculture ponds; (e–g) show the classification results overlapping the Sentinel-1 VV images.
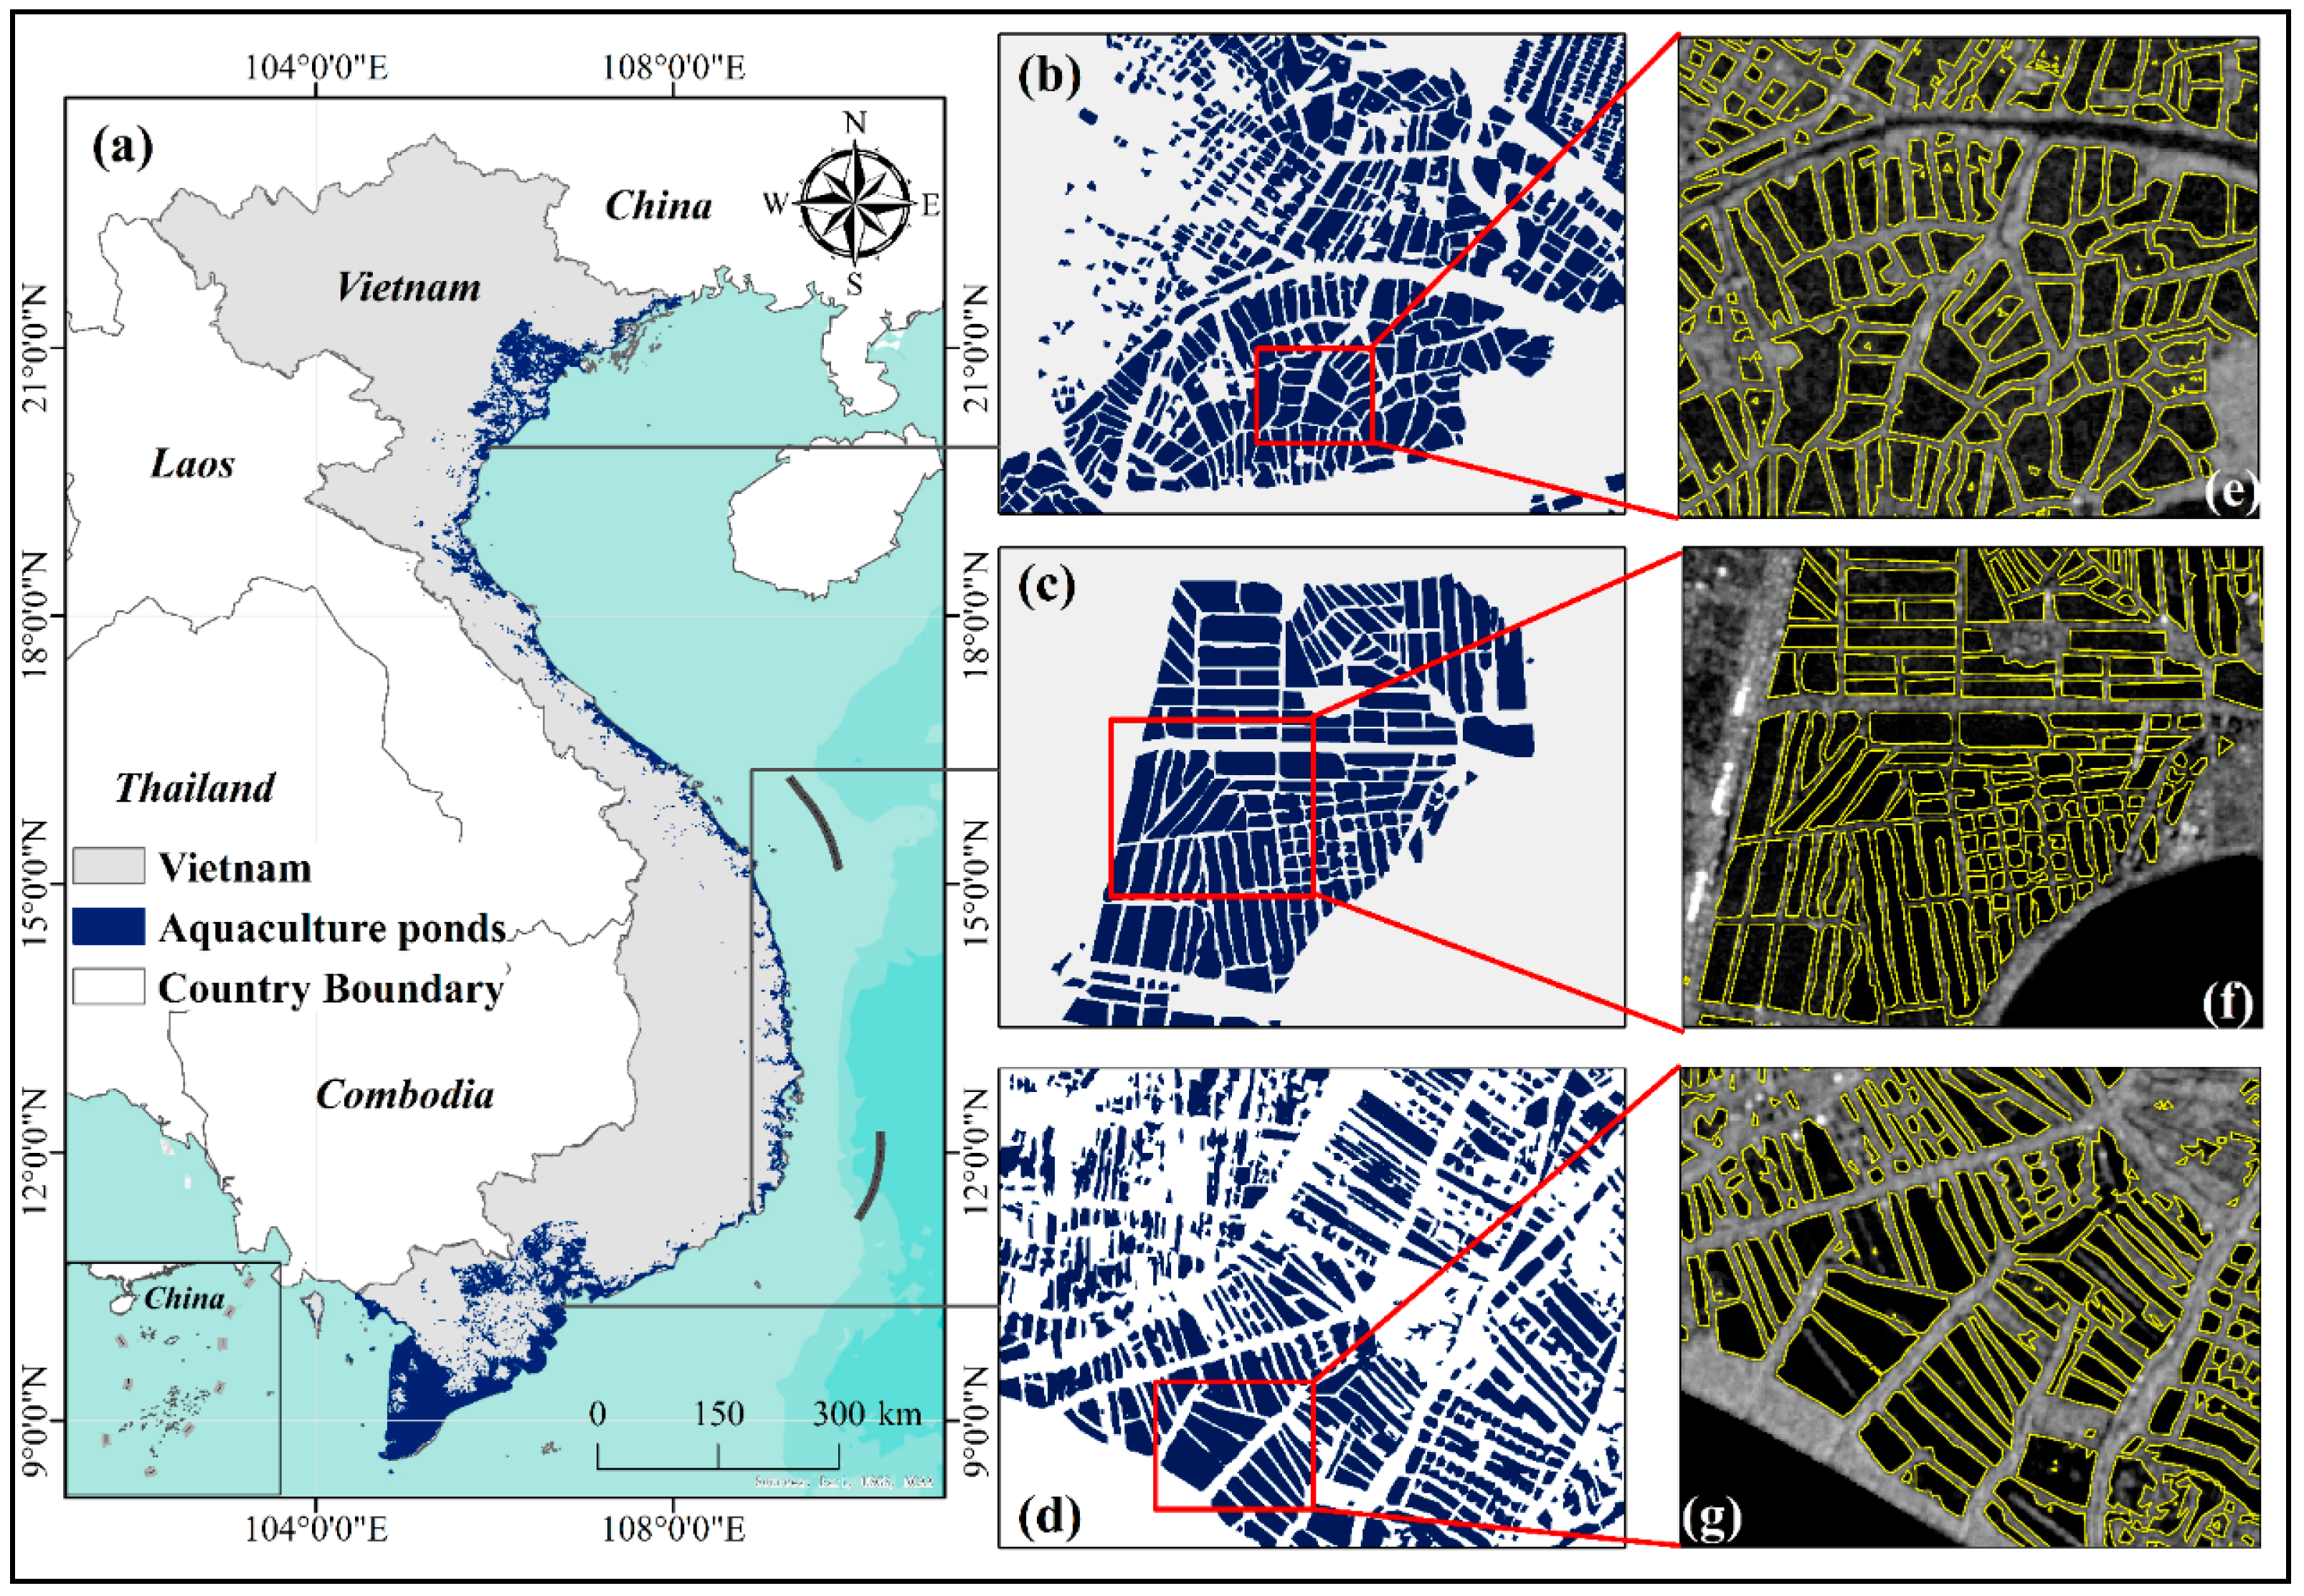
Figure 12.
(a) Aquaculture pond density (ha/km2) in the study area); proportional area of aquaculture ponds in different regions is shown in (b), and area of aquaculture ponds in every 1 km buffered zone from the coastline is shown in (c). Note: aquaculture density = aquaculture pond area/regional area.
Figure 13.
Potential influence of the distribution of coastal aquaculture ponds on offshore water quality. (a) Distribution of aquaculture ponds and chlorophyll-a concentration; (b) distribution of aquaculture ponds and particulate organic carbon; (c) distribution of aquaculture ponds and normalized fluorescence line height.


Table 1.
Geometric and texture features derived from water body objects.
| Feature/Metric | Description | References |
|---|---|---|
| Area | Number of pixels per object | [53] |
| Perimeter | Approximates the contour as a line through the centers of border pixels using a 4-connectivity | [53] |
| Extent ratio | Ratio of pixels in the object to pixels in the total bounding box | [53] |
| Shape index | Border length feature of image object divided by four times the square root of its area | [54] |
| Compactness | Degree to which an object is compact | [55] |
| SWSI | The sum of the sum average of VV and VH median images | [58] |
Table 2.
Statistical parameters of the features derived from the training polygons.
| Classes | Area | ER | Compactness | SI | SWSI | |||||
|---|---|---|---|---|---|---|---|---|---|---|
| M | SD | M | SD | M | SD | M | SD | M | SD | |
| Aquaculture ponds (2500) | 819 | 215 | 0.56 | 0.13 | 0.88 | 0.86 | 1.06 | 0.36 | −72.9 | 3.5 |
| Non-aquaculture (1000) | 14000 | 504 | 0.69 | 0.18 | 1.96 | 1.29 | 0.57 | 0.21 | −78.2 | 6.3 |
Table 3.
Accuracy assessment for the two classes including aquaculture and non-aquaculture. Producer’s accuracy (PA), user’s accuracy (UA), overall accuracy (OA), and Kappa.
Table 3.
Accuracy assessment for the two classes including aquaculture and non-aquaculture. Producer’s accuracy (PA), user’s accuracy (UA), overall accuracy (OA), and Kappa.
| Aquaculture | Non-Aquaculture | PA (%) | UA (%) | OA (%) | Kappa | |
|---|---|---|---|---|---|---|
| Aquaculture | 549 | 51 | 91.5 | 89.12 | 90.16 | 0.8 |
| Non-Aquaculture | 67 | 533 | 88.83 | 91.27 |
© 2020 by the authors. Licensee MDPI, Basel, Switzerland. This article is an open access article distributed under the terms and conditions of the Creative Commons Attribution (CC BY) license (http://creativecommons.org/licenses/by/4.0/).
Share and Cite
MDPI and ACS Style
Sun, Z.; Luo, J.; Yang, J.; Yu, Q.; Zhang, L.; Xue, K.; Lu, L. Nation-Scale Mapping of Coastal Aquaculture Ponds with Sentinel-1 SAR Data Using Google Earth Engine. Remote Sens. 2020, 12, 3086. https://doi.org/10.3390/rs12183086
AMA Style
Sun Z, Luo J, Yang J, Yu Q, Zhang L, Xue K, Lu L. Nation-Scale Mapping of Coastal Aquaculture Ponds with Sentinel-1 SAR Data Using Google Earth Engine. Remote Sensing. 2020; 12(18):3086. https://doi.org/10.3390/rs12183086
Chicago/Turabian StyleSun, Zhe, Juhua Luo, Jingzhicheng Yang, Qiuyan Yu, Li Zhang, Kun Xue, and Lirong Lu. 2020. "Nation-Scale Mapping of Coastal Aquaculture Ponds with Sentinel-1 SAR Data Using Google Earth Engine" Remote Sensing 12, no. 18: 3086. https://doi.org/10.3390/rs12183086
Note that from the first issue of 2016, this journal uses article numbers instead of page numbers. See further details here.