Areal Extent of Dust Emission Events and Source Geomorphology in Northern Africa from MSG-SEVIRI Data

1
Geological Survey of Israel, 32 Yeshayahu Leibowitz St., Jerusalem 9692100, Israel
2
Department of Geography and Environmental Development, Ben-Gurion University of the Negev, Beer Sheva 84105, Israel
*
Author to whom correspondence should be addressed.
Remote Sens. 2020, 12(17), 2775; https://doi.org/10.3390/rs12172775
Submission received: 28 July 2020
/
Revised: 21 August 2020
/
Accepted: 22 August 2020
/
Published: 26 August 2020
(This article belongs to the Special Issue Advances in Measurements and Modeling of the Earth’s Mineral Dust Source Regions)
Abstract
:In this study we (1) mapped the areal extent of current dust sources over Northern Africa between 8°W–31°E and 22°N - Mediterranean coast; and (2) identified and characterized the geomorphic units and soil types that emit dust from these areas. We used the full resolution (3 km) data from the MSG-SEVIRI to map dust sources over a 2-year period between 2005–2006, and examined these regions with remotely sensed images and geomorphic and soil maps. A total of >2600 individual dust emission events were mapped; with frequency up to 34 events in the 2-year study period. The areal extent of dust emission sources exhibited a lognormal distribution with most sources ranging from 20 to 130 km2. Most dust events were singular and related to a variety of specific geomorphic units. Dust events that created hotspots were mostly located over playas and fluvial landforms, and to a lesser extent over sand dunes and anthropogenic affected regions. About 20% of dust hotspots were offset a few kilometers from clear geomorphic units. Quantitative analysis of emissions revealed that dust sourced from various geomorphic units, among them playas (12%) and fluvial systems (10%). The importance of sand dunes as dust-emission sources greatly differs between examined datasets (7% vs. 30%). Our study emphasizes the importance of scattered dust emission events that are not considered as hotspots, as these sources are usually neglected in dust emission modeling.
1. Introduction
Mineral dust is a key element in controlling physical and biogeochemical exchanges among the atmosphere, land and ocean [1,2,3,4]. In order to estimate past, current and future impacts of dust on the climate and on the environment, quantitative data on the chemical, physical and optical properties of dust are necessary [5]. As these characteristics differ between regions of dust sources, and affect dust emission, the knowledge of the geomorphology of sources of dust is crucial to accurately model the dust cycle [6,7,8].
The Sahara Desert is considered the world’s largest dust source [8,9,10,11,12,13,14,15]. Field studies and remote sensing (RS) techniques were used in the past to identify specific dust sources within the region. Early RS studies defined sources of dust emissions from North Africa based on the TOMS (total ozone mapping spectrometer) sensor, with spatial and temporal resolution of 1° and 1 day, respectively, and concluded that most sources are located in topographic depressions containing dry lake deposits and playas in arid regions [15,16]. More recent studies used higher resolution RS data from the Meteosat Second Generation—Spinning Enhanced Visible and Infrared Imager (MSG-SEVIRI, 3 km, 15 min) to produce dust activation frequency map in a 1° (~111 km) spatial resolution and showed that the low temporal resolution sensors (i.e., TOMS) shift the location of identified dust sources by tens of kilometers and more [17,18]. Crouvi et al. [5] spatially correlated the latter results with a global soil map and showed that dust is being emitted mostly from sand dunes, leptosols, calcisols, arenosols and rock debris. However, despite these recent advances, our understanding of dust-source geomorphology and the accurate identification of dust sources over North Africa remains loosely constrained. These knowledge gaps are mainly due to usage of coarse spatial resolution data (1°) for identification and characterization dust sources, a scale that is greater than the scale of most landforms. Thus, most previous identification could not resolve between several geomorphic units within the emitting area [5,17]. Identification of dust sources using higher spatial resolution is required in order to accurately identify the landforms that emit dust, as was previously done in Australia [19] and South Africa [20]. Yet, in these studies the geomorphic units that emit dust were determined by overlying a RS-based identification of point-source dust emission on a geomorphological map; thus, the areal dimension of the dust emission events was mostly neglected in previous studies.
Recently, Ashpole and Washington [21] utilized the full resolution of the MSG-SEVIRI sensor (3 km) and developed an automated detection method for dust sources over central and western Sahara. Their resulting dust-source frequency map pinpointed 15 key dust source locations; most of which were identified as paleolakes and outwash plains [21]. However, this study did not cover the eastern Sahara and did not evaluate the geomorphology of other, less active dust sources.
In this study we: (1) Manually mapped current (2005–2006) dust sources over northern Africa, using the full resolution of the MSG-SEVIRI, and; (2) identified and characterized the geomorphic units and soil types that emit dust from these areas using qualitative and quantitative approaches, comparing dust emitting areas with RS images and global geomorphic and soil maps. Differently from previous studies that characterized dust geomorphology using dust-emission frequency maps, we calculated and analyzed the activity of dust emission events according to their respective emission area, and were thus able to shed new light on the areal dimensions of dust emission events.
2. Study Area and Methods
The study area covers the northern part of North Africa (4.24·106 km2) extending from 8°W in the west to 31°E in the east and from 22°N in the south to the Mediterranean coast in the north (Figure 1). This area is not considered the main source of dust in northern Africa and thus was less studied in the past. It is located north of the well-studied East-West Saharan dust belt at 15°N–23°N. The study area consists of various landforms, including mountain ranges, vast sand seas, alluvial fans, wadis and ephemeral lakes/playas within topographic lows and valleys [22].
Dust plumes were identified using SEVIRI images over a 2 year period (718 days), from January 2005 to December 2006, obtained from EUMETSAT [23]. We used the dust index developed by Ackerman et al. [24], Sokolilk et al. [25] and Lensky et al. [26]. The index uses three IR (infra-red) channels (8.7 µm, 10.8 µm, 12.0 µm) to emphasize dust plumes in the images. A composite image for dust detection was constructed using brightness temperature differences (BTD): 12.0 µm–10.8 µm, 10.8 µm–8.7 µm and 10.8 µm [17]. For easier identification of dust plumes, single composite images were assembled into a short video clip spanning a period of one week. Each identified dust plume was traced back to its source of emission, which was delineated using the full spatial resolution of the SEVIRI. The date and time of each dust emission event were documented.
To map the frequency of dust emission, we summed the frequencies of all dust emission events (represented by the individual polygons) in each 3 × 3 km pixel. From this frequency grid we created contours using inverse distance weighted interpolation, with an interval of 2 dust emissions, to make visual identification of the geomorphic features easier using Google Earth (Figure 2). We then qualitatively examined the geomorphic features that are located over the most frequent emitting areas (>2 storms in 2 years; note that this examination does not include all the events of dust emission that were identified). We classified the geomorphic units into 4 main groups: Fluvial system, playa units, sand dunes, and anthropogenic affected areas. This classification is partly subjective, especially when few geomorphic units appear in the same region. We chose the most abundant unit as representative.
To quantitatively examine the geomorphology of all emitting areas (not only the most frequent ones), we calculated the area of each dust emitting polygon and quantitatively correlated these polygons with three different geomorphic and soil datasets:
- The Land Surface Map (LSM), made available in raster form by Parajuli and Zender [27]. The LSM was originally developed by visually mapping the Middle East and North Africa regions according to land cover classes with high resolution Google Earth Pro images [28]. These polygons were used as training samples for a global supervised classification (500 m pixel) that used the maximum likelihood method applied to the global Blue Marble (MODIS RGB) image mosaic [27].
- The soil map of the Harmonized World Soil Database (HWSD) [29]. This digital, GIS-based soil map (1 km spatial resolution) was compiled from global and regional soil maps, originally at scales of 1:1,000,000 to 1:5,000,000, and it holds information on the dominant soil type or geomorphic unit of each mapping unit. Following Crouvi et al. [5], we used several soil types as proxies for geomorphic units, for example, solonetz and solonchaks are usually playa or sabkha soils, rich in soluble salts and clays; arenosols are quartz-rich sandy soils [30].
- A combined map of the LSM and HWSD datasets mentioned above (defined here as “LSM-HWSD”). We found that both datasets either over- or under-estimate specific mapping units in northern Africa. Through a detailed comparison of these maps with visual interpretation of Google Earth images in specific regions, we found that: (a) The LSM overestimate sand dunes coverage comparing the HWSD (42% vs. 17%, respectively). This overestimation is partly related to the absence of a loess deposits category in the LSM [27], in which these sediments are probably partly classified as sand dunes. (b) Playa units (defined in the LSM as “Playa/Sabkha” unit, and in the HWSD as solonetz, solonchaks, salt flats and gypsisols) generally cover similar percentage for the two datasets, with slightly greater coverage for the HWSD comparing the LSM (4.5% vs. 4.2%, respectively); however, these areas do not fully overlap—visual inspection revealed that many small playas were not identified correctly by the LSM as opposed to the HWSD. c) The HWSD underestimates fluvial systems compared to the LSM (defined as “fluvial system” in the LSM, and as “Fluvisols” in the HWSD, coverage of 2.0% vs. 3.5%, respectively). Thus, to compensate for these three identified inaccuracies, we copied the units that represent playas and fluvial systems from the HWSD and pasted them into the LSM, keeping all other polygons of the LSM unchanged. The combined databases (LSM-HWSD) resulted in a more realistic representation of the geomorphic units considered herein (sand dunes 39.0%, playa units 8.0%, fluvial systems 6.0%) (Table S1, Supplementary Material). Thus, in this paper we assume that the LSM-HWSD is an improved version of the LSM.
For each geomorphic/soil dataset we summed the total areas that emit dust for each mapping unit to examine the contribution of each geomorphic/soil unit as a dust-emitting area. GIS analysis was carried out using Arc-Map software, version 10.7.1 (ESRI, Redlands, CA, USA).
3. Results
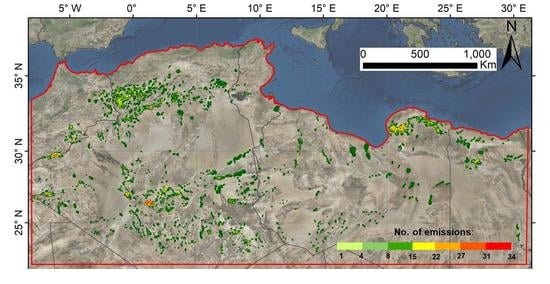
During the examined 2 years, 2653 individual dust emission events were detected and mapped over the study area. Overall, dust was emitted from total area of ~303,000 km2, about 7% of the study area (Figure 1), with event frequency reaching up to 34 events during the 2 years studied period. In general, dust emissions are scattered over the study area, but few concentrations of emissions (hot spots) were identified in the following regions: (1) northwestern Algeria along the Moroccan border, near the villages of Brezina, Ramlia, and Mahamid (A, B, C, D in Figure 1) located along the southern slopes of the Atlas Mountains. This region is characterized by small playas, floodplains, wide wadis, sand dunes, and agriculture fields; (2) Central Algeria, with most emissions originating near the village of Adrar (Ahaggar Mountains; Area E in Figure 1,). Emissions were detected originating from multiple geomorphic units: Playas, sand dunes edges, and agricultures fields; and (3) northeastern Libya adjacent to the Mediterranean coast (F in Figure 1); most emissions originate from the foothills of Al-Akhdar Mountains (400–700 m asl), characterized by playas, alluvial fans, wadis and agricultural fields.
Analysis of the areal extent of all dust emission events reveals a lognormal distribution (Figure 3). Emission sources range in area from 4 to 2585 km2, with a median value of 74 km2. About 50% of these polygons are found in a narrow range of 30–80 km2; 75% of them range between 20–130 km2.
3.1. Qualitative Analysis of the Geomorphic Units in Hotspots
We found 178 localities that emitted 2 events or more, termed here as dust hot spots. These regions account for 1029 individual dust events, or 39% of the total number of dust events recorded. Thus, most of dust events (61%) occurred in locations where a single dust emission event was recorded during the examined 2 years.
Most (83%) of the hot spots (=>2 dust events) are located directly over profound geomorphic units that can explain the observed high frequency of dust emission (Figure 4). The rest (17%) are found a few kilometers away from a geomorphic unit that is assumed to be the source of emission. This offset ranges from 1.5 km to 14.0 km, with an average value of 7.7 ± 3.3 km (Figure 5).
Visual classification of the geomorphic units for each hotspot (assigning the offset geomorphic unit as the emitting unit) revealed that most (75%) dust-emission sources were either playas or fluvial features, almost equally distributed (Table 1). The rest of the dust-emission sources in the examined hotspots were either sand dunes or anthropogenic affected regions.
The singular dust events cover various geomorphic units, among them playas, sand fields, wadis and anthropogenic regions (Figure 6). An example to the nature of scattered, singular dust sources can be seen in the foothills of the eastern slopes of the Atlas Mountains, where multiple singular dust emission events were recorded originating mostly from elongated (~30 km long, 10 km wide) playas.
3.2. Quantitative Analysis of All Dust Emitting Areas
Analyses of the relative contribution of different soil types and geomorphic units to the total area of dust emission (Table 2) reveal that for the LSM, the unit with the highest emitting area is sand deposit (35.2%), followed by a unit termed as “sand deposit on bedrock” (30.0%) and stony surfaces (16.6%). Sand deposit on bedrock refers to “bedrock visible between dunes” [28], and not to continuous sand dunes. Playa units contribute 4.4% and fluvial units only 2.0%. The combined LSM-HWSD datasets exhibit lower percentages for the sand deposit, sand deposit on bedrock and stony surfaces (29.8%, 25.3% and 12.8%, respectively) and significantly higher percentages for the playa units (12.2%) and the fluvial units (10.0%). Analysis of the HWSD mapping units indicates that most emissions originate from regions covered by calcisols (52.0%), followed by leptosols (14.3%). Playa units (8.5%) and fluvisols (8.2%) are almost equal, whereas sand dunes comprise only 6.7% of the total emission area (Table 3).
4. Discussion
4.1. Scattered Dust Sources Versus Hot Spots
A striking key finding of this study is the scattered nature of dust sources, which comprise ~7% of the studied areas and are located in specific geographic regions, as was noted by previous studies [15,18,21] (Figure 1). However, more than half (61%) of the 2653 identified dust events do not spatially overlap with other dust events. These singular emission events occur within various geomorphic units. About 39% of the dust events do overlap (=> 2 events) to produce hotspots which are largely related to specific and geomorphic units of either playas, fluvial landforms, sand dunes and anthropogenic surfaces. While playas and wadis are abundant as both hotspots and scattered sources, sand dunes appear more in scattered singular sources than as hotspots. Thus, our results suggest that dust-source geomorphology of hotspots might be different than that of scattered, singular sources.
Our results emphasize the importance of scattered dust emission events that are not considered as hotspots, as these sources are usually neglected in dust emission modeling, whereas the role of hotspots might be overestimated. The definition of dust hot spots is sensitive to the scale of source identification, i.e., two individual dust sources that are located a few kilometers apart and do not spatially overlap are to be defined as two distinct sources in this study, whereas the same sources will be defined as a single hotspot (of 2 events in this example) when using coarser pixel sizes. However, we stress that using km-scale spatial resolution data for mapping dust sources enables the spatial scale of dust sources to be adjusted as needed according to the required grid size; thus, enabling flexibility in applying different spatial datasets for modeling the dust cycle. This scale dependency is emphasized when comparing our results to previous studies that also used MSG-SEVIRI data, but stored the location of dust events in 1°X1° cells [5,17] (Figure 7). Using low spatial resolution grid cells increases the number of emissions per cell and thus more hotspots are identified. This also explains the relatively low frequency of dust events presented in this study compared to previous studies.
4.2. Area of Dust Emission Events
While most previous studies use a point-source approach to identify dust source geomorphology i.e., [21,29], our study provides one of the first assessments for the areal extent of dust emission events recorded using RS data. We found that most emissions originate from areas that cover few tens of square kilometers and are in agreement with the area of defined geomorphic units. For example, wide wadis (2–4 km width) that are common in North Africa and were found to emit individual dust events along 10–20 km stretches produce an emitting area of a few tens of square kilometers (Figure 2). Similar-size emission areas were observed over playas that are few kilometers in diameter (Figure 4). Emission areas that are greater than 300 km2 are limited (5% of total dust events).
We acknowledge that our manual identification and delineation of dust emission areas is subjective, based on visual identification of the pink colors associated with the presence of airborne dust. Previous studies showed how multiple atmospheric and surficial properties can modify these pink colors of desert dust in the RGB images used, among them: Levels of atmospheric water vapor, dust mineralogy and size, dust altitude, and viewing geometry (i.e., zenith angle) [31,32]. However, despite these limitations, visual comparison with RS images suggests that most size estimations agree with clear geomorphic features and thus can be considered reliable, although should be used with caution.
4.3. Source Identification Offsets
About 17% of the examined hotspots were found to be located a few kilometers away from the assumed geomorphic unit that emits dust. These offsets can be explained by two main properties of the MSG-SEVIRI: (1) Dust close to the surface (altitude < 1 km) is only likely to be apparent when the atmosphere is particularly dry and when the surface is particularly hot, which is not always the case [32]. Thus, low-altitude dust that was captured in the image a short time after being emitted will not always be identified, and will be apparent only after gaining higher altitude and greater distance from the source of dust. (2) Despite the high temporal resolution of the sensor, 15 min time lapse might cause a shift in the location of dust emission when using the full spatial resolution of the sensor (3 × 3 km). Similar findings were reported by Ashpole et al. [21] that stress that in some cases, dust movement occurred before the sensor could detect its emission.
Given that offsets were recognized in 17% of the examined dust emission hotspots, quantitative correlation between dust source identification through MSG-SEVIRI and soil/geomorphic datasets should be used with caution. Thus, the outcomes of such quantitative analysis, either manual or automatic, probably reflects the general dust source geomorphology correctly, but with some error or uncertainty for each category class that should be accounted for.
4.4. Dust Source Geomorphology—Quantitative Estimation
Dust source geomorphology found for the hotspots using qualitative analysis emphasize the role of playas and the fluvial system, and to a lesser degree, sand dunes and anthropogenic areas. However, the analysis of all dust emission events (hotspots and singular sources) highlights other geomorphic units; Moreover, the two datasets examined (LSM-HWSD and HWSD) present different results that will be discussed below.
Based on the LSM-HWSD dataset, sand deposit is the geomorphic unit that contributes most dust emissions in terms of areal extent (~30%). On the other hand, similar analysis based on the HWSD suggests that sand dunes contribute only ~7% of the total area of dust emission. This contradiction is most likely explained by the overestimation of sand dunes area coverage in the LSM; thus, the contribution of sand dunes in the study area is probably more close to the estimation based on HWSD rather than to the one based on the LSM-HWSD. Most dust emission from dunes was observed from dune edges; only few occur from central parts of the fields, as was also found by Ashpole et al. [21]. Active sand dunes were considered in the past as poor dust sources [15], but recent studies found that these large systems of unconsolidated sediments can provide dust through eolian abrasion of sand grains, through removing either sharp corners and/or clay coatings [5,33,34].
The second most important geomorphic unit according to the LSM-HWSD is sand deposit on bedrock (~25%). We relate this very broad category to various soil types, among them calcisols, leptosols and rock debris, the three main dust contributors found in the HWSD analysis. In terms of geomorphic units, the “sand deposit on bedrock” can include also loess deposits that are mostly located downwind to active and/or stable sand dunes [35].
Playas and fluvial-related units, that were found as the most important dust emitting units within the hotspots (~75%), were found to be less important when considering also singular events (~22% and ~17% for the LSM-HWSD and HWSD, respectively). However, when considering their limited areal distribution over the entire study area, their importance for all dust events is more emphasized [7,15,18,21,36]. These sources are mostly considered as supply-limited [7,10,36,37]. Here however we stress that these units emit dust mainly as hotspots; they are less abundant in scattered, singular dust sources.
Stony surfaces were found to emit dust over 12% of the area; as these geomorphic units are known to be not an important dust emission unit, we ascribe these as part of the error encounter in accurately allocating the dust event (see above), and/or to the accuracy of the LSM. Similar to the playa and fluvial–related units, the anthropogenic-related dust sources are also more abundant in dust hotspots (11–13% of total hotspots) than in the overall dust emission events (in the LSM-HWSD they consist of <0.1%; in the HWSD dataset, Anthrosols (human disturbed soils) do not appear in the study area). Within the dust hotspots, these emissions are related to farming and grazing, as previously suggested [7]. While oil drilling and related activities are common across the study area, we did not find them to contribute significant dust emission in the examined time period.
This study presents an improvement to previous studies that used coarse grid cell (1°) to identify dust geomorphology using the most abundant soil type (HWSD) in each grid cell as the one that emits dust from this cell [5]. Crouvi et al., [5] found that most dust is emitted from (in decreasing order) sand dunes, leptosols, calcisols, arenosols, and rock debris, different from the results of this study (Table 2). Whereas calcisols, leptosols and rock debris units are important in both studies, the current study exhibit lower percentage of sand dunes and arenosols, and higher percentage of playa units and fluvisols, compared to Crouvi et al., [5]. While part of the difference between these two studies can be explained by the improved assignment of dust source geomorphology due to the high spatial resolution used in the current study, another part is probably related to the spatial coverage of the studied areas: Whereas the study of Crouvi et al., [5] covered all of northern Africa, the Sahara and the Sahel, the current study focused on smaller portion of this area (about a quarter), and did not include the Sahel and NW Africa (Mauritania), which are known for their abundant and vast active and stabilized sand dunes, comprising some of the most active dust sources in the world.
5. Conclusions
In this study we developed and tested a new methodology for mapping dust sources at spatial resolution of 3 km/pixel using MSG-SEVIRI data. In a 2-year time period we identified and mapped 2653 individual dust emission events in northern Africa, covering an area of ~303,000 km2, with a frequency of up to 34 events. The areal extent of dust emissions exhibits a lognormal distribution; most emission areas range in size from 20 to 130 km2 with a median value of 74 km2. Most (61%) of these dust events are singular, whereas only 39% of total events create hotspots (=> 2 events). Visual inspection of dust-source geomorphology revealed that singular dust events cover various geomorphic units, whereas dust hotspots are located mostly over fluvial features and playas, and to a lesser extent over sand dunes and anthropogenic affected regions. About 20% of dust hotspots are offset a few kilometers from a clear geomorphic unit that is assumed to be the source of emission, suggesting that caution should be used in interpretation of quantitative estimation of dust source geomorphology. A correlation between dust-sources and geomorphic and soil maps revealed that sand dunes cover 7–30% of the total dust-emitting area and that playas and wadis cover 17–22%. Our study emphasizes the importance of scattered dust emission events that are not considered as hotspots, as these sources are usually neglected in dust emission modeling.
Supplementary Materials
The following are available online at https://www.mdpi.com/2072-4292/12/17/2775/s1, Table S1: Distribution of geomorphic units and soil types in the study area.
Author Contributions
Conceptualization and methodology, O.L.B., O.C. and D.G.B.; formal analysis, O.L.B.; writing—original draft preparation, O.L.B.; writing—review and editing, O.C. and D.G.B.; funding acquisition, O.C. and D.G.B. All authors have read and agreed to the published version of the manuscript.
Funding
This research and the APC were funded by the Israel Science Foundation (grant No. 1672/15).
Acknowledgments
We wish to thank Shiran Havivi, Aviv Lee Cohen-Zada, and Daniel Dar from the Earth and Planetary Image Facility, Ben-Gurion University of the Negev, and Adi Ben-Nun from the Hebrew University of Jerusalem for their assistance in data analyses. We thank the anonymous reviewers and the editor for improving the manuscript.
Conflicts of Interest
The authors declare no conflict of interest. The funders had no role in the design of the study; in the collection, analyses, or interpretation of data; in the writing of the manuscript, or in the decision to publish the results.
References
- Gillette, D.A. A qualitative geophysical explanation for hot spot dust emitting source regions. Contrib. Atmos. Phys. 1999, 72, 67–77. [Google Scholar]
- Harrison, S.P.; Kohfeld, K.E.; Roelandt, C.; Claquin, T. The role of dust in climate changes today, at the last glacial maximum and in the future. Earth Sci. Rev. 2001, 54, 43–80. [Google Scholar] [CrossRef]
- Mahowald, N.; Ballantine, J.; Feddema, J.; Ramankutty, N. Global trends in visibility: Implications for dust sources. Atmos. Chem. Phys. 2007, 7, 3309–3339. [Google Scholar] [CrossRef] [Green Version]
- Shao, Y.; Wyrwoll, K.-H.; Chappell, A.; Huang, J.; Lin, Z.; McTainsh, G.H.; Mikami, M.; Tanaka, T.Y.; Wang, X.; Yoon, S. Dust cycle: An emerging core theme in Earth system science. Aeolian Res. 2011, 2, 181–204. [Google Scholar] [CrossRef]
- Crouvi, O.; Schepanski, K.; Amit, R.; Gillespie, A.R.; Enzel, Y. Multiple dust sources in the Sahara Desert: The importance of sand dunes. Geophys. Res. Lett. 2012, 39, L13401. [Google Scholar] [CrossRef]
- Webb, N.P.; McGowan, H.A. Approaches to modelling land erodibility by wind. Prog. Phys. Geogr. 2009, 33, 587–613. [Google Scholar] [CrossRef]
- Ginoux, P.; Prospero, J.M.; Gill, T.E.; Hsu, N.C.; Zhao, M. Global-scale attribution of anthropogenic and natural dust sources and their emission rates based on MODIS Deep Blue aerosol products. Rev. Geophys. 2012, 50. [Google Scholar] [CrossRef]
- Okin, G.S.; Bullard, J.E.; Reynolds, R.L.; Ballantine, J.A.C.; Schepanski, K.; Todd, M.C.; Belnap, J.; Baddock, M.C.; Gill, T.E.; Miller, M.E. Dust: Small-scale processes with global consequences. EosTrans. Am. Geophys. Union 2011, 92, 241–242. [Google Scholar] [CrossRef]
- Bullard, J. Bridging the gap between field data and global models: Current strategies in aeolian research. Earth Surf. Process. Landf. 2010, 35, 496–499. [Google Scholar] [CrossRef] [Green Version]
- Bullard, J.E.; Harrison, S.P.; Baddock, M.C.; Drake, N.; Gill, T.E.; McTainsh, G.; Sun, Y. Preferential dust sources: A geomorphological classification designed for use in global dust–cycle models. J. Geophys. Res. Atmos. 2011, 116, 4034. [Google Scholar] [CrossRef] [Green Version]
- Engelstaedter, S.; Tegen, I.; Washington, R. North African dust emissions and transport. Earth Sci. Rev. 2006, 79, 73–100. [Google Scholar] [CrossRef]
- Huneeus, N.; Schulz, M.; Balkanski, Y.; Griesfeller, J.; Prospero, J.; Kinne, S.; Bauer, S.; Boucher, O.; Chin, M.; Dentener, F. Global dust model intercomparison in AeroCom phase I. Atmos. Chem. Phys. 2011, 11, 7781–7816. [Google Scholar] [CrossRef] [Green Version]
- Tanaka, T.Y.; Chiba, M. A numerical study of the contributions of dust source regions to the global dust budget. Glob. Planet. Chang. 2006, 52, 88–104. [Google Scholar] [CrossRef]
- Tegen, I.; Hollrig, P.; Chin, M.; Fung, I.; Jacob, D.; Penner, J. Contribution of different aerosol species to the global aerosol extinction optical thickness: Estimates from model results. J. Geophys. Res. 1997, 102, 23895–23915. [Google Scholar] [CrossRef]
- Prospero, J.M.; Ginoux, P.; Torres, O.; Nicholson, S.E.; Gill, T.E. Environmental characterization of global sources of atmospheric soil dust identified with the Nimbus 7 Total Ozone Mapping Spectrometer (TOMS) absorbing aerosol product. Rev. Geophys. 2002, 40, 1002. [Google Scholar] [CrossRef]
- Washington, R.; Todd, M.; Middleton, N.J.; Goudie, A. Dust-storm source areas determined by the Total Ozone Monitoring Spectrometer and surface observations. Ann. Assoc. Am. Geogr. 2003, 93, 297–313. [Google Scholar] [CrossRef]
- Schepanski, K.; Tegen, I.; Laurent, B.; Heinold, B.; Macke, A. A new Saharan dust source activation frequency map derived from MSG-SEVIRI IR-channels. Geophys. Res. Lett. 2007, 34, L18803. [Google Scholar] [CrossRef] [Green Version]
- Schepanski, K.; Tegen, I.; Macke, A. Saharan dust transport and deposition towards the tropical northern Atlantic. Atmos. Chem. Phys. 2009, 9, 1173–1189. [Google Scholar] [CrossRef] [Green Version]
- Baddock, M.C.; Bullard, J.E.; Bryant, R.G. Dust source identification using MODIS: A comparison of techniques applied to the Lake Eyre Basin, Australia. Remote Sens. Environ. 2009, 113, 1511–1528. [Google Scholar] [CrossRef] [Green Version]
- Vickery, K.J.; Eckardt, F.D.; Bryant, R.G. A sub-basin scale dust plume source frequency inventory for southern Africa, 2005–2008. Geophys. Res. Lett. 2013, 40, 5274–5279. [Google Scholar] [CrossRef] [Green Version]
- Ashpole, I.; Washington, R. A new high-resolution central and western Saharan summer time dust source map from automated satellite dust plume tracking. J. Geophys. Res. Atmos. 2013, 118, 6981–6995. [Google Scholar] [CrossRef]
- Ballantine, J.A.; Okin, G.S.; Prentiss, D.E.; Roberts, D.A. Mapping North African landforms using continental scale unmixing of MODIS imagery. Remote Sens. Environ. 2005, 97, 470–483. [Google Scholar] [CrossRef]
- Eumetsat. Available online: http://oiswww.eumetsat.org/WEBOPS/msginterpretation/index.html (accessed on 28 July 2020).
- Ackerman, S.A. Remote sensing aerosols using satellite infrared observations. J. Geophys. Res. Atmos. 1997, 102, 17069–17079. [Google Scholar] [CrossRef]
- Sokolik, I.N. The spectral radiative signature of wind-blown mineral dust: Implications for remote sensing in the thermal IR region. Geophys. Res. Lett. 2002, 29, 7-1–7-4. [Google Scholar] [CrossRef] [Green Version]
- Lensky, I.; Rosenfeld, D. Clouds-aerosols-precipitation satellite analysis tool (CAPSAT). Atmos. Chem. Phys. 2008, 8, 6739–6753. [Google Scholar] [CrossRef] [Green Version]
- Parajuli, S.P.; Zender, C.S. Connecting geomorphology to dust emission through high-resolution mapping of global land cover and sediment supply. Aeolian Res. 2017, 27, 47–65. [Google Scholar] [CrossRef]
- Parajuli, S.P.; Yang, Z.-L.; Kocurek, G. Mapping erodibility in dust source regions based on geomorphology, meteorology, and remote sensing. J. Geophys. Res. 2014, 119, 1977–1994. [Google Scholar] [CrossRef]
- Baddock, M.C.; Ginoux, P.; Bullard, J.E.; Gill, T.E. Do MODIS-defined dust sources have a geomorphological signature? Geophys. Res. Lett. 2016, 43, 2606–2613. [Google Scholar] [CrossRef] [Green Version]
- FAO. Available online: http://www.fao.org/soils-portal/soil-survey/soil-maps-and-databases/faounesco-soil-map-of-the-world/en/ (accessed on 28 July 2020).
- Brindley, H.; Knippertz, P.; Ryder, C.; Ashpole, I. A critical evaluation of the ability of the Spinning Enhanced Visible and Infrared Imager (SEVIRI) thermal infrared red-green-blue rendering to identify dust events: Theoretical analysis. J. Geophys. Res. Atmos. 2012, 117. [Google Scholar] [CrossRef] [Green Version]
- Banks, J.R.; Hünerbein, A.; Heinold, B.; Brindley, H.E.; Deneke, H.; Schepanski, K. The sensitivity of the colour of dust in MSG-SEVIRI Desert Dust infrared composite imagery to surface and atmospheric conditions. Atmos. Chem. Phys. 2019, 19, 6893–6911. [Google Scholar] [CrossRef] [Green Version]
- Bullard, J.E.; McTainsh, G.H.; Pudmenzky, C. Aeolian abrasion and modes of fine particle production from natural red dune sands: An experimental study. Sedimentology 2004, 51, 1103–1125. [Google Scholar] [CrossRef]
- Swet, N.; Elperin, T.; Kok, J.F.; Martin, R.L.; Yizhaq, H.; Katra, I. Can active sands generate dust particles by wind-induced processes? Earth Planet. Sci. Lett. 2019, 506, 371–380. [Google Scholar] [CrossRef] [Green Version]
- Crouvi, O.; Amit, R.; Enzel, Y.; Gillespie, A.R. The role of active sand seas in the formation of desert loess. Quat. Sci. Rev. 2010, 29, 2087–2098. [Google Scholar] [CrossRef]
- Feuerstein, S.; Schepanski, K. Identification of Dust Sources in a Saharan Dust Hot-Spot and Their Implementation in a Dust-Emission Model. Remote Sens. 2019, 11, 4. [Google Scholar] [CrossRef] [Green Version]
- Gherboudj, I.; Beegum, S.N.; Ghedira, H. Identifying natural dust source regions over the Middle-East and North-Africa: Estimation of dust emission potential. Earth Sci. Rev. 2017, 165, 342–355. [Google Scholar] [CrossRef]
Figure 1.
The study site in North Africa (red polygon) and the frequency mapping of >2600 individual dust emitting events between January 2005 and December 2006. Six main hotspots were defined. A-Brez’ina, B- Eastern slopes of the Atlas Mountains, C- Ramlia, D- Mahamid, E- Adrar, F- Al-Akhdar Mountains.

Figure 2.
The methodology of mapping dust source frequency, demonstrated at Wadi dlherir, South East Algeria. (A). Delineation of individual dust emissions areas from the MSG-SEVIRI data. (B). Interpolated contours of equal dust emission events based on a 3 km grid for the same area as A.
Figure 2.
The methodology of mapping dust source frequency, demonstrated at Wadi dlherir, South East Algeria. (A). Delineation of individual dust emissions areas from the MSG-SEVIRI data. (B). Interpolated contours of equal dust emission events based on a 3 km grid for the same area as A.

Figure 3.
Size distribution of dust emission areal extent (showing emission areas <400 km2).

Figure 4.
Qualitative examination of geomorphic units that are active dust hot spots. White contours and numbers represent number of dust emission events during the 2 year study period. (A). Outwash plain at Wadi Dra (Mahamid region), Algeria/Morocco border. (B). Outwash plain and agricultural fields near Sidi Ali Ramlia, Morocco/Algeria border.

Figure 5.
A spatial offset between a hot spot and a nearby playa that is the most likely geomorphic unit that emit dust in central Algeria, (A). south- and (B). southeast to Ein-Sahala.
Figure 5.
A spatial offset between a hot spot and a nearby playa that is the most likely geomorphic unit that emit dust in central Algeria, (A). south- and (B). southeast to Ein-Sahala.

Figure 6.
Dust emissions from scattered, singular sources. (A). Edges of vast sand dune field in Murzuq, south west Libya, (B). Playas along the foothills of the Atlas Mountains.
Figure 6.
Dust emissions from scattered, singular sources. (A). Edges of vast sand dune field in Murzuq, south west Libya, (B). Playas along the foothills of the Atlas Mountains.

Figure 7.
Main panel: the study area (red polygon) with dust source frequency of Schepanski et al., [17] stored in 1°X1° grid (colored grid cells), showing close-ups with the current study results (white contours) emphasizing the difference between the spatial scales of data.
Figure 7.
Main panel: the study area (red polygon) with dust source frequency of Schepanski et al., [17] stored in 1°X1° grid (colored grid cells), showing close-ups with the current study results (white contours) emphasizing the difference between the spatial scales of data.


Table 1.
Relative abundance of geomorphic units in the identified hot spots.
| Geomorphic Unit | Fluvial | Playa | Sand Dunes | Anthropogenic | Sum |
|---|---|---|---|---|---|
| Number [Percentage] | |||||
| Number of Dust Emitting Regions | 72 [40.4] | 62 [34.8] | 24 [13.5] | 20 [11.2] | 178 [100] |
| Number of Dust Events | 342 [33.2] | 449 [43.6] | 100 [9.7] | 138 [13.4] | 1029 [100] |
Table 2.
Relative abundance of geomorphic units within identified dust emission locations.
| Geomorphic Unit | LSM | LSM-HWSD | ||
|---|---|---|---|---|
| km2 | % | km2 | % | |
| Sand deposit | 106,345 | 35.2 | 89,966 | 29.8 |
| Sand deposit, on bedrock | 90,570 | 30.0 | 76,487 | 25.3 |
| Stony surface | 50,119 | 16.6 | 38,553 | 12.8 |
| Sand deposit, stabilized | 17,482 | 5.8 | 14,110 | 4.7 |
| Playa/Sabkha | 13,407 | 4.4 | 36,907 | 12.2 |
| Bedrock, with sediment | 12,009 | 4.0 | 10,140 | 3.4 |
| Bedrock | 6026 | 2.0 | 5639 | 1.9 |
| Fluvial system | 6012 | 2.0 | 30,192 | 10.0 |
| Anthropogenic | 146 | 0.0 | 139 | 0.0 |
| Water body/Wetland | 55 | 0.0 | 41 | 0.0 |
| Total | 302,171 | 100.0 | 302,175 | 100.0 |
Table 3.
Relative abundance of soil units within dust emission locations.
| HWSD | ||
|---|---|---|
| Soil Unit | km2 | % |
| Calcisols (CL) | 155,714 | 52.0 |
| Leptosols (LP) | 42,744 | 14.3 |
| Rock debris (RK) | 26,651 | 8.9 |
| Playa units | 25,567 | 8.5 |
| Fluvisols (FL) | 24,678 | 8.2 |
| Sand dunes (DS) | 20,084 | 6.7 |
| Arenosols (AR) | 4082 | 1.4 |
| Regosols (RG) | 92 | 0.0 |
| Cambisols (CM) | 26 | 0.0 |
| Total | 299,639 | 100.0 |
© 2020 by the authors. Licensee MDPI, Basel, Switzerland. This article is an open access article distributed under the terms and conditions of the Creative Commons Attribution (CC BY) license (http://creativecommons.org/licenses/by/4.0/).
Share and Cite
MDPI and ACS Style
Lavi Bekin, O.; Crouvi, O.; Blumberg, D.G. Areal Extent of Dust Emission Events and Source Geomorphology in Northern Africa from MSG-SEVIRI Data. Remote Sens. 2020, 12, 2775. https://doi.org/10.3390/rs12172775
AMA Style
Lavi Bekin O, Crouvi O, Blumberg DG. Areal Extent of Dust Emission Events and Source Geomorphology in Northern Africa from MSG-SEVIRI Data. Remote Sensing. 2020; 12(17):2775. https://doi.org/10.3390/rs12172775
Chicago/Turabian StyleLavi Bekin, Ofer, Onn Crouvi, and Dan G. Blumberg. 2020. "Areal Extent of Dust Emission Events and Source Geomorphology in Northern Africa from MSG-SEVIRI Data" Remote Sensing 12, no. 17: 2775. https://doi.org/10.3390/rs12172775
Note that from the first issue of 2016, this journal uses article numbers instead of page numbers. See further details here.