Vegetation Growth Status and Topographic Effects in the Pisha Sandstone Area of China


1
School of Resources and Materials, Northeastern University at Qinhuangdao Branch, Qinhuangdao 066004, China
2
Institute of Desertification Studies, Chinese Academy of Forestry, Beijing 100091, China
3
National Climate Center, China Meteorological Administration, Beijing 100081, China
*
Author to whom correspondence should be addressed.
Remote Sens. 2020, 12(17), 2759; https://doi.org/10.3390/rs12172759
Submission received: 5 July 2020
/
Revised: 21 August 2020
/
Accepted: 23 August 2020
/
Published: 25 August 2020
(This article belongs to the Section Remote Sensing in Agriculture and Vegetation)
Abstract
:Fractional vegetation coverage (FVC) plays an important role in monitoring vegetation growth status and evaluating restoration efforts in ecological environments. In this study, FVC was calculated using a binary pixel model and analyzed in the Pisha Sandstone area of China, using MODIS-EVI data from 2000 to 2019. Topographic effects were analyzed from elevation, slope and aspect using a terrain niche index model. The results were as follows. (1) From 2000 to 2019, FVC in the Pisha Sandstone area of China gradually increased at a mean rate of 0.0074/a, and the growth status of vegetation gradually improved. (2) The spatial distribution of FVC steadily decreased from southeast to northwest. FVC was the lowest in bare parts of the Pisha Sandstone area, whereas those in the sand- and soil-covered parts were the middle and highest, respectively. (3) With increasing elevation, the inferior coverage area and terrain niche index increased, and inferior coverage distribution changed from non-dominant to dominant. Meanwhile, the low, medium and high coverage areas decreased, and their distributions changed from dominance to non-dominance. (4) With increasing slope, distributions of the inferior, medium and high coverage areas changed from dominant to non-dominant, while the low coverage area had a dominant distribution. (5) Analyses of aspect effects revealed that the inferior coverage area was the dominant distribution in shady slopes but was non-dominant in semi-shady, semi-sunny and sunny slopes. The low, medium and high coverage areas were non-dominant in shady slopes, but dominant in semi-shady, semi-sunny and sunny slopes.
1. Introduction
With economic and social development, humans face multiple major ecological problems, including soil erosion, desertification, forest and grassland degradation and environmental pollution [1,2,3,4]. Pisha Sandstone is a typical soil type composed of semi-consolidated clastic rock, which includes sandstone, siltstone and mudstone. Because of its low diagenesis, poor cementation and low structural strength between sand particles, Pisha Sandstone becomes mud when it encounters water and sand when it encounters wind. Pisha Sandstone is thus highly prone to erosion from water, wind and the freeze–thaw cycle, which seriously endangers the local ecological environment, and it is referred to as “Earth’s ecological cancer” by some Chinese and foreign experts [5]. China has a particularly large distribution area of Pisha Sandstone, and it is mainly concentrated on the Ordos Plateau in the northern part of the Loess Plateau in northwestern China—including Dongsheng District, Junggar Banner, Ejin Horo Banner, Dalat Banner, Hangjin Banner in Inner Mongolia, Shenmu and Fugu County in Shaanxi Province, Hequ, Baode and Qingshui County in Shanxi Province—with a total area of 11,682 km2, which accounts for 22.5% of the total bordering area of Shanxi, Shaanxi and Mongolia [6]. Because the Pisha Sandstone area is arid and has a typical temperate continental climate, soil erosion is severe and wind-sand disasters are frequent. Moreover, the area is the most seriously damaged ecological fragile zone in the Loess Plateau, as well as the main source of coarse sediment in the Yellow River. In 2019, the Chinese government clearly indicated that ecological protection and high-quality development in the Yellow River Basin are major national strategies, and will promote the implementation of many major ecological protection, restoration and construction projects in the basin [7]. Therefore, it is important to scientifically evaluate the vegetation growth status and effects of ecological restoration in the Pisha Sandstone area in Northwest China. Such research will also facilitate the establishment of appropriate and timely strategies for sustainable development.
Vegetation has been widely used for evaluating ecological environments, and as an important indicator of the geographical environment, it can reliably reflect the local environmental characteristics of water, heat and soil [8,9,10]. The vegetation index, coupled with information on the infrared and red spectrum, is commonly used to assess vegetation growth status [11,12]. Among the dozens of vegetation indexes available, the Normalized Vegetation Index (NDVI) is the most popular; its practical application, however, is limited by atmospheric noise, soil background, red light saturation and other problems [13,14]. The enhanced vegetation index (EVI) introduced the blue band into its calculation, which decreased the red saturation issue of the NDVI in high-biomass areas, and effectively reduced atmospheric and soil noise, greatly improving vegetation monitoring [15,16].
The Pisha Sandstone area studied here is located in the desert ecosystem of China, which has relatively sparse surface vegetation and a high degree of surface bareness. EVI has been proved can better monitor the ecological environment in Pisha Sandstone [17]. FVC is important for measuring the status of surface vegetation and is widely used for monitoring and evaluating ecological environments. In terms of FVC, remote sensing technology overcomes the shortcomings of the traditional method, and it is more widely used in large-area FVC monitoring owing to its macroscopic and economic advantages [18,19,20,21]. During the course of vegetation growth—besides climate and soil—local terrain conditions also significantly affect plant growth and distribution [22,23]. The main topographic factors affecting the distributions of energy, water and vegetation productivity are elevation, aspect and slope. Terrain aspect, defined as the orientation of the land surface, influence the distributions of energy, precipitation and wind speed. Degree of steepness and slowness of land surface, referred to as terrain slope, controls the partitioning of precipitation runoff and solar radiation. Florinsky et al. (1996) studied the impact of topography on FVC and concluded that vegetation characteristics are mainly affected by topography parameters [24]. Fan et al. (2014) found that the plant canopy reflectance of shady slopes is greater than that of sunny slopes [25]. Zapata-Rios et al. (2015) studied three catchments on the north and east sides of Redondo Peak in northern New Mexico and determined that the slope aspect clearly affected the distribution of energy, water and vegetation productivity in the high-altitude ecosystem [26].
In the Pisha Sandstone area of China, vegetation is critical for reducing the impacts of soil erosion. Current vegetation monitoring research via remote sensing in the Pisha Sandstone area mainly focuses on the temporal and spatial variations of NDVI [17], but few studies have been conducted on the relationship between FVC and terrain effects. In fact, because of the combined effects of water erosion, gravity collapse and freeze–thaw collapse, the surface of the Pisha Sandstone area in China exhibits the characteristics of wide plateaus and crisscross gullies. Vegetation growth condition greatly differs among the top, middle and bottom of the slope. For sustainable management of the Pisha Sandstone area, the local government and people must carefully consider the relationship between vegetation growth and topographic factors, and adopt scientifically sound vegetation restoration projects.
The Pisha Sandstone area of China served as the research area in this study. We used MODIS and digital elevation model (DEM) data from 2000 to 2019 to study the relationships between the variations in FVC and the terrain of different types of Pisha Sandstone. First, we calculated FVC based on the pixel dichotomy model. Second, using the FVC data from 2000 to 2019, we calculated the change trends and conducted a significance test of FVC via a linear regression model. Third, based on DEM data, we calculated the slope and aspect, and then evaluated the impact of terrain on FVC using the formulae of terrain distribution index, elevation, slope and aspect data. Finally, we analyzed the reasons for the changes in FVC from the perspective of natural and human factors, and provide a scientific basis for the management of the ecological environment in the Pisha Sandstone area.
2. Study Area and Data
2.1. Study Area
The research site was located on the border areas of Shanxi, Shaanxi and Inner Mongolia, China, between 38°10′–40°10′N and 108°45′–111°31′E. Based on the differences among land surface soils, Pisha Sandstone is typically divided into three types: bare, sand-covered and soil-covered (Figure 1). The climate type is mainly warm temperate arid and semi-arid continental. The annual average temperature is 6–9 °C. Precipitation is mainly concentrated from June to September. The mean annual precipitation is 280–400 mm and decreases from southeast to northwest in terms of spatial variation. Average annual evaporation is 2200–2600 mm and mean annual wind speed is 2–4 m/s. Wind and water erosion are severe in the Pisha Sandstone area. The natural vegetation is sparse and can be classified as arid grassland. Vegetation can be divided into four types: coniferous forest, broad-leaved forest, shrub and grass. There are six soil types, 13 subtypes and 51 soil species, among which chestnut soil, wind-sand soil and grayish-brown soil are dominant. The elevation of this district is between 774–168 m, and the terrain fluctuates greatly.
2.2. Data
MOD13Q1-EVI images (spatial resolution: 250 m; temporal resolution: 16 days) from 2000 to 2019 were used in this study. The data were derived from the NASA Land Process Distributed Data Archive Center of the Earth Resources Observation and Science Center of the United States Geological Survey. For the downloaded MOD13Q1 data, MODIS Reprojection Tool software was used for mosaics and projection transformation. The projection type was Albers Conical Equal Area projection (the central longitude was 105°E, and the latitude was 25°N and 47°N). We used the internationally accepted maximum value synthesis method (MOV) to calculate the largest EVI image sequence from 2000 to 2019. To analyze and describe of the transformation of FVC, FVC are divided into four levels according to the Classification Standards for Soil Erosion in China: 0 < FVC ≤ 0.3 (inferior coverage), 0.3 < FVC ≤ 0.5 (low coverage), 0.5 < FVC ≤ 0.7 (medium coverage) and FVC > 0.7 (high coverage). The DEM data were obtained from the Geospatial Data Cloud Platform (http:www.gscloud.cn) of the Computer Network Information Center of the Chinese Academy of Sciences. The slope and aspect were then calculated after mosaic and projection. According to the “Second National Land Survey Technical Regulations”, slope was divided into five levels: ≤2°, 2–6°, 6–15°, 15–25°, and >25° (Figure 2). According to the north slope (315–45°), east slope (45–135°), west slope (225–315°) and south slope (135–225°), the slope direction aspect was divided into shady, semi-shady, semi-sunny or sunny slopes.
3. Methodologies
3.1. Fractional Vegetation Coverage
FVC refers to the percentage of the vertical projection area of ground vegetation relative to the total area [27]. In the Pisha Sandstone area, many mixed pixels exist in images because of severe desertification, relatively sparse vegetation, and obvious spatial heterogeneity of ground features. Among the dozens of mixed-pixel decomposition methods available, the binary pixel model is popular for FVC calculation because it does not require empirical data, yet it maintains high accuracy and the calculation is relatively simple. The binary pixel model is based on the spectral contribution rate of each end element in the mixed pixel [28,29]. The Gutman model and Carlson model are the most widely used; these are respectively applicable to areas with high and low FVC [30,31]. According to the characteristics of sparse vegetation in the Pisha Sandstone area, the Carlson model was selected to estimate FVC. The basic principle of the Carlson model is to assume that each pixel can be decomposed into full vegetation cover and bare soil, so the information in the pixel (S) can be expressed as the sum of vegetation cover information (Sv) and soil cover information (Ss):
For a pixel containing only soil and vegetation information, the area covered by vegetation is FVC, and the proportion of the area covered by soil is 1-FVC, and FVC can be expressed as:
where EVIsoil and EVIveg represent the EVI of pure bare soil pixels and pure vegetation pixels, respectively. For bare soil pixels, EVIsoil should be close to 0, but because of the influence of atmosphere, surface wetland and sunlight conditions, the values range from −0.1 to 0.2 [31,32]. For pure vegetation pixels, EVIveg will vary with the vegetation type, composition, and seasonal changes in growth. Therefore, we used a 0.5% confidence level, and EVI accumulation values of 0.5% and 99.5% were selected as EVIsoil and EVIveg, respectively. Both EVIsoil and EVIveg were used for Equation (2) to calculate FVC from 2000 to 2019 (Figure 3).
3.2. Trend Analysis
The spatial characteristics of vegetation changes in different periods were analyzed by simulating the transformation trends of different grids [33]. We used the unitary linear regression model to simulate the FVC transformation from 2000 to 2019 and predict its change trend, which was represented as [33]:
where θslope is the slope of the regression equation, i is the year serial number (i = 1, 2, ..., 19), xi is the independent variable, is the dependent variable. θslope > 0 indicates increasing FVC, θslope < 0 indicates decreasing FVC, and θslope < 0 indicates no change. An F-test was used to assess the significance of the trend, expressed as:
where is the sum of squares, is the regression sum of squares, is the FVC value of year i, is regression value, is the mean FVC over the monitoring period, and n is the number of monitoring years. Based on the test results, the trends could be classified into five levels: extremely significant decrease (θslope < 0, p < 0.01), significant decrease (θslope < 0, p < 0.05), no significant change (θslope = 0, p > 0.05), significant increase (θslope > 0, 0.01 < p < 0.05) and extremely significant increase (θslope > 0, p < 0.01).
3.3. Topographic Effects
A topographic effect is caused by the differential spectral radiance resulting from the surface slope angle and aspect variations. It may be quantified by measuring the difference in radiance between a horizontal and sloping surface [34,35]. In complex terrain areas, FVC varies with different terrain factors. The area of a certain FVC may be smaller under certain topographic gradient conditions, but the area of FVC might be larger in the study area. This could result in uncertainty when evaluating the impact of terrain factors. To eliminate the influence of area difference and accurately describe the spatial distribution of vegetation on each terrain gradient, the topographic distribution index (Pie) was introduced as follows [36,37]:
where Pie is the topographic distribution index, Aie is the area of FVC of type i in the range of gradient e under a certain topographic factor (elevation, slope and aspect), Ai is the total area of FVC, Ae represents the total area of a topographic factor in gradient e, and A represents the total area. Pie = 1 indicates the change type of i is distributed smoothly in e terrain, Pie > 1 indicates the change type of i is the dominant distribution, and Pie < 1 indicates the non-dominant distribution of i variation types.
4. Results
4.1. Variations in FVC
4.1.1. Temporal Variations in FVC
FVC in the Pisha Sandstone area was relatively low from 2000 to 2019, and the mean FVC was 0.228 (Figure 4). For 13 years of the study period, FVC was abnormally positive; maximum values occurred in 2018, 2013 and 2012 with mean FVC values of 0.273, 0.266, and 0.261, respectively. Negative anomalies of FVC mainly occurred over 7 years; the lowest FVC values were found for 2001, 2000, and 2011 with mean FVC values of 0.159, 0.173, and 0.176, respectively. From 2000 to 2019, FVC increased at a mean rate of 0.0044/a. For different Pisha Sandstone types, FVC increased in the soil-covered, sand-covered and bare Pisha Sandstone. The respective annual average rates of FVC increase were 0.0054/a, 0.0035/a and 0.001/a. The growth rates of FVC in the soil-covered and bare Pisha Sandstone areas were higher than that in the sand-covered area. Mean annual FVC in soil-covered, sand-covered and bare Pisha Sandstone areas were 0.252, 0.223 and 0.183, respectively.
4.1.2. Spatial Variations of FVC
Many measures have been taken since 1979 to improve the ecological environment of the Pisha Sandstone area. With the implementation of the Grain-to-Green Program in China in 1999, the scale of ecological treatment has gradually expanded [17]. To evaluate vegetation restoration efforts in the Pisha Sandstone area, the maximum value of FVC was selected to represent the best state of ecological restoration from 2000 to 2019 (Figure 5). The mean FVC of the whole area was 0.329, mainly dominated by poor and low coverage, and accounted for 92.39% of the total area. Areas with medium and high coverage were relatively small, accounting for 7.19% and 0.42%, respectively, and mainly distributed in areas with relatively gentle slopes and low elevations. FVC varied greatly in different Pisha Sandstone areas. FVC in the bare Pisha Sandstone area was the lowest (0.281) in the northwest, followed by FVC in the sand-covered Pisha Sandstone area (0.342) in the southwest. FVC in the soil-covered area was the highest (0.364) in the east and southeast. FVC gradually decreased from southeast to northwest throughout the entire area.
Based on the analysis of FVC changes (Figure 6), the mean change rate was 0.025 in Pisha Sandstone from 2000 to 2019. The change rate in the northwestern region was mainly negative, and the lowest value was −0.0343. The change rate in the southeastern region was relatively high with a maximum value of 0.0407. The significance test of the change rate showed that 68.38% of the area underwent an extremely significant increase, whereas 29.83% of the area experienced a significant increase. The areas with an extremely significant decrease and significant decrease accounted for 0.98% and 0.81% of the total area, respectively.
4.2. Variations in Topographic Effects
Topography affects the spatial redistribution of solar radiation and precipitation. Moreover, soil texture, moisture and nutrients under different topographic conditions have major impacts on the growth of vegetation [26,38]. The topography of the Pisha Sandstone area is complex, possibly affecting the distribution and growth of local vegetation. With complex terrain, satellite images show different reflectance to the same or similar features, which may cause errors when assessing vegetation [39]. Compared with flat ground, a slope may affect the incident and observation angle of the target, which then affects reflectivity [40]. Additionally, the aspect and elevation obstruct the canopy reflection or scattering, which may affect canopy reflectivity [25]. Among the various topographic factors, elevation, slope and aspect can best reflect differences in vegetation growing conditions, and are thus widely used in evaluating landscape changes [41,42]. Therefore, we used elevation, slope and aspect to analyze topographic effects.
4.2.1. Elevation Effects
The entire Pisha Sandstone area was divided into seven levels based on elevation data, and the FVC variation characteristics of each level were calculated (Figure 7). Areas with inferior FVC were relatively the largest, but the area proportion for inferior coverage was not the same at different elevation levels. Among them, the proportion of area with elevation ≤1000 m was 23.56%, which was the lowest. With increasing elevation, the area proportion gradually increased. When elevation >1500 m, the area proportion peaked (80.14%). With increasing elevation, the area proportion with poor coverage gradually increased, and growth status of vegetation gradually deteriorated. This was mostly because inferior coverage of FVC was mainly distributed in the bare Pisha Sandstone area, which has relatively high elevation (most areas are >1300 m), while the elevation of the soil-covered Pisha Sandstone area is relatively low (most areas are <1200 m). The area proportion of low coverage decreased with increasing elevation, and the minimum was 19.48% when elevation was >1500 m. The maximum area proportion was 69.12% when elevation was ≤1000 m and was mainly distributed in the soil-covered Pisha Sandstone area. The area proportion of medium coverage was relatively lower in each elevation level. When elevation was ≤1000 m, area proportion accounted for 6.02%, followed by the elevation from 1100 m to 1200 m at 3.41%. When elevation was >1500 m, area proportion was the smallest (0.38%). Areas with high coverage were the smallest at each elevation level, and elevation ≤1000 m accounted for the largest proportion (1.31%); when elevation was between 1100 m and 1200 m or larger than 1500 m, it accounted for the smallest area proportion (0.01%).
Analyzing the variations in FVC at different elevations of the Pisha Sandstone area (Figure 8) showed that the mean FVC in the soil-covered Pisha Sandstone area was larger than that in the sand-covered area when elevation was ≤1400 m. When elevation was >1400 m, the mean FVC in the soil-covered area was less than that in the sand-covered area. There were no data for the soil-covered area when elevation was >1500 m. At 1000–1200 m, FVC in the bare Pisha Sandstone area was larger than in the sand-covered area. FVC in the bare area was larger than those in the soil-covered and sand-covered areas when elevation was 1000–1100 m, and at the other elevation levels, the result was the opposite. The relatively higher values of FVC were mainly located at 1000–1200 m for the bare Pisha Sandstone, 1300–1400 m for the sand-covered Pisha Sandstone, and 1000–1100 m for the soil-covered Pisha Sandstone.
Topographic distribution index was clearly different for the different types of Pisha Sandstone at different elevation levels (Figure 9). Topographic distribution index of the inferior coverage area increased gradually with elevation. Topographic distribution index was the smallest (0.52) when elevation was ≤1000 m and peaked (1.77) when elevation was >1500 m. The inferior coverage FVC was mainly distributed where elevation was >1300 m. It decreased with increasing elevation. The low, medium and high coverage FVC were mainly distributed where elevations were ≤1300 m, <1100 m, and <1000 m, respectively. In the bare Pisha Sandstone area, the inferior, low, medium and high coverage FVCs were mainly distributed where elevation was >1400 m, 1000–1400 m, ≤1300 m and 1200–1300 m, respectively. In the sand-covered Pisha Sandstone area, the inferior, low, medium and high coverage FVCs were mainly distributed where elevation was ≤1000 m or >1400 m, 1000–1400 m, <1200 m or 1200–1500 m and 1000–1500 m, respectively. Variations of topographic distribution index in soil-covered Pisha Sandstone were similar to the whole area. The inferior coverage area was the non-dominant distribution when elevation was ≤1000 m and the dominant distribution in other elevation areas. When FVC was >0.3, the variation in topographic distribution index was the same as that of the entire Pisha Sandstone area.
4.2.2. Slope Effects
From 2000 to 2019, the maximum FVC differed with slope level (Figure 10). The area accounted for a relatively larger proportion at different slope levels in low coverage areas, and the area proportion increased gradually with increasing slope levels. When slope was >25°, the area proportion was 68.03%. The area proportion of the inferior coverage region was the second largest and decreased gradually with increasing slope. The area proportion with FVC >0.5 was relatively small and began decreasing with increasing slope, reaching a minimum of 0.87% in the medium coverage areas and 0.02% in high coverage areas when slope was 15–25°.
Analyses of variations in FVC at different slope levels in Pisha Sandstone areas (Figure 11) revealed that FVC decreased in the soil-covered, sand-covered and bare Pisha Sandstone areas at different slope levels. FVC was relatively higher in the gentle slope area, and decreased with increasing slope, but increased when slope was >15° in the bare Pisha Sandstone area. In the sand-covered Pisha Sandstone area, FVC was not significantly different (about 0.311–0.304) for each slope level, and mainly showed a gradual decrease with increasing slope. In the soil-covered Pisha Sandstone area, FVC decreased gradually with increasing slope, but began rising again when slope was >25°.
The effects of slope were clearly different in different types of Pisha Sandstone (Figure 12). In the bare Pisha Sandstone area, the medium and high coverage FVCs were mainly distributed where slopes were <6°. In the sand-covered Pisha Sandstone area, the medium and high coverage FVC mainly distributed where slopes were <6°, ≤2° or 6–15°, respectively. In soil-covered Pisha Sandstone, the low and high coverage FVCs were mainly distributed where slopes were <6°, while the medium coverage FVC was mainly distributed where slopes were <6° or >25°. For the whole Pisha Sandstone area, the inferior, medium and high coverage FVCs were mainly distributed where slopes were <6°, while the low coverage FVC was mainly distributed where slopes were >6°.
4.2.3. Aspect Effects
The area proportions of FVC were different at different aspects in the Pisha Sandstone area (Figure 13). The inferior coverage area of shady slopes accounted for the largest proportion (92.27%), followed by sunny slopes (47.10%), semi-sunny slopes (44.70%) and semi-shady slopes (43.66%). The low coverage area of semi-shady slopes was the largest (54.42%), followed by semi-sunny (53.38%), sunny (51.31%), and shady slopes (7.58%). The medium coverage area proportion was relatively low at all aspect levels, among which the area of the semi-sunny slope was the largest (1.81%). The semi-shady slope was the second largest, and the shady slope was the smallest (0.14%). The area proportion of high coverage areas was the smallest at all aspect levels. Among them, the largest area proportion was in the semi-shady slope (0.13%), and the smallest one was in the shady slope (0.01%). In the entire study area, the inferior coverage area of shady slope accounted for the largest proportion. When FVC was >0.3, the areas of semi-shady and semi-sunny slopes accounted for large proportions, while the areas of other slopes accounted for a small proportion.
Assessments of variations in aspect and FVC in different Pisha Sandstone types (Figure 14) revealed that FVC in soil-covered Pisha Sandstone areas was larger than those of sand-covered and bare Pisha Sandstone areas. The characteristics of bare and soil-covered Pisha Sandstone areas were almost similar at different aspect levels. The mean FVC was the highest for semi-shady slopes, and the second highest for the semi-sunny slopes. Additionally, FVC for semi-shady slopes was approximately equal to those for shady and sunny slopes. FVC of semi-shady slopes was the largest in sand-covered Pisha Sandstone, followed by the shady and semi-sunny slopes, and the FVC value of sunny slopes was the smallest.
Aspect effects were different for different types of Pisha Sandstone (Figure 15). In the bare Pisha Sandstone area, the medium coverage FVC was mainly distributed where slopes were semi-shady and semi-sunny. The high coverage area was mainly distributed across all slopes except for sunny slopes. In the sand-covered Pisha Sandstone area, the medium coverage FVC mainly was distributed in semi-sunny slopes. The high coverage FVC was mainly distributed where slopes were shady. In the soil-covered Pisha Sandstone area, the medium coverage FVC was mainly distributed across semi-sunny and sunny slopes; the high coverage FVC was mainly distributed across all slopes except for sunny slopes. In the whole Pisha Sandstone area, the inferior coverage area was the dominant distribution for shady slopes and the non-dominant distribution for semi-shady, semi-sunny and sunny slopes. Areas with FVC > 0.3 were the non-dominant distribution for the shady slopes and the dominant distribution for semi-shady, semi-sunny and sunny slopes.
5. Discussion
The Pisha Sandstone area is located in inland China. Along with natural factors like water and heat conditions, human activities have a great impact on the growth of vegetation, which is reflected in changes in FVC.
5.1. Natural Factors
Along with topographic factors, variation in water and heat conditions is an important factor affecting the change in vegetation FVC. By analyzing variations in annual accumulated precipitation and mean annual temperature in the Pisha Sandstone area from 2000 to 2019 (Figure 16), both temperature and precipitation were found to have fluctuated. The minimum mean temperature was 8.01 °C (2012) while the maximum was 9.44 °C (2015). Coefficient of determination of temperature increasing trend was relatively lower than that of precipitation. Temperature increased at a mean rate of 0.02 °C/a. The minimum annual accumulated precipitation was 238.40 mm (2000), and the maximum was 622.2 mm (2016). Precipitation thus increased at a mean rate of 8.70 mm/a. The climate was generally warm and humid, providing favorable conditions for vegetation growth, which was likely the main reason for the gradual increase in FVC throughout the entire Pisha Sandstone area.
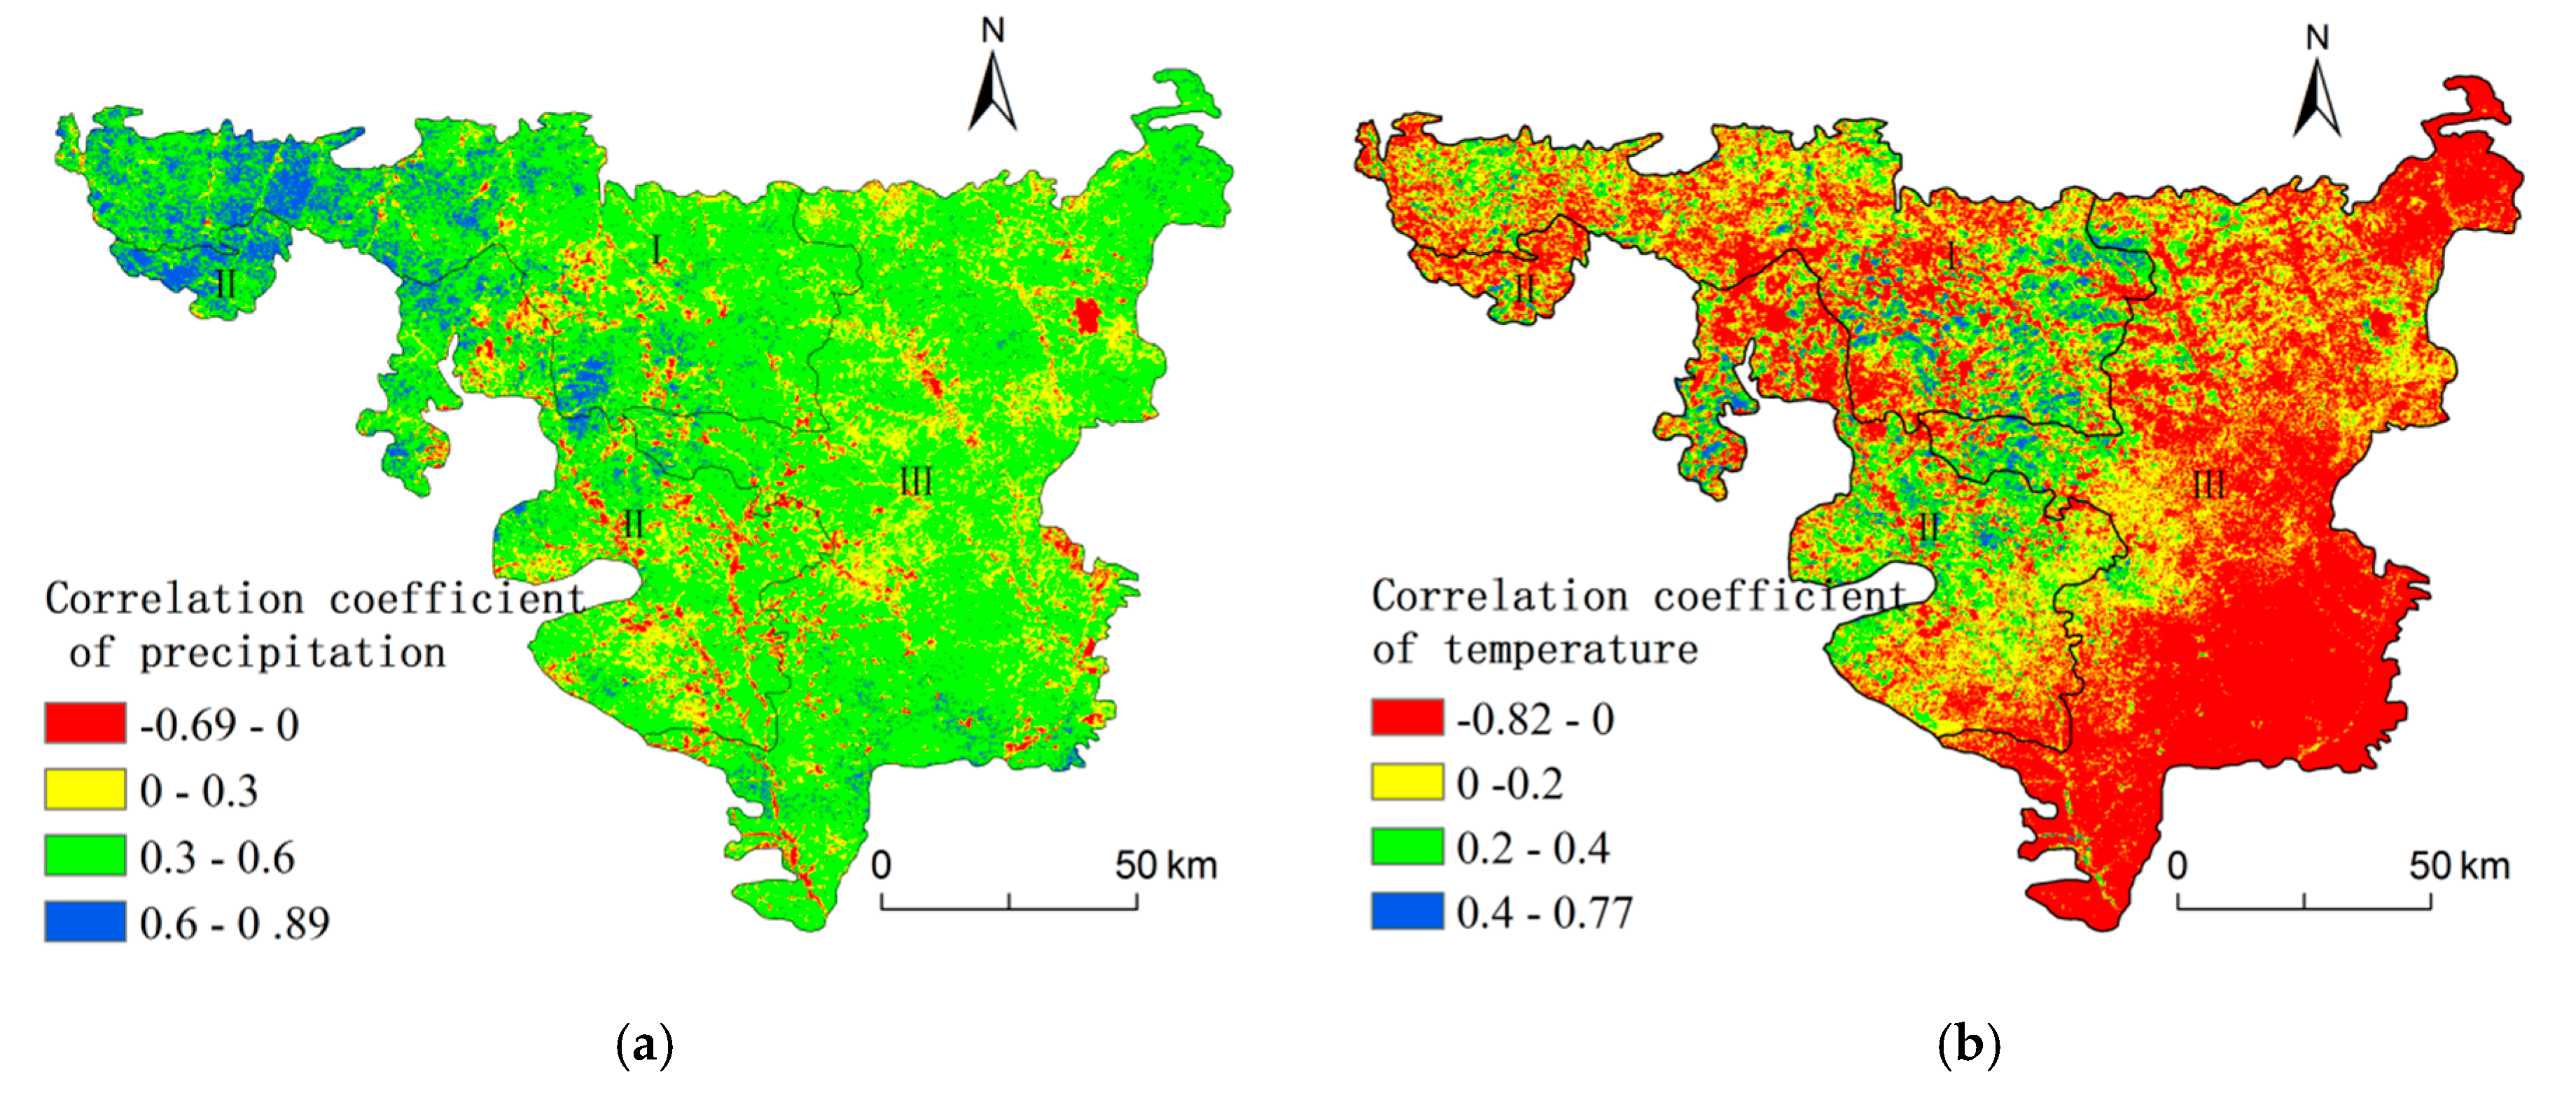
To quantitatively analyze the spatial relationship between climate factors and FVC in the Pisha Sandstone area, the Kriging interpolation method was used for spatial interpolation of climate factors. A correlation analysis method based on pixels was used to analyze the spatial relationship between FVC and climate factors (temperature and precipitation) from 2000 to 2019 (p < 0.05) (Figure 17). FVC and precipitation were positively correlated in most areas. The area proportion of positive correlation was 63.9%, and the correlation coefficient ranged from 0 to 0.89. The area proportion of negative correlation was 36.1%, and the correlation coefficient ranged from −0.69 to 0. The areas with a correlation coefficient from 0.6 to 0.89 were mainly distributed in the bare and sand-covered areas in the northwestern part of the Pisha Sandstone area. This indicates that precipitation was one of the main driving forces affecting the growth of vegetation in the arid and semi-arid areas. FVC and temperature were generally negatively correlated in most Pisha Sandstone areas, and the correlation coefficient ranged from −0.69 to 0. The area proportion with negative correlation was 68.53% and mainly distributed in the soil-covered Pisha Sandstone area with low elevation. The area proportion of positive correlation accounted for 31.47%, with a correlation coefficient from 0 to 0.77, and was mainly distributed throughout the bare and sand-covered Pisha Sandstone areas. Rising temperature promoted the evaporation of surface water and the transpiration of vegetation, while local precipitation was relatively low, which partly restricted the growth of vegetation in the Pisha Sandstone area.
5.2. Human Factors
Human factors affected variations in FVC. Major agricultural and animal husbandry bases are located in Pisha Sandstone areas in northwestern China. Among them, the Junggar Banner in Inner Mongolia is situated in the hinterland of the Pisha Sandstone area in China and includes all typical types of Pisha Sandstone. To a certain extent, it may better reflect the overall characteristics of Pisha Sandstone in China. Therefore, we chose Junggar Banner as a reference point to analyze the impact of human factors on variations in FVC in Pisha Sandstone areas in China. The population of Junggar Banner was 2.7 × 10⁵ in 2000 and 3.3 × 10⁵ in 2018, indicating a gradual increase at an average rate of 22.22%. The population of farmers and herders in Junggar Banner accounted for 76.22% of the total population in 2000 and 31.16% in 2018. The relatively high population of farmers and herders may have serious impacts on local crop cultivation and pasture use. The population density was 33 people per km2 in 2000 and 40 people per km2 in 2018—much higher than the population density standard of semi-arid and arid areas proposed by the United Nations. The rapid population growth and high population density placed more pressure on local vegetation growth. Additionally, the number of livestock like cattle and sheep were 2.1 × 10⁵ in 2000 and 5.4 × 10⁵, respectively, in 2018; thus, livestock numbers increased by 2.57 times. The rapid increase most likely put greater pressure on the local ecological environment. Corresponding to the trend of FVC in Junggar Banner, the area of extremely significant decrease accounting for 52.38% in Junggar Banner. The rapidly increasing population, population density and livestock quantity are likely important human-related factors for the decline in FVC.
Effective, long-term national and local policies could partly alleviate these pressures and play a positive role in the recovery of vegetation and improvement of FVC in the Pisha Sandstone area. For example, in 1979, the Three North Shelterbelt Project was implemented, followed by the House-hold Responsibility System in 1982. More trees were planted, and pastures were operated and protected by individuals. Subsequently, a series of national ecological protection projects were carried out, such as the “Special Control Project of Hippophae rhamnoides Linn. in Pisha Sandstone Area of Inner Mongolia” implemented in 1990, the Grain-to-Green Program in 2000, and the Beijing–Tianjin Sandstorm Source Control Project in 2002. Grassland areas were 4410 km2 in 2000, 4414 km2 in 2010 and 4579 km2 in 2018, representing a gradual increase at an average rate of 8.89 km2/a. According to the classification results of land use types in Junggar Banner from Landsat data (http://www.resdc.cn), forest and grass areas were 1.39 × 10⁵ ha and 4.41 × 10⁵ ha, respectively in 2000, and 2.67 × 10⁵ ha and 4.58 × 10⁵ ha, respectively, in 2018. Thus, the policies significantly promoted the rapid and stable restoration of local vegetation to some extent [16].
However, FVC is an important indicator of ecological damage, and the ecosystem cannot recover when FVC is <0.30 [43,44]. The mean FVC of the Pisha Sandstone area was 0.35 in 2019, and the degradation of vegetation remained severe. Therefore, it is necessary to continue operating the ecological control measures in the Pisha Sandstone area. Moreover, the relationship between FVC and topographic effects must be fully considered when executing future afforestation (grass-planting) projects. Based on the relationship between vegetation growth and topography, a series of fractional vegetation coverage in the Pisha Sandstone area could be established. For example, in sunny slopes soil-covered Pisha Sandstone areas (Table 1) with elevation varying from 1200 m to 1300 m, the mean FVC should be maintained between 0.245 and 0.353. In the Hippophae rhamnoides Linn. afforestation site in the southwestern of Dahong valley of Jungar Banner, too high planting density (plant row spacing was less than 1 m) made the FVC varied from 0.144 in 2009 to 0.673 in 2015, which was far beyond the range of 0.245–0.353. However, soil water in this area can only rely on precipitation, with the rapid growth of Hippophae rhamnoides Linn., water stress inhibited its growth, resulting in degeneration since 2016, and Hippophae rhamnoides Linn. in the site was almost all dead in 2019. According to this fact, the local government and ecological management department should conduct the afforestation based on the natural local conditions and ecological carrying capacity.
6. Conclusions
Though affected by natural and human factors, the vegetation growth status generally improved in the Pisha Sandstone area of China from 2000 to 2019, and FVC tended to increase at a mean rate of 0.0074/a. An increase was noted for 46.32% of the area with vegetation, while a clear decline was observed for 52.82% of the area. Against a background of warm and humid climate, the variation in FVC was consistent with the spatial distribution of precipitation, which showed a gradual decrease from southeast to northwest. Although the ecological environment in the Pisha Sandstone area tended to improve, FVC in the whole area was relatively low. In most areas with inferior coverage, there is room for further improvement of FVC. Therefore, restoration and planting projects must proceed with careful consideration of local conditions and the dominant distribution of the FVC under different terrain conditions.
Author Contributions
Conceptualization, F.Y.; Methodology, F.Y. and R.W.; Software, R.W. and F.Y.; Validation, R.W., Y.W. and F.Y.; Formal Analysis, R.W., Y.W. and F.Y.; Investigation, R.W., Y.W. and F.Y.; Resources, Y.W., F.Y. and R.W.; Data Curation, Y.W. and R.W.; Writing-Original Draft Preparation, R.W., Y.W. and F.Y.; Writing-Review & Editing, F.Y. and R.W.; Visualization, R.W. and Y.W.; Supervision, F.Y.; Project Administration, F.Y.; Funding Acquisition, F.Y. All authors have read and agreed to the published version of the manuscript.
Funding
This research was funded by National Nonprofit Institute Research Grant of Chinese Academy of Forestry (grant number CAFYBB2018ZA004), National Key Research and Development Program of China (grant number 2017YFC0504502) and National Natural Science Foundation of China (grant number 41301458).
Acknowledgments
The authors would like to thank NASA and the Computer Network Information Center of the Chinese Academy of Sciences for sharing MODIS data and DEM data, respectively.
Conflicts of Interest
The authors declare no conflict of interest.
References
- Bai, L.; Wang, N.; Jiao, J.; Chen, Y.; Tang, B.; Wang, H.; Chen, Y.; Yan, X.; Wang, Z. Soil erosion and sediment interception by check dams in a watershed for an extreme rainstorm on the Loess Plateau, China. Int. J. Sediment Res. 2020. [Google Scholar] [CrossRef]
- Peng, X.; Dai, Q.; Ding, G.; Shi, D.; Li, C. Impact of vegetation restoration on soil properties in near-surface fissures located in karst rocky desertification regions. Soil Tillage Res. 2020, 200, 104620. [Google Scholar] [CrossRef]
- Riitters, K.; Wickham, J.D.; Wade, T.G. Evaluating anthropogenic risk of grassland and forest habitat degradation using land-cover data. Landsc. Online 2009, 13, 1–14. [Google Scholar] [CrossRef]
- Guda, A.M.; Elhemaly, I.; Aal, E.A.; Odah, H.; Appel, E.; Kammar, A.M.E.; Khatita, A.M.A.; Salem, H.S.A.; Awad, A. Suitability of magnetic proxies to reflect complex anthropogenic spatial and historical soil heavy metal pollution in the southeast Nile delta. Catena 2020, 191, 104552. [Google Scholar] [CrossRef]
- Yang, F.; Cao, M.; Li, H.; Wang, X.; Bi, C. Simulation of sediment retention effects of the single seabuckthorn flexible dam in the Pisha Sandstone area. Ecol. Eng. 2013, 52, 228–237. [Google Scholar] [CrossRef]
- Yang, F.; Bi, C.; Cao, M.; Li, H.; Wang, X.; Wu, W. Simulation of sediment retention effects of the double seabuckthorn plant flexible dams in the Pisha Sandstone area of China. Ecol. Eng. 2014, 71, 21–31. [Google Scholar] [CrossRef]
- Xi, J. Speech at the symposium on ecological protection and high-quality development in the Yellow River Basin. Qiushi 2019, 32, 1–5. (In Chinese) [Google Scholar]
- Salim, H.A.; Xiaoling, C.; Jianya, G. Analysis of Sudan vegetation dynamics using NOAA-AVHRR NDVI data from 1982-1993. Asian J. Earth Sci. 2008, 2, 20–34. [Google Scholar] [CrossRef]
- Achard, F.; Eva, H.; Stibig, H.; Mayaux, P.; Gallego, J.; Richards, T.; Malingreau, J. Determination of Deforestation Rates of the World’s Humid Tropical Forests. Science 2002, 297, 999–1002. [Google Scholar] [CrossRef] [Green Version]
- Parmesan, C.; Yohe, G.W. A globally coherent fingerprint of climate change impacts across natural systems. Nature 2003, 421, 37–42. [Google Scholar] [CrossRef]
- Weiss, J.L.; Gutzler, D.S.; Coonrod, J.E.A.; Dahm, C.N. Long-term vegetation monitoring with NDVI in a diverse semi-arid setting, central New Mexico, USA. J. Arid Environ. 2004, 58, 249–272. [Google Scholar] [CrossRef]
- Al-Bakri, J.T.; Taylor, J.C. Application of NOAA AVHRR for monitoring vegetation conditions and biomass in Jordan. J. Arid Environ. 2003, 54, 579–593. [Google Scholar] [CrossRef] [Green Version]
- Dutta, D.; Das, P.K.; Paul, S.; Sharma, J.R.; Dadhwal, V.K. Assessment of ecological disturbance in the mangrove forest of Sundarbans caused by cyclones using MODIS time-series data (2001–2011). Nat. Hazards 2015, 79, 775–790. [Google Scholar] [CrossRef]
- Otto, M.; Hopfner, C.; Curio, J.; Maussion, F.; Scherer, D. Assessing vegetation response to precipitation in northwest Morocco during the last decade: An application of MODIS NDVI and high resolution reanalysis data. Theor. Appl. Climatol. 2016, 123, 23–41. [Google Scholar] [CrossRef]
- Huete, A.; Didan, K.; Miura, T.; Rodriguez, E.P.; Gao, X.; Ferreira, L.G. Overview of the radiometric and biophysical performance of the MODIS vegetation indices. Remote Sens. Environ. 2002, 83, 195–213. [Google Scholar] [CrossRef]
- Huete, A.; Liu, H.Q.; Batchily, K.; Van Leeuwen, W.J.D. A comparison of vegetation indices over a global set of TM images for EOS-MODIS. Remote Sens. Environ. 1997, 59, 440–451. [Google Scholar] [CrossRef]
- Yan, F.; Wu, B.; Wang, Y. Estimating spatiotemporal patterns of aboveground biomass using Landsat TM and MODIS images in the Mu Us Sandy Land, China. Agric. For. Meteorol. 2015, 200, 119–128. [Google Scholar] [CrossRef]
- Quarmby, N.A.; Townshend, J.R.G.; Settle, J.J.; White, K.H.; Milnes, M.; Hindle, T.L.; Silleos, N. Linear mixture modelling applied to AVHRR data for crop area estimation. Int. J. Remote Sens. 1992, 13, 415–425. [Google Scholar] [CrossRef]
- Hostert, P.; RöDer, A.; Hill, J. Coupling spectral unmixing and trend analysis for monitoring of long-term vegetation dynamics in Mediterranean rangelands. Remote Sens. Environ. 2003, 87, 183–197. [Google Scholar] [CrossRef]
- Guerschman, J.P.; Hill, M.J.; Renzullo, L.J.; Barrett, D.J.; Marks, A.S.; Botha, E.J. Estimating fractional cover of photosynthetic vegetation, non-photosynthetic vegetation and bare soil in the Australian tropical savanna region upscaling the EO-1 Hyperion and MODIS sensors. Remote Sens. Environ. 2009, 113, 928–945. [Google Scholar] [CrossRef]
- Zoungrana, B.J.-B.; Conrad, C.; Thiel, M.; Amekudzi, L.K.; Da, E.D. MODIS NDVI trends and fractional land cover change for improved assessments of vegetation degradation in Burkina Faso, West Africa. J. Arid Environ. 2018, 153, 66–75. [Google Scholar] [CrossRef]
- Moustafa, E.R.A.; Zaghloul, M.S. Environment and vegetation in the montane Saint Catherine area, south Sinai, Egypt. J. Arid Environ. 1996, 34, 331–349. [Google Scholar] [CrossRef]
- Ding, Y.; Zang, R.-G.; Jiang, Y.-X. Effect of Hillslope Gradient on Vegetation Recovery on Abandoned Land of Shifting Cultivation in Hainan Island, South China. J. Integr. Plant Biol. 2006, 48, 642–653. [Google Scholar] [CrossRef]
- Florinsky, I.V.; Kuryakova, G.A. Influence of topography on some vegetation cover properties. Catena 1996, 27, 123–141. [Google Scholar] [CrossRef]
- Fan, W.; Chen, J.M.; Ju, W.; Zhu, G. GOST: A Geometric-Optical Model for Sloping Terrains. IEEE Trans. Geosci. Remote Sens. 2014, 52, 5469–5482. [Google Scholar] [CrossRef]
- Zapata-Rios, X.; Brooks, P.D.; Troch, P.A.; Mcintosh, J.; Guo, Q. Influence of terrain aspect on water partitioning, vegetation structure and vegetation greening in high-elevation catchments in northern New Mexico. Ecohydrology 2016, 9, 782–795. [Google Scholar] [CrossRef]
- Gitelson, A.A.; Kaufman, Y.J.; Stark, R.; Rundquist, D. Novel algorithms for remote estimation of vegetation fraction. Remote Sens. Environ. 2002, 80, 76–87. [Google Scholar] [CrossRef] [Green Version]
- Zribi, M.; Le Hégarat-Mascle, S.; Taconet, O.; Ciarletti, V.; Vidal-Madjar, D.; Boussema, M. Derivation of wild vegetation cover density in semi-arid regions: ERS2/SAR evaluation. Int. J. Remote Sens. 2003, 24, 1335–1352. [Google Scholar] [CrossRef]
- Qi, J.; Marsett, R.; Moran, M.S.; Goodrich, D.C.; Heilman, P.; Kerr, Y.; Dedieu, G.; Chehbouni, A.; Zhang, X. Spatial and temporal dynamics of vegetation in the San Pedro River basin area. Agric. For. Meteorol. 2000, 105, 55–68. [Google Scholar] [CrossRef] [Green Version]
- Gutman, G.; Ignatov, A. The derivation of the green vegetation fraction from NOAA/AVHRR data for use in numerical weather prediction models. Int. J. Remote Sens. 1998, 19, 1533–1543. [Google Scholar] [CrossRef]
- Carlson, T.N.; Ripley, D.A. On the relation between NDVI, fractional vegetation cover, and leaf area index. Remote Sens. Environ. 1997, 62, 241–252. [Google Scholar] [CrossRef]
- Rundquist, B.C. The influence of canopy green vegetation fraction on spectral measurements over native tallgrass prairie. Remote Sens. Environ. 2002, 81, 129–135. [Google Scholar] [CrossRef]
- Stow, D.A.; Daeschner, S.; Hope, A.; Douglas, D.C.; Petersen, A.; Myneni, R.B.; Zhou, L.; Oechel, W.C. Variability of the Seasonally Integrated Normalized Difference Vegetation Index Across the North Slope of Alaska in the 1990s. Int. J. Remote Sens. 2003, 24, 1111–1117. [Google Scholar] [CrossRef]
- Holben, B. The topographic effect on spectral response from nadir-pointing sensors. Photogramm. Eng. Remote Sens. 1980, 46. [Google Scholar] [CrossRef]
- Holben, B.; Justice, C. An examination of spectral band ratioing to reduce the topographic effect on remotely sensed data. Int. J. Remote Sens. 1981, 2, 115–133. [Google Scholar] [CrossRef]
- Xue, L.; Zhu, B.; Wu, Y.; Wei, G.; Liao, S.; Yang, C.; Wang, J.; Zhang, H.; Ren, L.; Han, Q. Dynamic projection of ecological risk in the Manas River basin based on terrain gradients. Sci. Total Environ. 2019, 653, 283–293. [Google Scholar] [CrossRef]
- Tong, X.; Wang, K.; Brandt, M.; Yue, Y.; Liao, C.; Fensholt, R. Assessing Future Vegetation Trends and Restoration Prospects in the Karst Regions of Southwest China. Remote Sens. 2016, 8, 357. [Google Scholar] [CrossRef] [Green Version]
- Li, J.; Peng, S.; Li, Z. Detecting and attributing vegetation changes on China’s Loess Plateau. Agric. For. Meteorol. 2017, 247, 260–270. [Google Scholar] [CrossRef]
- Deng, Y.; Chen, X.; Chuvieco, E.; Warner, T.A.; Wilson, J.P. Multi-scale linkages between topographic attributes and vegetation indices in a mountainous landscape. Remote Sens. Environ. 2007, 111, 122–134. [Google Scholar] [CrossRef]
- Matsushita, B.; Yang, W.; Chen, J.; Onda, Y.; Qiu, G. Sensitivity of the enhanced vegetation index (EVI) and normalized difference vegetation index (NDVI) to topographic effects: A case study in high-density cypress forest. Sensors 2007, 7, 2636–2651. [Google Scholar] [CrossRef] [Green Version]
- Carmel, Y.; Kadmon, R. Effects of grazing and topography on long-term vegetation changes in a Mediterranean ecosystem in Israel. Plant Ecol. 1999, 145, 243–254. [Google Scholar] [CrossRef]
- Eisenlohr, P.V.; Alves, L.F.; Bernacci, L.C.; Padgurschi, M.D.C.G.; Torres, R.B.; Prata, E.M.B.; Santos, F.A.M.D.; Assis, M.A.; Ramos, E.; Rochelle, A.L.C. Disturbances, elevation, topography and spatial proximity drive vegetation patterns along an altitudinal gradient of a top biodiversity hotspot. Biodivers. Conserv. 2013, 22, 2767–2783. [Google Scholar] [CrossRef]
- Lindenmayer, D.B.; Luck, G.W. Synthesis: Thresholds in conservation and management. Biol. Conserv. 2005, 124, 351–354. [Google Scholar] [CrossRef]
- Radford, J.Q.; Bennett, A.F.; Cheers, G.J. Landscape-level thresholds of habitat cover for woodland-dependent birds. Biol. Conserv. 2005, 124, 317–337. [Google Scholar] [CrossRef]
Figure 1.
Elevation (a) and location (b) of the Pisha Sandstone area. I: Bare Pisha Sandstone area; II: Sand-covered Pisha Sandstone area; III: Soil-covered Pisha Sandstone area.
Figure 1.
Elevation (a) and location (b) of the Pisha Sandstone area. I: Bare Pisha Sandstone area; II: Sand-covered Pisha Sandstone area; III: Soil-covered Pisha Sandstone area.
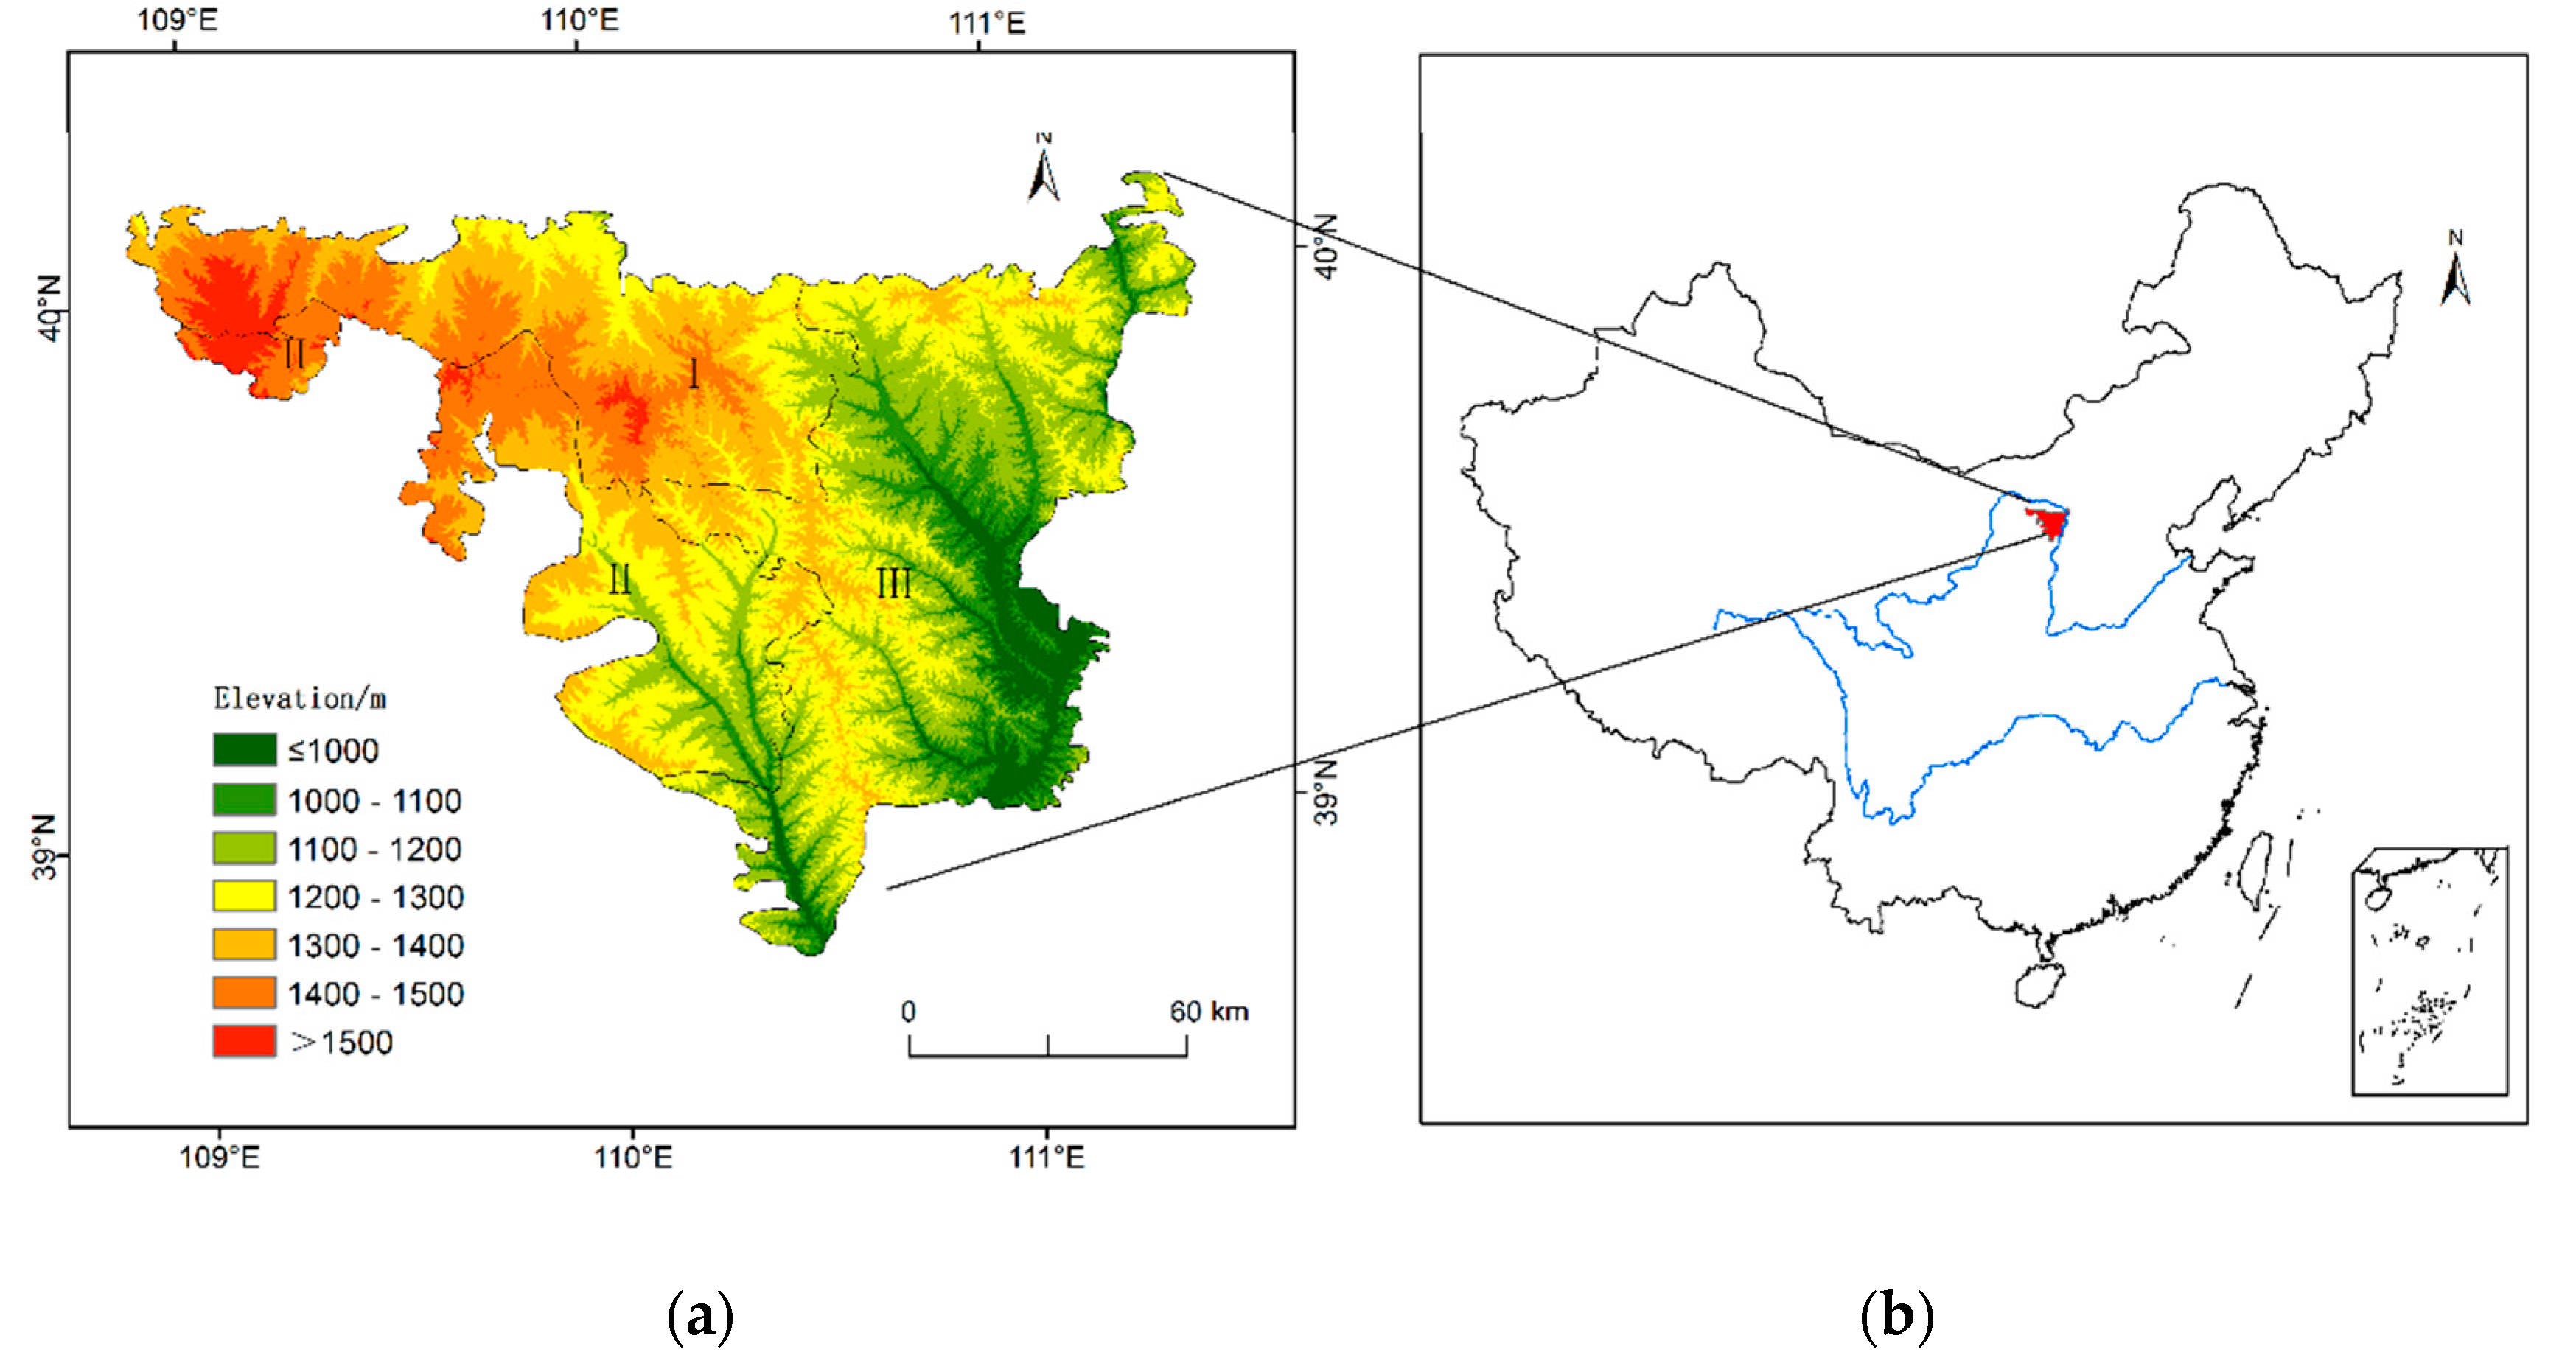
Figure 2.
Distributions of slope (a) and aspect (b) in the Pisha Sandstone area.

Figure 3.
Fractional vegetation coverage of Pisha Sandstone area from 2000 to 2019.
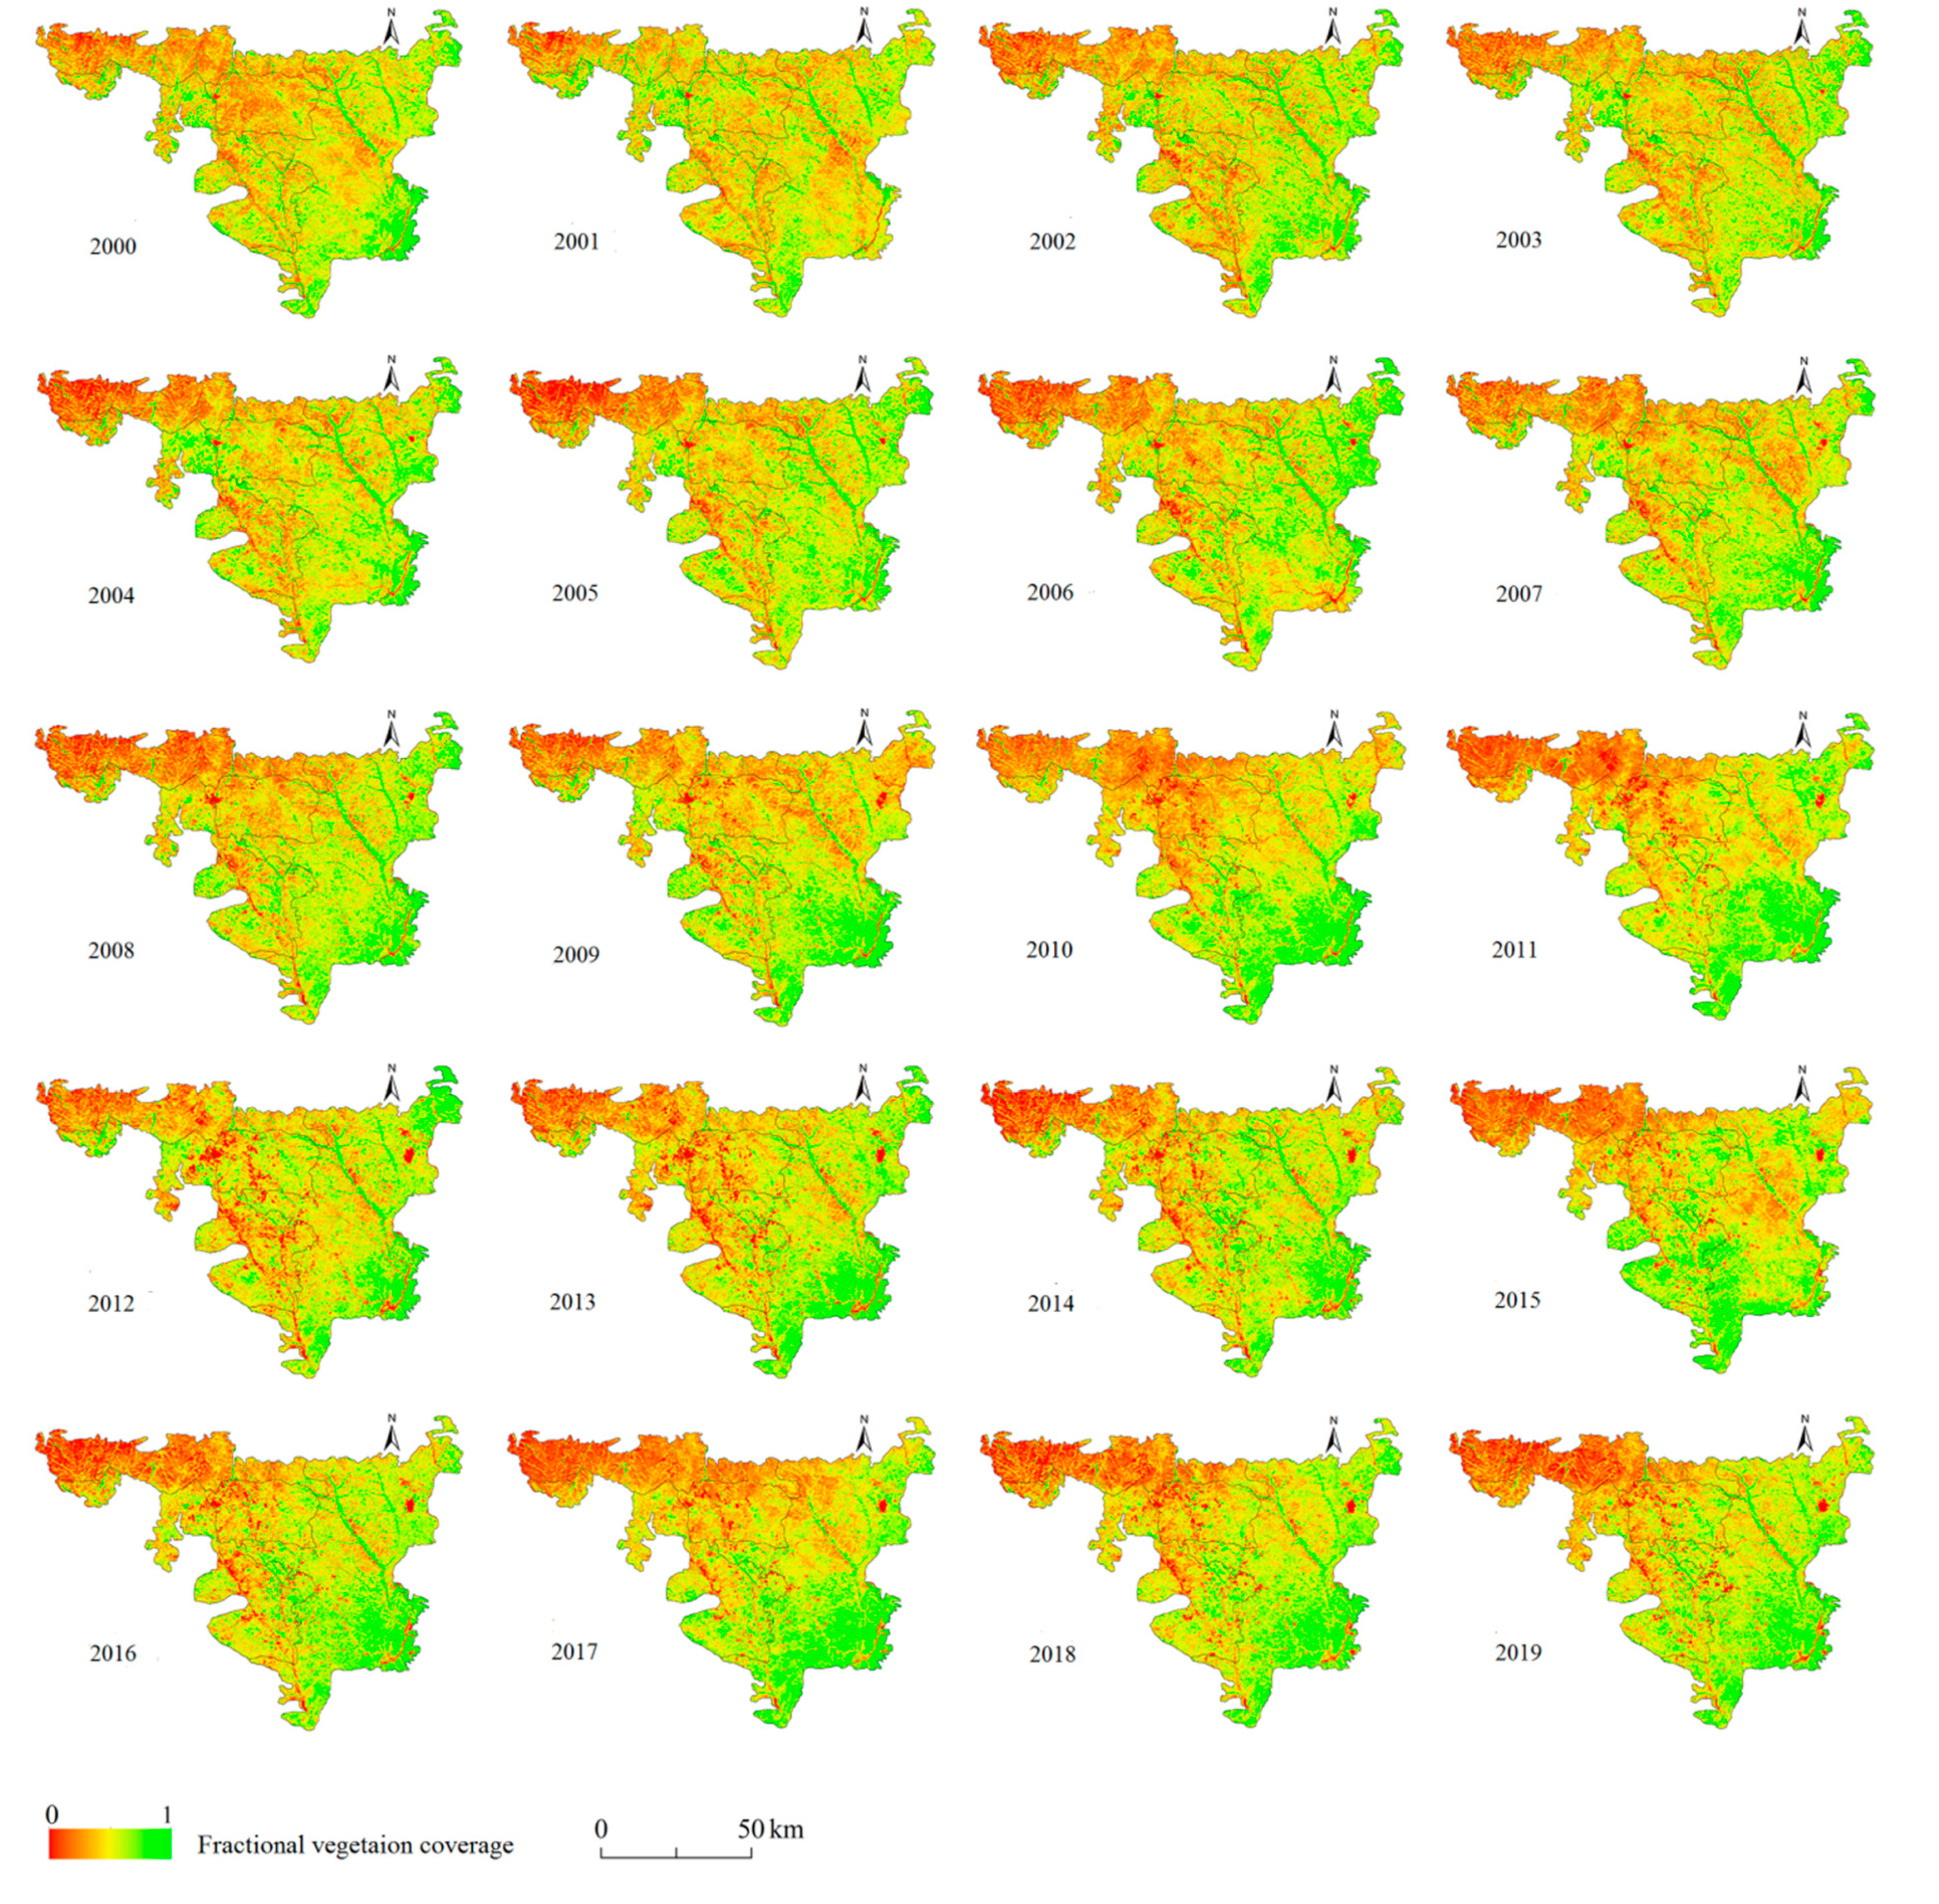
Figure 4.
Variations in FVC in the Pisha Sandstone area from 2000 to 2019.
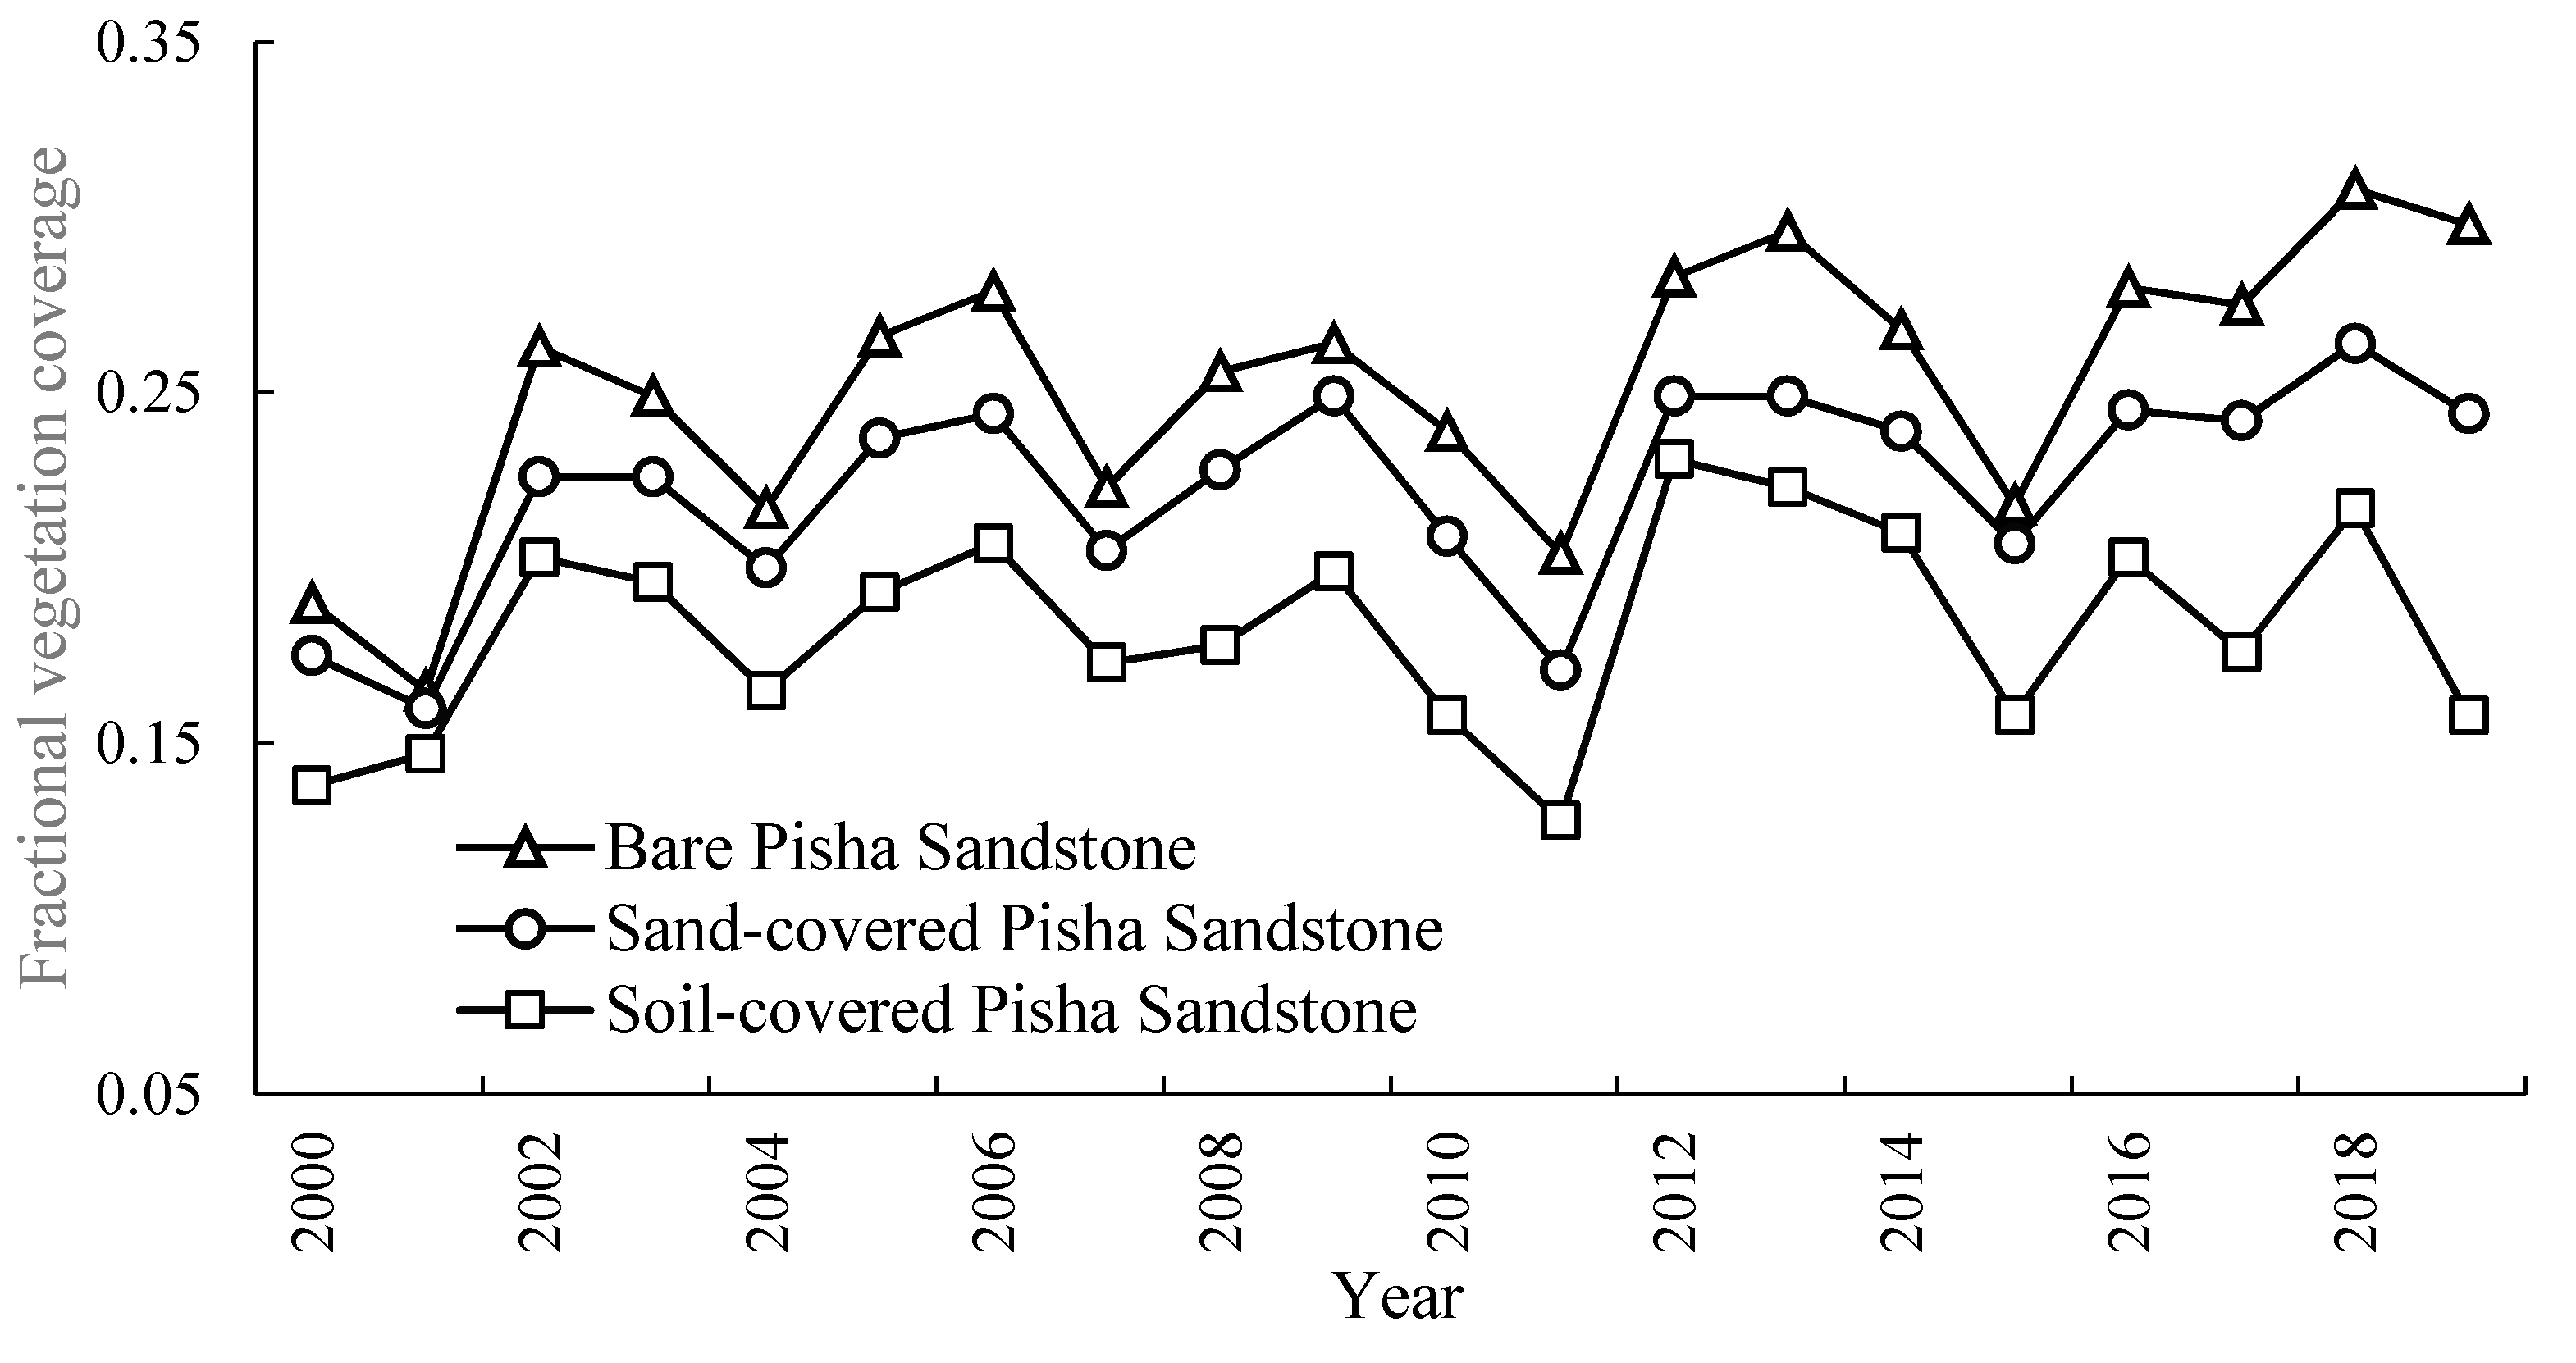
Figure 5.
Distribution of fractional vegetation coverage in the Pisha Sandstone area.

Figure 6.
Spatial change rate (a) and significance tests (b) of fractional vegetation coverage in the Pisha Sandstone area.
Figure 6.
Spatial change rate (a) and significance tests (b) of fractional vegetation coverage in the Pisha Sandstone area.

Figure 7.
Area percentage of vegetation coverage in different elevations.
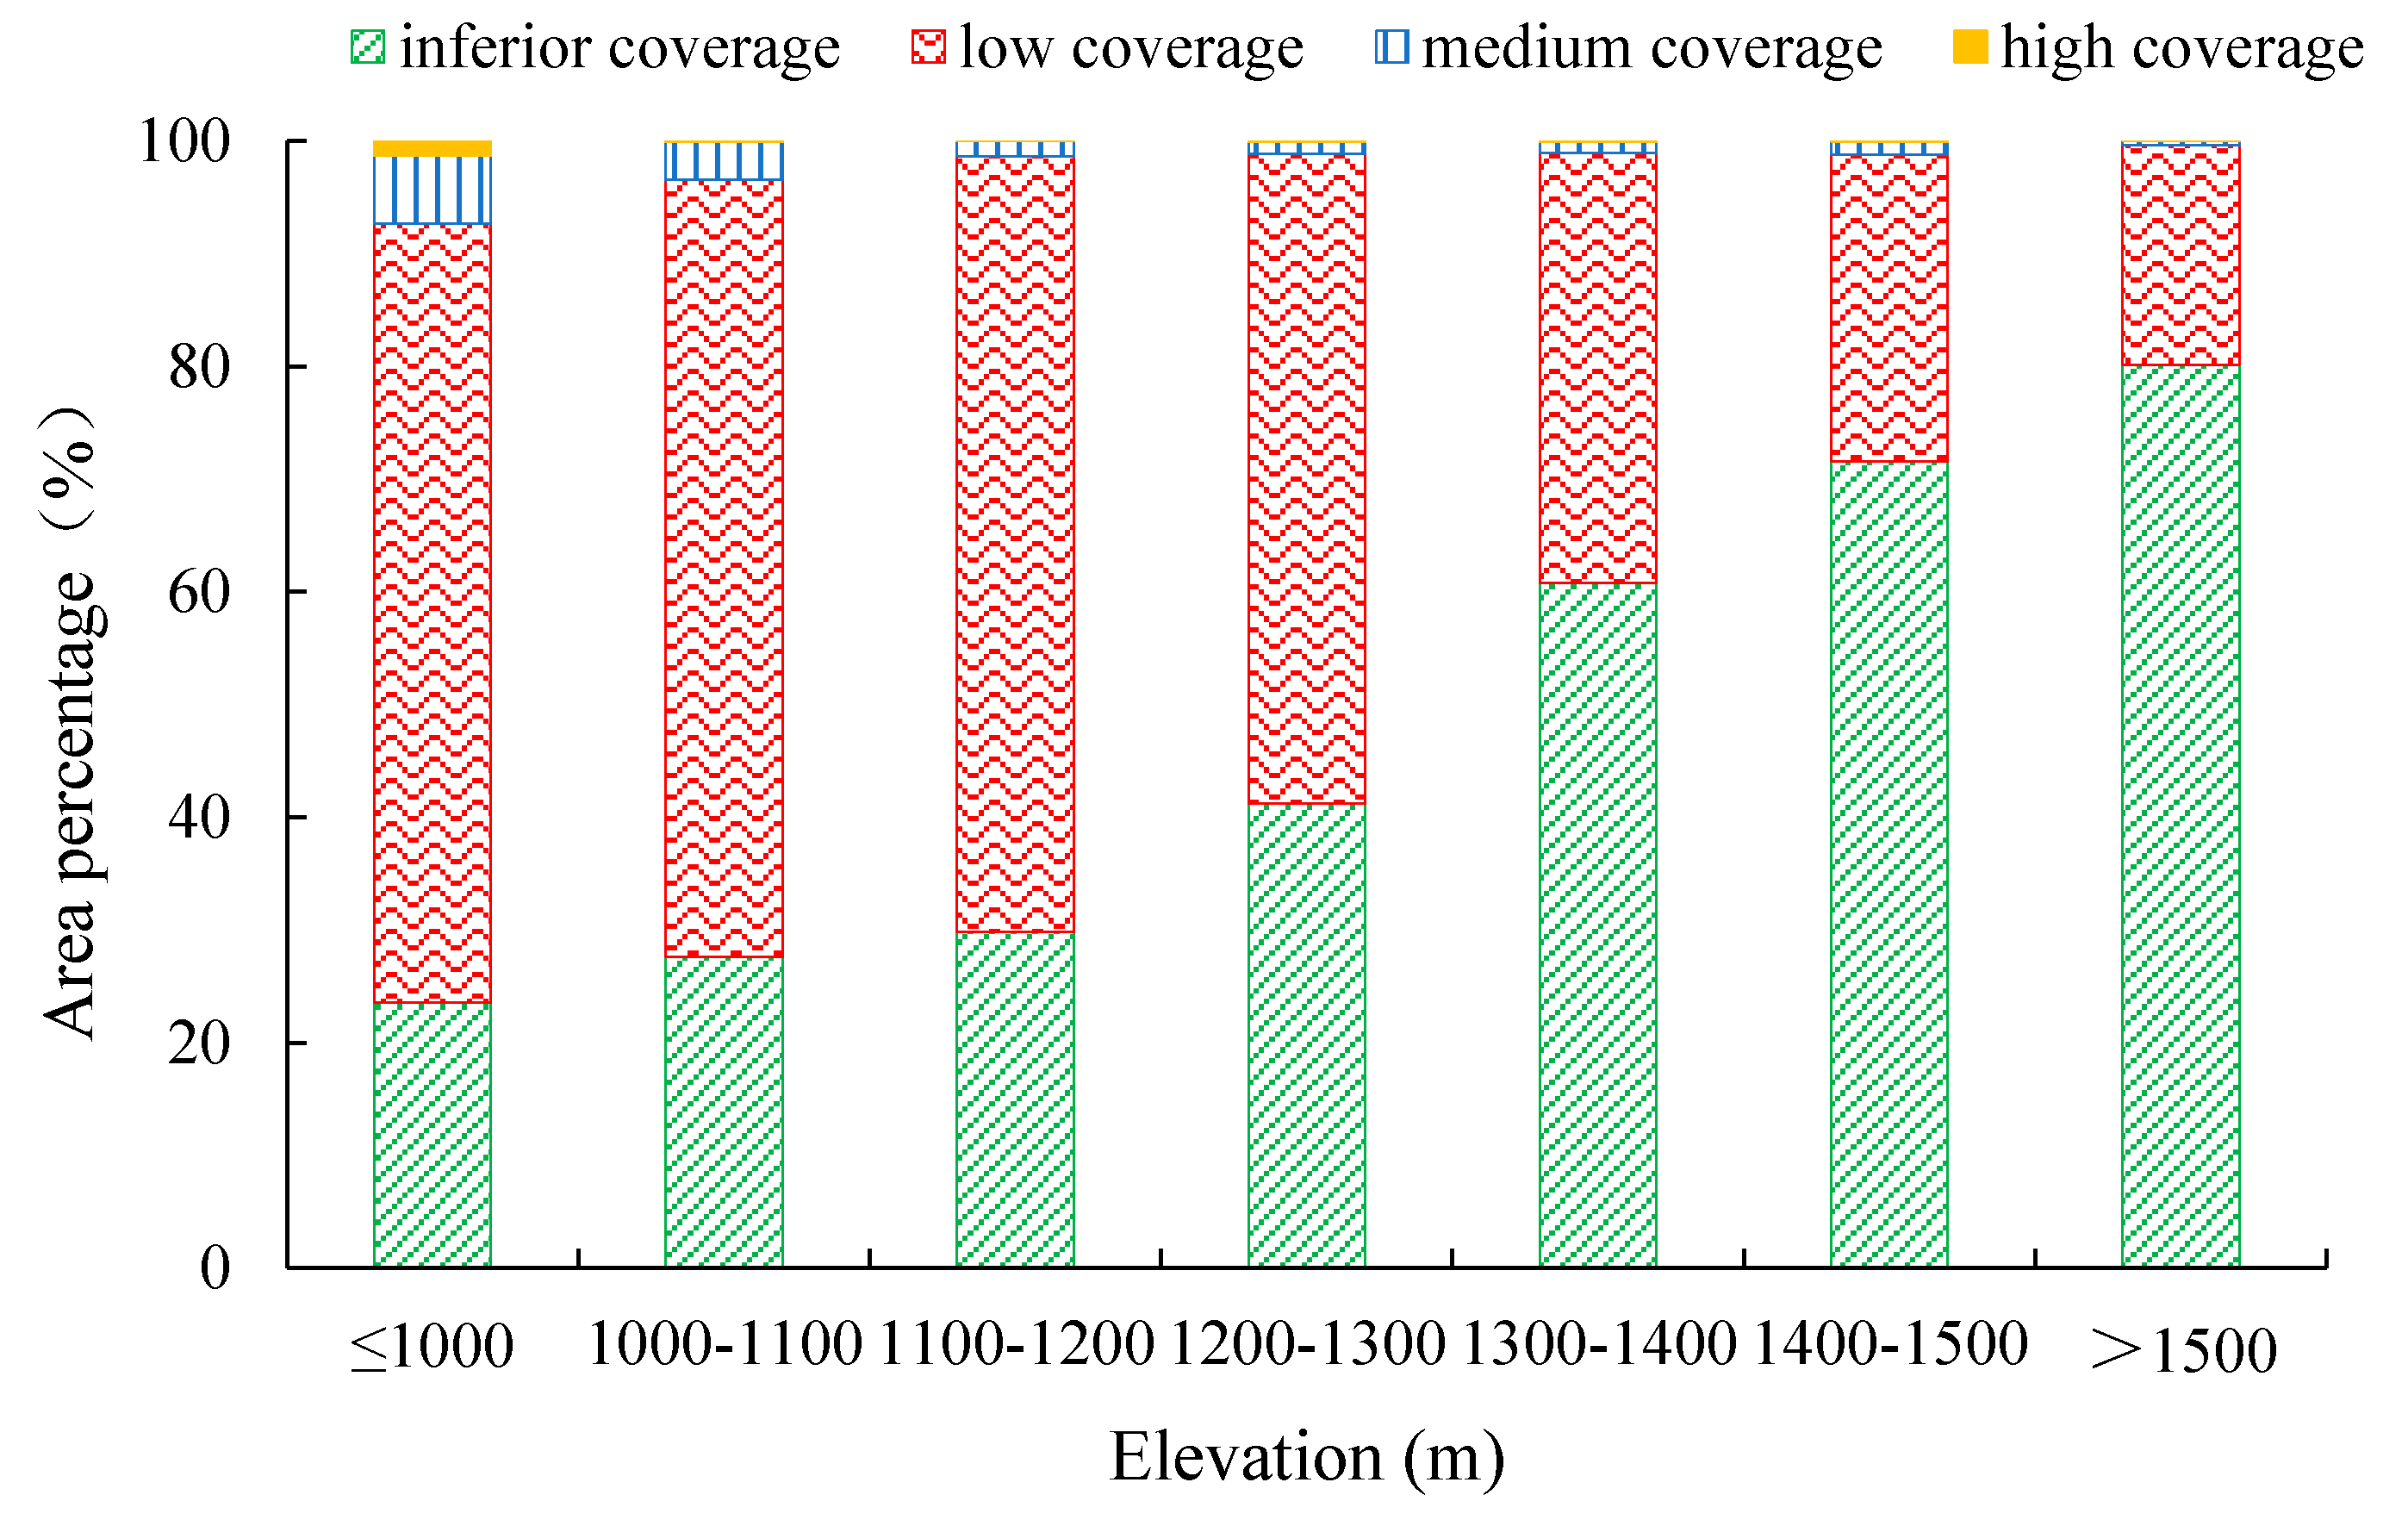
Figure 8.
Variations in fractional vegetation coverage and elevation in different Pisha Sandstone types.
Figure 8.
Variations in fractional vegetation coverage and elevation in different Pisha Sandstone types.

Figure 9.
Variations in topographic distribution index and elevation in different fractional vegetation coverage levels. (a) Bare Pisha sandstone; (b) Sand-covered Pisha sandstone; (c) Soil-covered Pisha sandstone.
Figure 9.
Variations in topographic distribution index and elevation in different fractional vegetation coverage levels. (a) Bare Pisha sandstone; (b) Sand-covered Pisha sandstone; (c) Soil-covered Pisha sandstone.

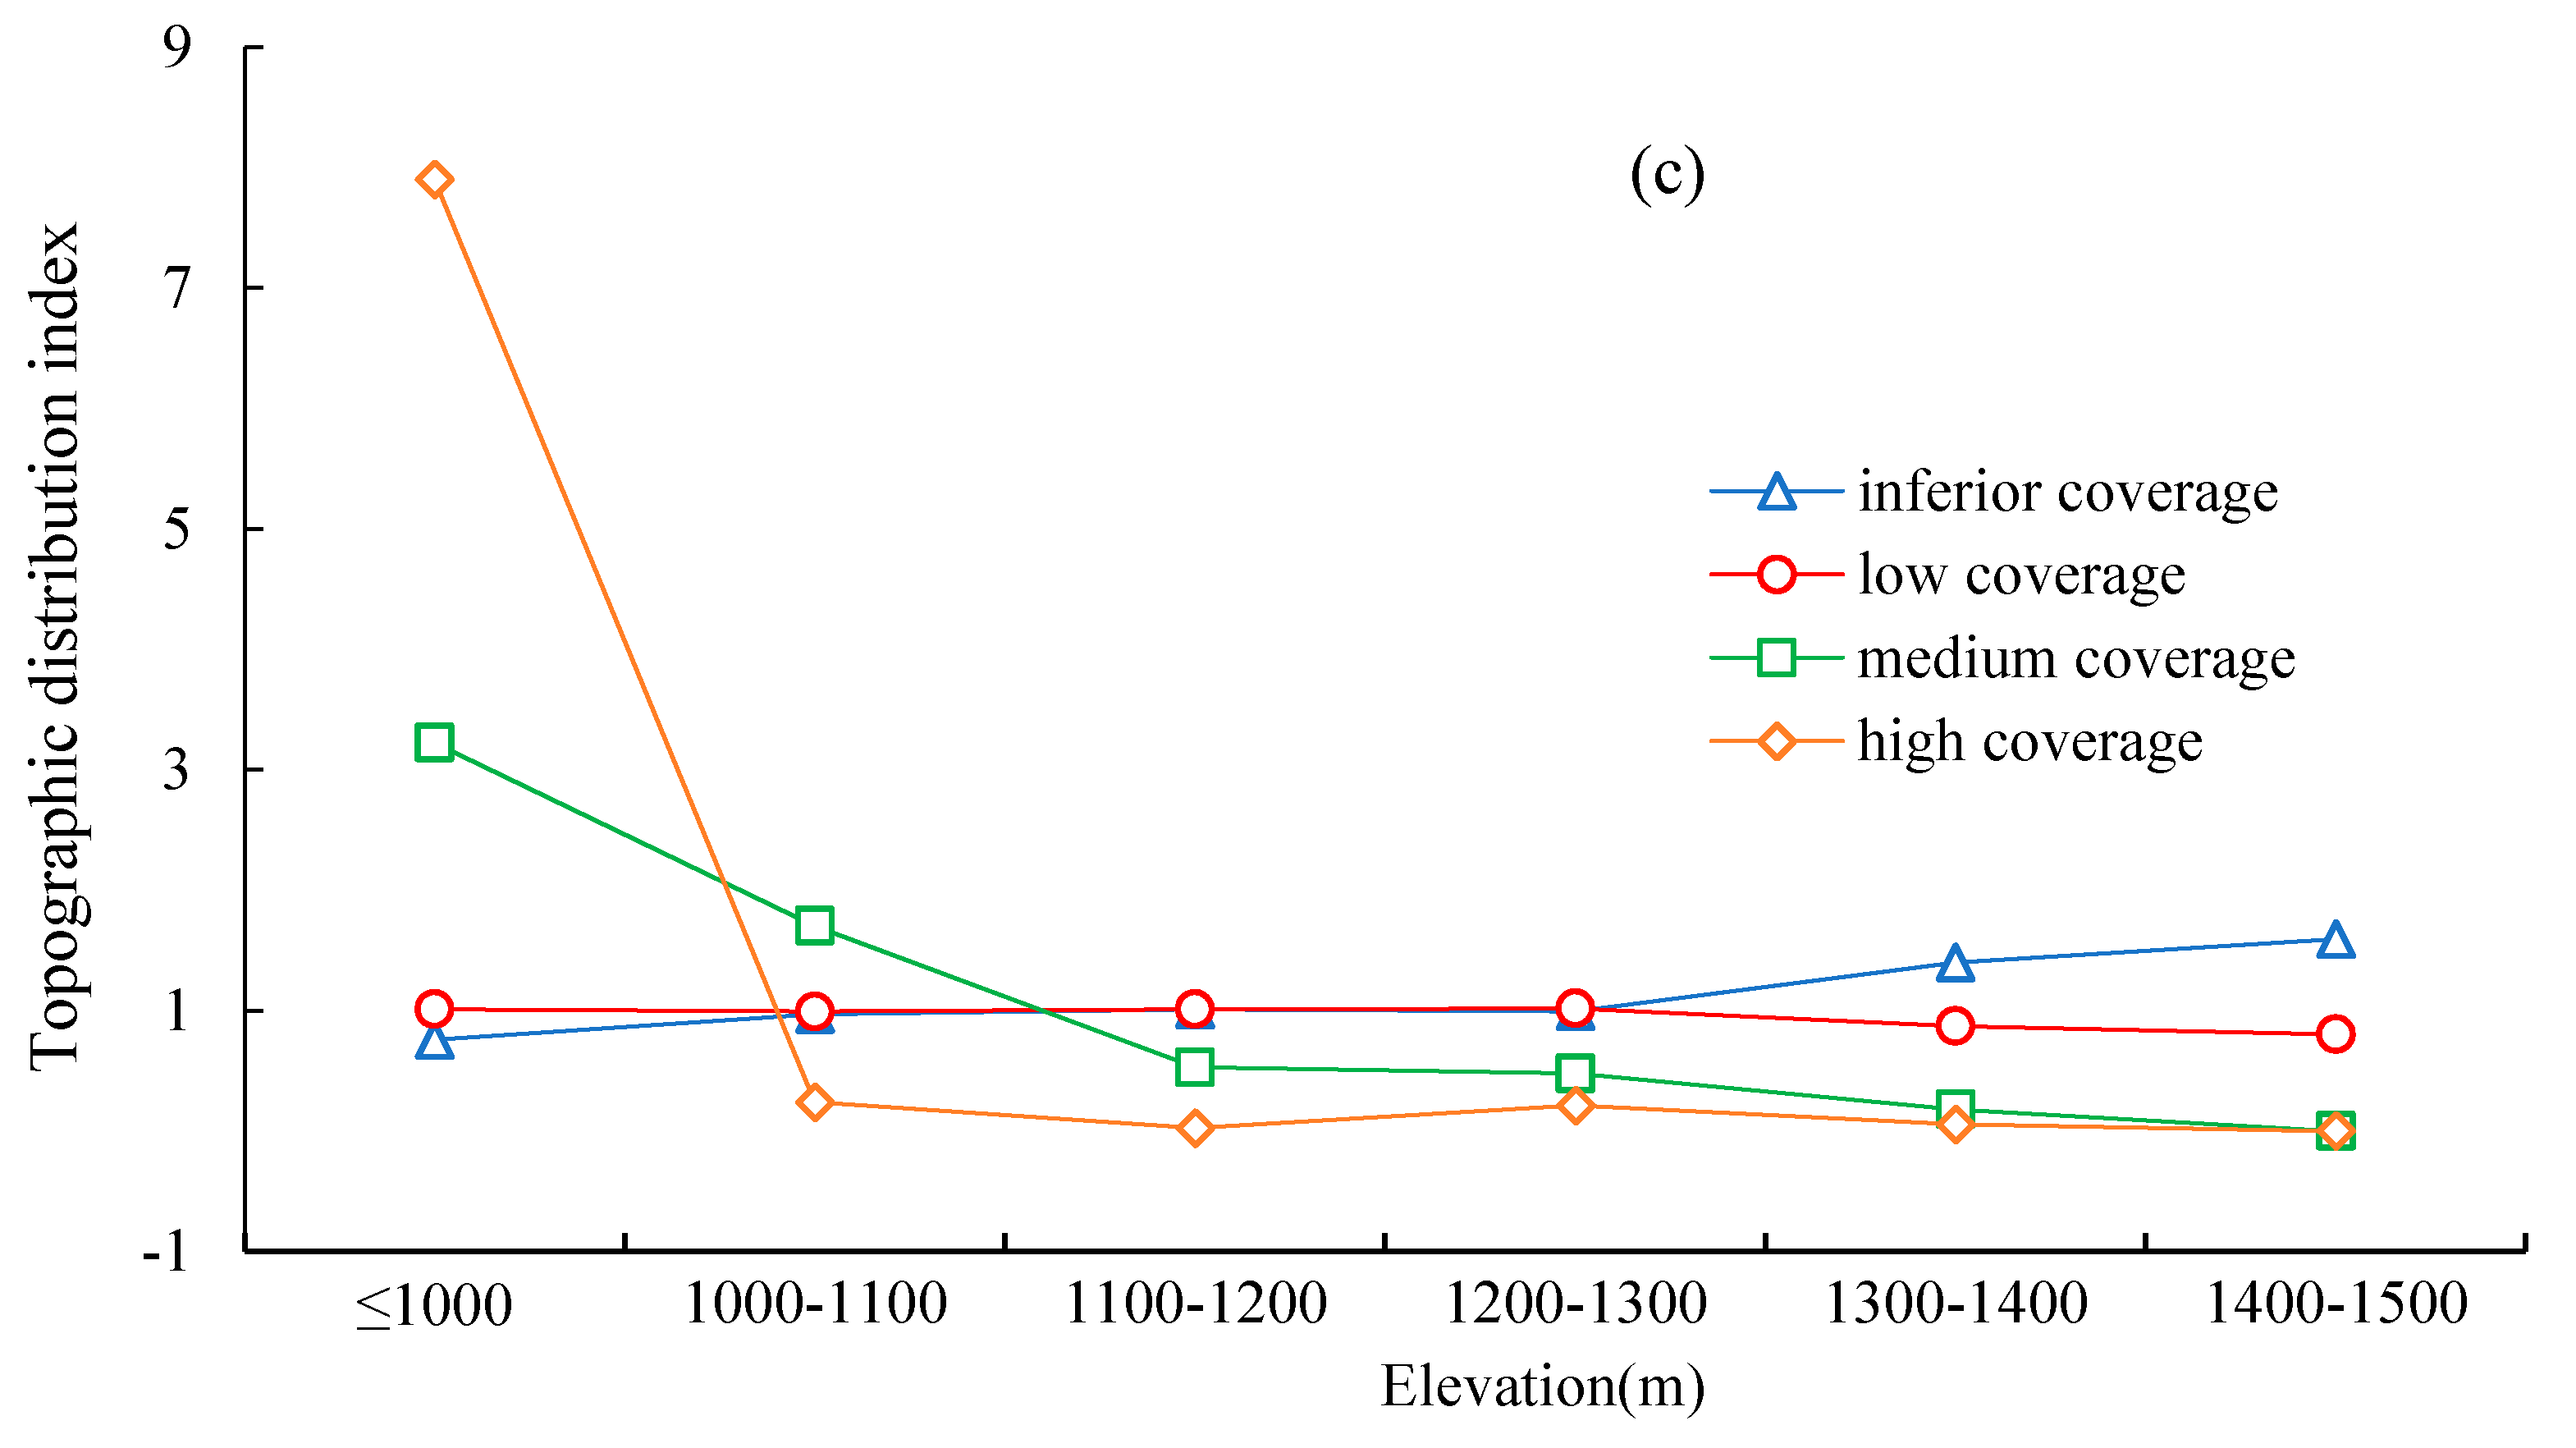
Figure 10.
Area percentage of vegetation coverage in different slopes.

Figure 11.
Variations of fractional vegetation coverage and slope in different Pisha sandstone types.
Figure 11.
Variations of fractional vegetation coverage and slope in different Pisha sandstone types.
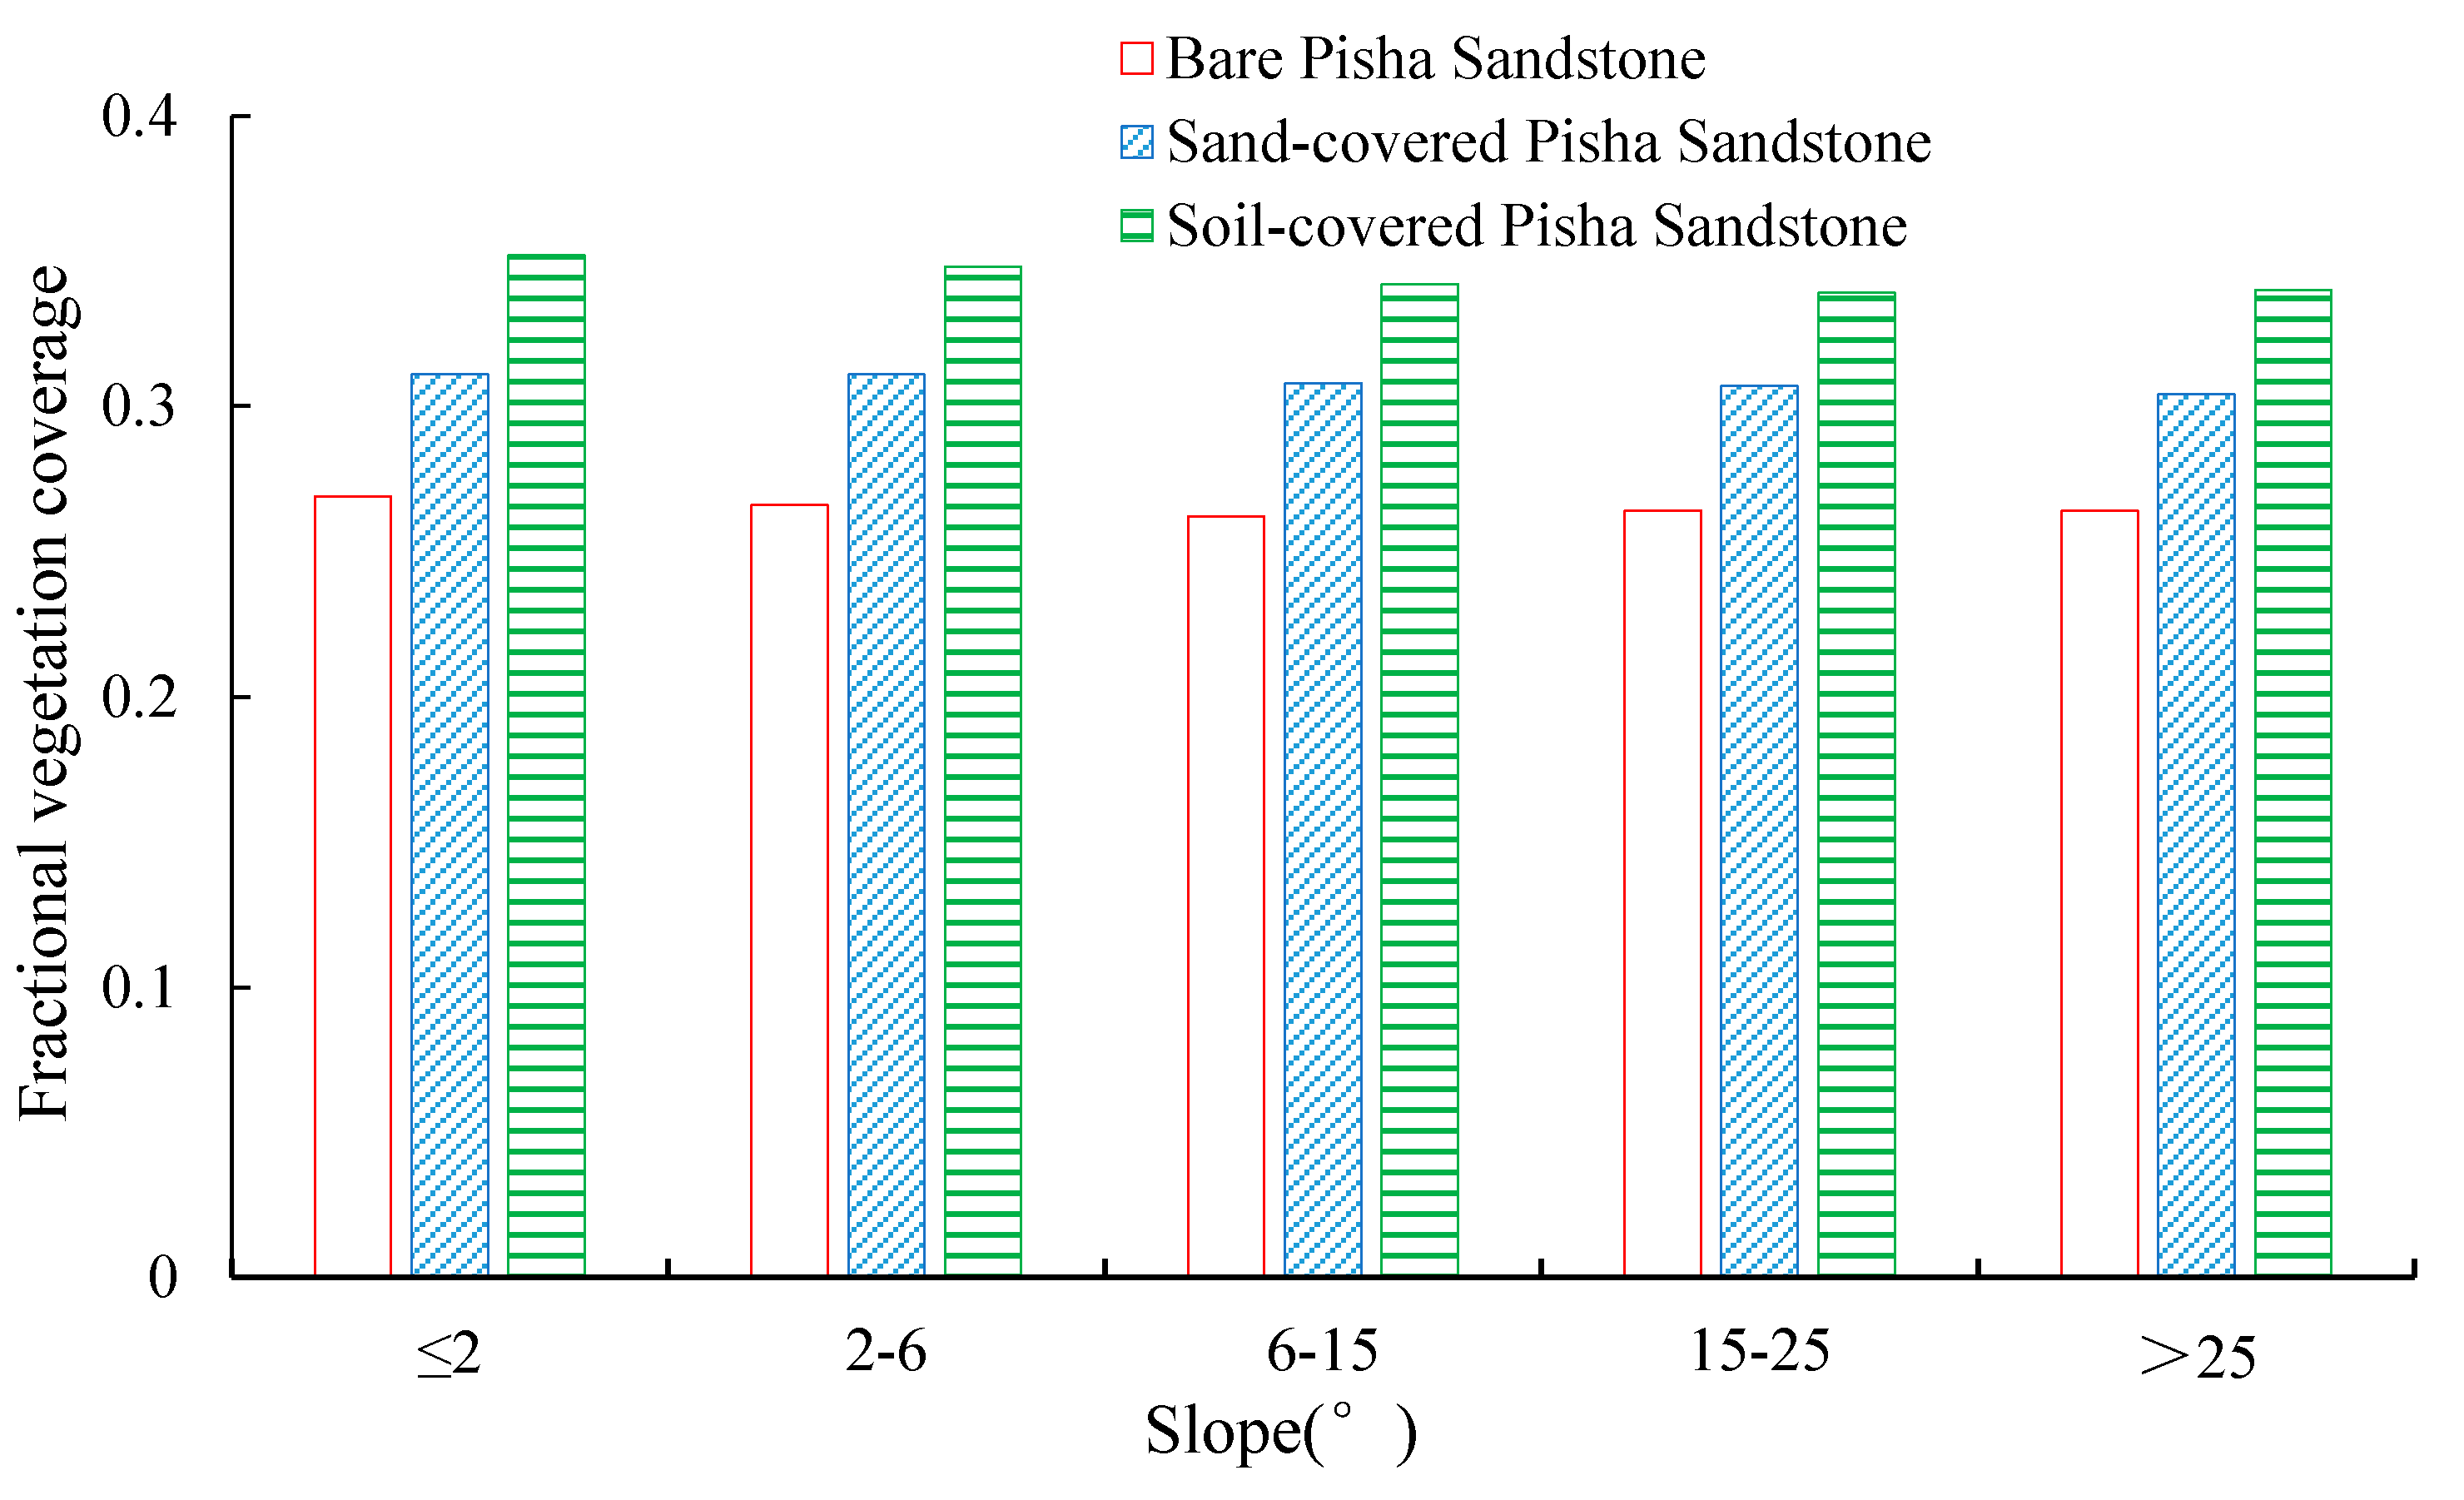
Figure 12.
Variations in topographic distribution index and slope in different fractional vegetation coverage levels. (a) Bare Pisha sandstone; (b) Sand-covered Pisha sandstone; (c) Soil-covered Pisha sandstone.
Figure 12.
Variations in topographic distribution index and slope in different fractional vegetation coverage levels. (a) Bare Pisha sandstone; (b) Sand-covered Pisha sandstone; (c) Soil-covered Pisha sandstone.
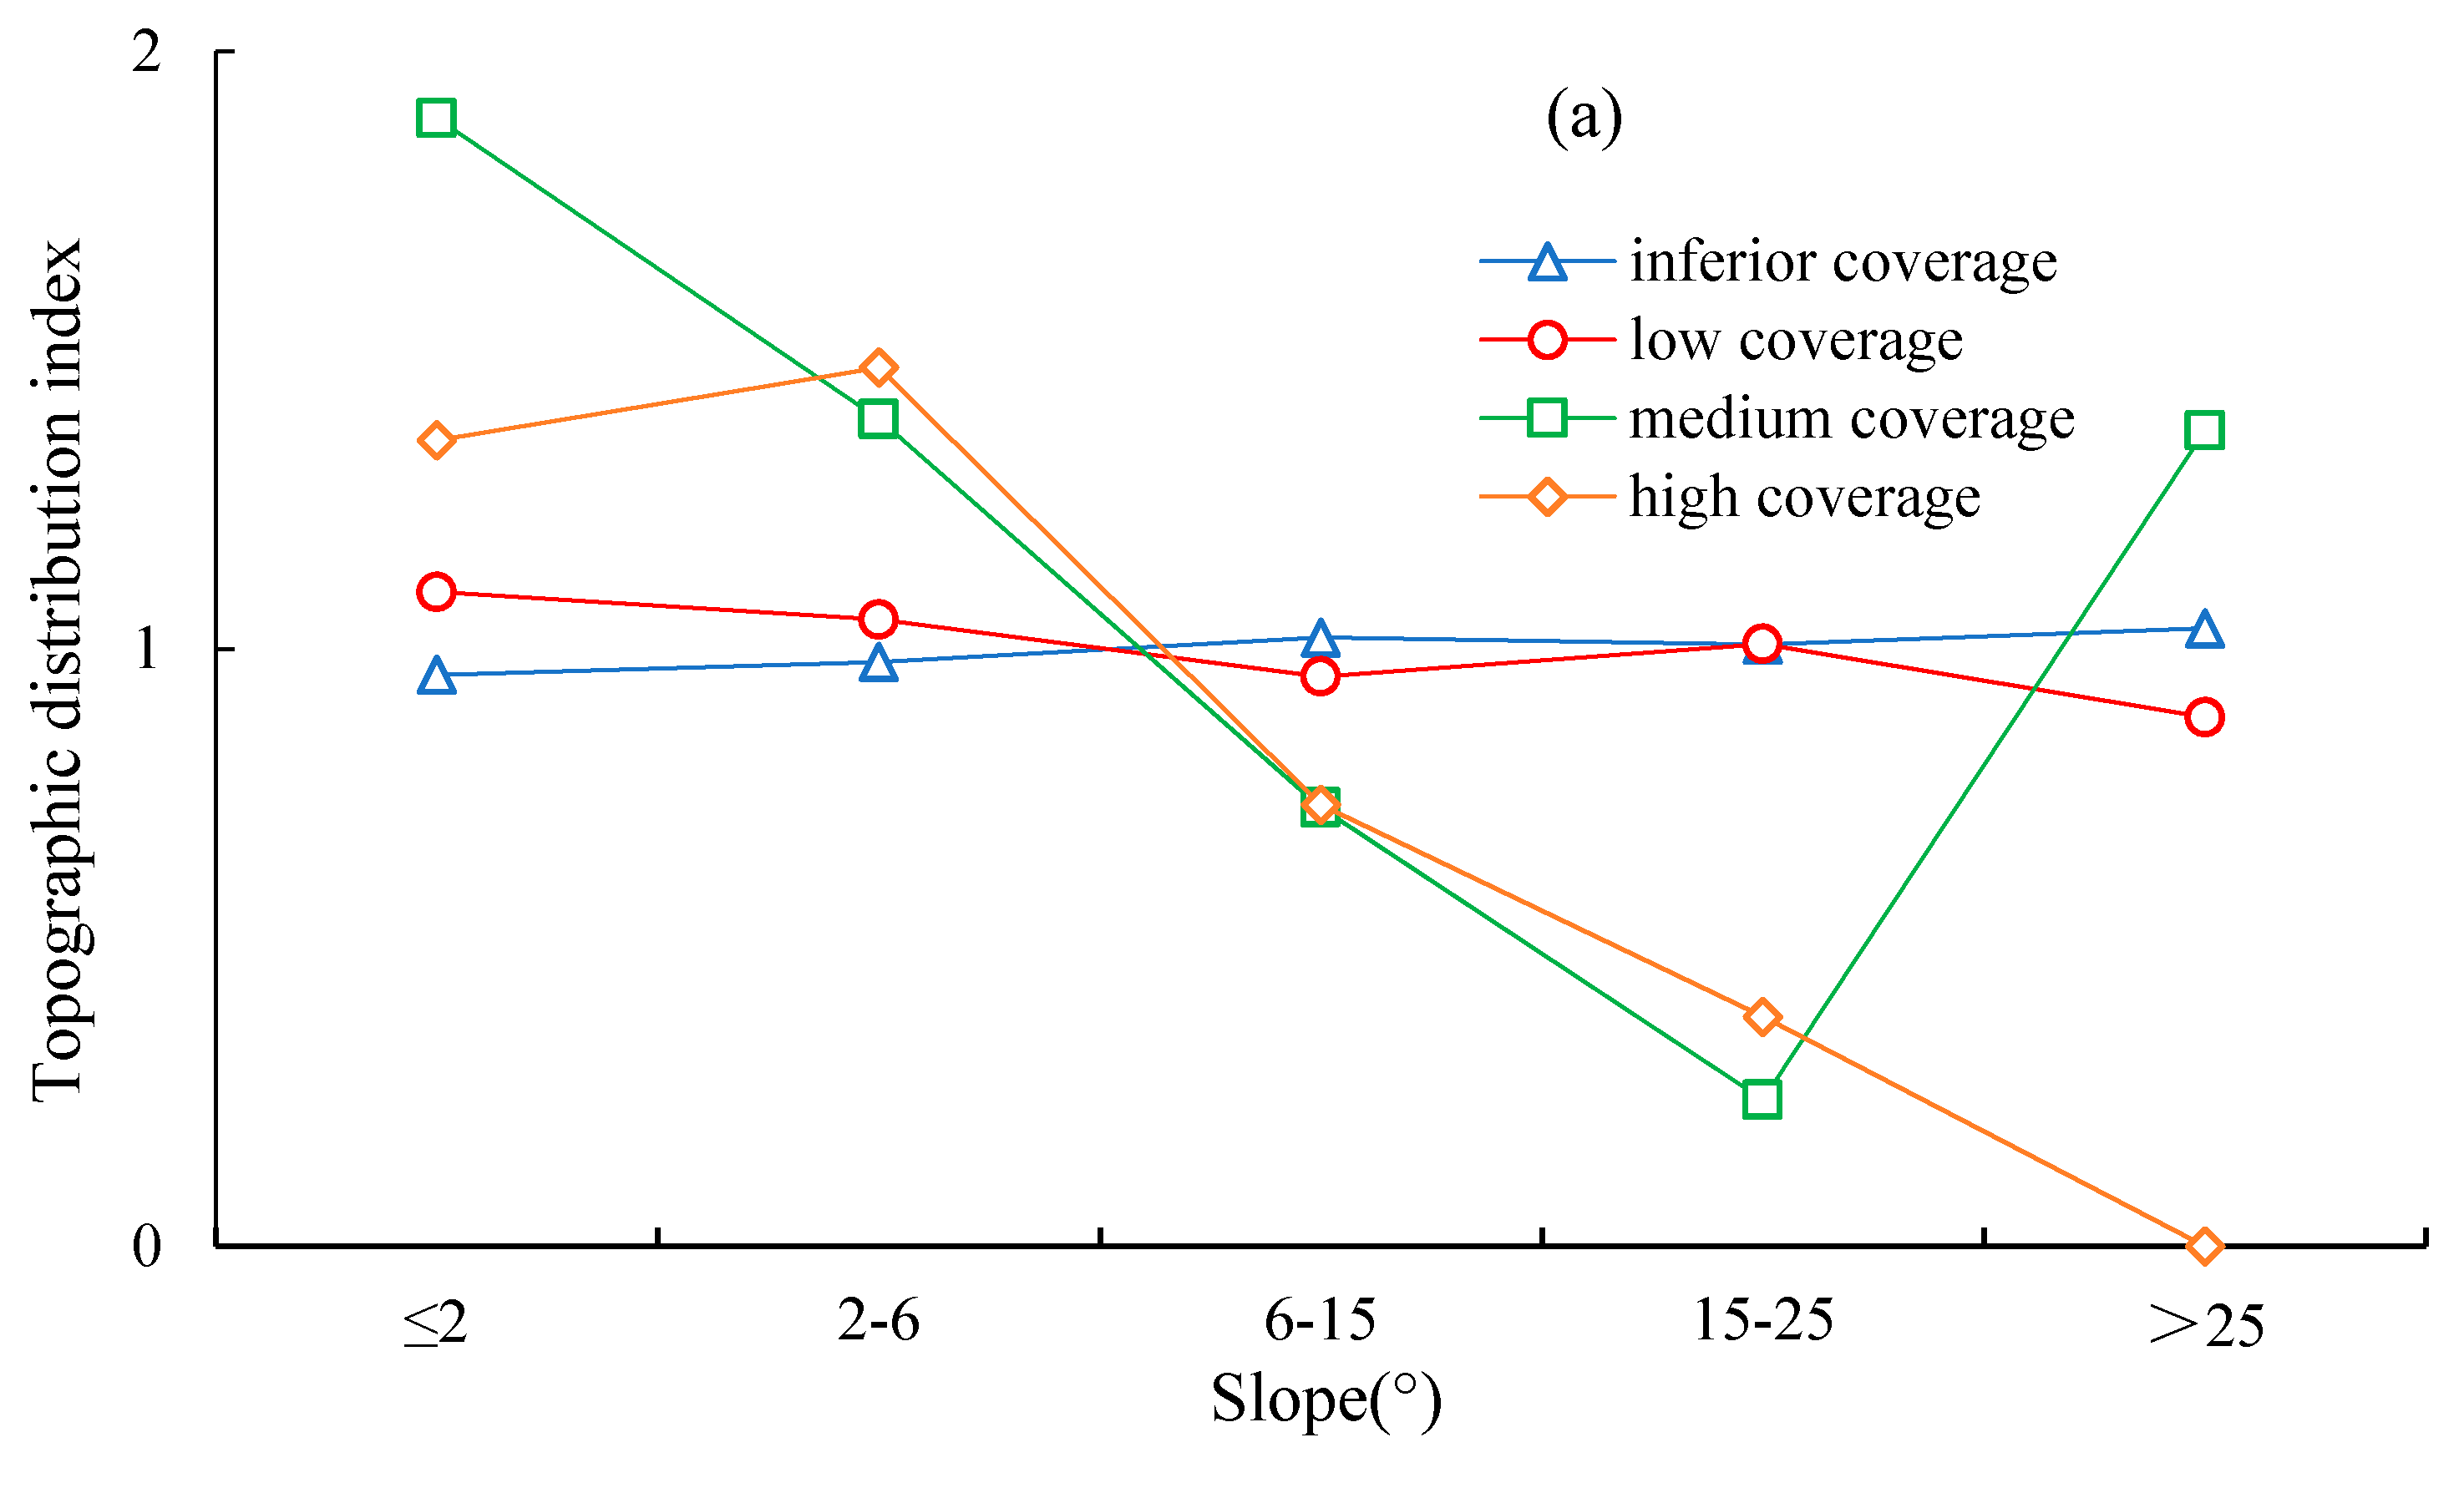

Figure 13.
Area percentage of vegetation coverage in different aspects.
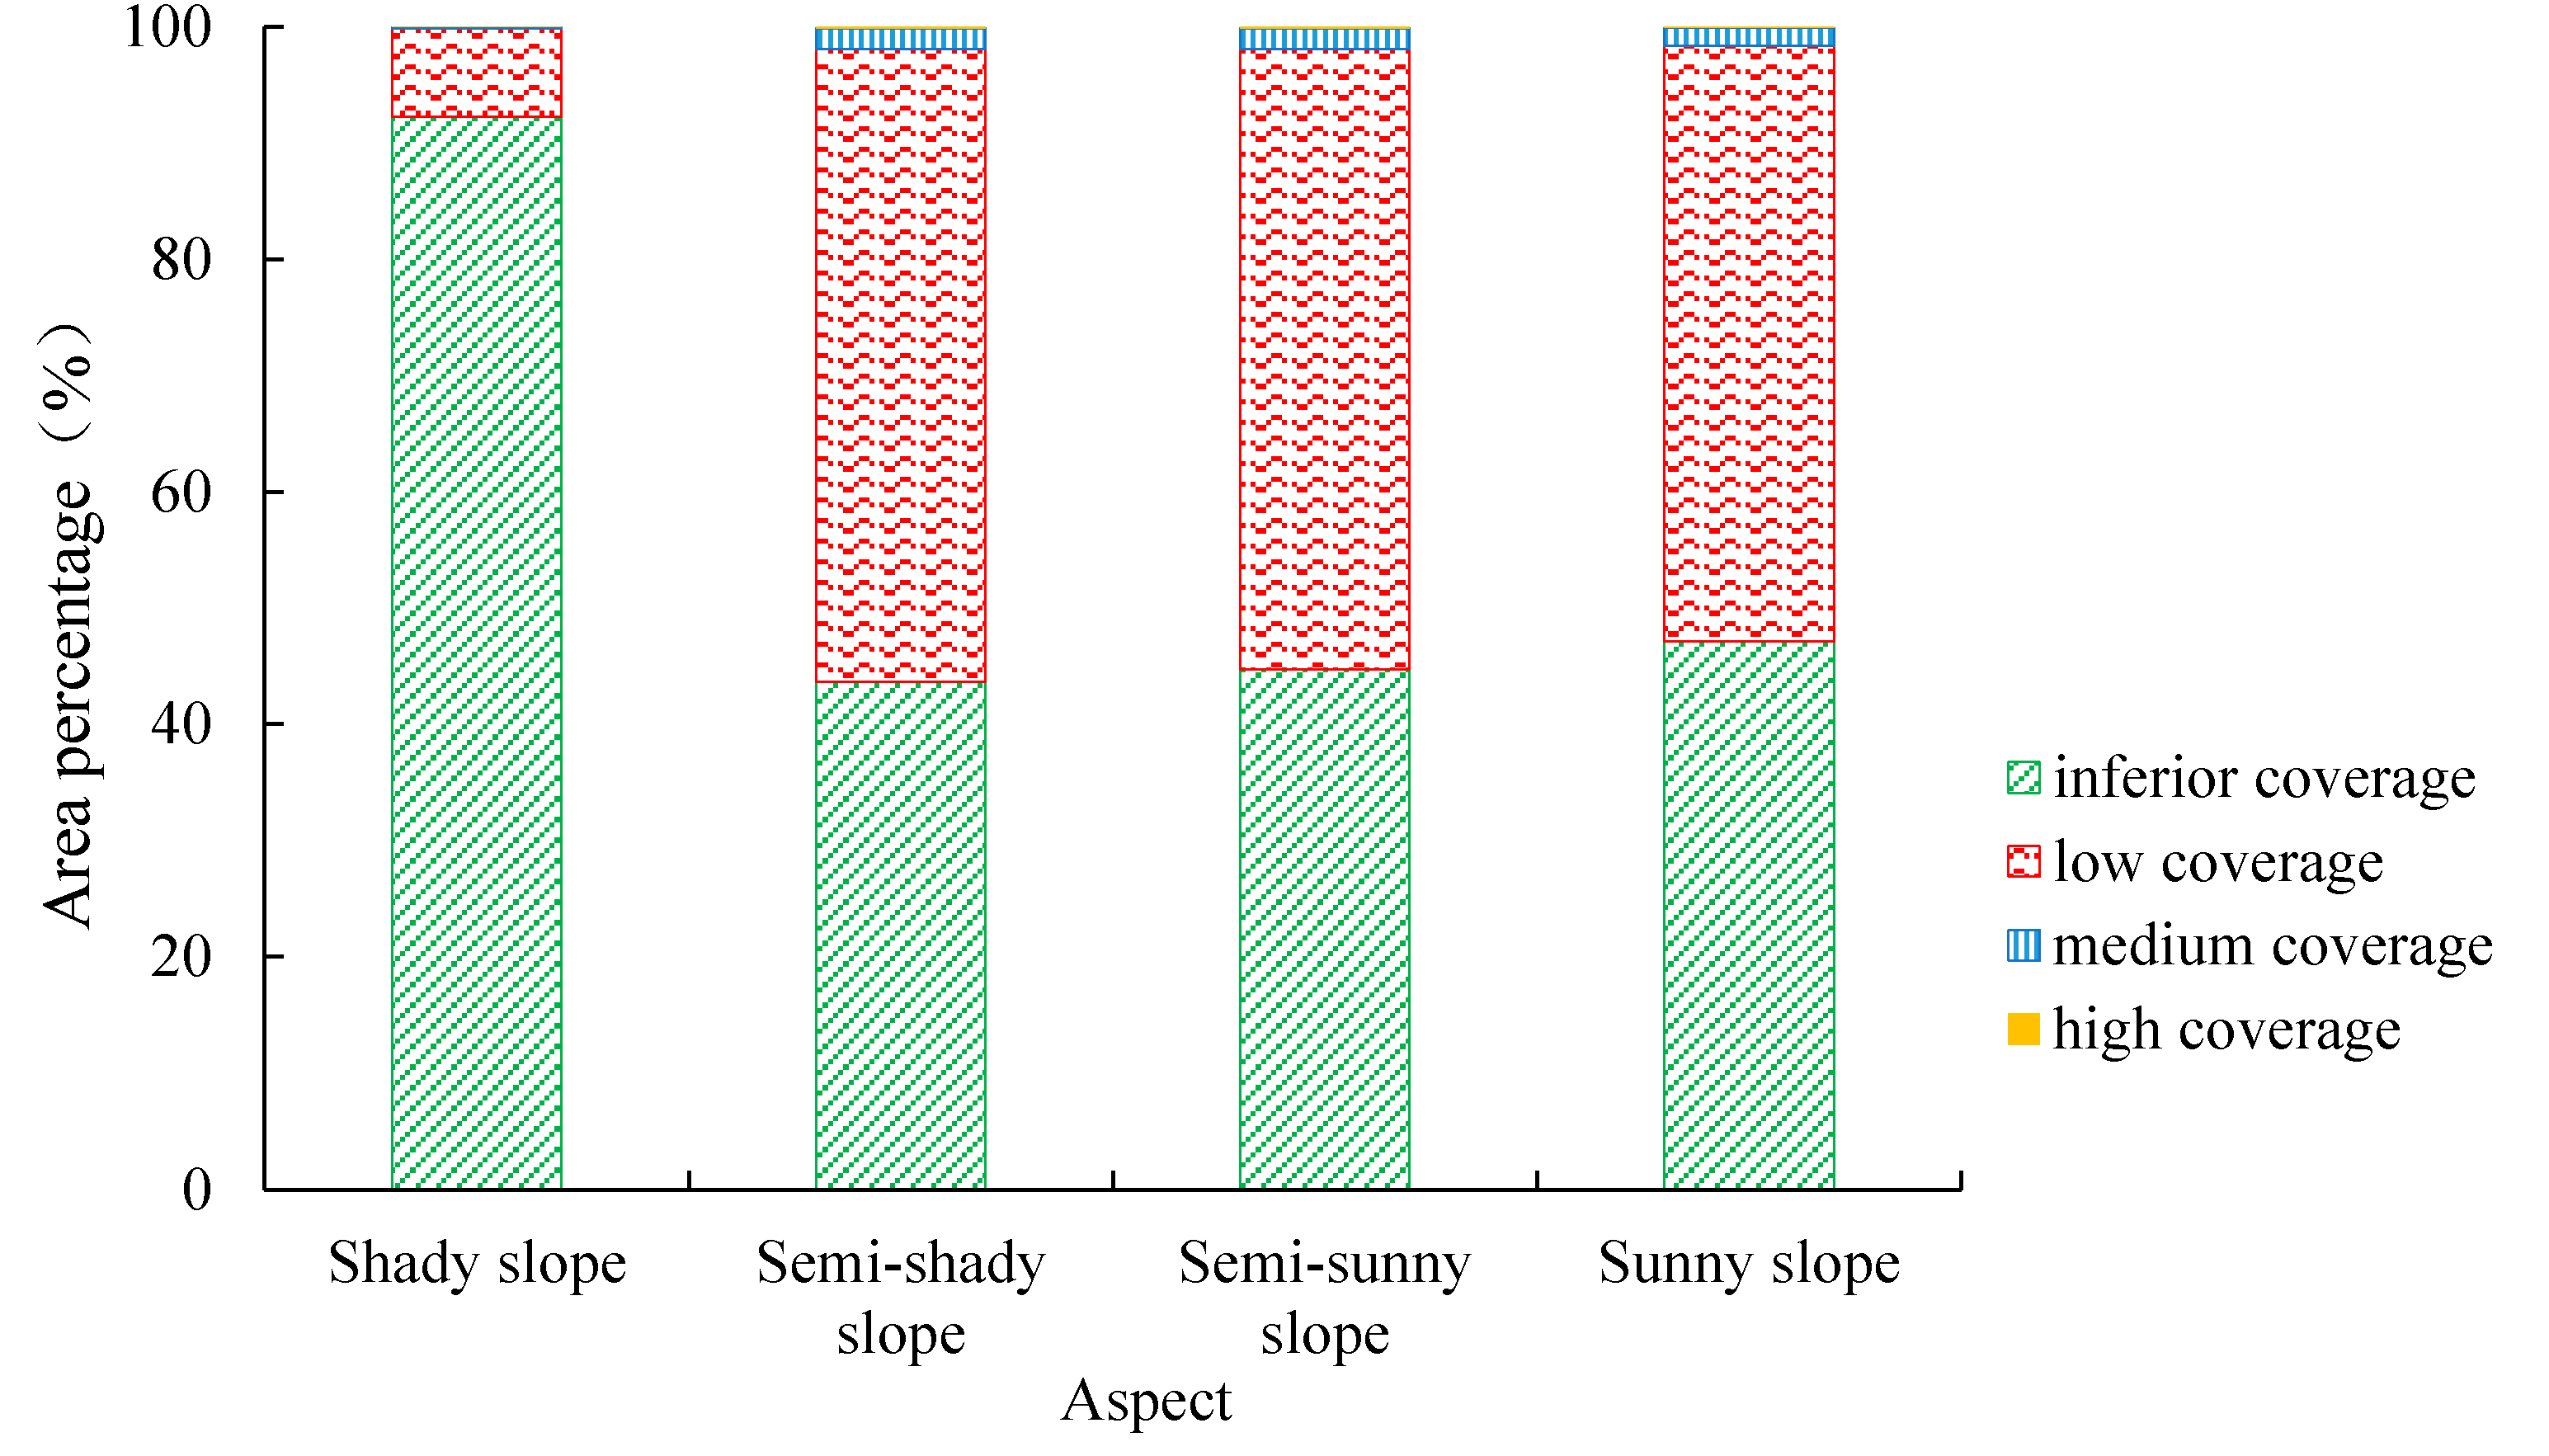
Figure 14.
Variations of fractional vegetation coverage and aspect in different Pisha Sandstone types.
Figure 14.
Variations of fractional vegetation coverage and aspect in different Pisha Sandstone types.
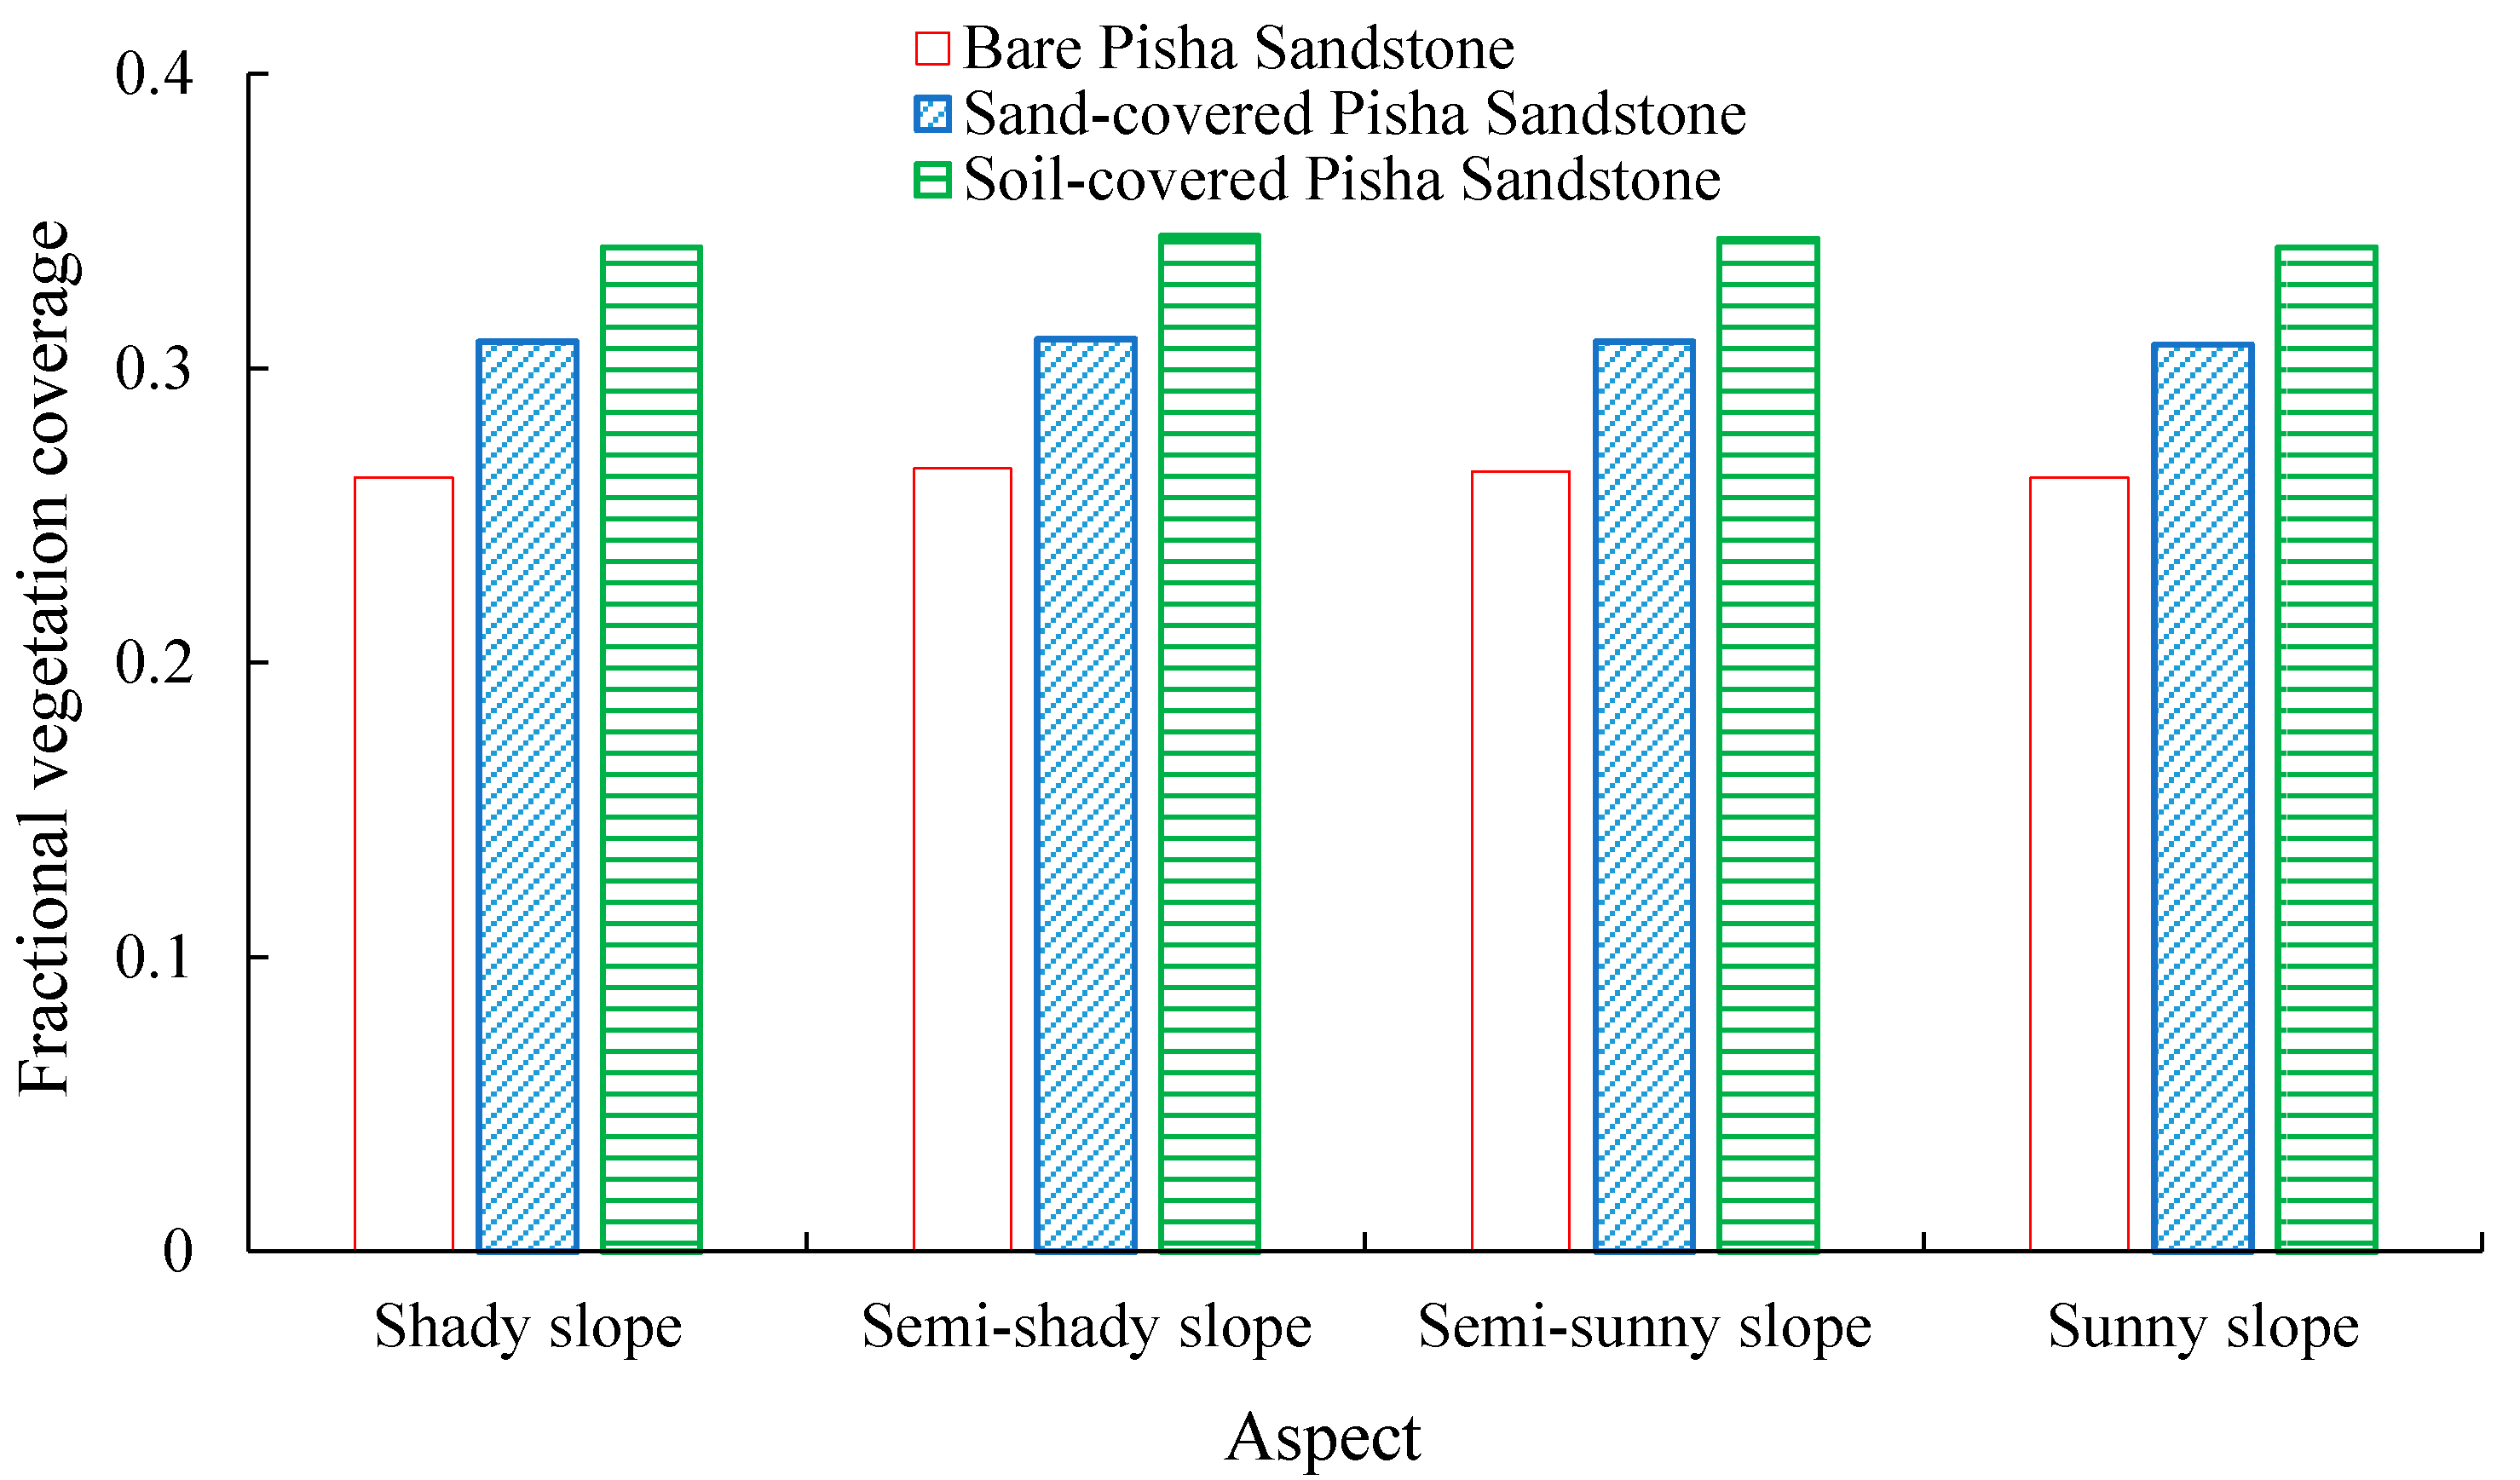
Figure 15.
Variations in topographic distribution index and aspect in different FVC levels. (a) Bare Pisha sandstone; (b) Sand-covered Pisha sandstone; (c) Soil-covered Pisha sandstone.
Figure 15.
Variations in topographic distribution index and aspect in different FVC levels. (a) Bare Pisha sandstone; (b) Sand-covered Pisha sandstone; (c) Soil-covered Pisha sandstone.
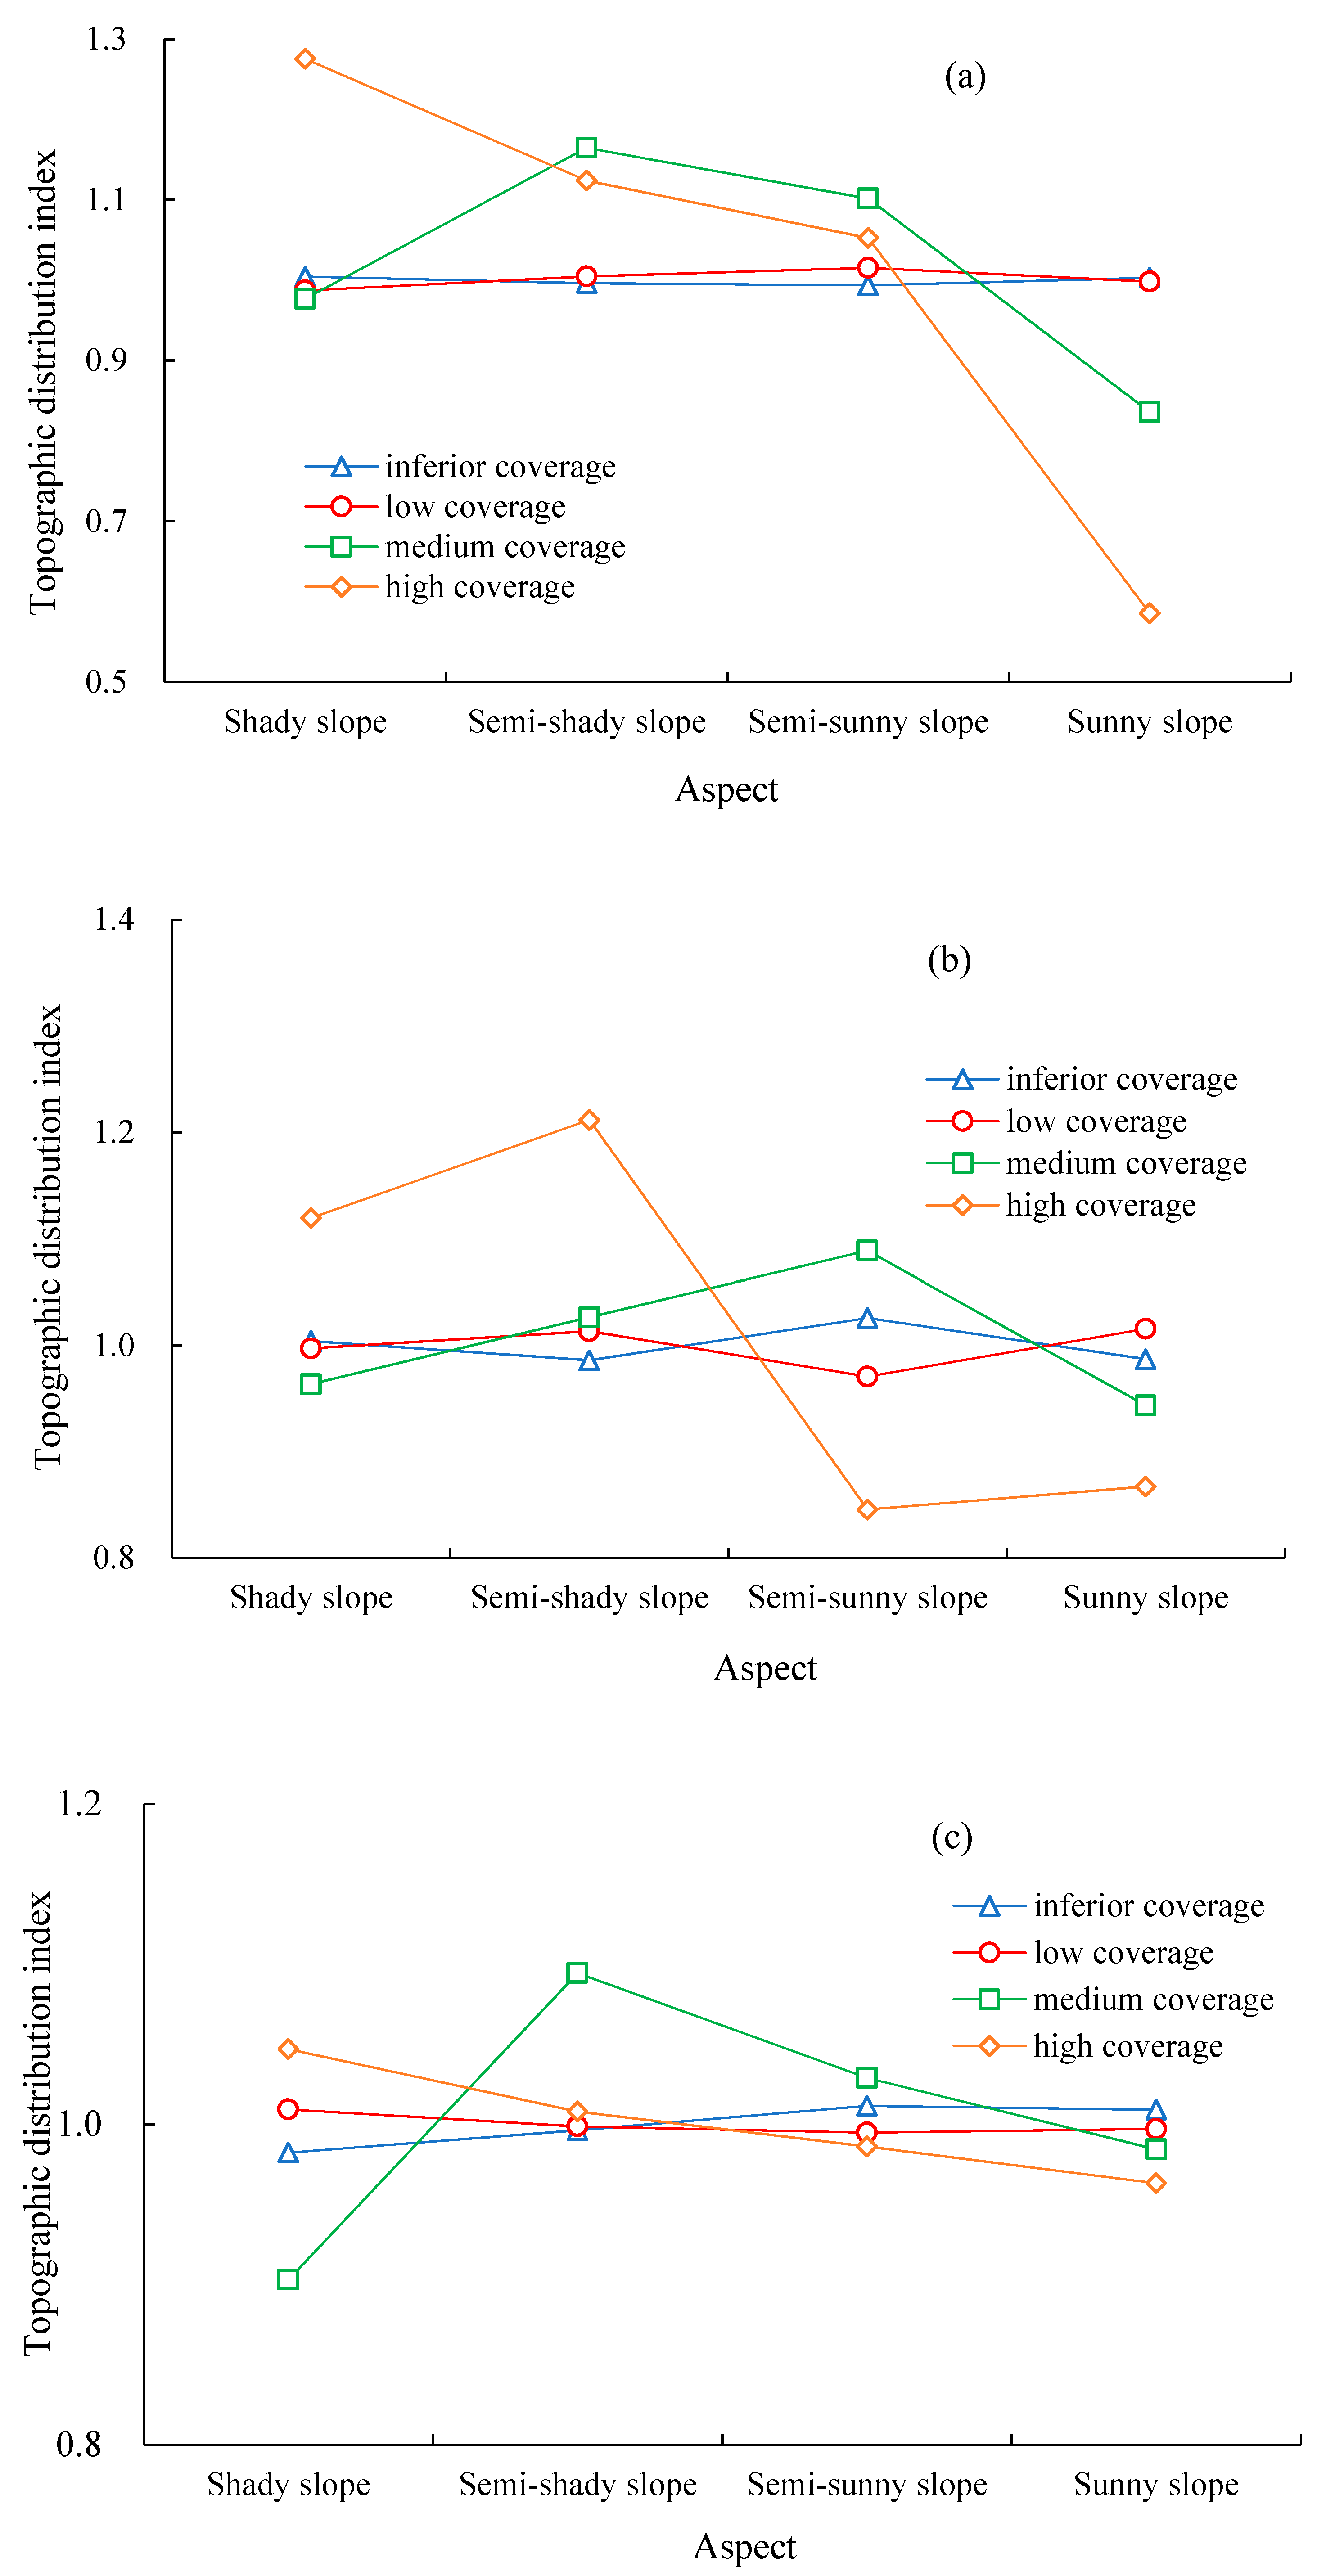
Figure 16.
Variations in precipitation and temperature from 2000 to 2019.
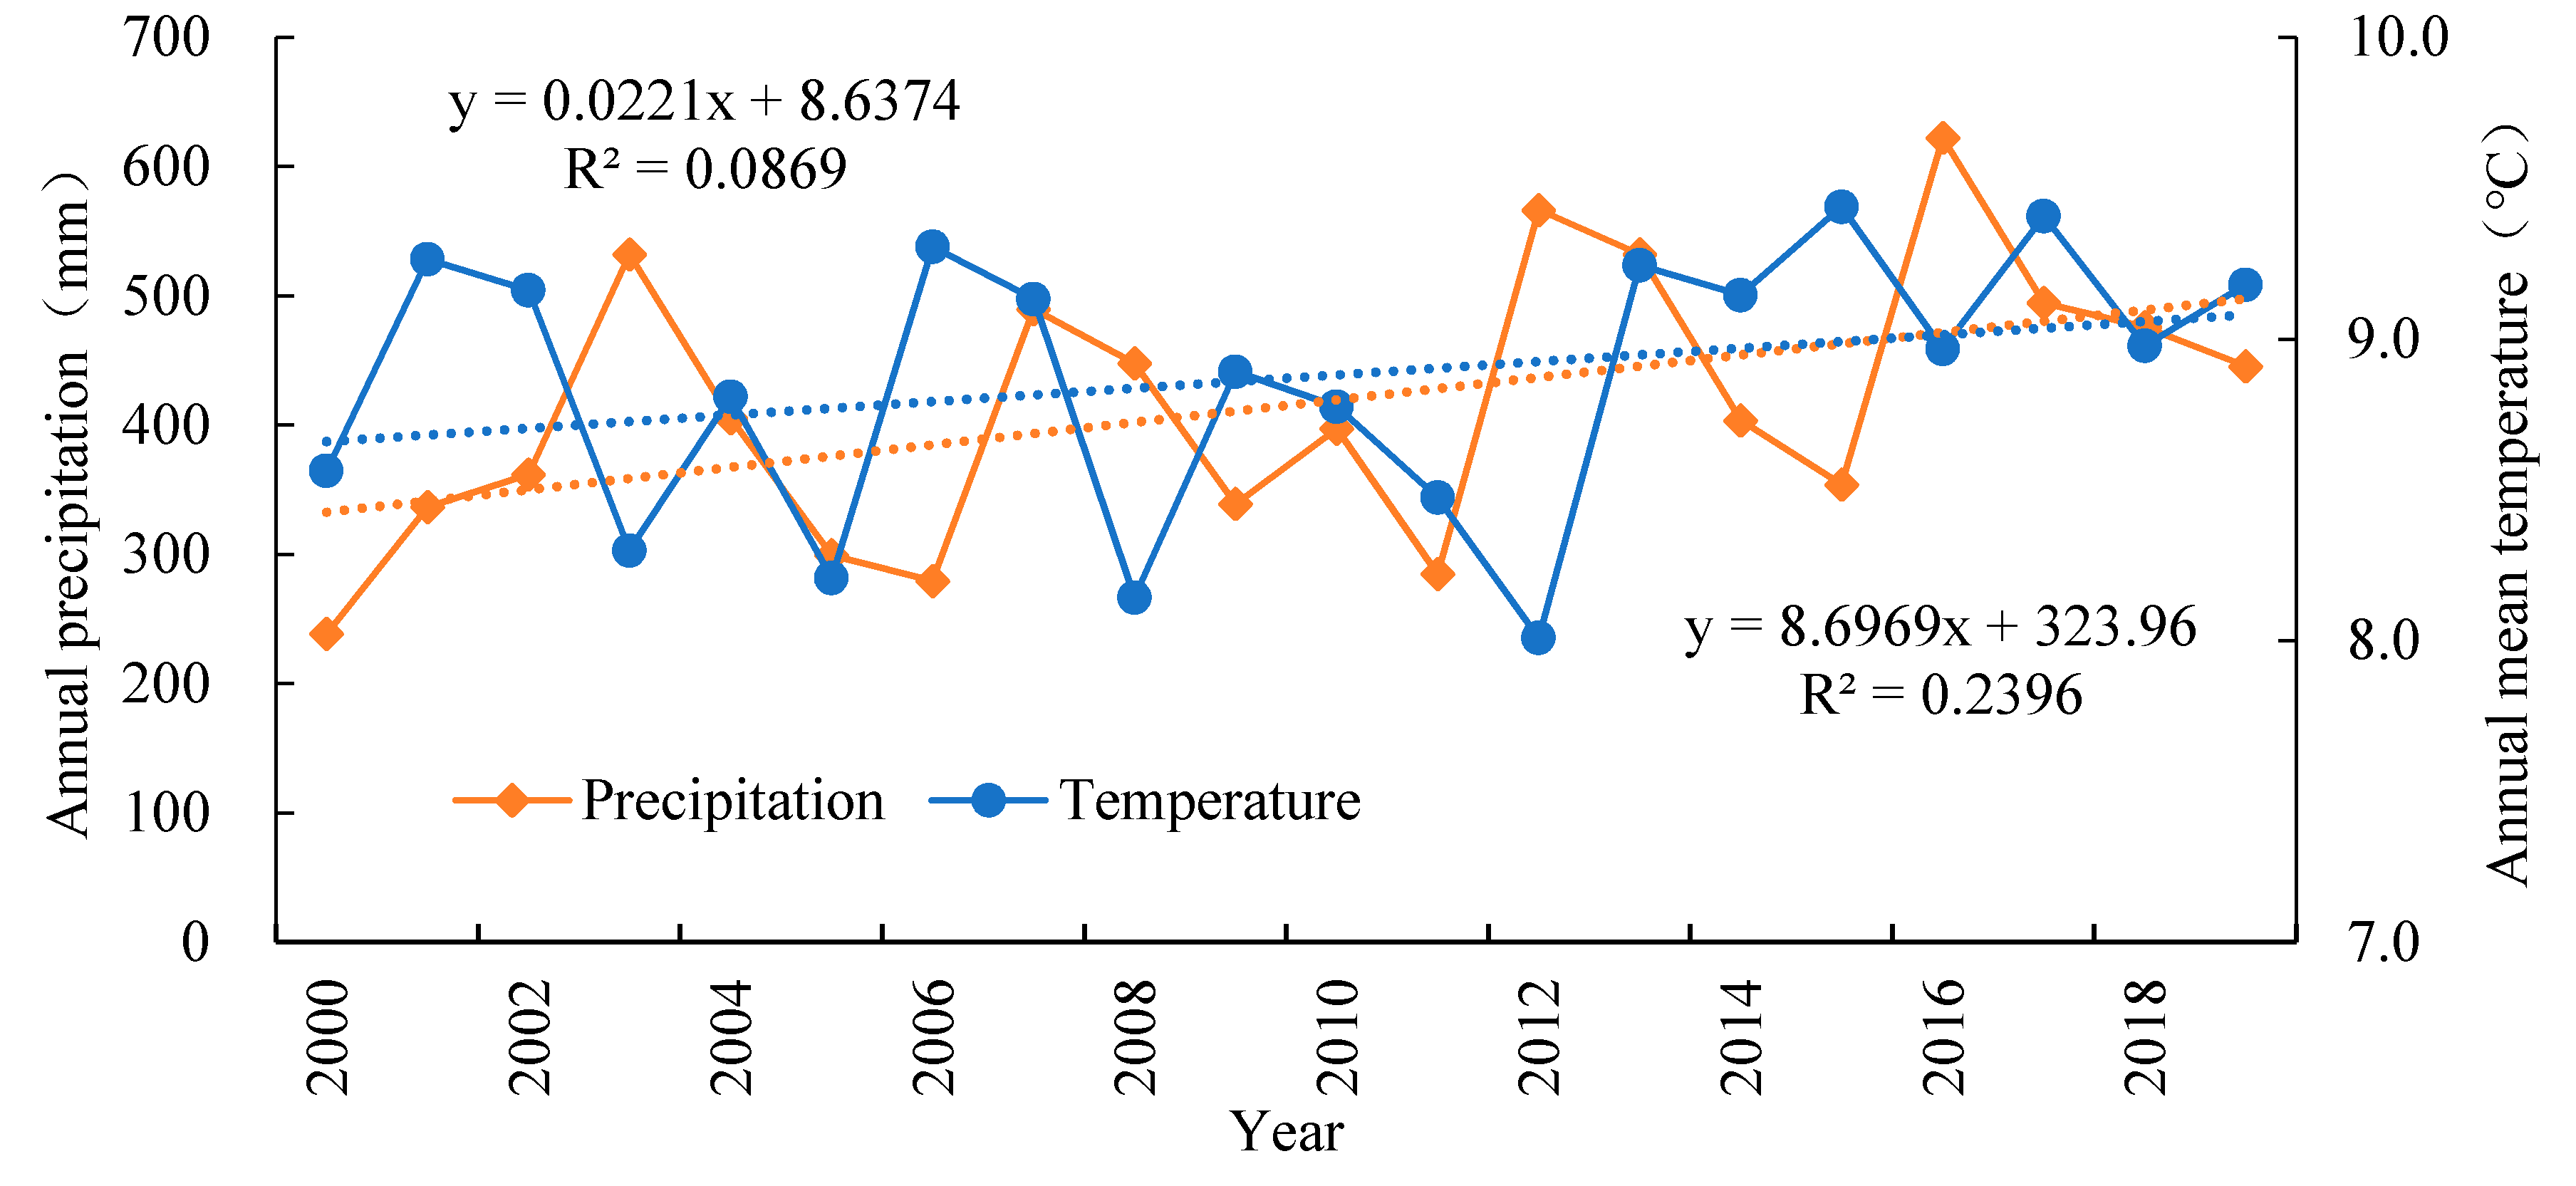
Figure 17.
Correlation coefficient of precipitation, temperature and fractional vegetation coverage. (a) Precipitation & fractional vegetation coverage; (b) Temperature & fractional vegetation coverage.
Figure 17.
Correlation coefficient of precipitation, temperature and fractional vegetation coverage. (a) Precipitation & fractional vegetation coverage; (b) Temperature & fractional vegetation coverage.

Table 1.
Fractional vegetation coverage in sunny slope of soil-covered Pisha Sandstone area.
| Elevation | Fractional Vegetation Coverage | ||
|---|---|---|---|
| Slope ≤ 15° | 15° < Slope < 25° | Slope > 25° | |
| ≤1200 m | 0.254–0.373 | 0.250–0.365 | 0.244–0.359 |
| 1200–1300 m | 0.245–0.353 | 0.246–0.352 | 0.248–0.352 |
| >1300 m | 0.227–0.332 | 0.232–0.335 | 0.237–0.339 |
© 2020 by the authors. Licensee MDPI, Basel, Switzerland. This article is an open access article distributed under the terms and conditions of the Creative Commons Attribution (CC BY) license (http://creativecommons.org/licenses/by/4.0/).
Share and Cite
MDPI and ACS Style
Wang, R.; Yan, F.; Wang, Y. Vegetation Growth Status and Topographic Effects in the Pisha Sandstone Area of China. Remote Sens. 2020, 12, 2759. https://doi.org/10.3390/rs12172759
AMA Style
Wang R, Yan F, Wang Y. Vegetation Growth Status and Topographic Effects in the Pisha Sandstone Area of China. Remote Sensing. 2020; 12(17):2759. https://doi.org/10.3390/rs12172759
Chicago/Turabian StyleWang, Ruijie, Feng Yan, and Yanjiao Wang. 2020. "Vegetation Growth Status and Topographic Effects in the Pisha Sandstone Area of China" Remote Sensing 12, no. 17: 2759. https://doi.org/10.3390/rs12172759
Note that from the first issue of 2016, this journal uses article numbers instead of page numbers. See further details here.