Technical Note

The Accuracy of Real-Time hmF2 Estimation from Ionosondes

Istituto Nazionale di Geofisica e Vulcanologia, Via di Vigna Murata 605, 00143 Rome, Italy
*
Author to whom correspondence should be addressed.
Remote Sens. 2020, 12(17), 2671; https://doi.org/10.3390/rs12172671
Submission received: 24 July 2020 / Revised: 10 August 2020 / Accepted: 12 August 2020 / Published: 19 August 2020
(This article belongs to the Section Atmospheric Remote Sensing)

Abstract

:
A total of 4991 ionograms recorded from April 1997 to December 2017 by the Millstone Hill Digisonde (42.6°N, 288.5°E) were considered, with simultaneous Ne(h)[ISR] profiles recorded by the co-located Incoherent Scatter Radar (ISR). The entire ionogram dataset was scaled with both the Autoscala and ARTIST programs. The reliability of the hmF2 values obtained by ARTIST and Autoscala was assessed using the corresponding ISR values as a reference. Average errors Δ and the root mean square errors RMSE were computed for the whole dataset. Data analysis shows that both the Autoscala and ARTIST systems tend to underestimate hmF2 values with |Δ| in all cases less than 10 km. For high magnetic activity ARTIST offers better accuracy than Autoscala, as evidenced by RMSE[ARTIST] < RMSE[Autoscala], under both daytime and nighttime conditions, and considering all hours of the day. Conversely, under low and medium magnetic activity Autoscala tends to estimate hmF2 more accurately than the ARTIST system for both daytime and nighttime conditions, when RMSE[Autoscala] < RMSE[ARTIST]. However, RMSE[Autoscala] slightly exceeds RMSE[ARTIST] for the day as a whole. RMSE values are generally substantial (RMSE > 16 km in all cases), which places a limit on the results obtainable with real-time models that ingest ionosonde data.

1. Introduction

The ionosphere is a highly variable medium affecting HF radio propagation, which is used in long-distance communication and detection. Mean climatological conditions are useful to determine a “base level” for the design and operation of HF systems. hmF2 is one of the important variables determining these conditions, and its importance also lies in its predicted decrease as one of the main ionospheric effects of the increasing concentrations of greenhouse gases. Its value is traditionally estimated by means of simple empirical formulations using the M(3000)F2 factor scaled from ionosondes [1] or through more sophisticated expressions involving additional characteristics (see e.g., [2,3], and references therein). The importance of hmF2 has also stimulated studies of the effects of different modeling decisions in the International Reference Ionosphere model (IRI-2016) [4,5]. The various long-term models available today are based on ionosonde data with hmF2 obtained from the vertical electronic density profile Ne(h), which in turn is derived from the ionogram. This was first achieved applying a polynomial inversion method that required the intervention of an operator [6], subsequently being automated [7,8,9].
However, long-term models are unable to effectively forecast ionospheric variability because hmF2 varies not only due to thermospheric conditions but also in response to dynamic processes in the upper atmosphere. At mid-latitudes, field-aligned diffusion and recombination losses determine the hmF2 in the absence of active vertical drift. Vertical drifts displace hmF2 to a new equilibrium position in conjunction with the field-aligned redistribution of the plasma [10]. Therefore, real-time measurements are required as model inputs. The models are mostly empirical and among these the International Reference Ionosphere–Real Time Assimilative Mapping (IRI–RTAM) approach is particularly promising. It ingests data from the Global Ionospheric Radio Observatory (GIRO) [11] to adapt the IRI’s empirical background maps of ionospheric characteristics to match the observations [12]. A new Australian regional hmF2 forecast model was also recently developed using ionosonde measurements and the bidirectional Long Short-Term Memory (bi-LSTM) method. This model predicts an hmF2 value for the next hour based on data for the last five hours at the same location [13]. Even physical models, like SAMI2-CNU (the Chungnam National University (Daejeon, South Korea) in-house revised version of the open source 2-dimensional Another Model of the Ionosphere (SAMI2) developed at the Naval Research Laboratory (Washington, D.C.)), can be used as nowcast models for the regional mid-latitude ionosphere by assimilating ionosonde data in near-real time [14].
hmF2 is also used as an input parameter in a new method to retrieve neutral temperature Tn and composition [O], [N2], [O2] from Ne(h) in the daytime mid-latitude F2 region under both quiet and disturbed conditions. Possible factors that can influence the achieved accuracy have been investigated. Several tests have demonstrated that discrepancies in the hmF2 values provided by Digisondes [15,16] could have a significant impact on the performance of this method [17].
Serious concern about global warming of the troposphere has generated widespread interest in the study of long-term trends in the ionosphere since the early 1990s. Some research has linked ionospheric trends to anthropogenic sources, like the increase in greenhouse gas concentrations, while other studies identify natural causes, such as long-term changes in solar and geomagnetic activity, and secular variations in the Earth’s main magnetic field [18]. Long-term hmF2 trends have been specifically studied in several works, making use of the data available in international databases (e.g., [19]).
In this work we consider the accuracy achieved in hmF2 estimation by two automatic systems for ionogram interpretation: ARTIST [7,8,9], and Autoscala [20,21]. These data feed real-time ionospheric models and affect their performance. Furthermore, the same data populate international databases and constitute the measurements on which future retrospective studies will be based, at a historical moment when the huge resources necessary for manual data validation are often lacking.

2. Materials and Methods

The present assessment considered 4991 ionograms recorded in the period from April 1997 to December 2017 by the Digisonde [22] installed at Millstone Hill (42.6°N, 288.5°E), together with simultaneous Ne(h)[ISR] profiles recorded by the co-located Incoherent Scatter Radar (ISR). The ionograms included were those for which the critical frequency foF2 provided by Autoscala and ARTIST matched the ISR observations within 0.1 MHz (in line with International Union of Radio Science (URSI) standard [23]), in order to avoid influencing the analysis with cases of incorrect foF2 autoscaling. The average errors:
Δ [ ionosonde ] = i = 1 N h m F 2 [ ionosonde ] i h m F 2 [ ISR ] i N ,
and the root mean square errors:
RMSE [ ionosonde ] = i = 1 N ( h m F 2 [ ionosonde ] i h m F 2 [ ISR ] i ) 2 N ,
with the symbols being self-evident in meaning, were computed for the hmF2 data across the whole dataset, where both the Autoscala and ARTIST systems were used to scale hmF2[ionosonde]. An error in hmF2[ISR] determination can be assumed around ±10 km at Millstone Hill ISR [24].
The study considered nocturnal (between 22:00 and 02:00 local time (LT)) and diurnal (between 10:00 and 14:00 LT) conditions separately, and under high, medium, and quiet geomagnetic conditions. Magnetic activity is classed as disturbed if a magnetic index value ap > 40 was observed over the previous 24 h, moderately disturbed if 7 < ap ≤ 40 was observed over the previous 24 h, and quiet if ap ≤ 7 was constant over the previous 24 h.
The Student’s t-test for the paired (hmF2[ionosonde]; hmF2[ISR]) data sets was also performed, for both the Autoscala and ARTIST systems. The aim of the test is to verify whether the mean difference between two data sets is statistically significant [25]. This information is given by the significance level, i.e., maximum probability p[ionosonde] that Δ[ionosonde] is not significant. In other words, a significance level of p[ionosonde] means that there is a lower probability than p[ionosonde] that the null hypothesis E[hmF2[ionosonde]hmF2[ISR]] = 0 is true. The null hypothesis is rejected when p ≤ 0.05. In this case it is assumed that E[hmF2[ionosonde]hmF2[ISR]] ≠ 0 and Δ[ionosonde] is statistically significant.

3. Results

The results obtained are shown in Table 1, along with the Student’s t-test results. Column 2 (3) reports the average error Δ[Autoscala][ARTIST]), while column 4 (5) reports the root mean square error RMSE[Autoscala] (RMSE[ARTIST]). In column 6 the number of measurements considered is shown, while column 7 (8) reports the significance level given by the Student’s t-test. Cases of statistical significance of Δ[Autoscala][ARTIST]) are highlighted with bold in column 2 (3).
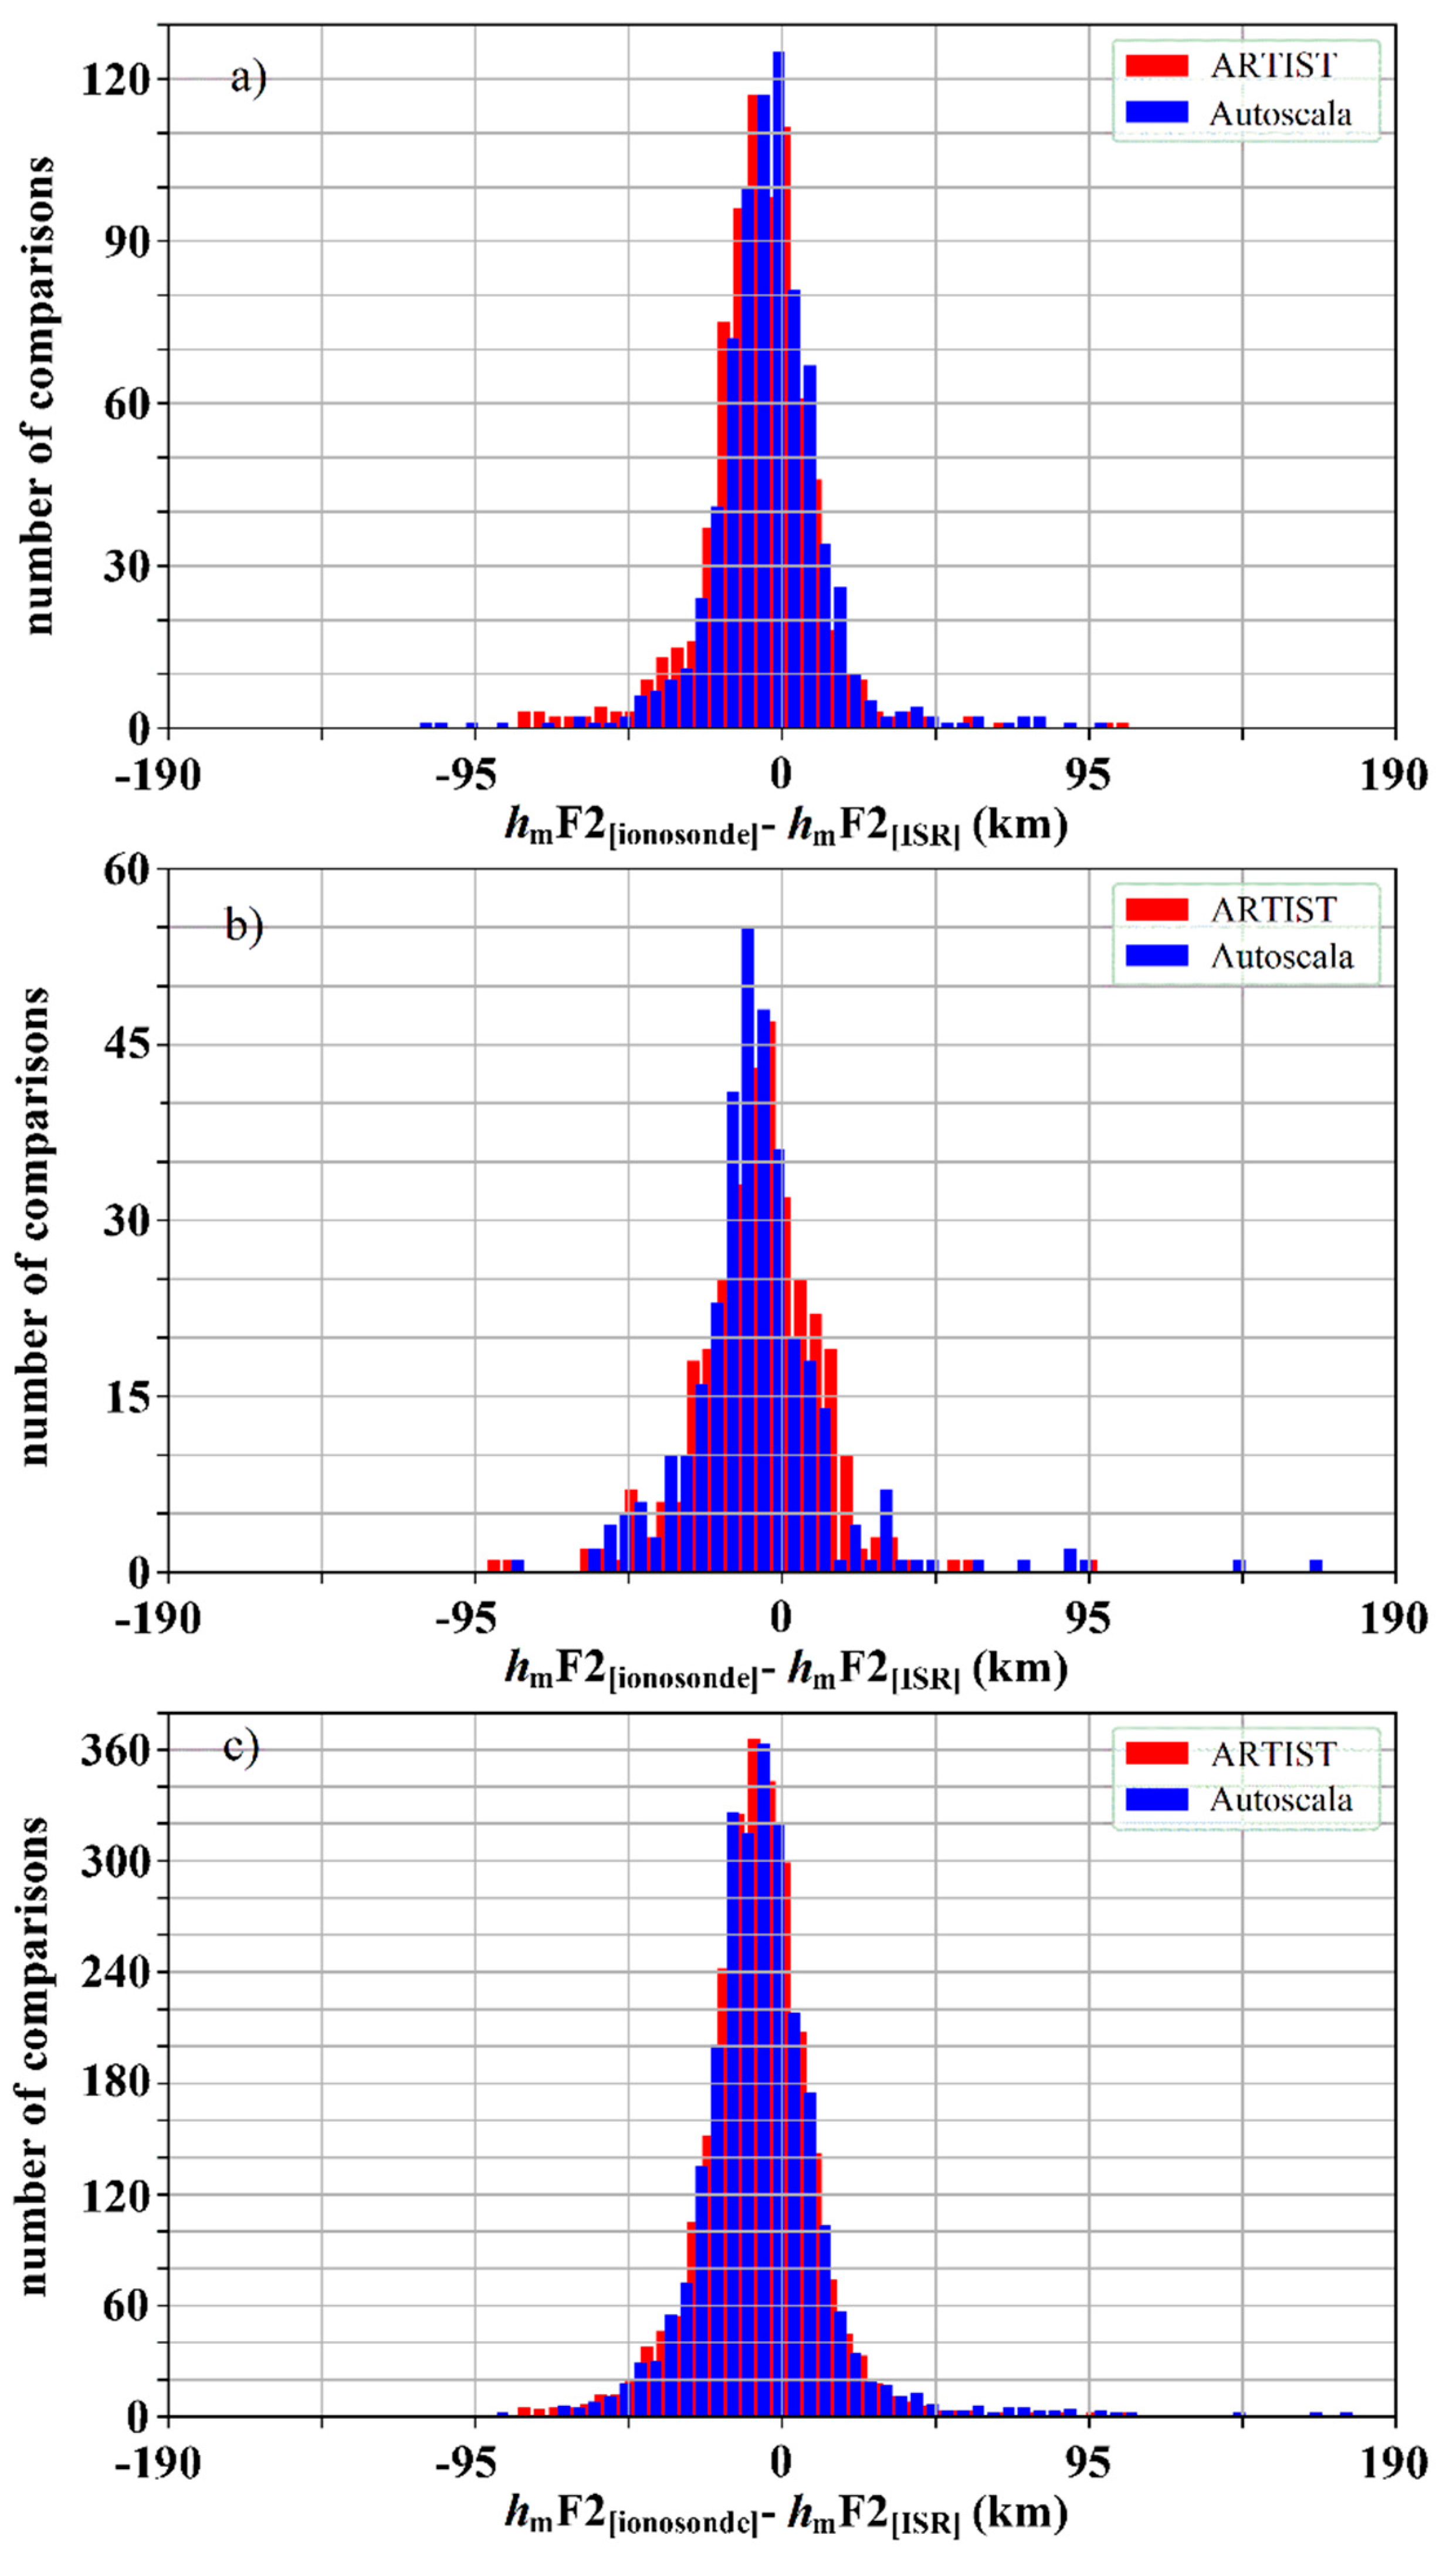
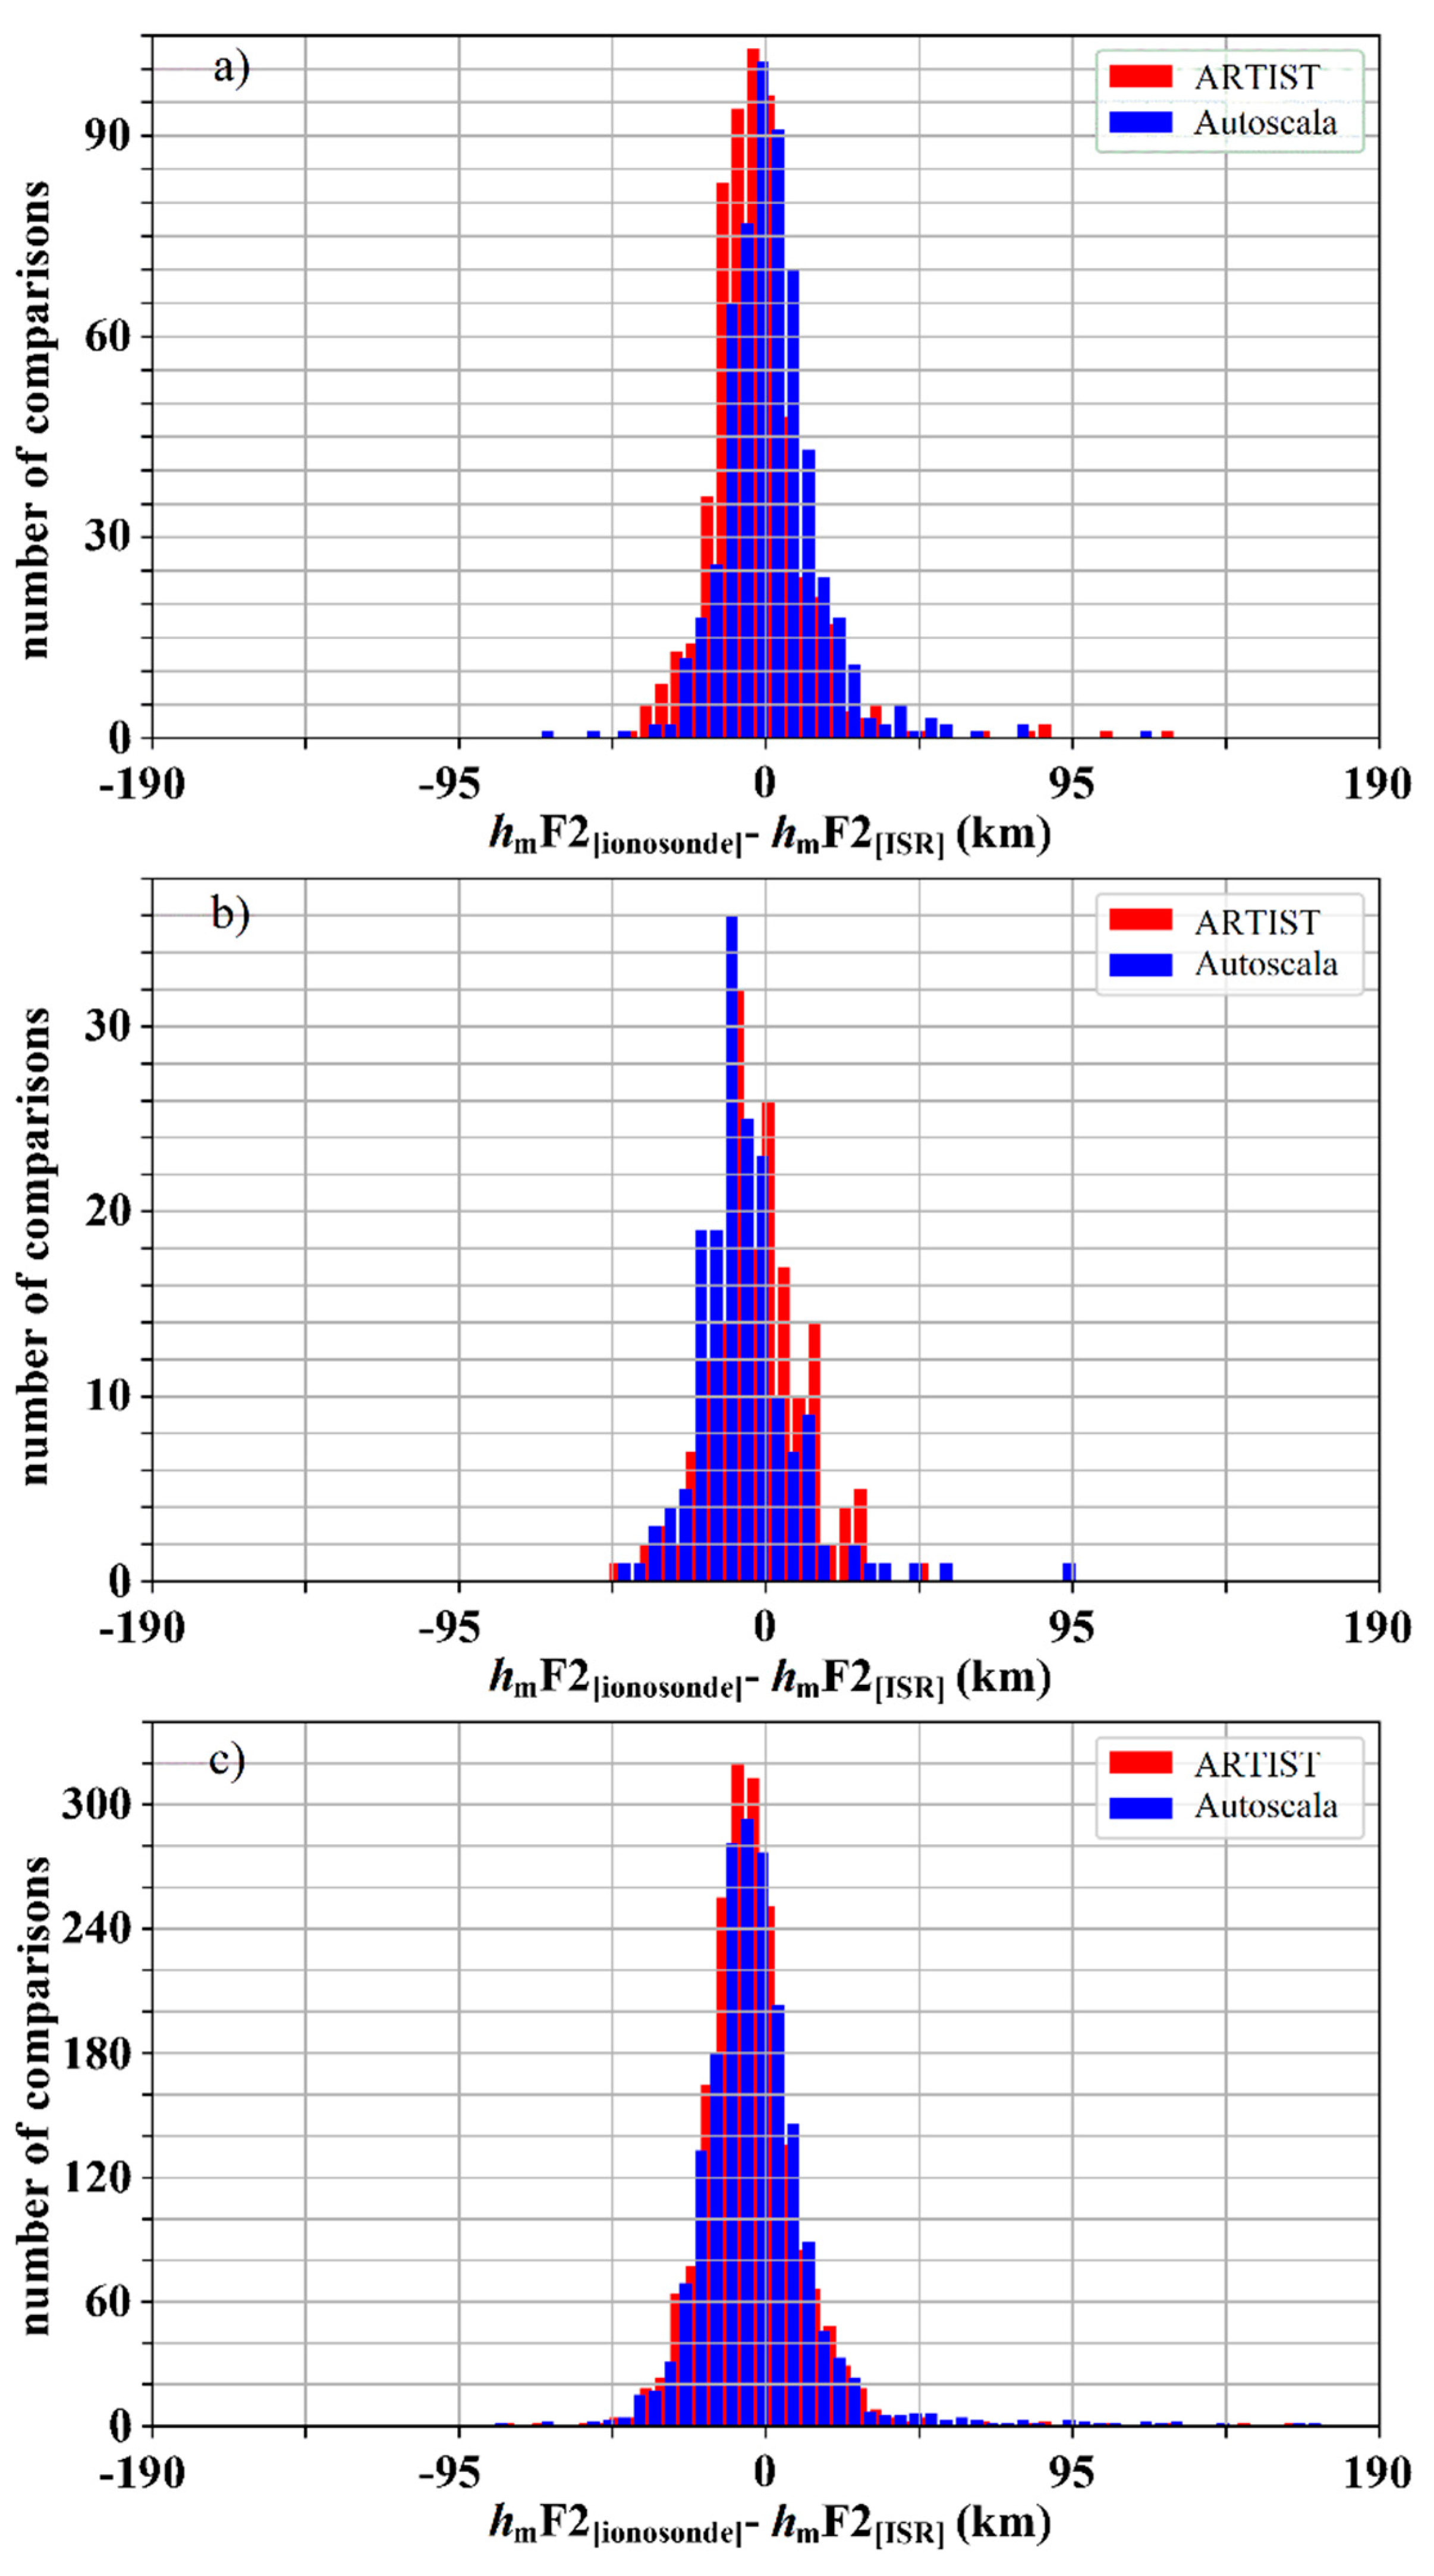
The results are also presented in the form of histograms in Figure 1, Figure 2 and Figure 3, where the occurrence of different values of the differences hmF2[ionosonde]hmF2[ISR] are shown for different hours of the day and different magnetic activity levels.

4. Discussion and Conclusions

The data reported in Table 1 show that both the Autoscala and ARTIST systems tend to underestimate hmF2 values compared to ISR measurements, with a mean deviation in all cases of less than 10 km. This is a little better than the result obtained for the ARTIST system by Chen et al. [26], who estimated average peak height differences between −4 km (in winter) and −17 km (in summer), in a comparison of some 2000 profiles recorded at Millstone Hill in 1990. In the present study, mean overestimation was instead observed for ARTIST (Δ[ARTIST] = +5.27 km) during nighttime under high magnetic activity, and for Autoscala (Δ[Autoscala] = +3.09 km) during daytime under low magnetic activity.
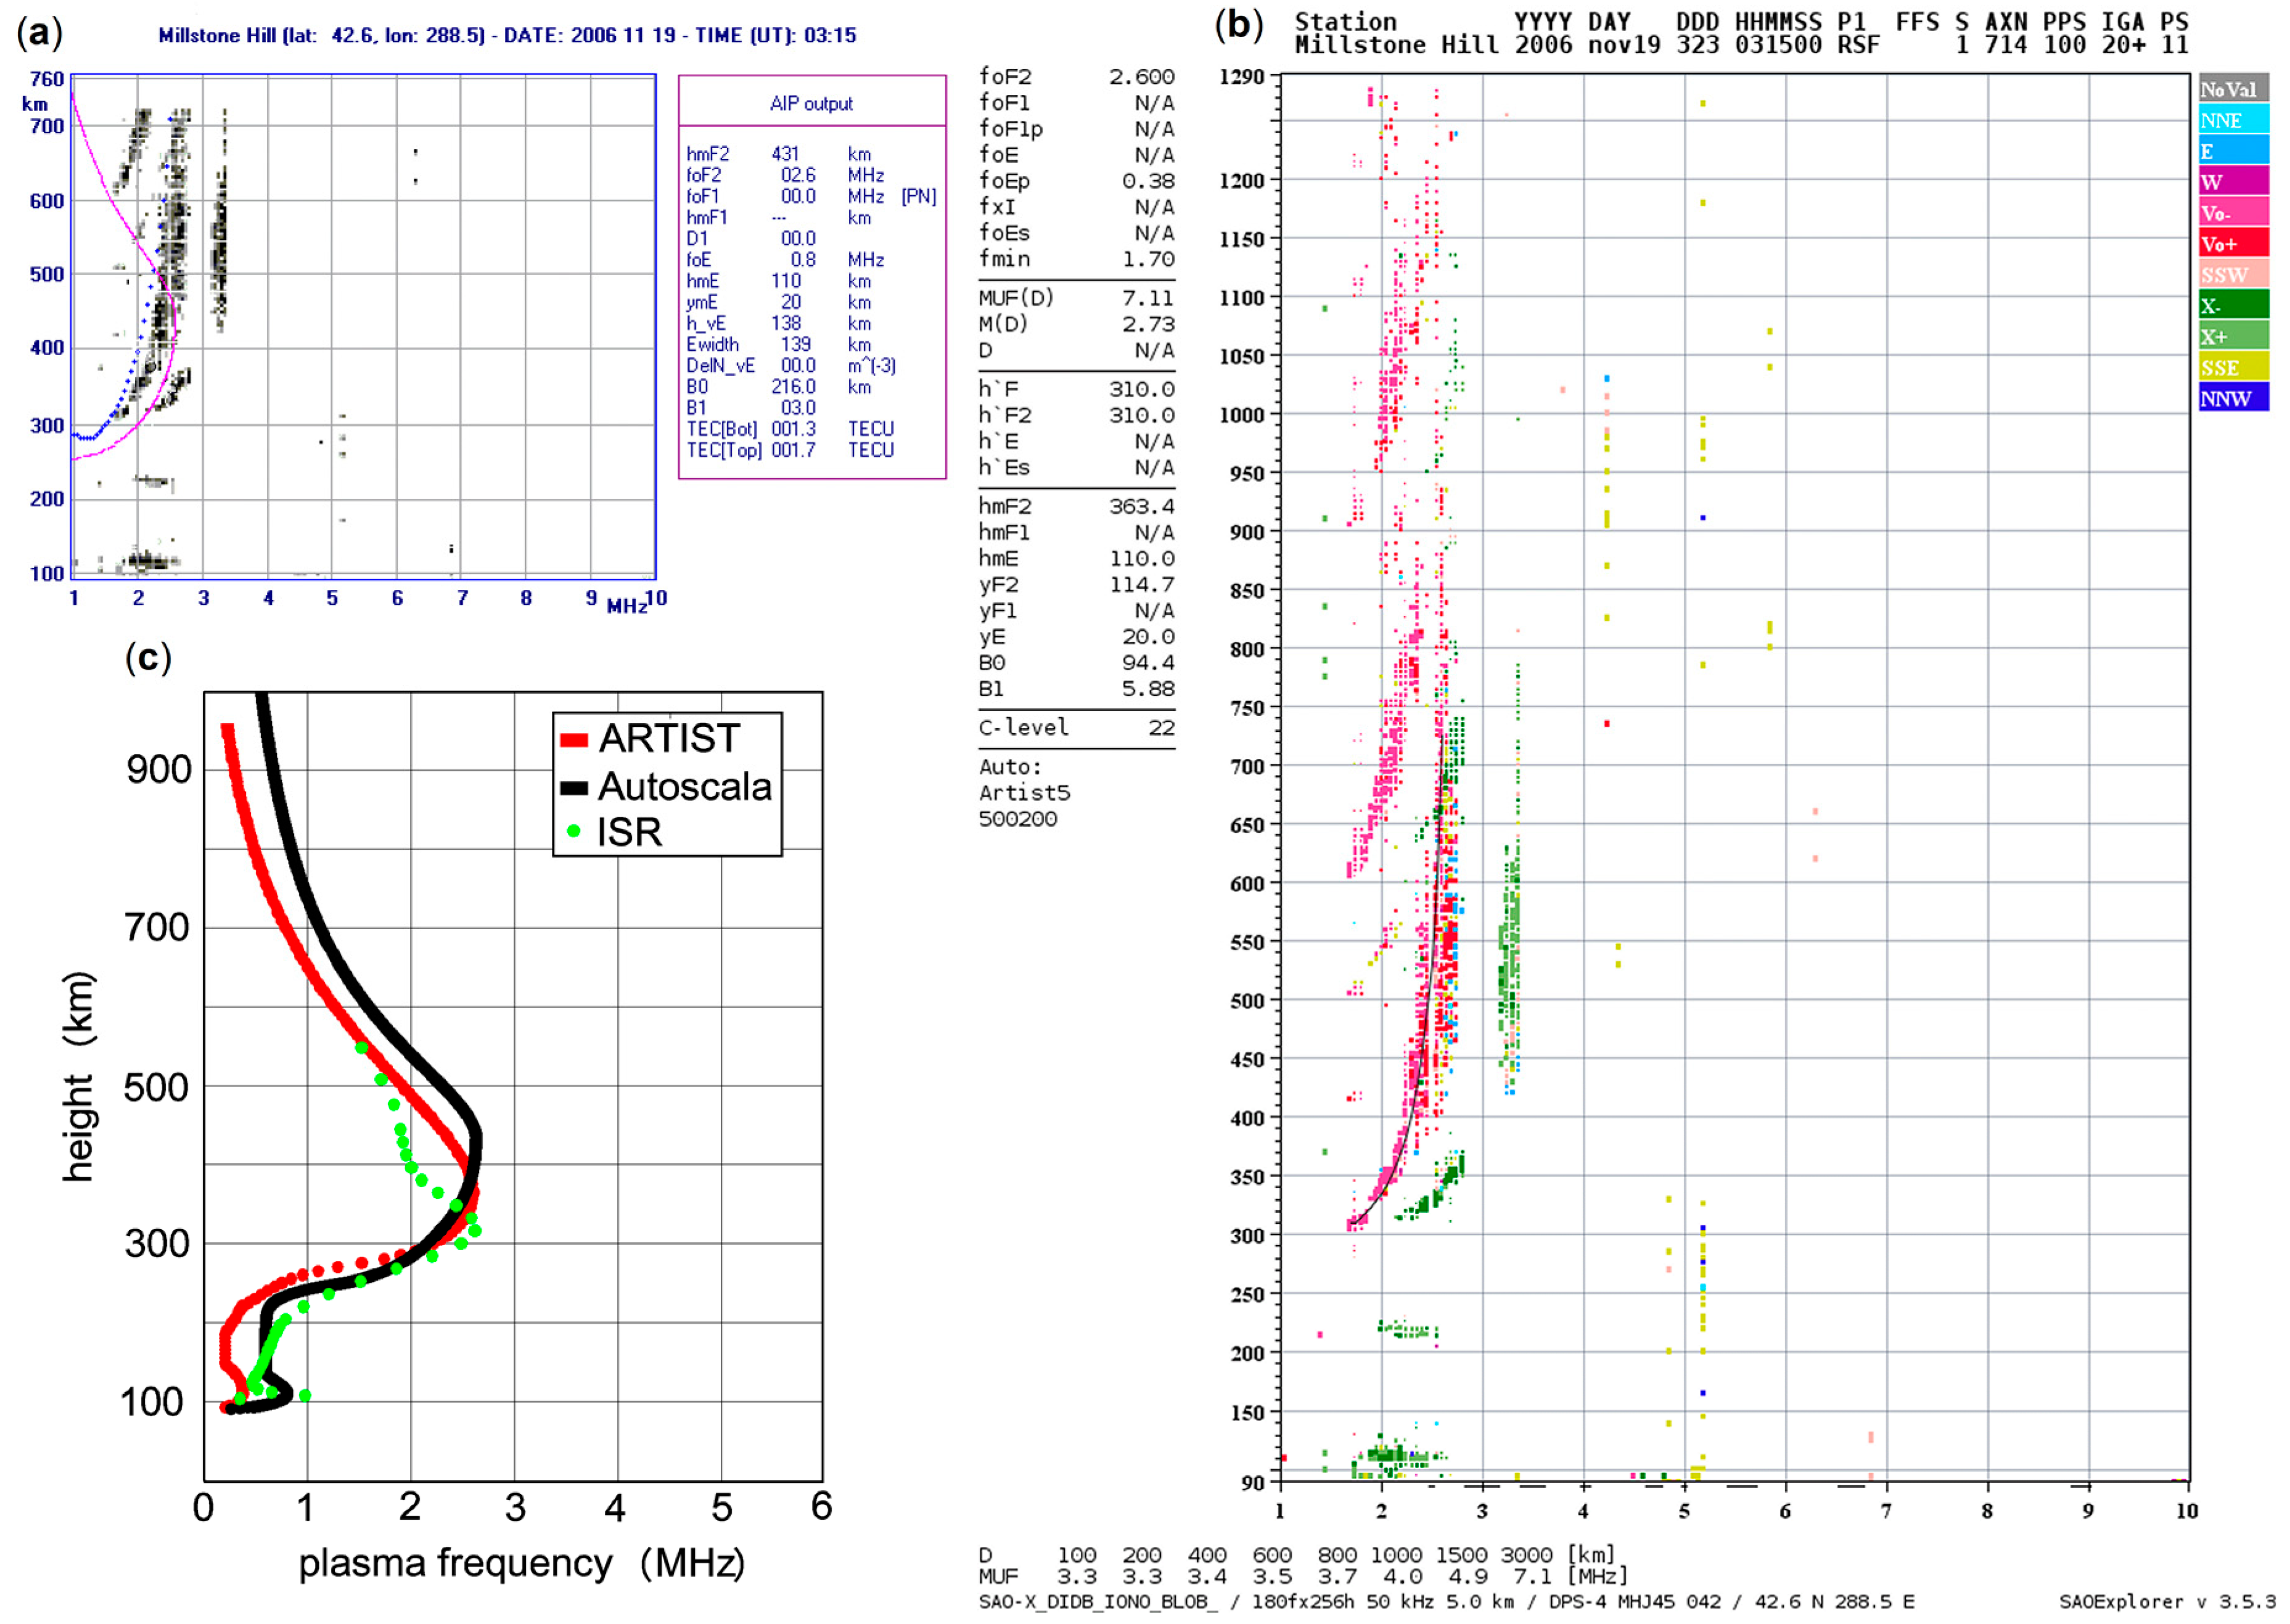
Under high magnetic activity ARTIST shows better accuracy than Autoscala, as demonstrated by RMSE[ARTIST] < RMSE[Autoscala], in both nighttime and daytime conditions, and considering all hours of the day. Besides, the behavior of Autoscala during nighttime is particularly critical, due to high magnetic activity. Despite the very low mean underestimations of hmF2[Autoscala] compared to hmF2[ISR][Autoscala] = −1.57 km), clearly in these circumstances RMSE[Autoscala] (equal to 34.06 km) is much higher than at other times. Under these conditions, there are also 7.37% of cases in which hmF2[Autoscala]hmF2[ISR] > 40 km, while for ARTIST (RMSE[ARTIST] = 19.52 km) the percentage is only 2.11%. Examples of such cases are shown in Figure 4a,b and Figure 5a,b, while Figure 4c and Figure 5c report the corresponding comparisons between the Ne(h) values provided by Autoscala, ARTIST, and from ISR data. These critical cases included some in which the trace was difficult to locate because of Spread-F conditions (see e.g., [27,28]) and Autoscala fails to correctly detect the trace (see Figure 4a,b). Conversely, in other critical cases the trace appears to have been correctly detected by both programs (see Figure 5a,b), and the greater accuracy achieved by ARTIST is probably linked to its more efficient estimation of the F-region semi-thickness parameter B0 (see e.g., [29]), which describes the profile in the F2 region. However, among the 7 cases in which hmF2[Autoscala]hmF2[ISR] > 40 km, there are 2 in which hmF2[ARTIST] also overestimates hmF2[ISR] by over 40 km.
Under low and medium magnetic activity Autoscala tends to estimate hmF2 more accurately than the ARTIST system for individual hours during both daytime and nighttime conditions, when RMSE[Autoscala] < RMSE[ARTIST]. However, RMSE[Autoscala] slightly exceeds RMSE[ARTIST] for the day as a whole when all cases are considered. This means that close to the solar terminators, the accuracy of Autoscala’s hmF2 tends to decline more than ARTIST’s. In spite of this, |Δ[Autoscala]| < |Δ[ARTIST]| in almost all cases, suggesting that Autoscala hmF2 values tend to be closer to the real ones, even under high magnetic activity conditions.
In conclusion, the present work demonstrates a low systematic error in the determination of hmF2 by ionosondes, with Δ < 10 km in all cases. The RMSE values, however, differ according to the various situations considered, but are generally higher, with RMSE > 16 km in all cases. This represents a limitation to the results obtainable from real-time models that ingest ionosonde data.

Author Contributions

Conceptualization, C.S.; methodology, C.S.; software, C.S.; validation, C.S. formal analysis, C.S. and D.S.; investigation, C.S.; resources, C.S.; data curation, C.S. and D.S.; writing—original draft preparation, C.S. and D.S.; writing—review and editing, C.S. and D.S.; visualization, C.S. and D.S.; supervision, C.S.; project administration, C.S. All authors have read and agreed to the published version of the manuscript.

Funding

This research received no external funding.

Acknowledgments

Radar observations and analysis at Millstone Hill and Madrigal distributed database services are supported by the US National Science Foundation Cooperative Agreement AGS-1242204 with the Massachusetts Institute of Technology. Millstone Hill ionograms have been downloaded from the DIDB, Center for Atmospheric Research, University of Massachusetts, Lowell. The authors thank also the National Environmental Satellite Data and Information Service/National Centers for Environmental Information (NESDIS/NCEI) of the National Oceanic and Atmospheric Administration (NOAA) to provide geomagnetic data (https://www.ngdc.noaa.gov/stp/geomag/kp_ap.html).

Conflicts of Interest

The authors declare no conflict of interest.

References

  1. Shimazaki, T. Worldwide daily variability in the height of the maximum electron density of the ionospheric F2-layer. J. Radio Res. Lab. Jpn. 1955, 2, 85–97. [Google Scholar]
  2. McNamara, L.F. Accuracy of models of hmF2 used for long-term trend analyses. Radio Sci. 2008, 43, RS2002. [Google Scholar] [CrossRef]
  3. Elias, A.G.; Zossi, B.S.; Yiğit, E.; Saavedra, Z.; de Haro Barbas, B.F. Earth’s magnetic field effect on MUF calculation and consequences for hmF2 trend estimates. JASTP 2017, 163, 114–119. [Google Scholar] [CrossRef]
  4. Arikan, F.; Sezen, U.; Gulyaeva, T.L. Comparison of IRI-2016 F2 Layer Model Parameters with Ionosonde Measurements. J. Geophys. Res. Space Phys. 2019, 124, 8092–8109. [Google Scholar] [CrossRef]
  5. Fagre, M.; Zossi, B.S.; Chum, J.; Yigit, E.; Elias, A.G. Ionospheric high frequency wave propagation using different IRI hmF2 and foF2 models. J. Atmos. Sol.-Terr. Phy. 2019, 196, 105141. [Google Scholar] [CrossRef]
  6. Titheridge, J.E. Ionogram Analysis with the Generalised Program POLAN. UAG Report-93. 1985. Available online: http://www.ips.gov.au/IPSHosted/INAG/uag_93/uag_93.html (accessed on 1 May 2020).
  7. Reinisch, B.W.; Huang, X. Automatic calculation of electron density profiles from digital ionograms: 1. Automatic O and X trace identification for topside ionograms. Radio Sci. 1982, 17, 421–434. [Google Scholar] [CrossRef]
  8. Huang, X.; Reinisch, B.W. Automatic calculation of electron density profiles from digital ionograms: 2. True height inversion of topside ionograms with the profile-fitting method. Radio Sci. 1982, 17, 837–844. [Google Scholar] [CrossRef]
  9. Reinisch, B.W.; Huang, X. Automatic Calculation of electron density profiles from digital ionograms: 3. Processing of bottomside ionograms. Radio Sci. 1983, 18, 477–492. [Google Scholar] [CrossRef]
  10. Maruyama, T.; Ma, G.Y.; Tsugawa, T.; Supnithi, P.; Komolmis, T. Ionospheric peak height at the magnetic equator: Comparison between ionosonde measurements and IRI. Adv. Space Res. 2017, 60, 375–380. [Google Scholar] [CrossRef]
  11. Reinisch, B.W.; Galkin, I.A. Global Ionospheric Radio Observatory (GIRO). Earth Planets Space 2011, 63, 377–381. [Google Scholar] [CrossRef] [Green Version]
  12. Galkin, I.A.; Reinisch, B.W.; Huang, X.; Bilitza, D. Assimilation of GIRO data into a real-time IRI. Radio Sci. 2012, 47, RS0L07. [Google Scholar] [CrossRef]
  13. Hu, A.D.; Zhang, K.F. Using Bidirectional Long Short-Term Memory Method for the Height of F2 Peak Forecasting from Ionosonde Measurements in the Australian Region. Remote Sens. 2018, 10, 1658. [Google Scholar] [CrossRef] [Green Version]
  14. Kim, J.H.; Kim, Y.H.; Ssessanga, N.; Jeong, S.H.; Moon, S.I.; Kwak, Y.S.; Yun, J.Y. Regional ionosphere specification by assimilating ionosonde data into the SAMI2 model. Adv. Space Res. 2019, 64, 1343–1357. [Google Scholar] [CrossRef]
  15. Bibl, K.; Reinisch, B.W. The universal digital ionosonde. Radio Sci. 1978, 13, 519–530. [Google Scholar] [CrossRef]
  16. Reinisch, B.W.; Bibl, K.; Kitrosser, D.F.; Sales, G.S.; Tang, J.S.; Zhang, Z.M.; Bullett, T.W.; Ralls, J.A. The Digisonde 256 ionospheric sounder. In World Ionosphere/Thermosphere Study, WITS Handbook; Liu, C.H., Ed.; ICSU Science Committee on Solar-Terr. Phys.: Urbana, IL, USA, 1898; Volume 2, pp. 1–33. [Google Scholar]
  17. Mikhailov, A.V.; Belehaki, A.; Perrone, L.; Zolesi, B.; Tsagouri, I. Retrieval of thermospheric parameters from routine ionospheric observations: Assessment of method’s performance at mid-latitudes daytime hours. J. Space Weather Space Clim. 2012, 2, A03. [Google Scholar] [CrossRef] [Green Version]
  18. Elias, A.G. Filtering ionosphere parameters to detect trends linked to anthropogenic effect. Earth Planets Space 2014, 66, 113. [Google Scholar] [CrossRef] [Green Version]
  19. Bremer, J.; Damboldt, T.; Mielich, J.; Suessmann, P. Comparing long-term trends in the ionospheric F2-region with two different methods. J. Atmos. Sol.-Terr. Phy. 2012, 77, 174–185. [Google Scholar] [CrossRef]
  20. Scotto, C.; Pezzopane, M. A software for automatic scaling of foF2 and MUF (3000) F2 from ionograms. In Proceedings of the URSI XXVIIth General Assembly, Maastricht, Holland, 17–24 August 2002. [Google Scholar]
  21. Scotto, C. Electron density profile calculation technique for Autoscala ionogram analysis. Adv. Space Res. 2009, 44, 756–766. [Google Scholar] [CrossRef]
  22. Reinisch, B.W.; Haines, D.M.; Kuklinski, W.S. The new portable digisonde for vertical and oblique sounding. In Proceedings of the AGARD EPP 50th Symposium, London, England, 1–5 June 1992; Volume 11, pp. 1–11. [Google Scholar]
  23. Piggott, W.R.; Rawer, K. U.R.S.I. Handbook of Ionogram Interpretation and Reduction; US Department of Commerce National, Oceanic and Atmospheric Administration-Environmental Data Service: Asheville, NC, USA, 1972. [Google Scholar]
  24. Perrone, L.; Mikhailov, A.V.; Scotto, C.; Sabbagh, D. Testing of the Method Retrieving Consistent Set of Aeronomic Parameters With Millstone Hill ISR Noontime hmF2 Observations. IEEE Geosci. Remote Sens. Lett. 2020. [Google Scholar] [CrossRef]
  25. Mishra, P.; Singh, U.; Pandey, C.M.; Mishra, P.; Pandey, G. Application of student’s t-test, analysis of variance, and covariance. Ann. Card. Anaesth. 2019, 22, 407–411. [Google Scholar] [CrossRef]
  26. Chen, C.F.; Reinisch, B.W.; Scali, J.L.; Huang, X. The accuracy of ionogram-derived N (h) profiles. Adv. Space Res. 1994, 14, 43–46. [Google Scholar] [CrossRef]
  27. Penndorf, R. Classification of spread F ionograms. J. Atmos. Terr. Phys. 1962, 24, 771–778. [Google Scholar] [CrossRef]
  28. Shi, J.K.; Wang, G.J.; Reinisch, B.W.; Shang, S.P.; Wang, X.; Zherebotsov, G.; Potekhin, A. Relationship between strong range spread F and ionospheric scintillations observed in Hainan from 2003 to 2007. J. Geophys. Res. 2011, 116, A08306. [Google Scholar] [CrossRef]
  29. Reinisch, B.W.; Huang, X. Redefining the IRI F1 layer profile. Adv. Space Res. 2000, 25, 81–88. [Google Scholar] [CrossRef]
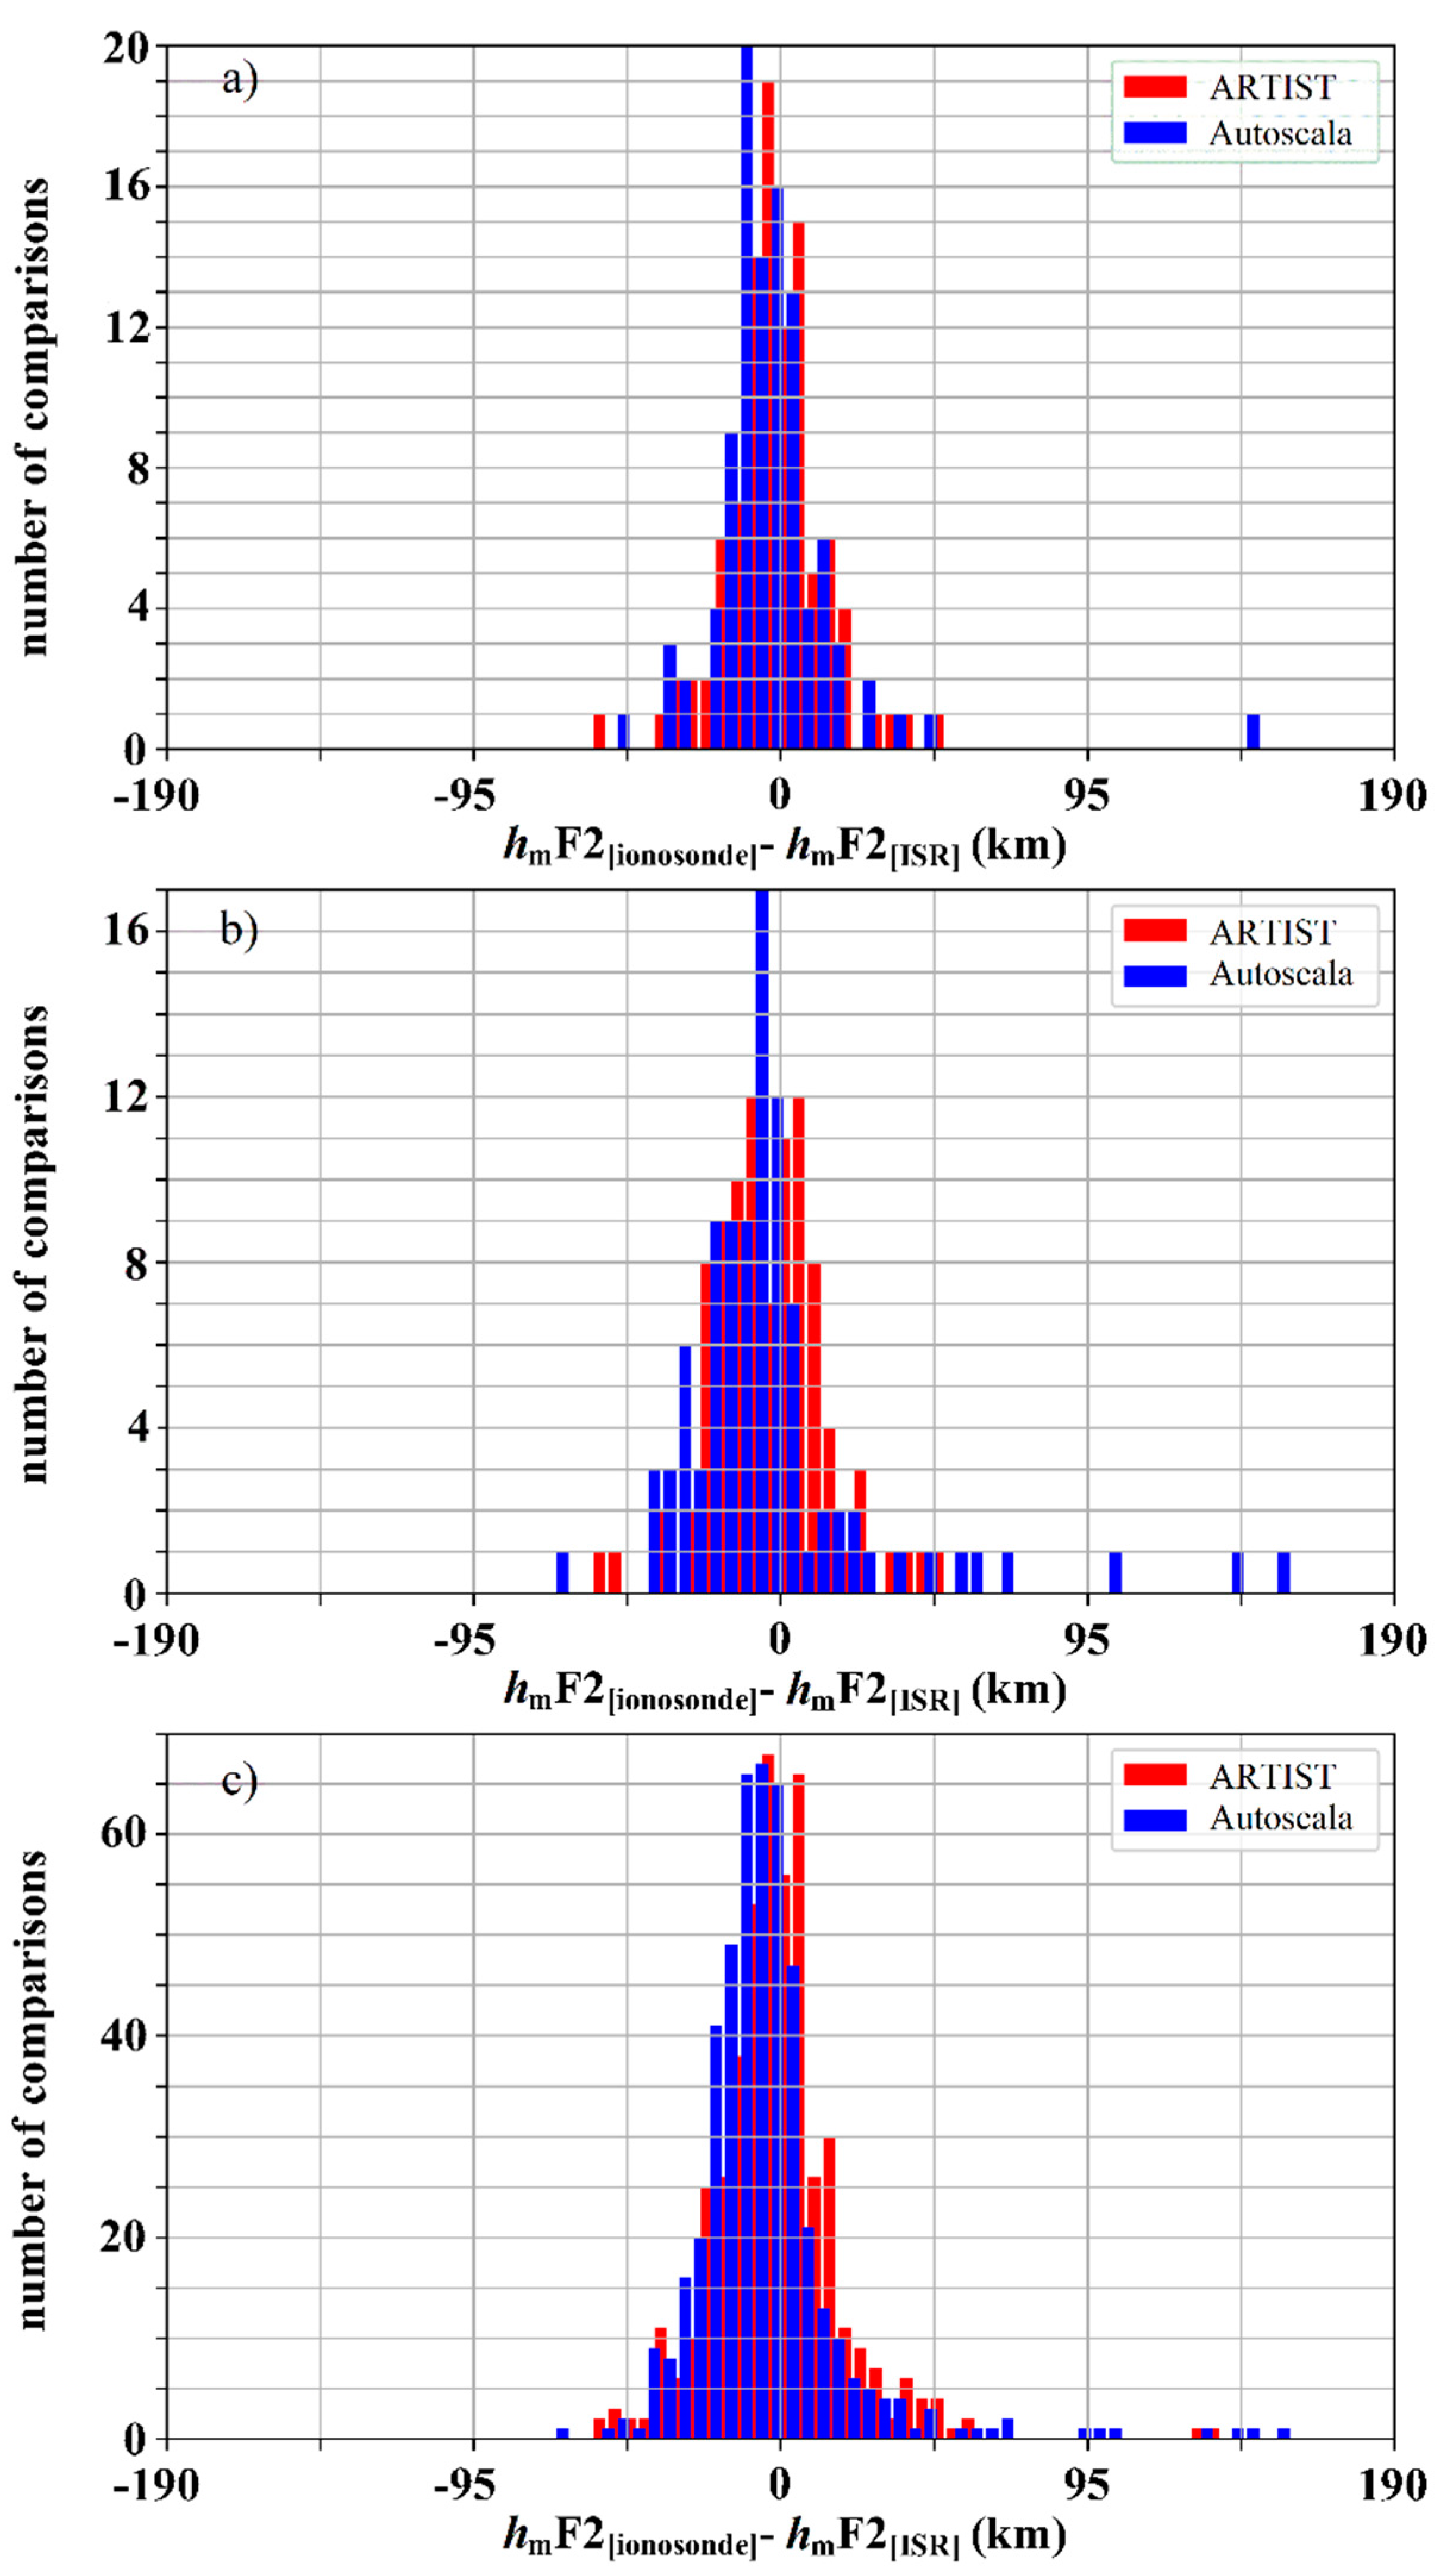
Figure 1. Histograms of the differences hmF2[Autoscala]hmF2[ISR] (in blue) and hmF2[ARTIST]hmF2[ISR] (in red) under high magnetic activity, during daytime (between 10:00 and 14:00 LT) (a), nighttime (between 22:00 and 02:00 LT) (b), and for the day as a whole (c). Each histogram class includes differences over a 5 km-wide interval. Conditions are classed as strongly disturbed if a magnetic index value ap > 40 was observed over the previous 24 h.
Remotesensing 12 02671 g001
Figure 2. Histograms of the differences hmF2[Autoscala]hmF2[ISR] (in blue) and hmF2[ARTIST]hmF2[ISR] (in red) under moderately disturbed conditions, at daytime hours (between 10:00 and 14:00 LT) (a), at nighttime (between 22:00 and 02:00 LT) (b), and for the day as a whole (c). Each histogram class includes differences over a 5 km-wide interval. Conditions are classed as moderately disturbed if a magnetic index value 7 < ap ≤ 40 was observed over the previous 24 h.
Remotesensing 12 02671 g002
Figure 3. Histograms of the differences hmF2[Autoscala]hmF2[ISR] (in blue) and hmF2[ARTIST]hmF2[ISR] (in red) under moderately disturbed conditions, during daytime (between 10:00 and 14:00 LT) (a), nighttime (between 22:00 and 02:00 LT) (b), and for the day as a whole (c). Each histogram class includes differences over a 5 km-wide interval. Conditions are classed as magnetically quiet if ap ≤ 7 was observed constantly over the previous 24 h.
Remotesensing 12 02671 g003
Figure 4. Nighttime ionogram recorded at Millstone Hill (42.6°N, 288.5°E) at 3:45 UT (22:45 LT) on March 30 2017, under high magnetic activity. (a) reports the standard output of the Autoscala program, with Ne(h)[Autoscala] shown in magenta and the restored trace in blue. (b) shows the standard output of the ARTIST program. (c) illustrates Ne(h)[Autoscala] (in black), Ne(h)[ARTIST] (in red), and Ne(h)[ISR] data (in green). In this case, hmF2[Autoscala] = 498 km (a), and hmF2[ARTIST] = 314 km (b), while hmF2[ISR] = 335 km. Hence, the ARTIST system overestimated the hmF2 height by 21 km, while Autoscala overestimated it by 163 km.
Remotesensing 12 02671 g004
Figure 5. Nighttime ionogram recorded at Millstone Hill (42.6°N, 288.5°E) at 3:15 UT (22:15 LT) on November 19 2006, under high magnetic activity. (a) reports the standard output of the Autoscala program, with Ne(h)[Autoscala] shown in magenta and the restored trace in blue. (b) shows the standard output of the ARTIST program. (c) illustrates Ne(h)[Autoscala] (in black), Ne(h)[ARTIST] (in red), and Ne(h)[ISR] data (in green). In this case, hmF2[Autoscala] = 431 km (a), and hmF2[ARTIST] = 363.4 km (b), while hmF2[ISR] = 320 km. Hence, the ARTIST system overestimated the hmF2 height by 43.4 km, while Autoscala overestimated it by 111 km.
Remotesensing 12 02671 g005
Table 1. The average errors (Δ[Autoscala], Δ[ARTIST]), the number of measurements considered, the Student t-test results, which provides an indication of the statistical significance p of the observed differences, and the root mean square errors (RMSE[Autoscala], RMSE[ARTIST]), at nighttime (22:00–02:00 LT), daytime (10:00–14:00 LT), and for the day as a whole. Significant cases are highlighted with bold. The analysis was repeated for magnetically strongly disturbed (upper table), moderately disturbed (middle table), and quiet (bottom table) conditions. Conditions were classed as strongly disturbed if a magnetic index value ap > 40 was observed over the previous 24 h, moderately disturbed if 7 < ap ≤ 40 was observed over the previous 24 h, and quiet if ap ≤ 7 was observed over the previous 24 h.
High Magnetic Activity
Δ[Autoscala]
(km)
Δ[ARTIST]
(km)
RMSE[Autoscala]
(km)
RMSE[ARTIST]
(km)
N° of casesp[Autoscala]p[ARTIST]
Night−1.575.2734.0919.53950.656220.00782
Day−1.32−3.0221.6516.411000.544670.06524
Night and day−3.26−2.5824.7920.914720.004180.00730
Medium Magnetic Activity
Δ[Autoscala]
(km)
Δ[ARTIST]
(km)
RMSE[Autoscala]
(km)
RMSE[ARTIST]
(km)
N° of casesp[Autoscala]p[ARTIST]
Night−6.45−7.2825.9026.373353.9·10−62.8·10−7
Day−3.00−8.719.7120.797682.3·10−56.0·10−34
Night and day−4.95−8.8124.9321.9926111.3·10−243.1·10−101
Low Magnetic Activity
Δ[Autoscala]
(km)
Δ[ARTIST]
(km)
RMSE[Autoscala]
(km)
RMSE[ARTIST]
(km)
N° of casesp[Autoscala]p[ARTIST]
Night−5.36−2.0217.7724.841715.8·10−50.28876
Day3.09−4.1616.6317.055836.2·10−62.2·10−9
Night and day−1.85−5.8120.0718.3219085.5·10−58.0·10−46