Small Lava Caves as Possible Exploratory Targets on Mars: Analogies Drawn from UAV Imaging of an Icelandic Lava Field

 , ,
, ,  , , and
Abstract
:
1. Introduction
- To perform UAV-based high-resolution imaging survey for the part of a lava flow showing all the main morphologies and abundance of small caves;
- To design a sequential methodology for identifying and characterizing the small cave openings on the UAV images with respect to the lava flow morphology;
- To perform a high-resolution comparison of the Icelandic lava flow with some examples from Mars.
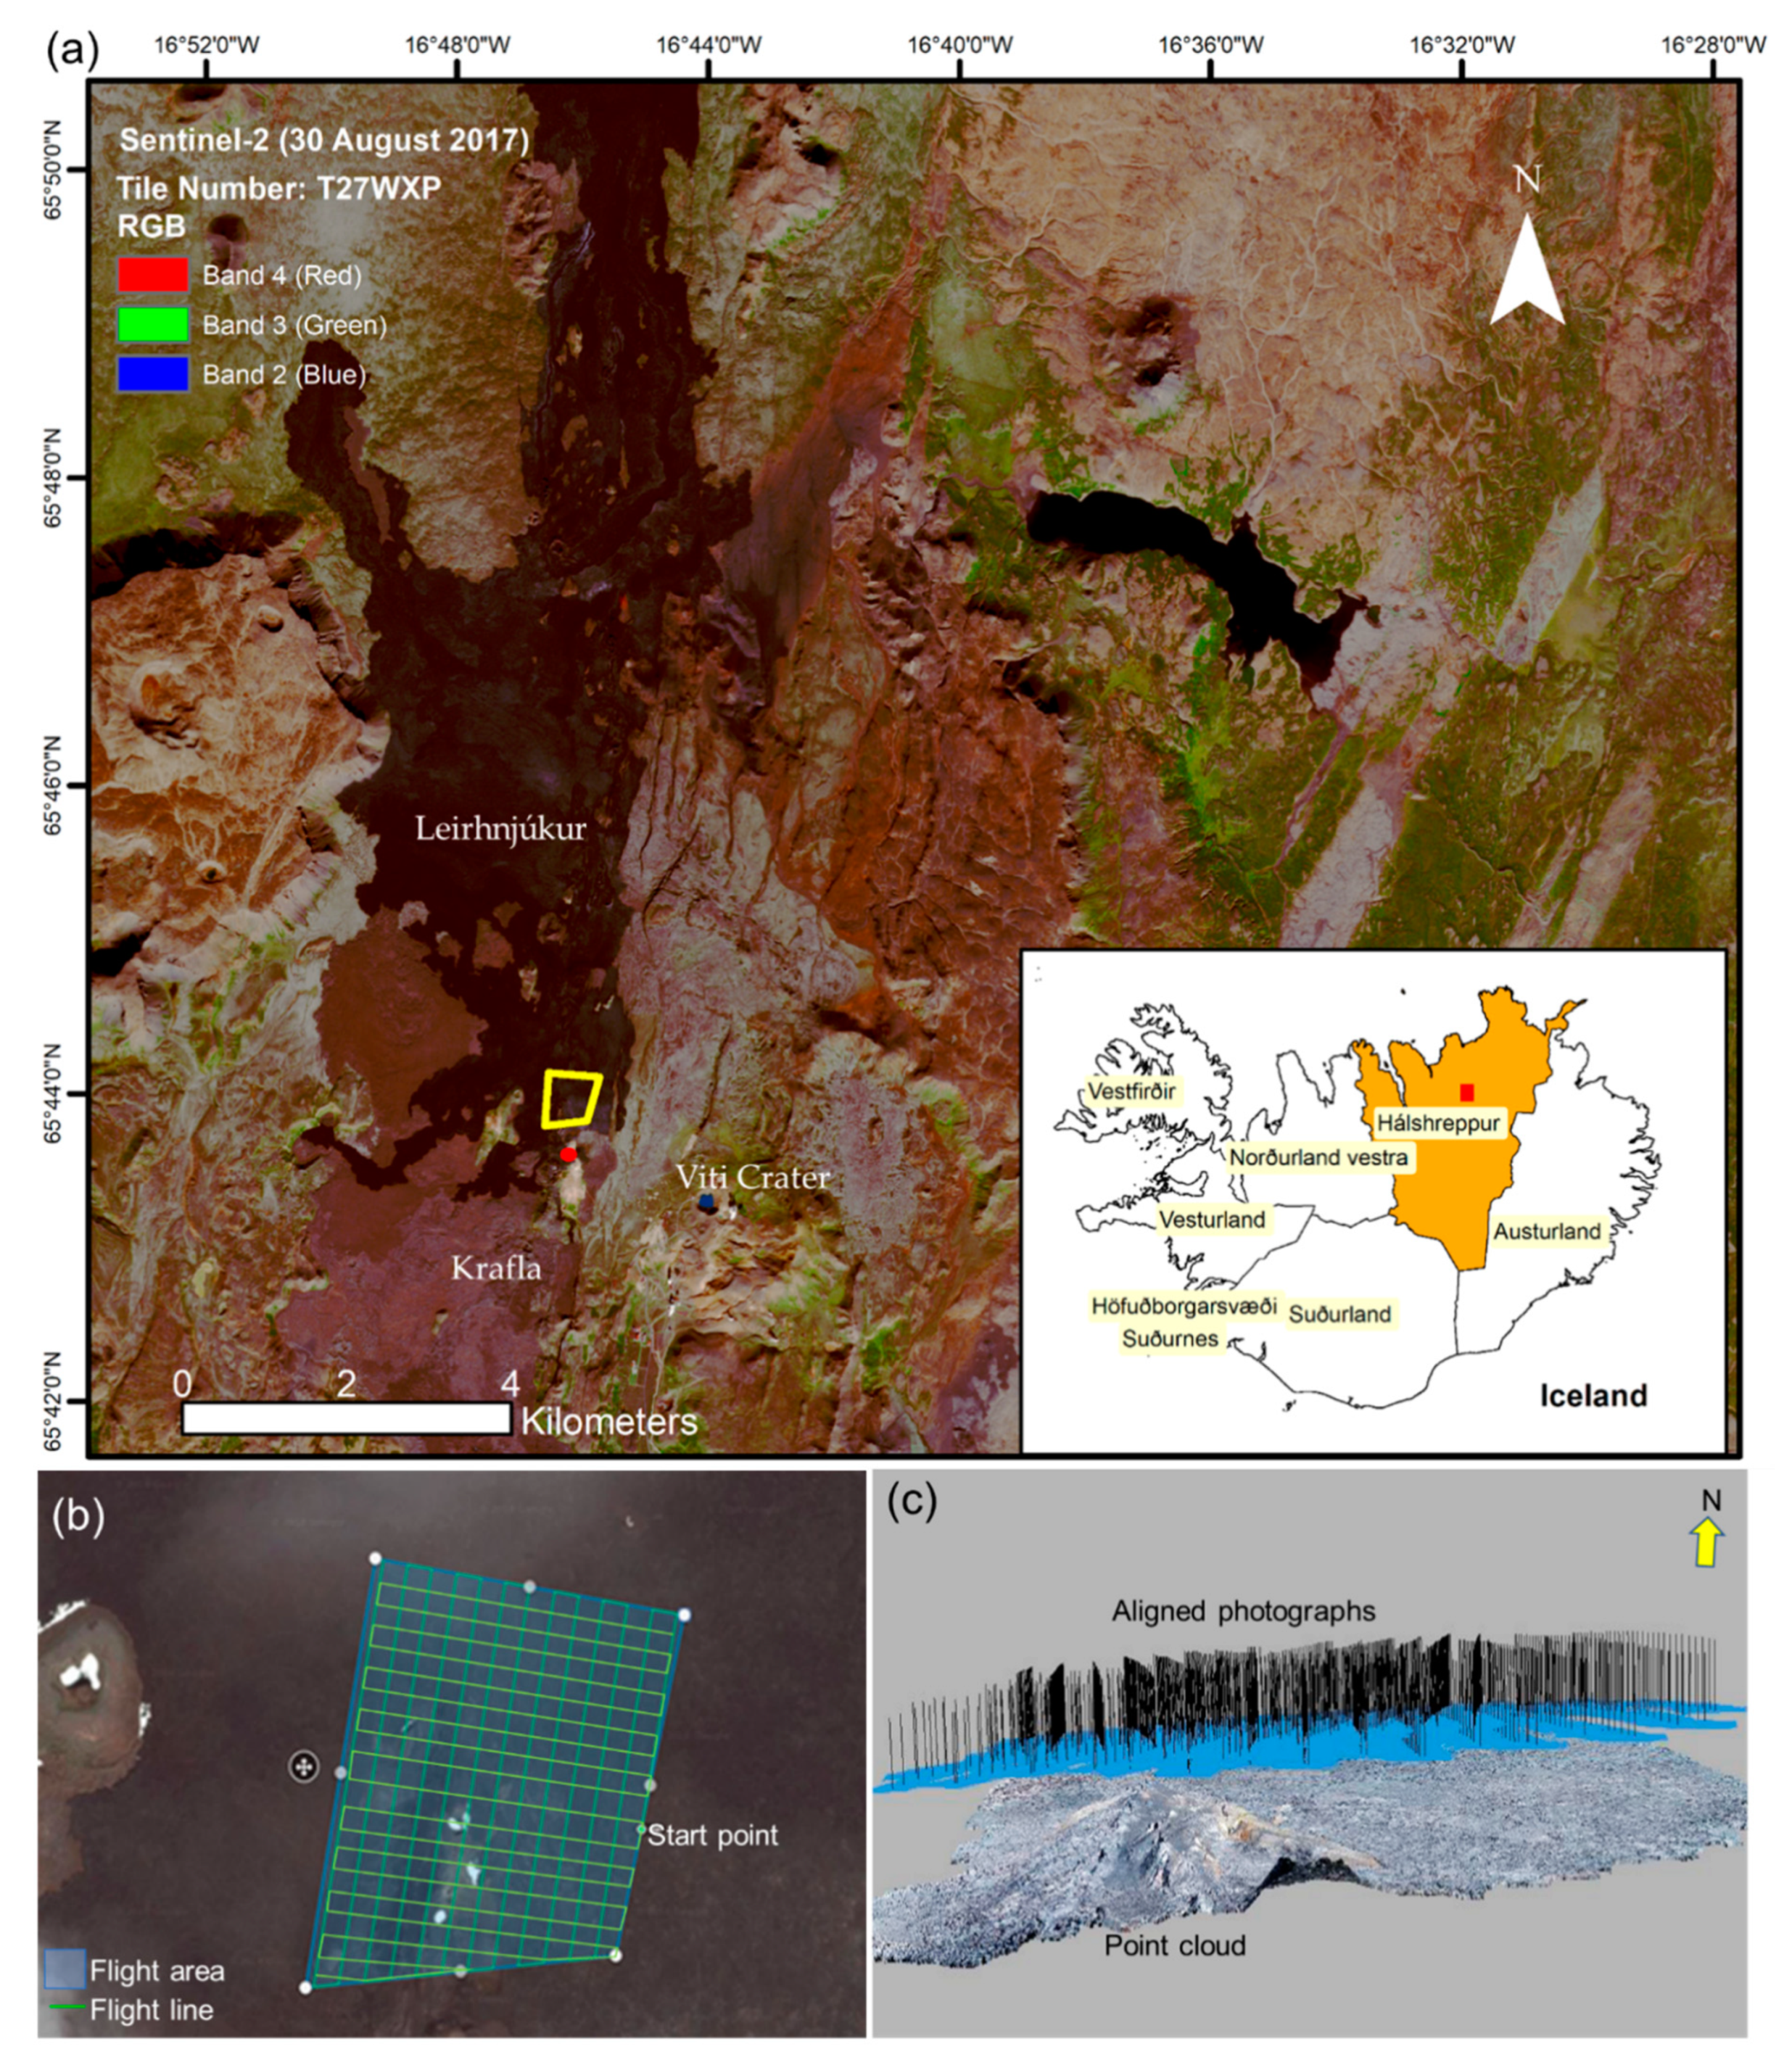
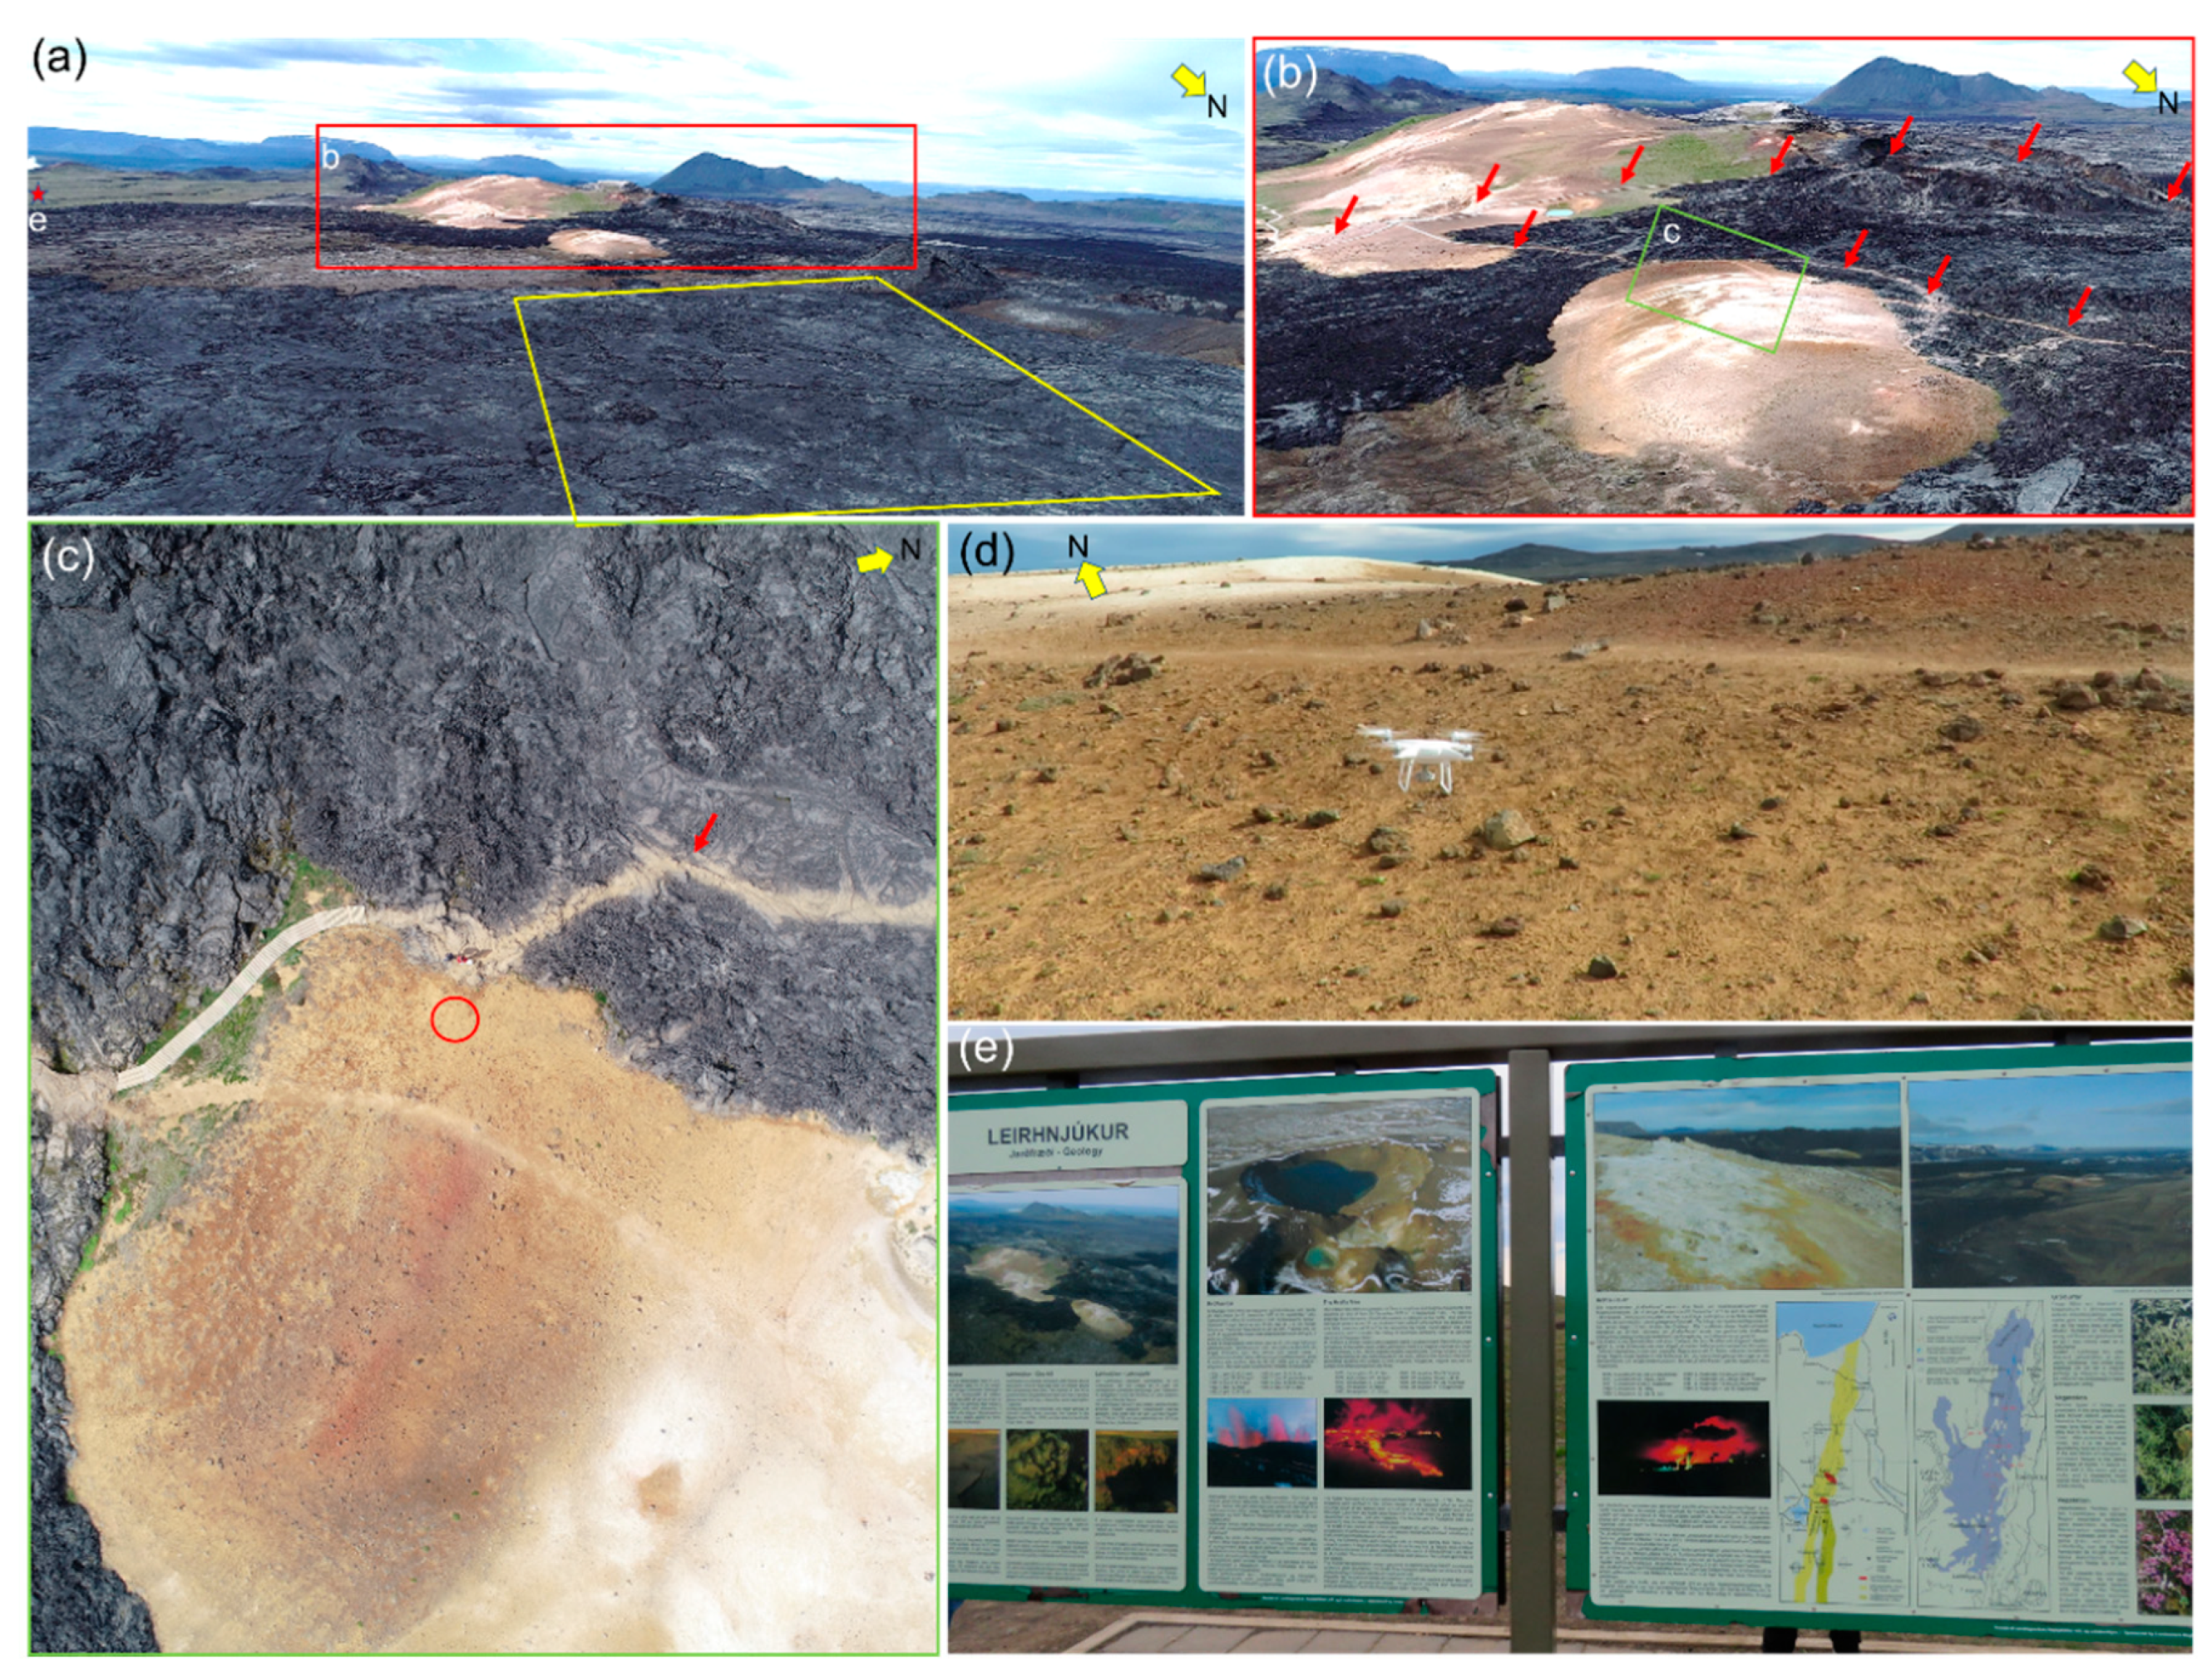
2. Study Area
3. Materials and Methods
3.1. UAV Imaging System
3.2. Flight Planning to Mitigate Systematic Error in Absence of Ground Control Points (GCPs)
3.3. Generation of DTM and Orthomosaic
- Photograph alignment (bundle adjustment): Agisoft PhotoScan aligns the photos from a UAV survey using the camera location coordinates and algorithms, automatically detects stable common features among the overlapping images, and determines the location and alignment of each camera position with respect to others [48,49]. This process of bundle adjustment generates a 3D sparse point cloud using the stereo-imaging, projection, and intersection of pixel rays from the different positions [49]. Using a very high computing hardware system (Intel Xeon E5-2650 v4, 12 cores, 24 threads central processing unit, 256 GB random-access memory, and Nvidia Geforce Titan XP 12 GB GDDR5X graphics card), we employed highest processing parameters within Agisoft PhotoScan workflow to derive the best possible results. For photograph alignment, we opted for the “Highest” accuracy and the highest possible numbers of tie points and key points in the processing tool window. The results of the alignment process are shown in Figure 1c.
- Geometry building and dense point cloud generation: A densification technique is applied within the software on the already generated sparse point cloud through the bundle adjustment to derive a 3D dense point cloud using multi-view stereopsis (MVS) or depth mapping techniques [54]. The model geometry is corrected by the intrinsic process of matching features to complete the final phase of geometry building to generate an accurate high-resolution 3D dense point cloud [49]. For this step, we opted for the “Ultra high” processing parameter and “Aggressive” depth filtering to derive the best possible results.
- Texture building and DTM generation: In this step, the generated 3D dense point cloud provides a continuous surface that can be triangulated and rendered with the original imagery to build a textured 3D mesh and create the final DTM [49] and, subsequently, the orthomosaics. For the DTM generation, the dense point cloud was selected as the source data, with enabled interpolation and a pixel resolution of 2 cm/pixel, and WGS 1984 UTM Zone 28N was assigned as the coordinate system for the final outputs. For orthomosaic generation, the DTM were selected as surface data, with enabled hole filling and 2 cm/pixel output resolution.
3.4. Morphometry
3.5. Cave Identification
4. Results and Discussion
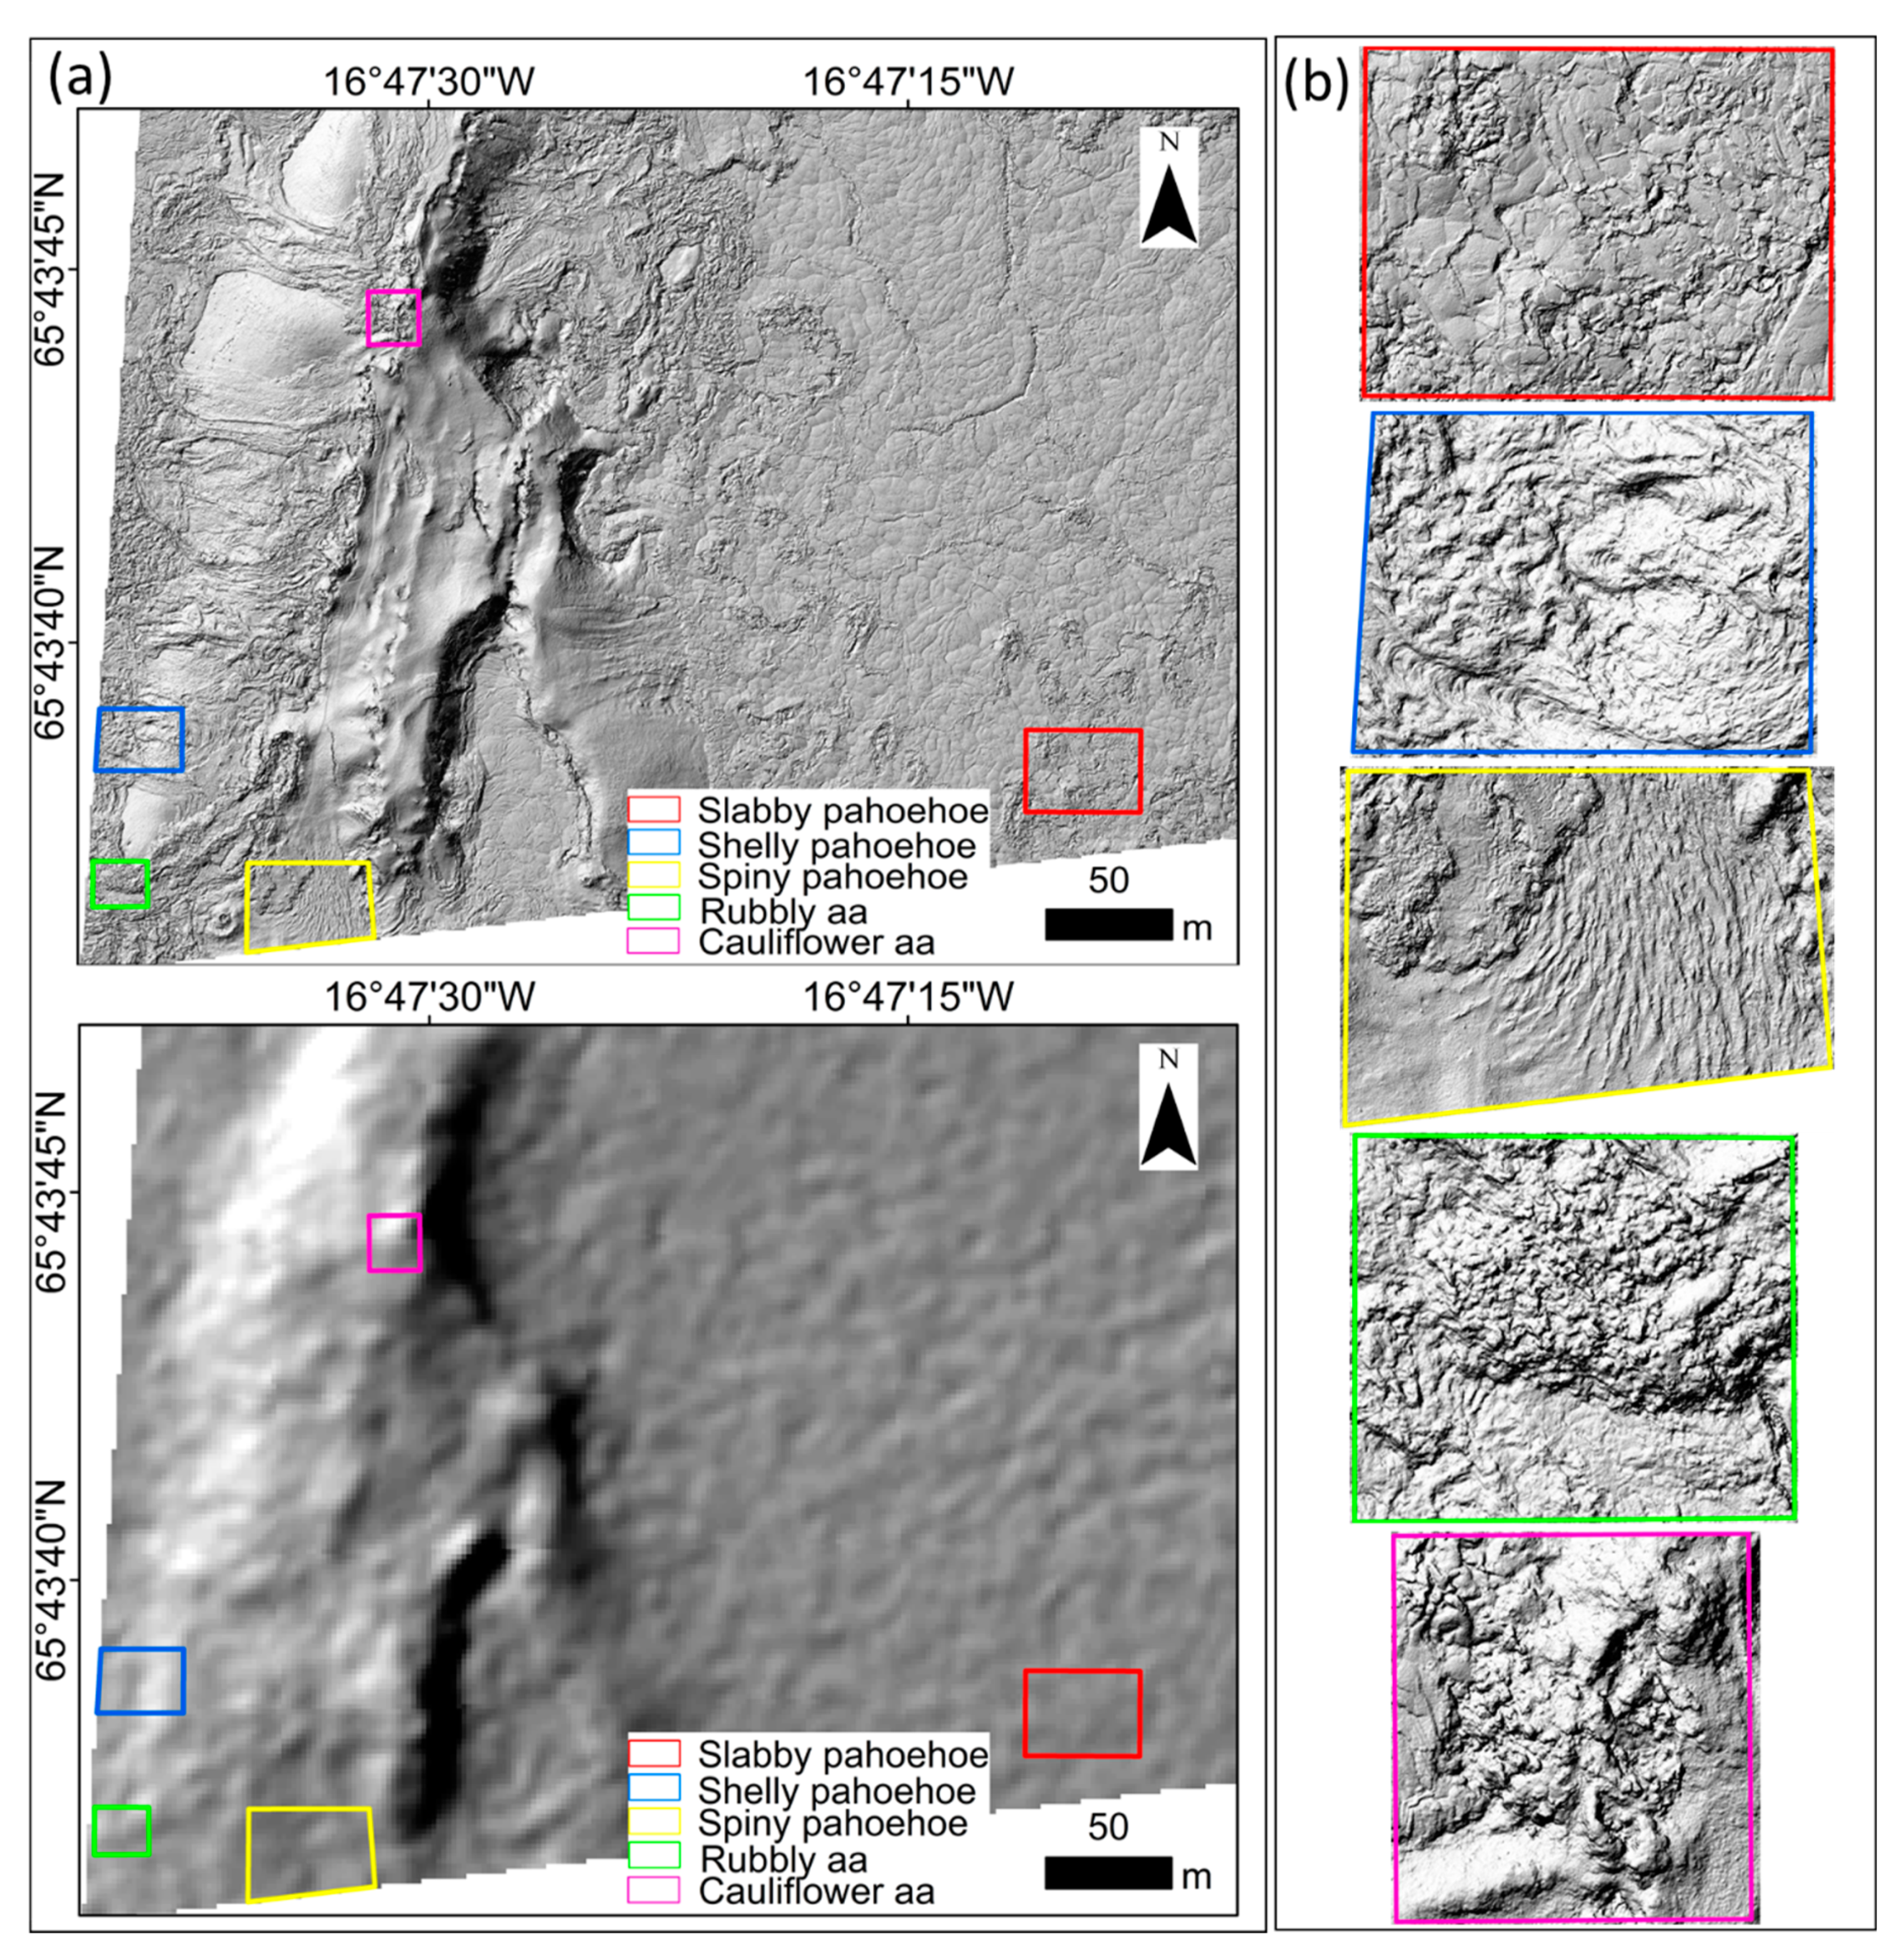
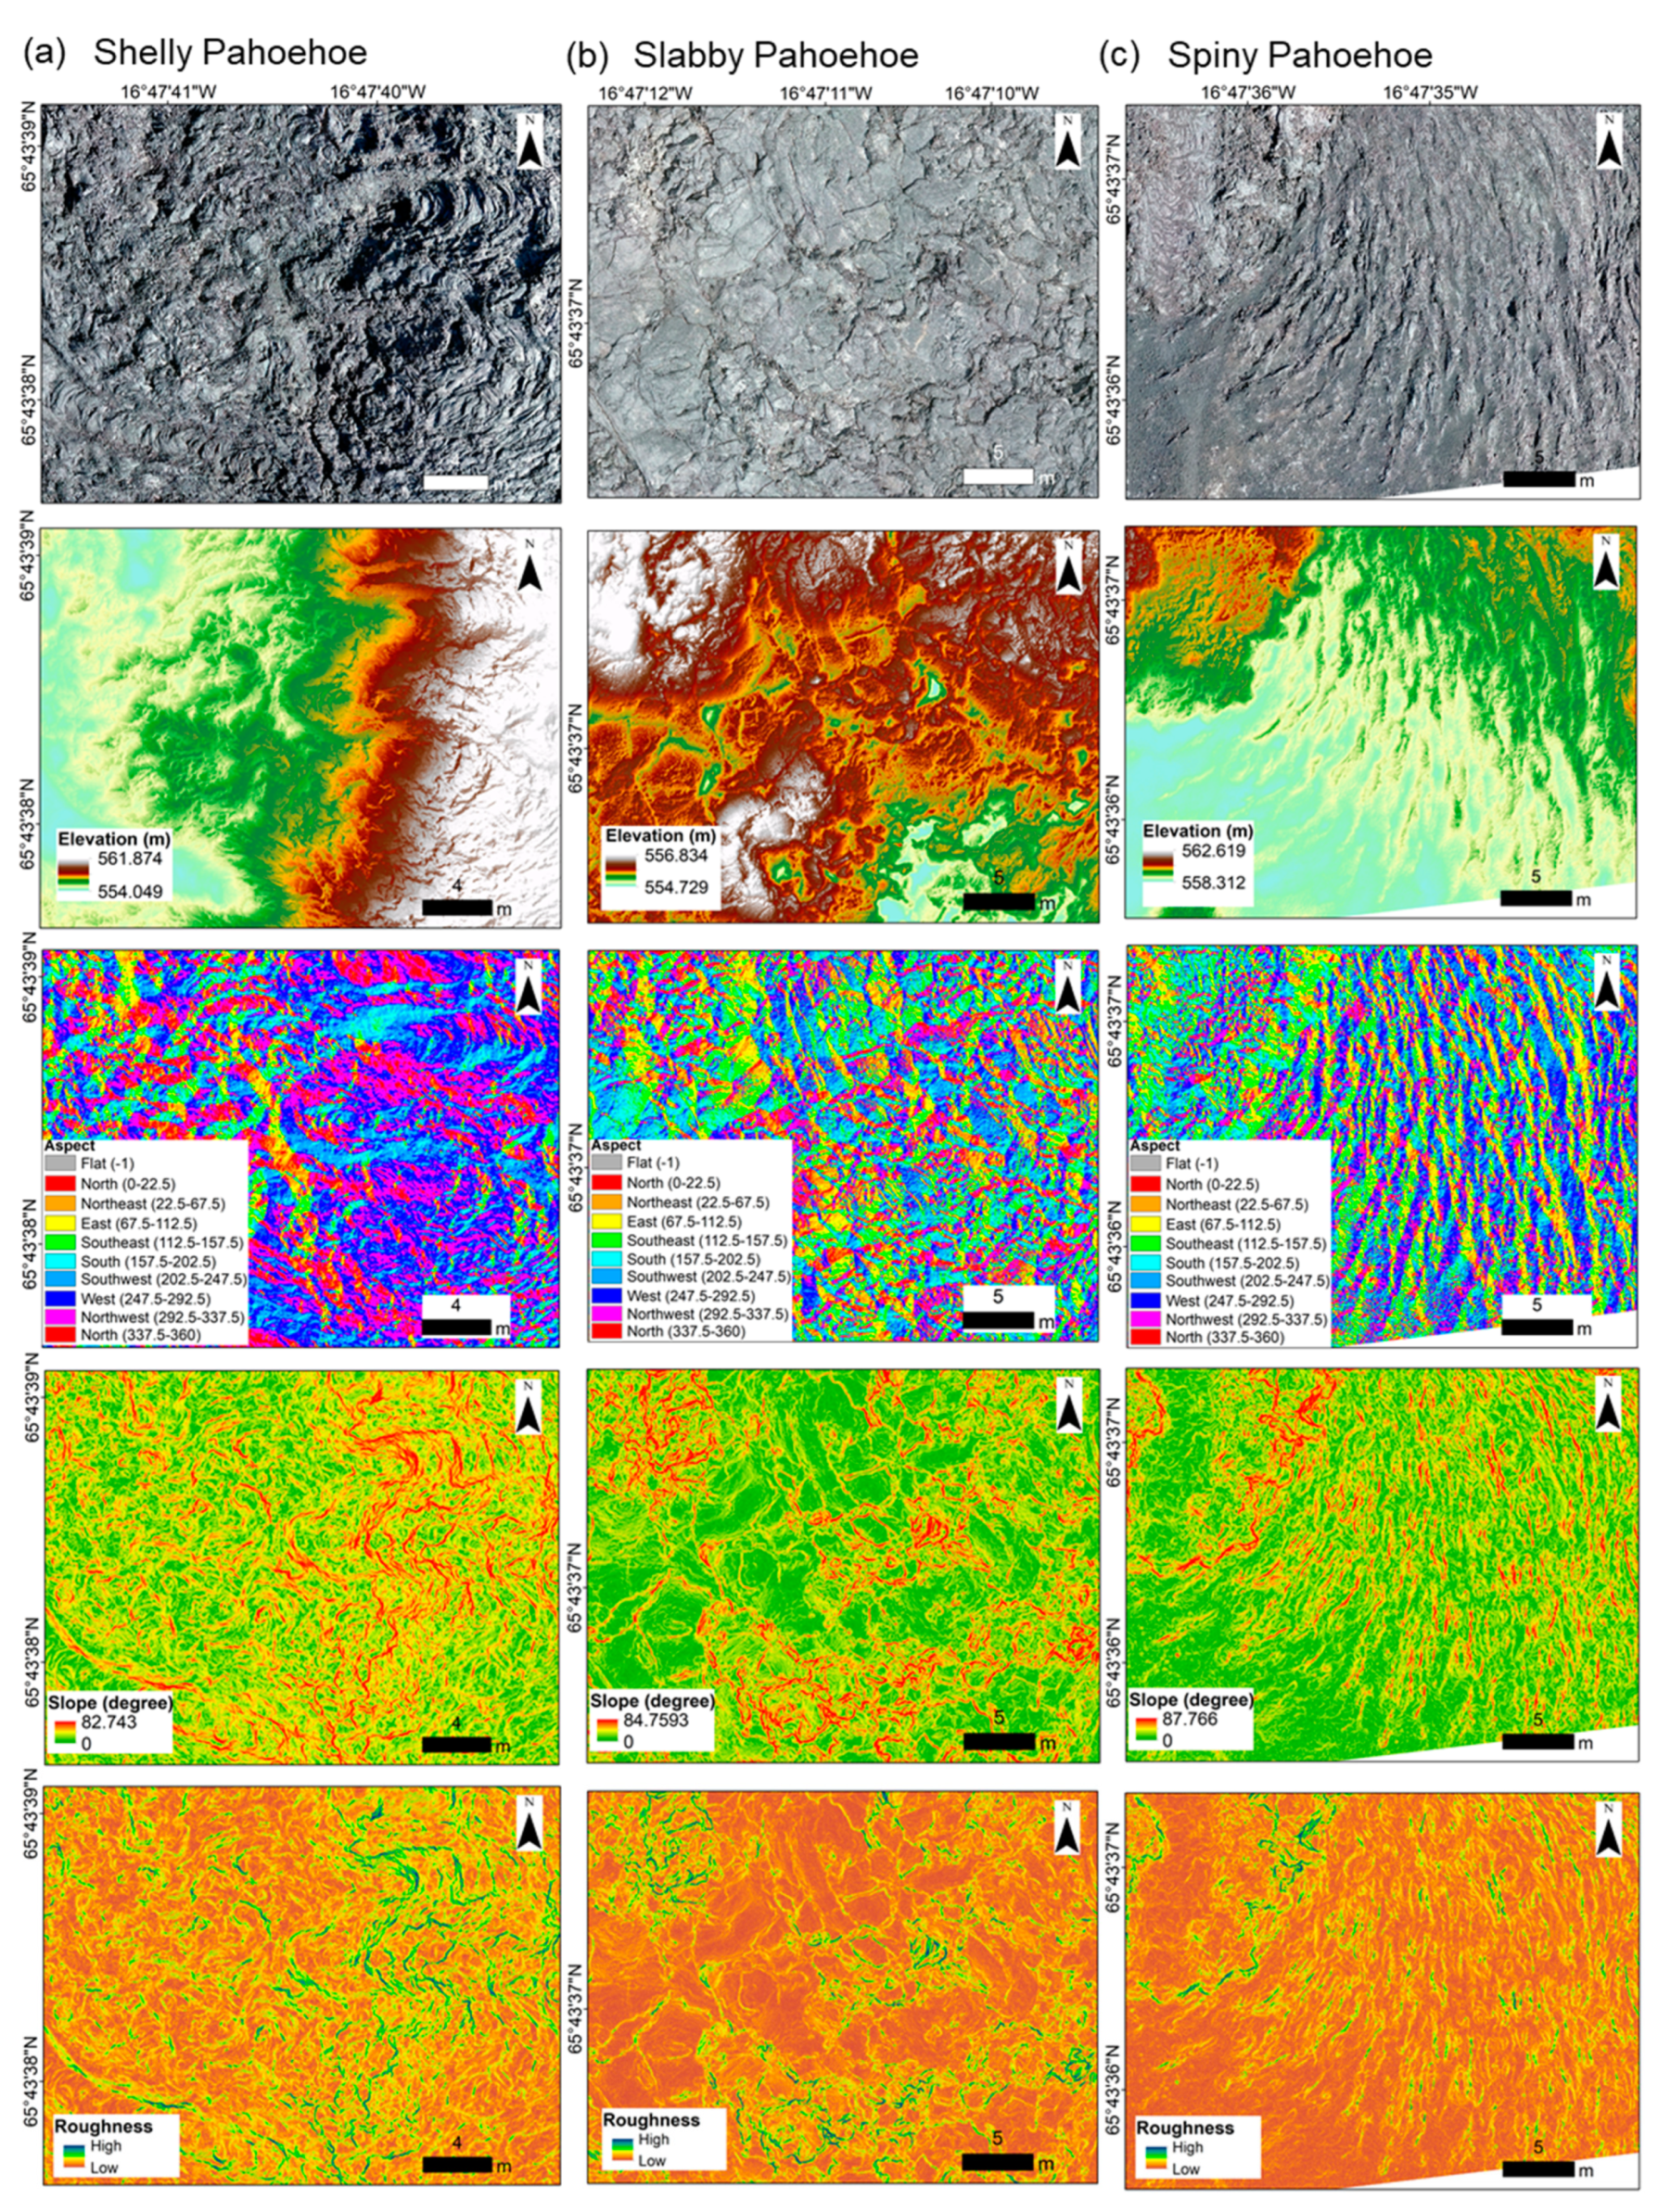
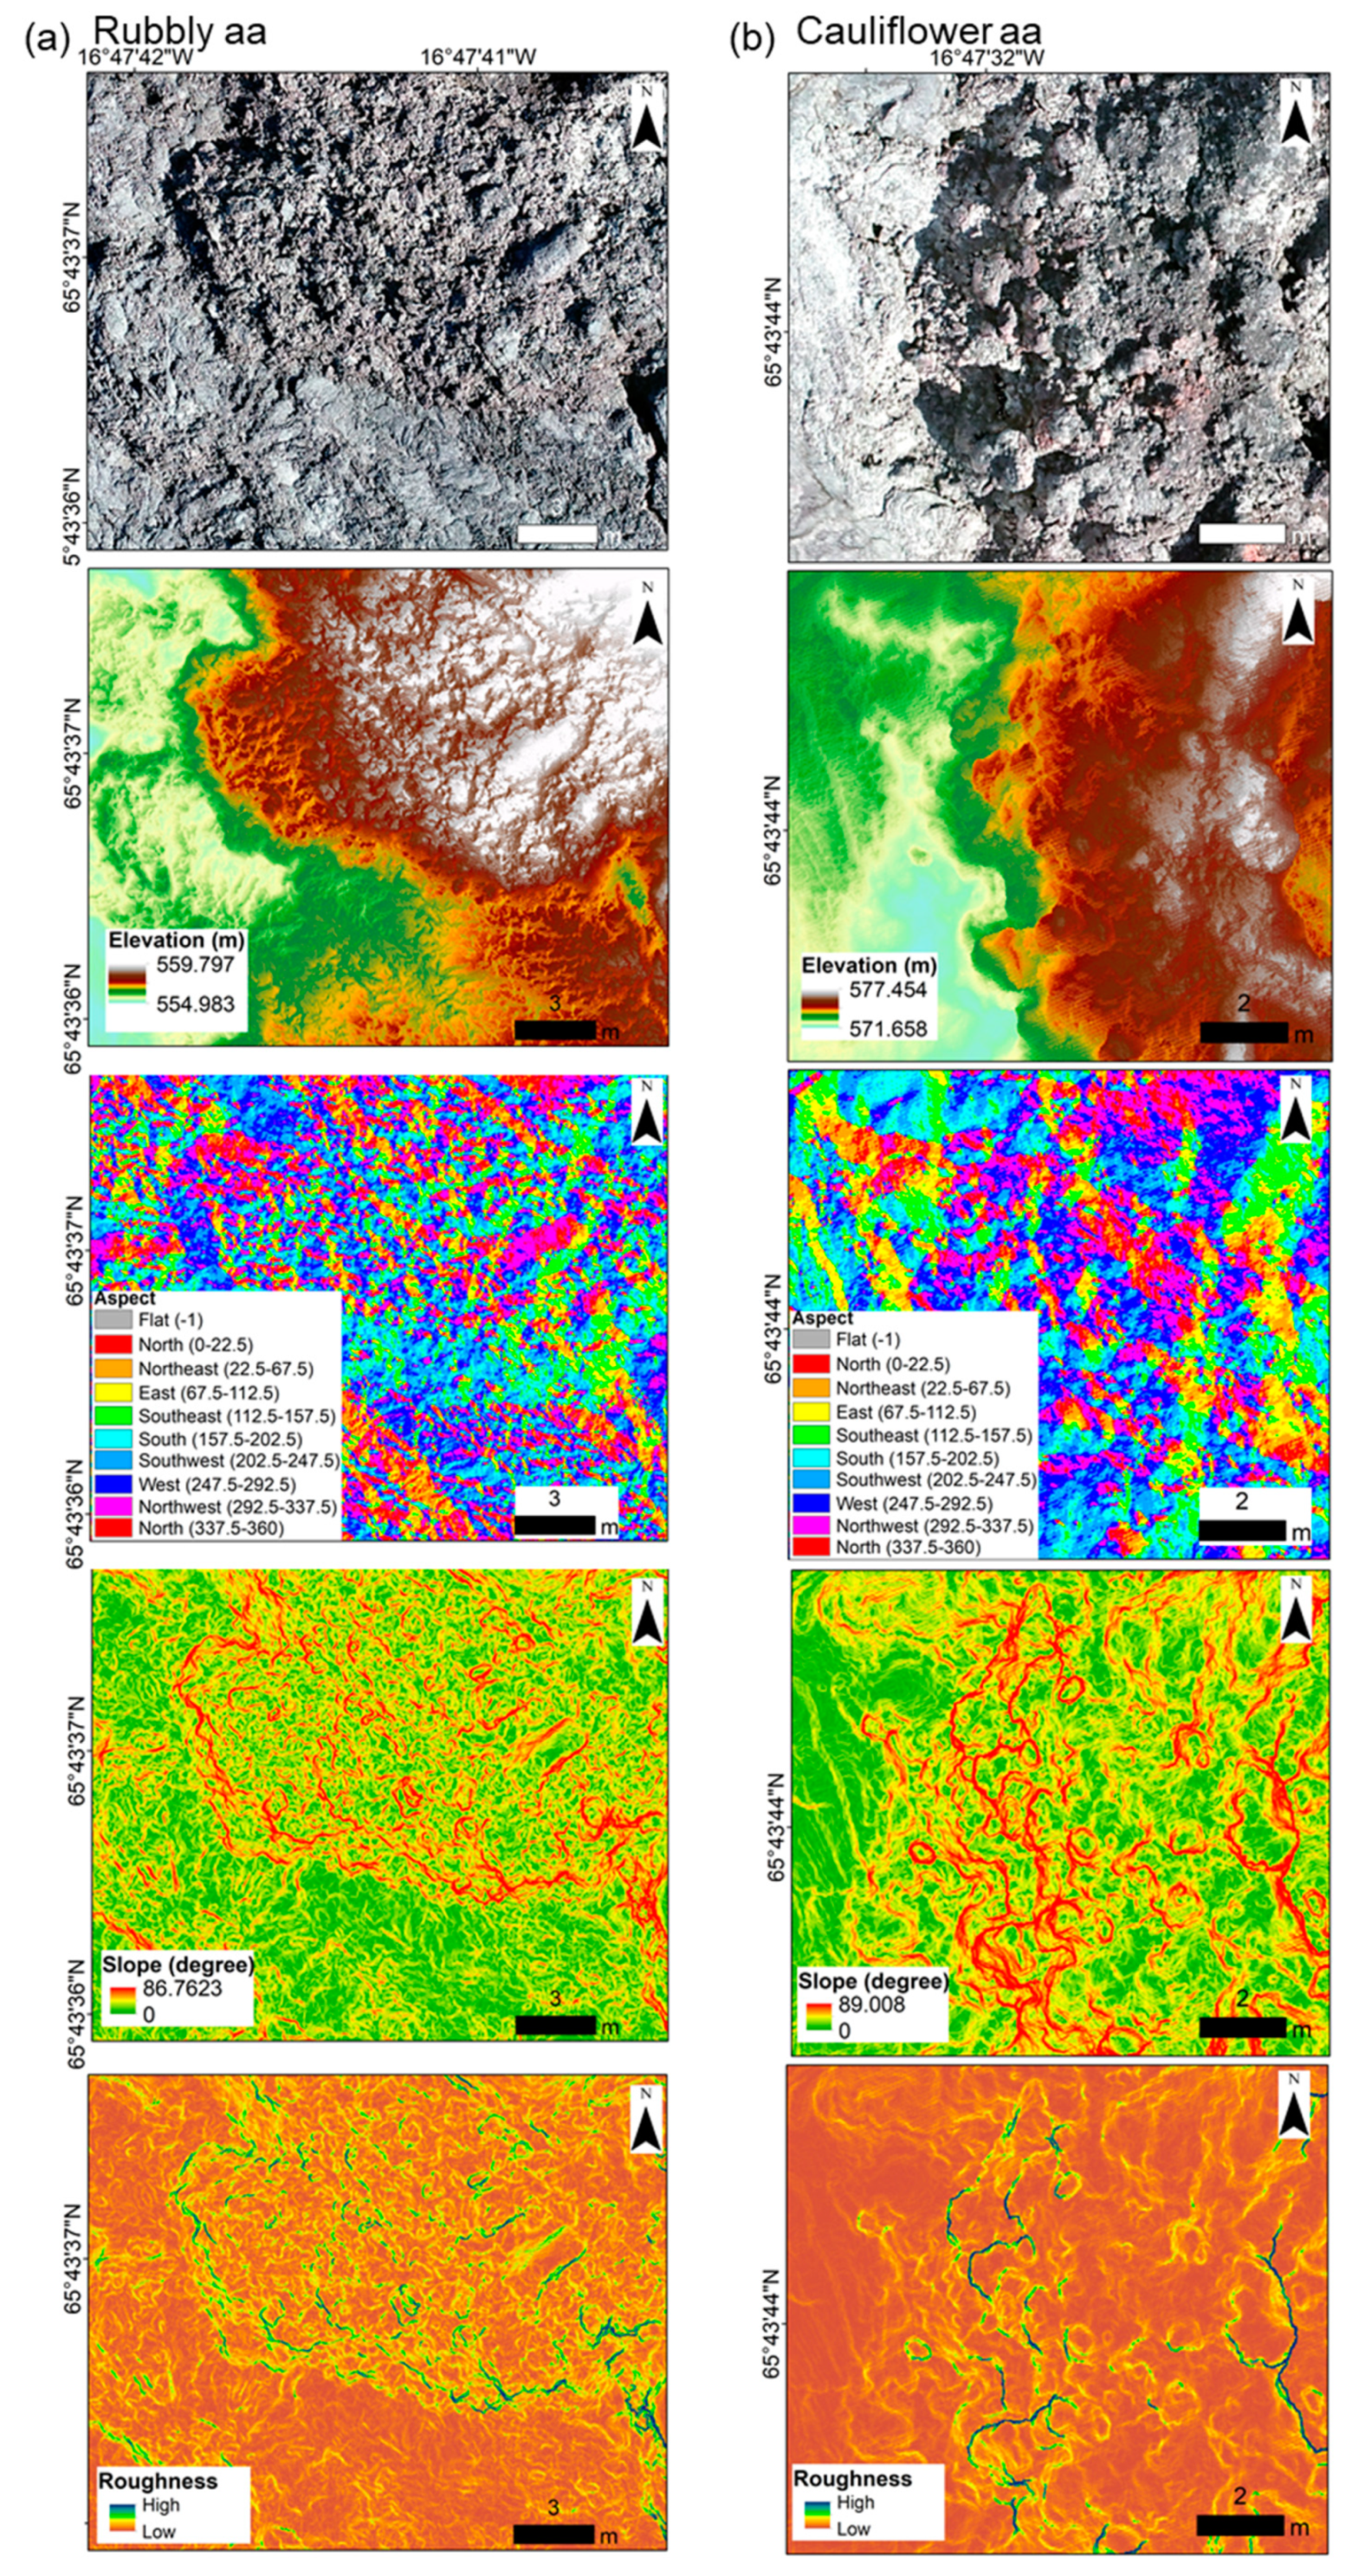
4.1. Lava Flow Morphologies and Terrain Parameters
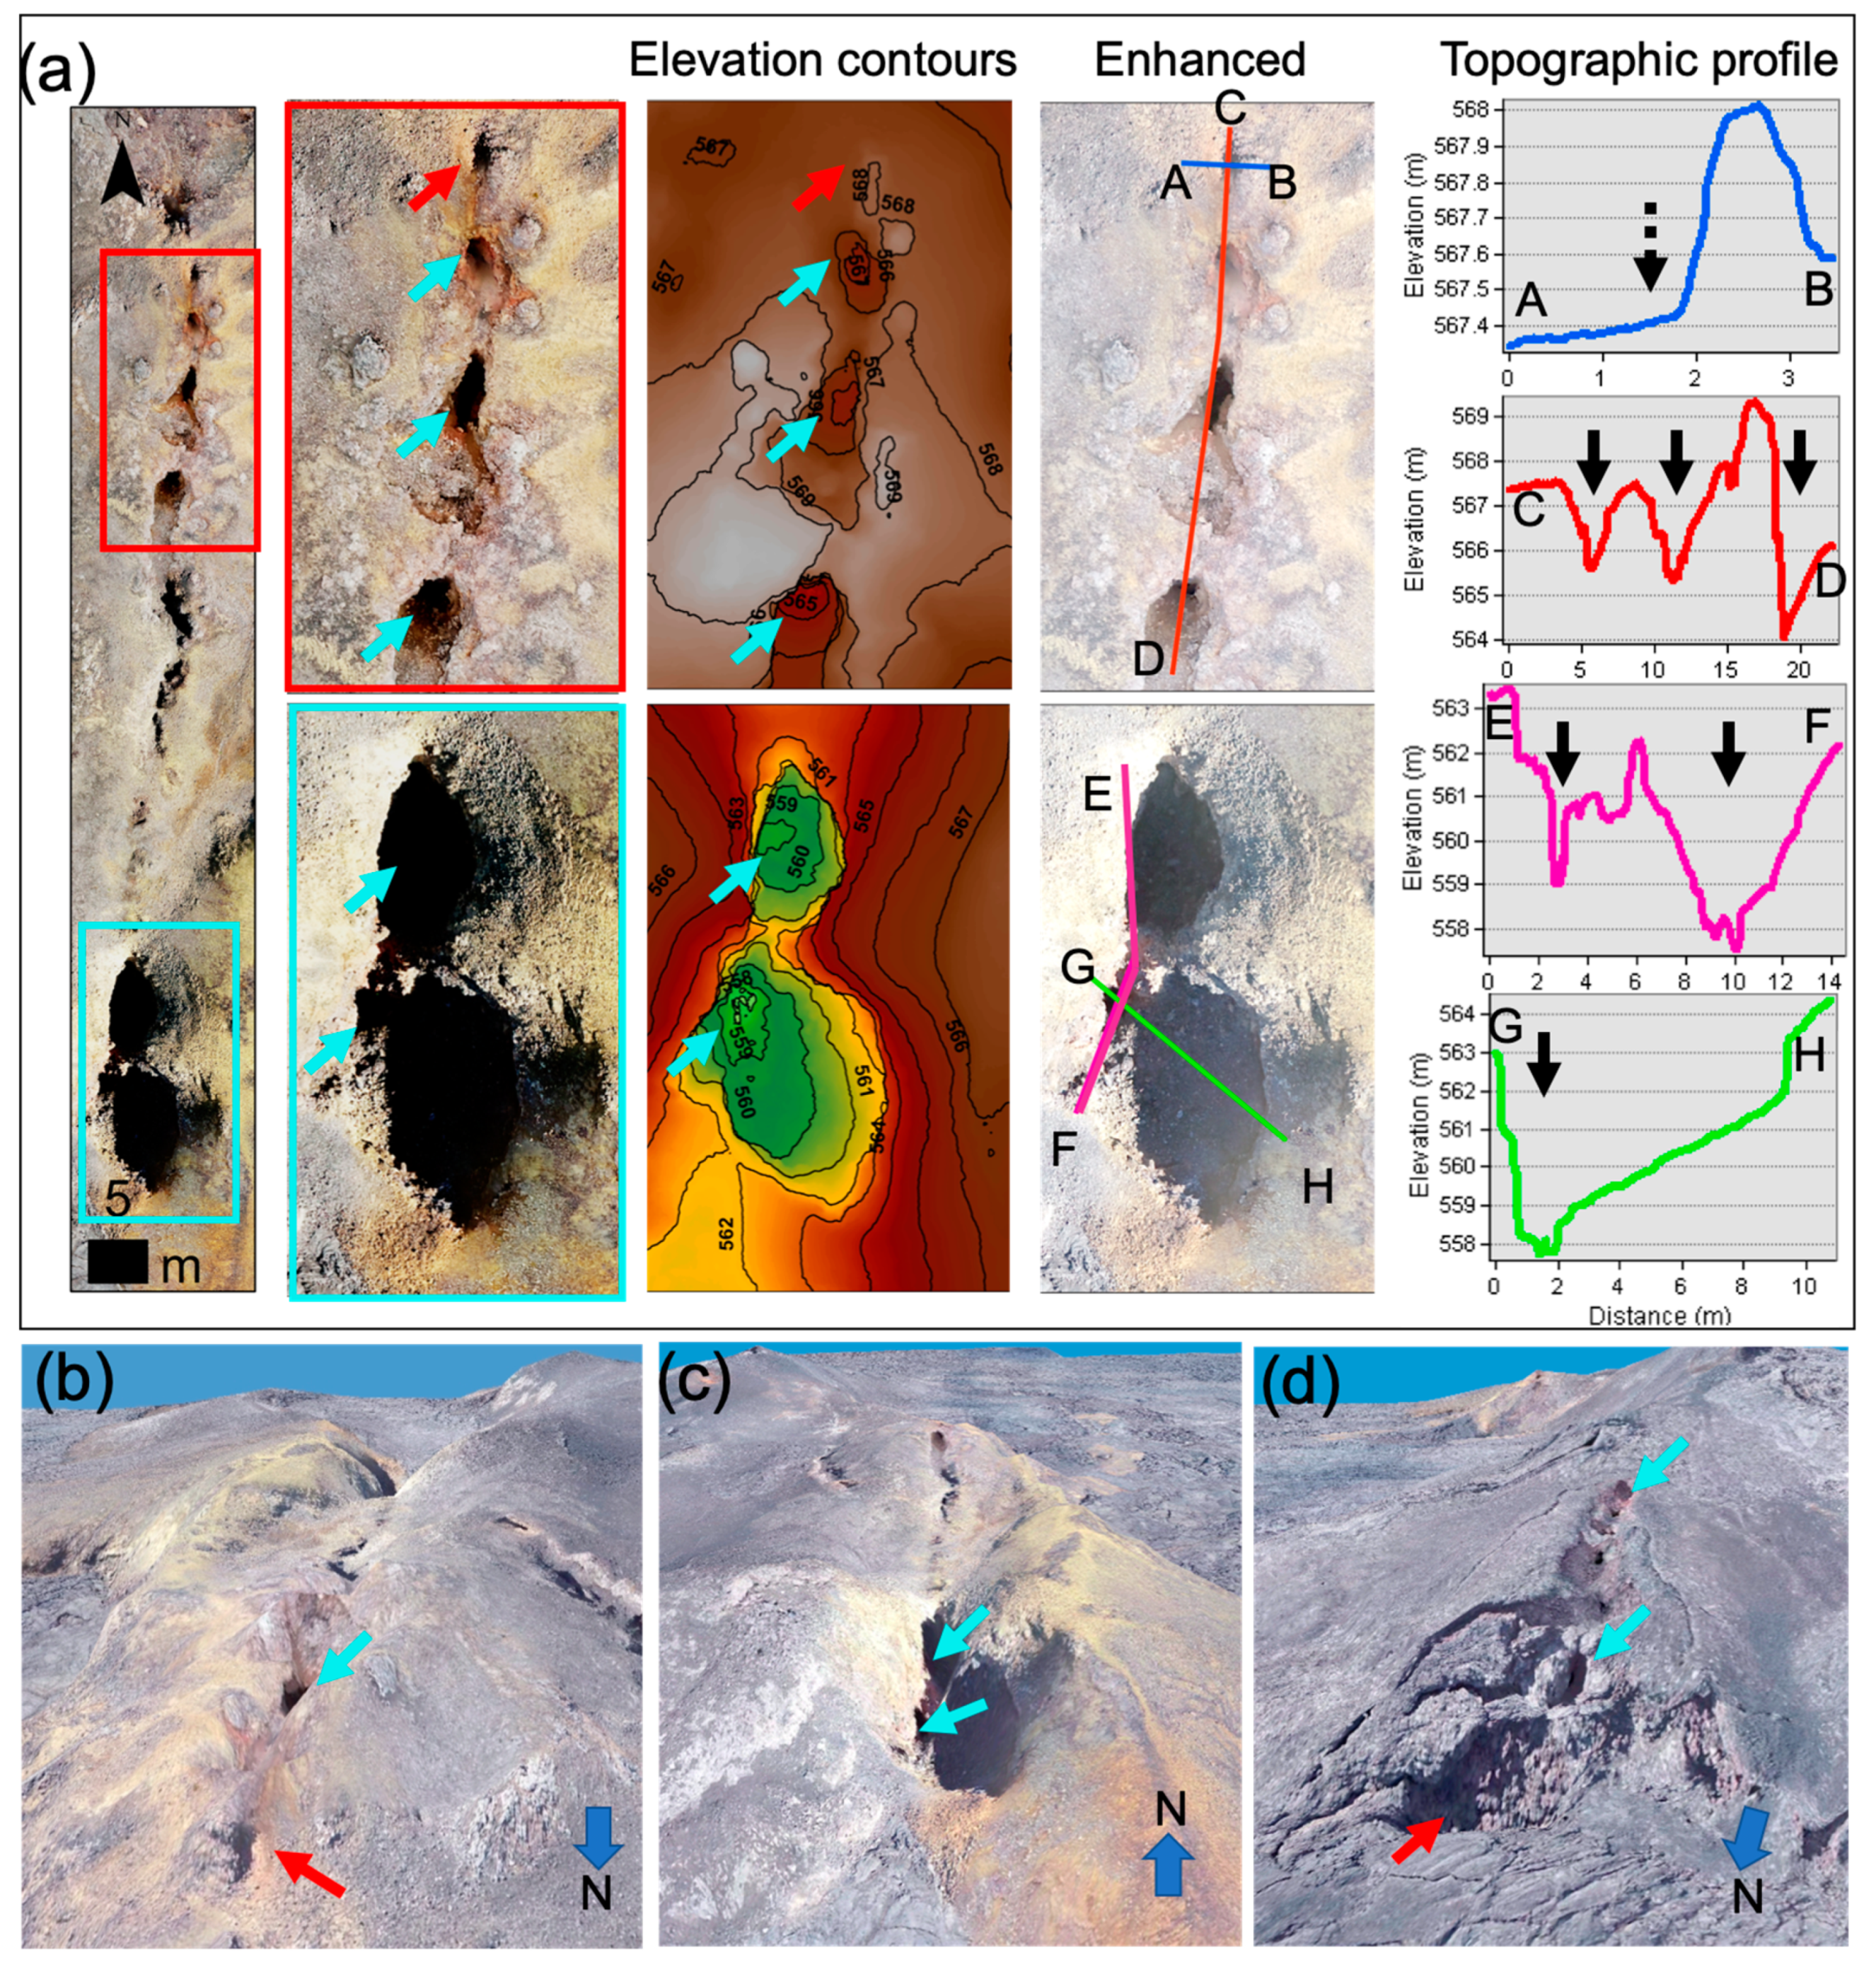
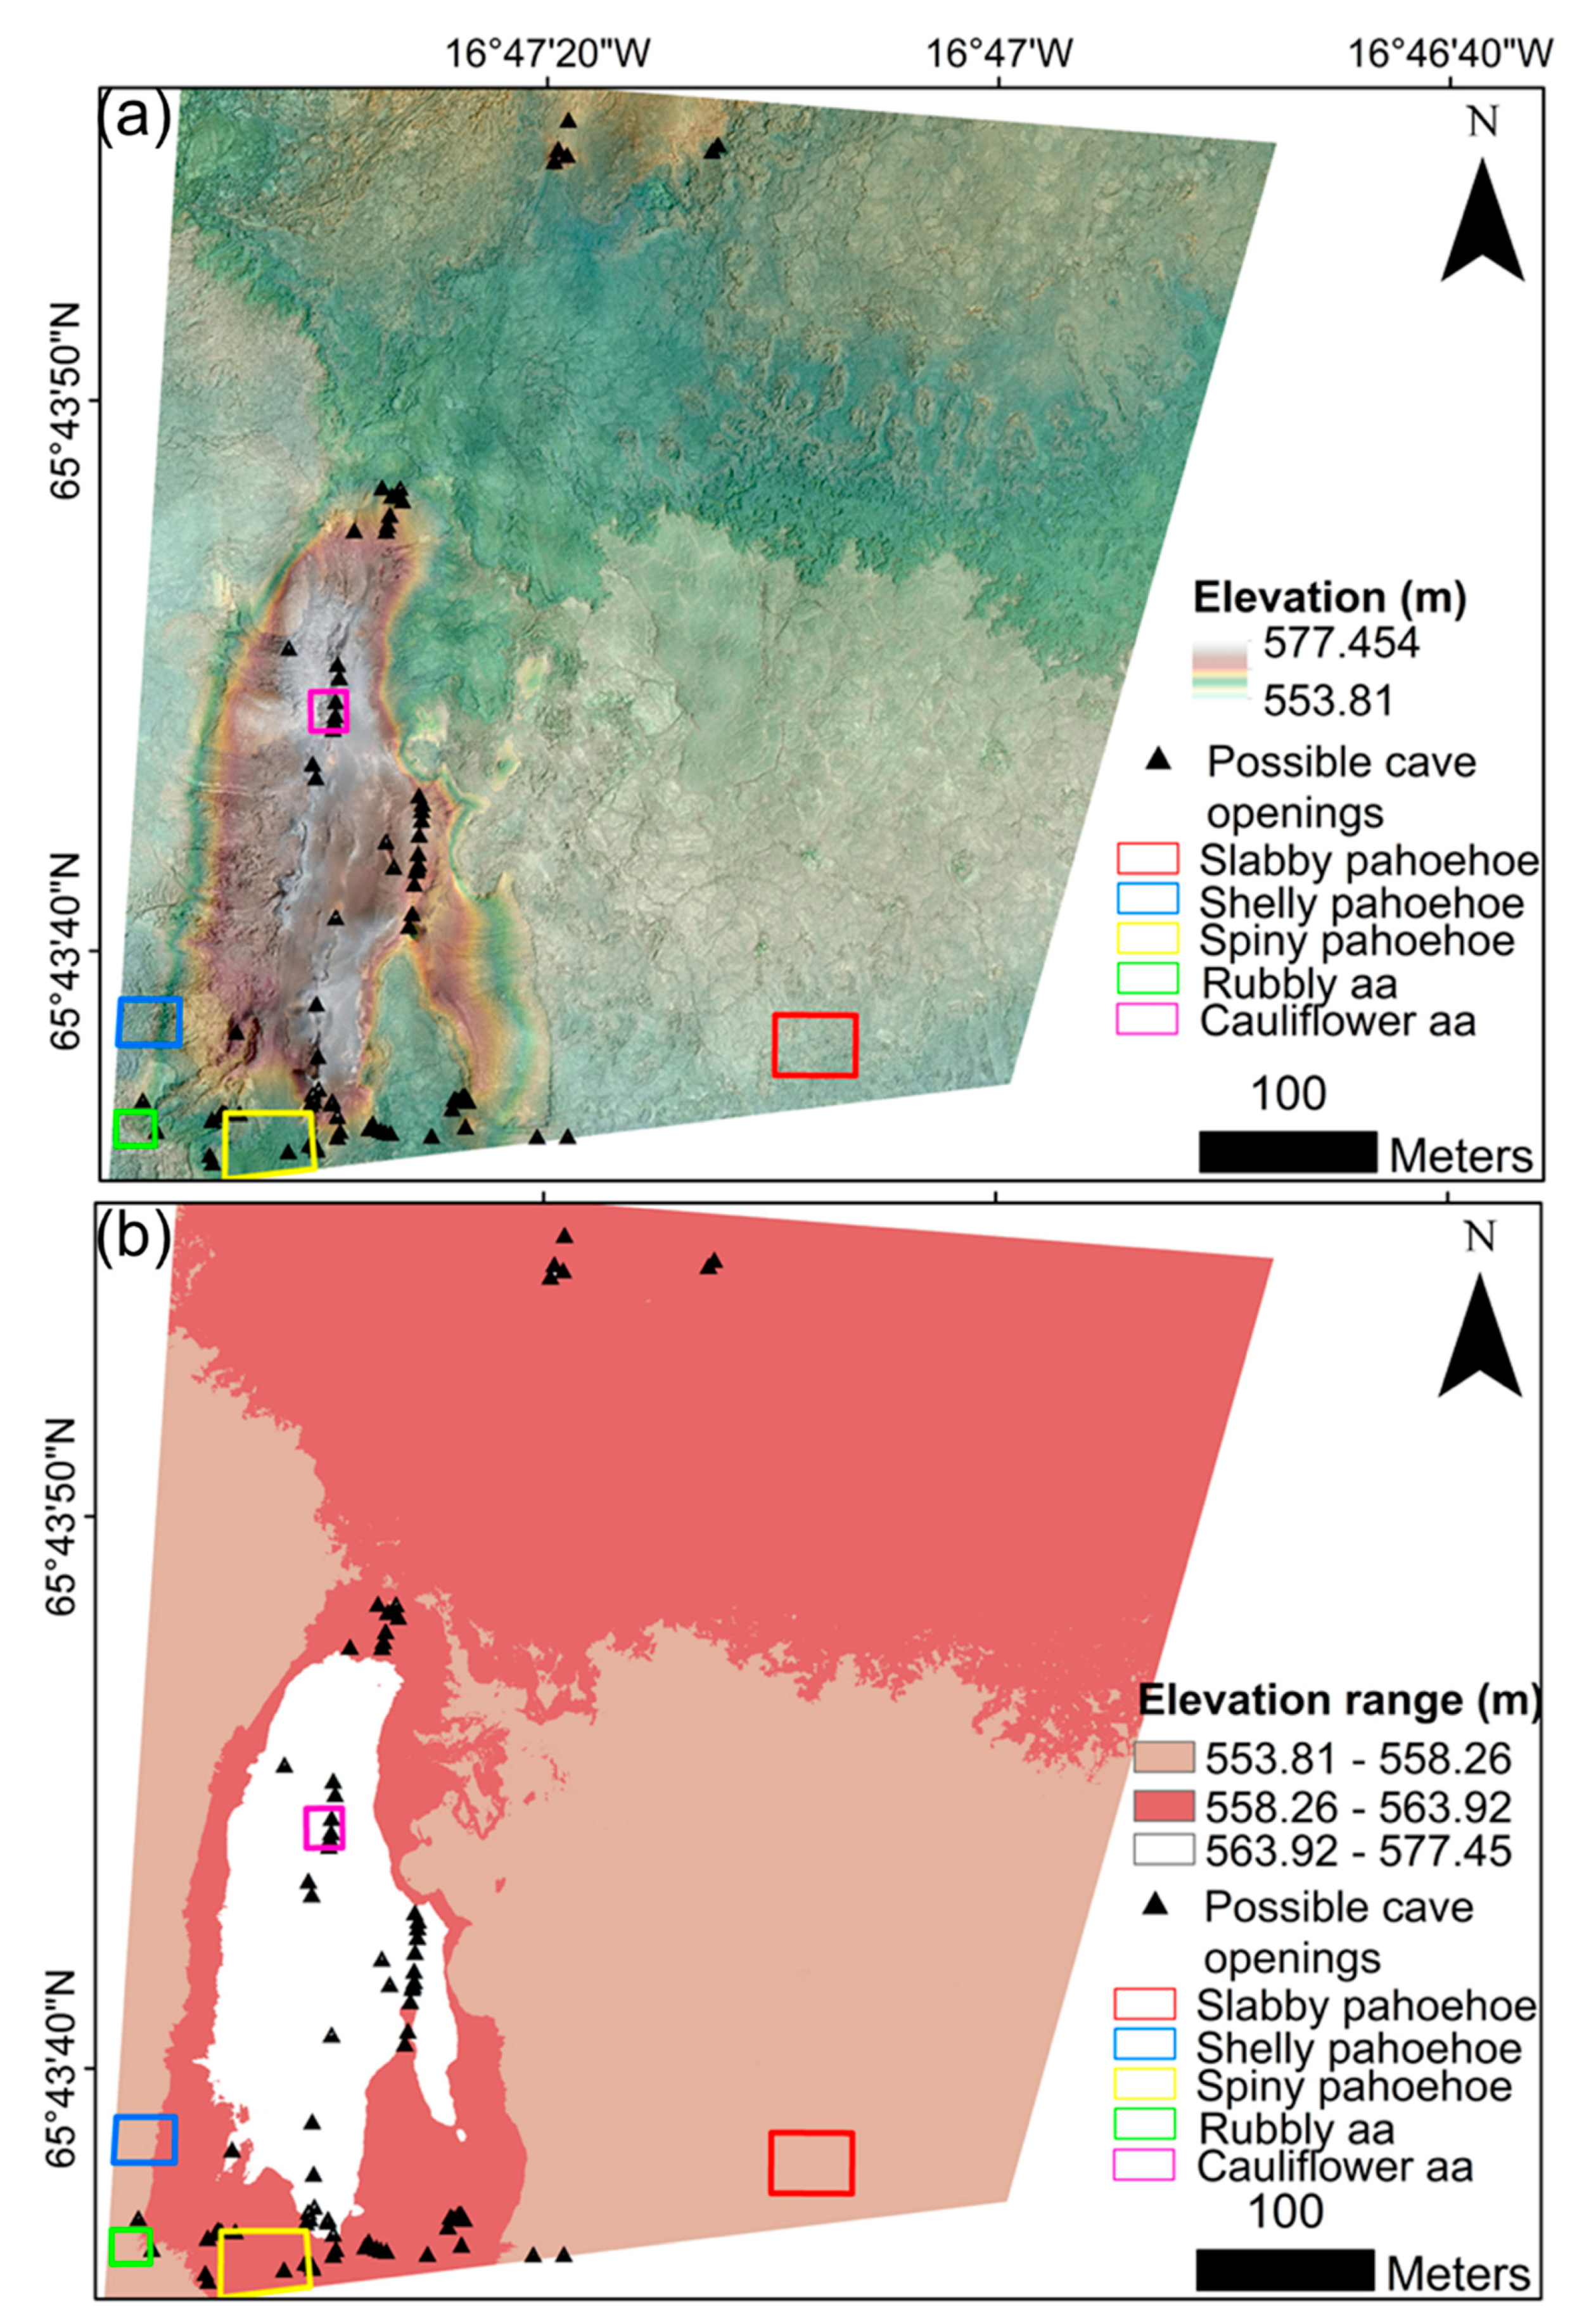
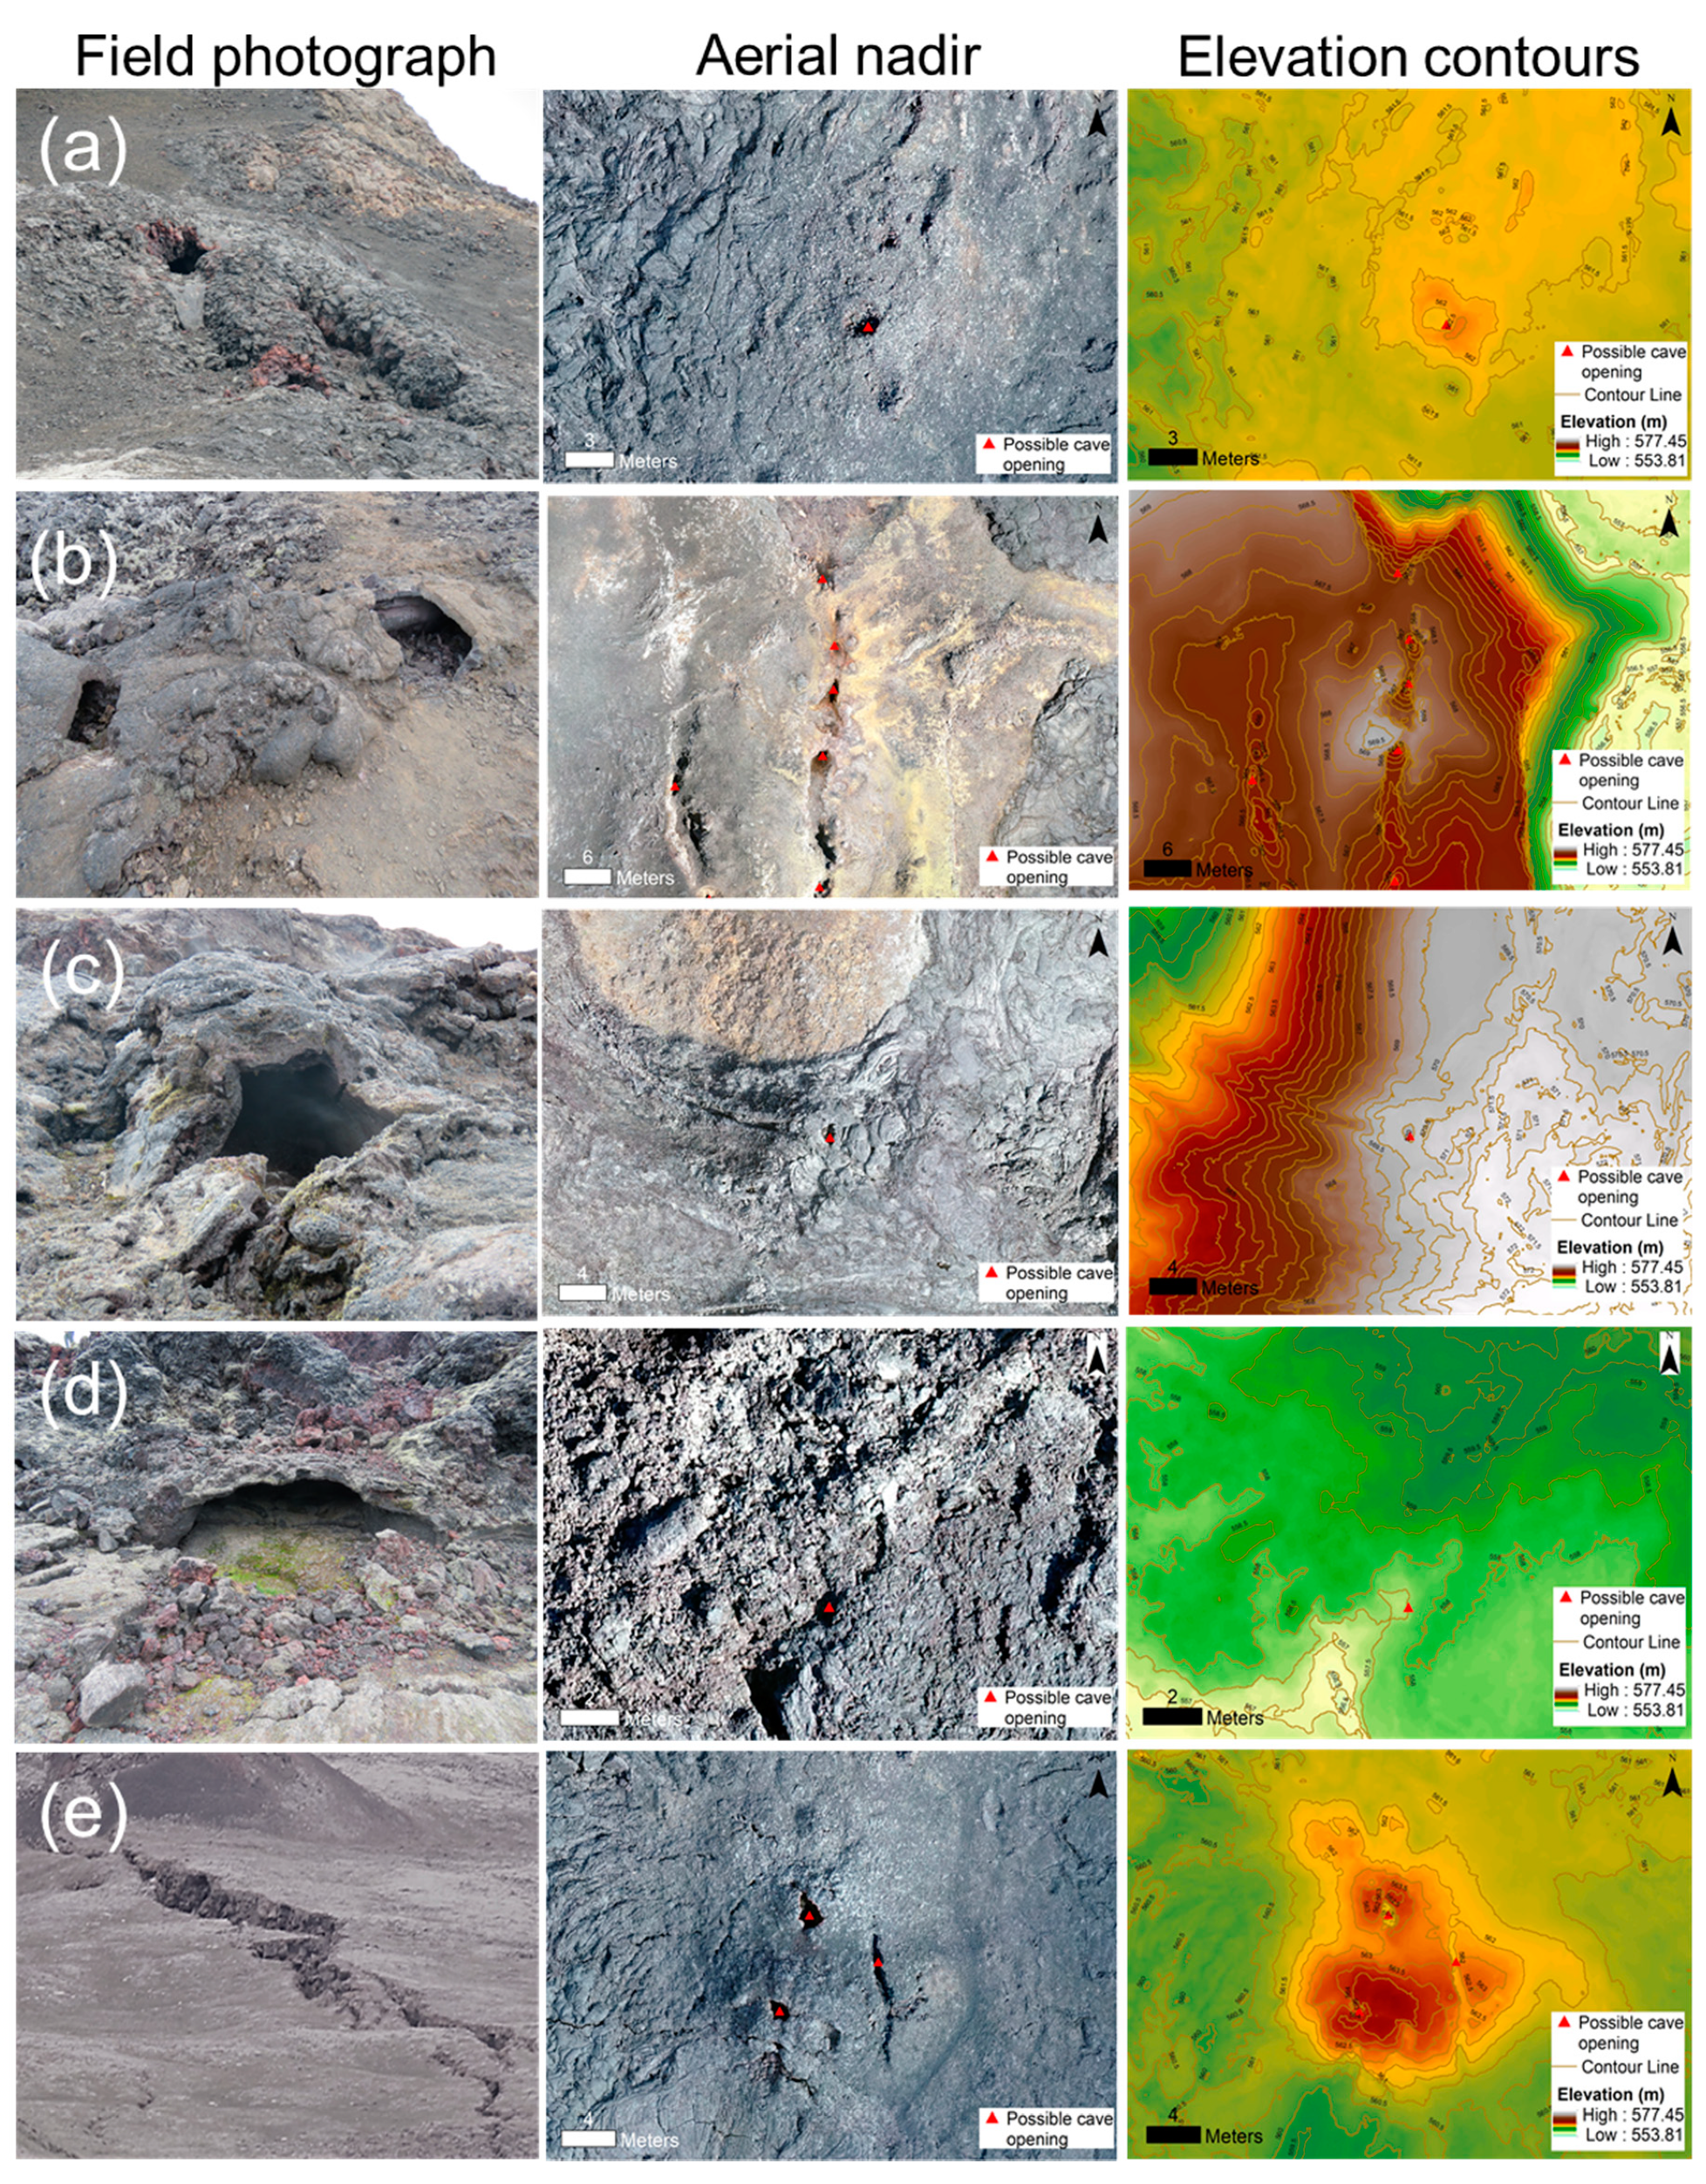
4.2. Cave Opening Distribution and Characterization
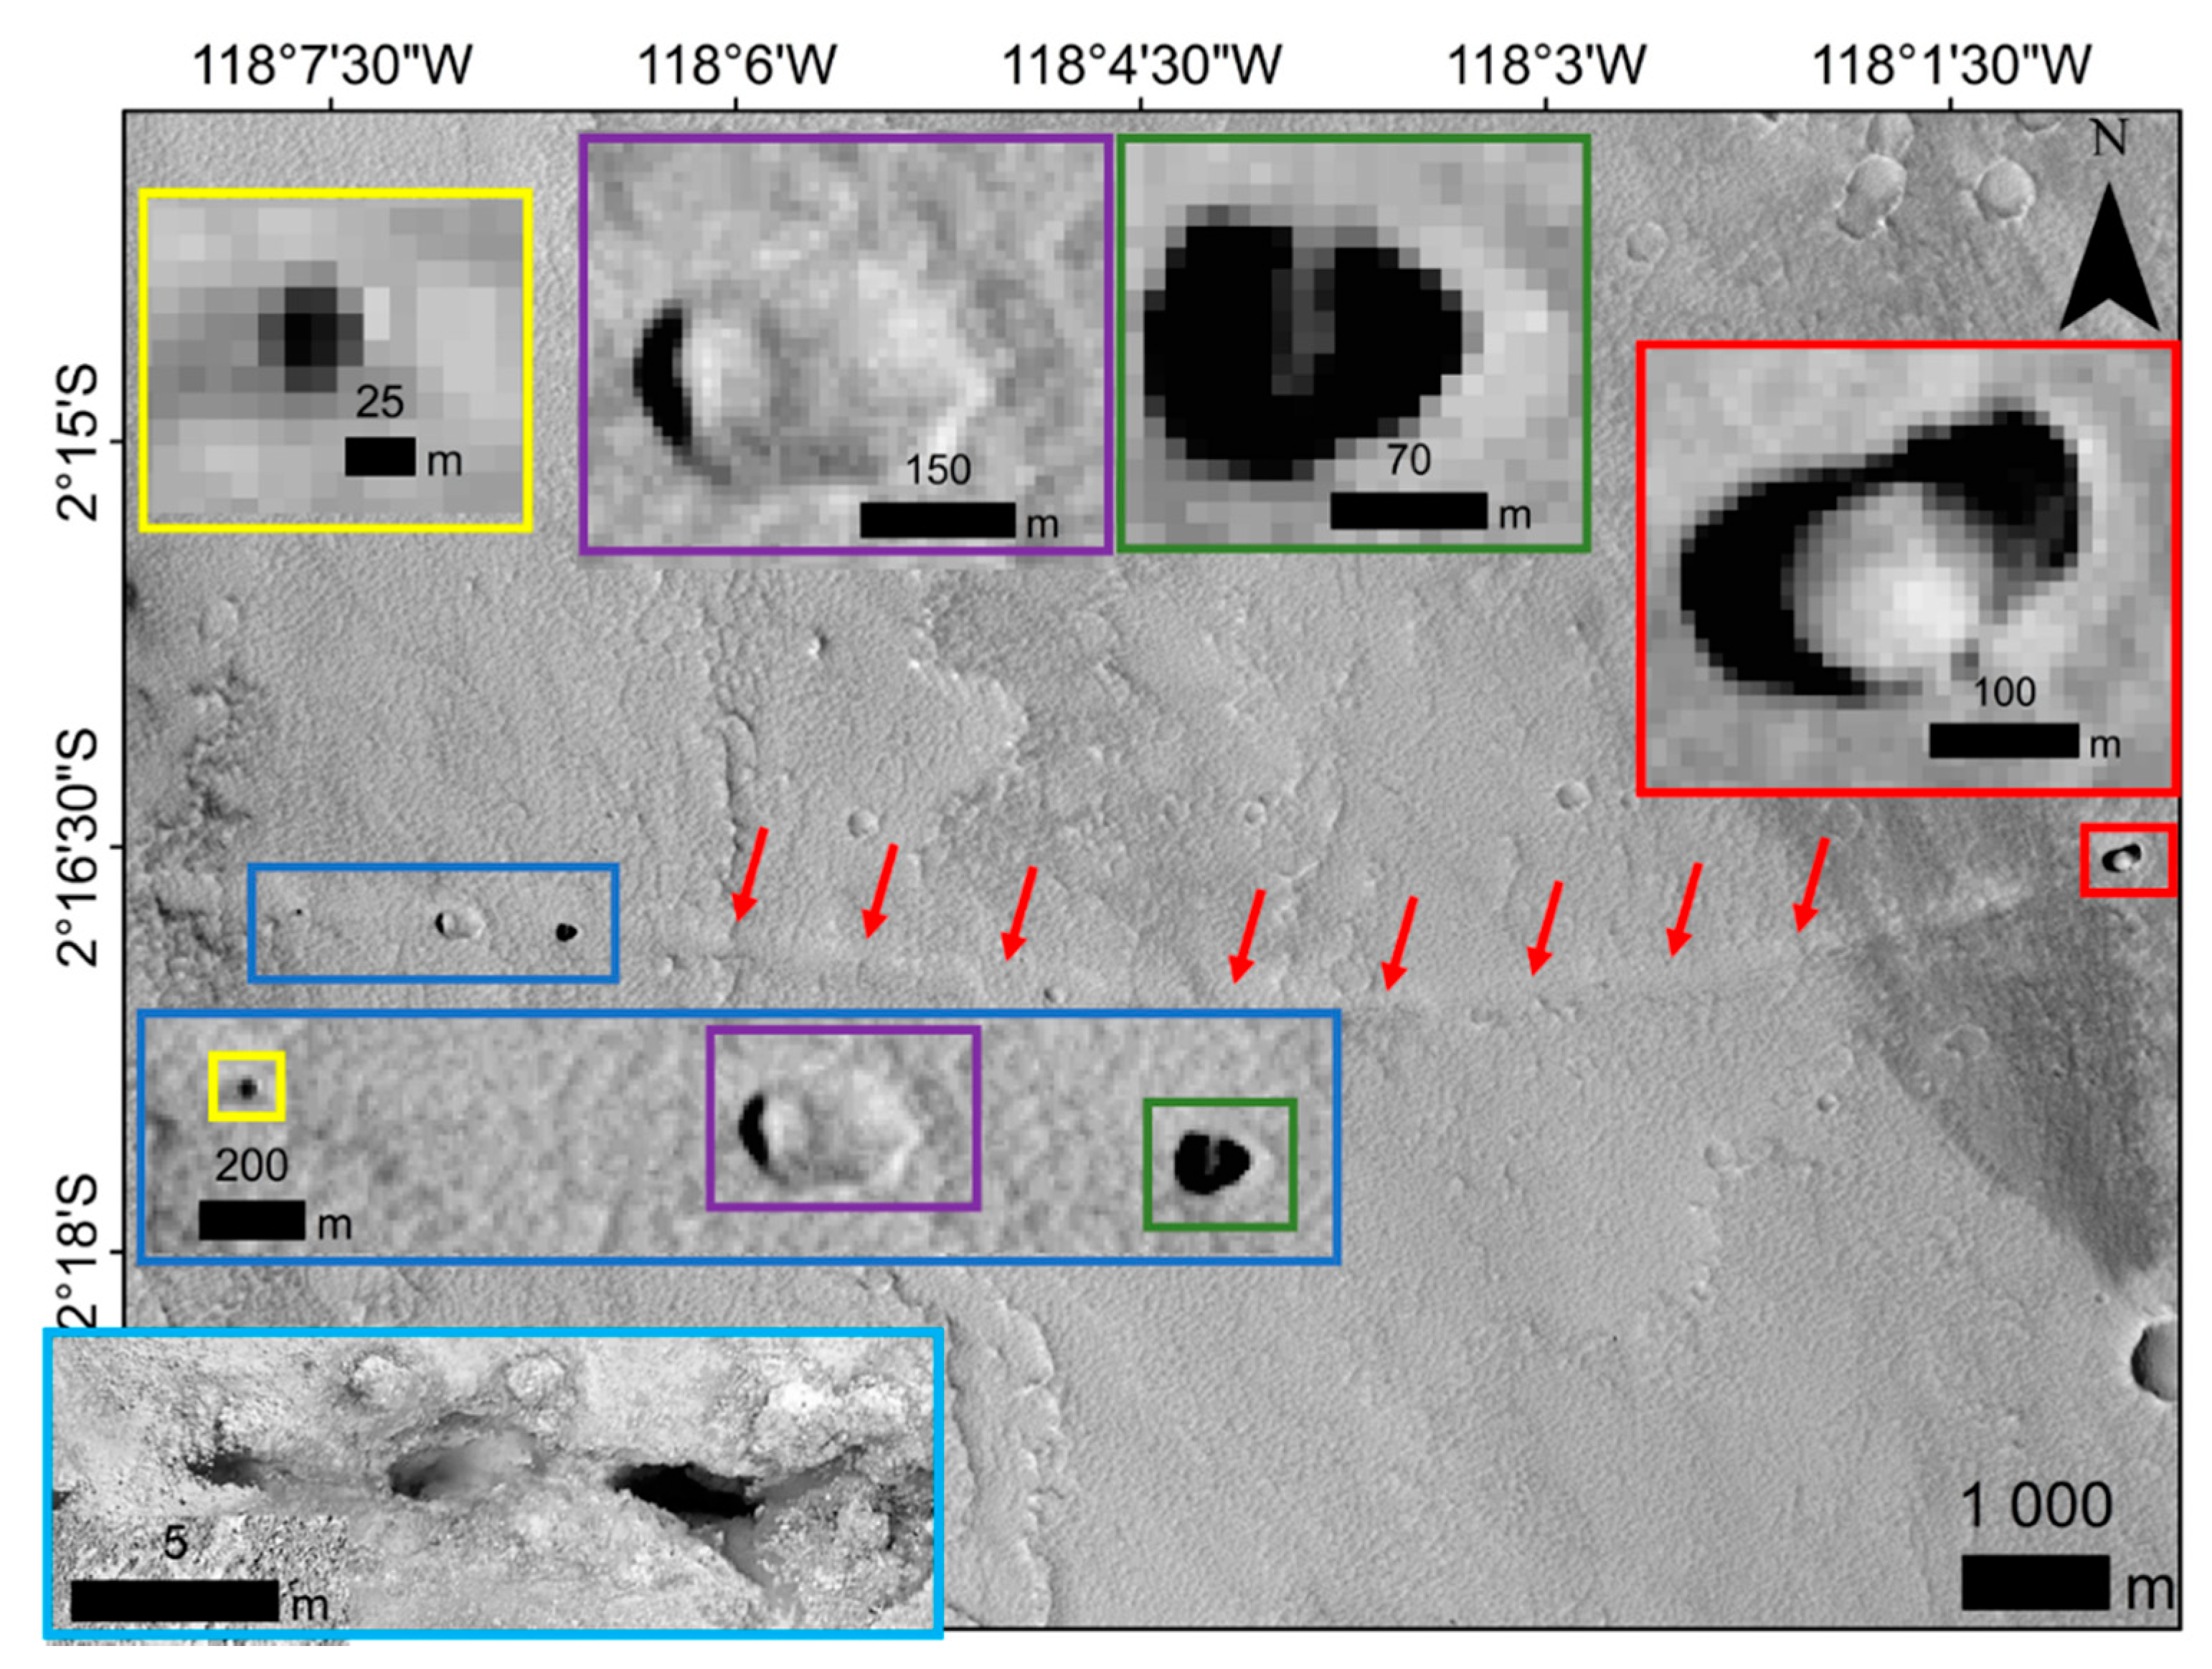
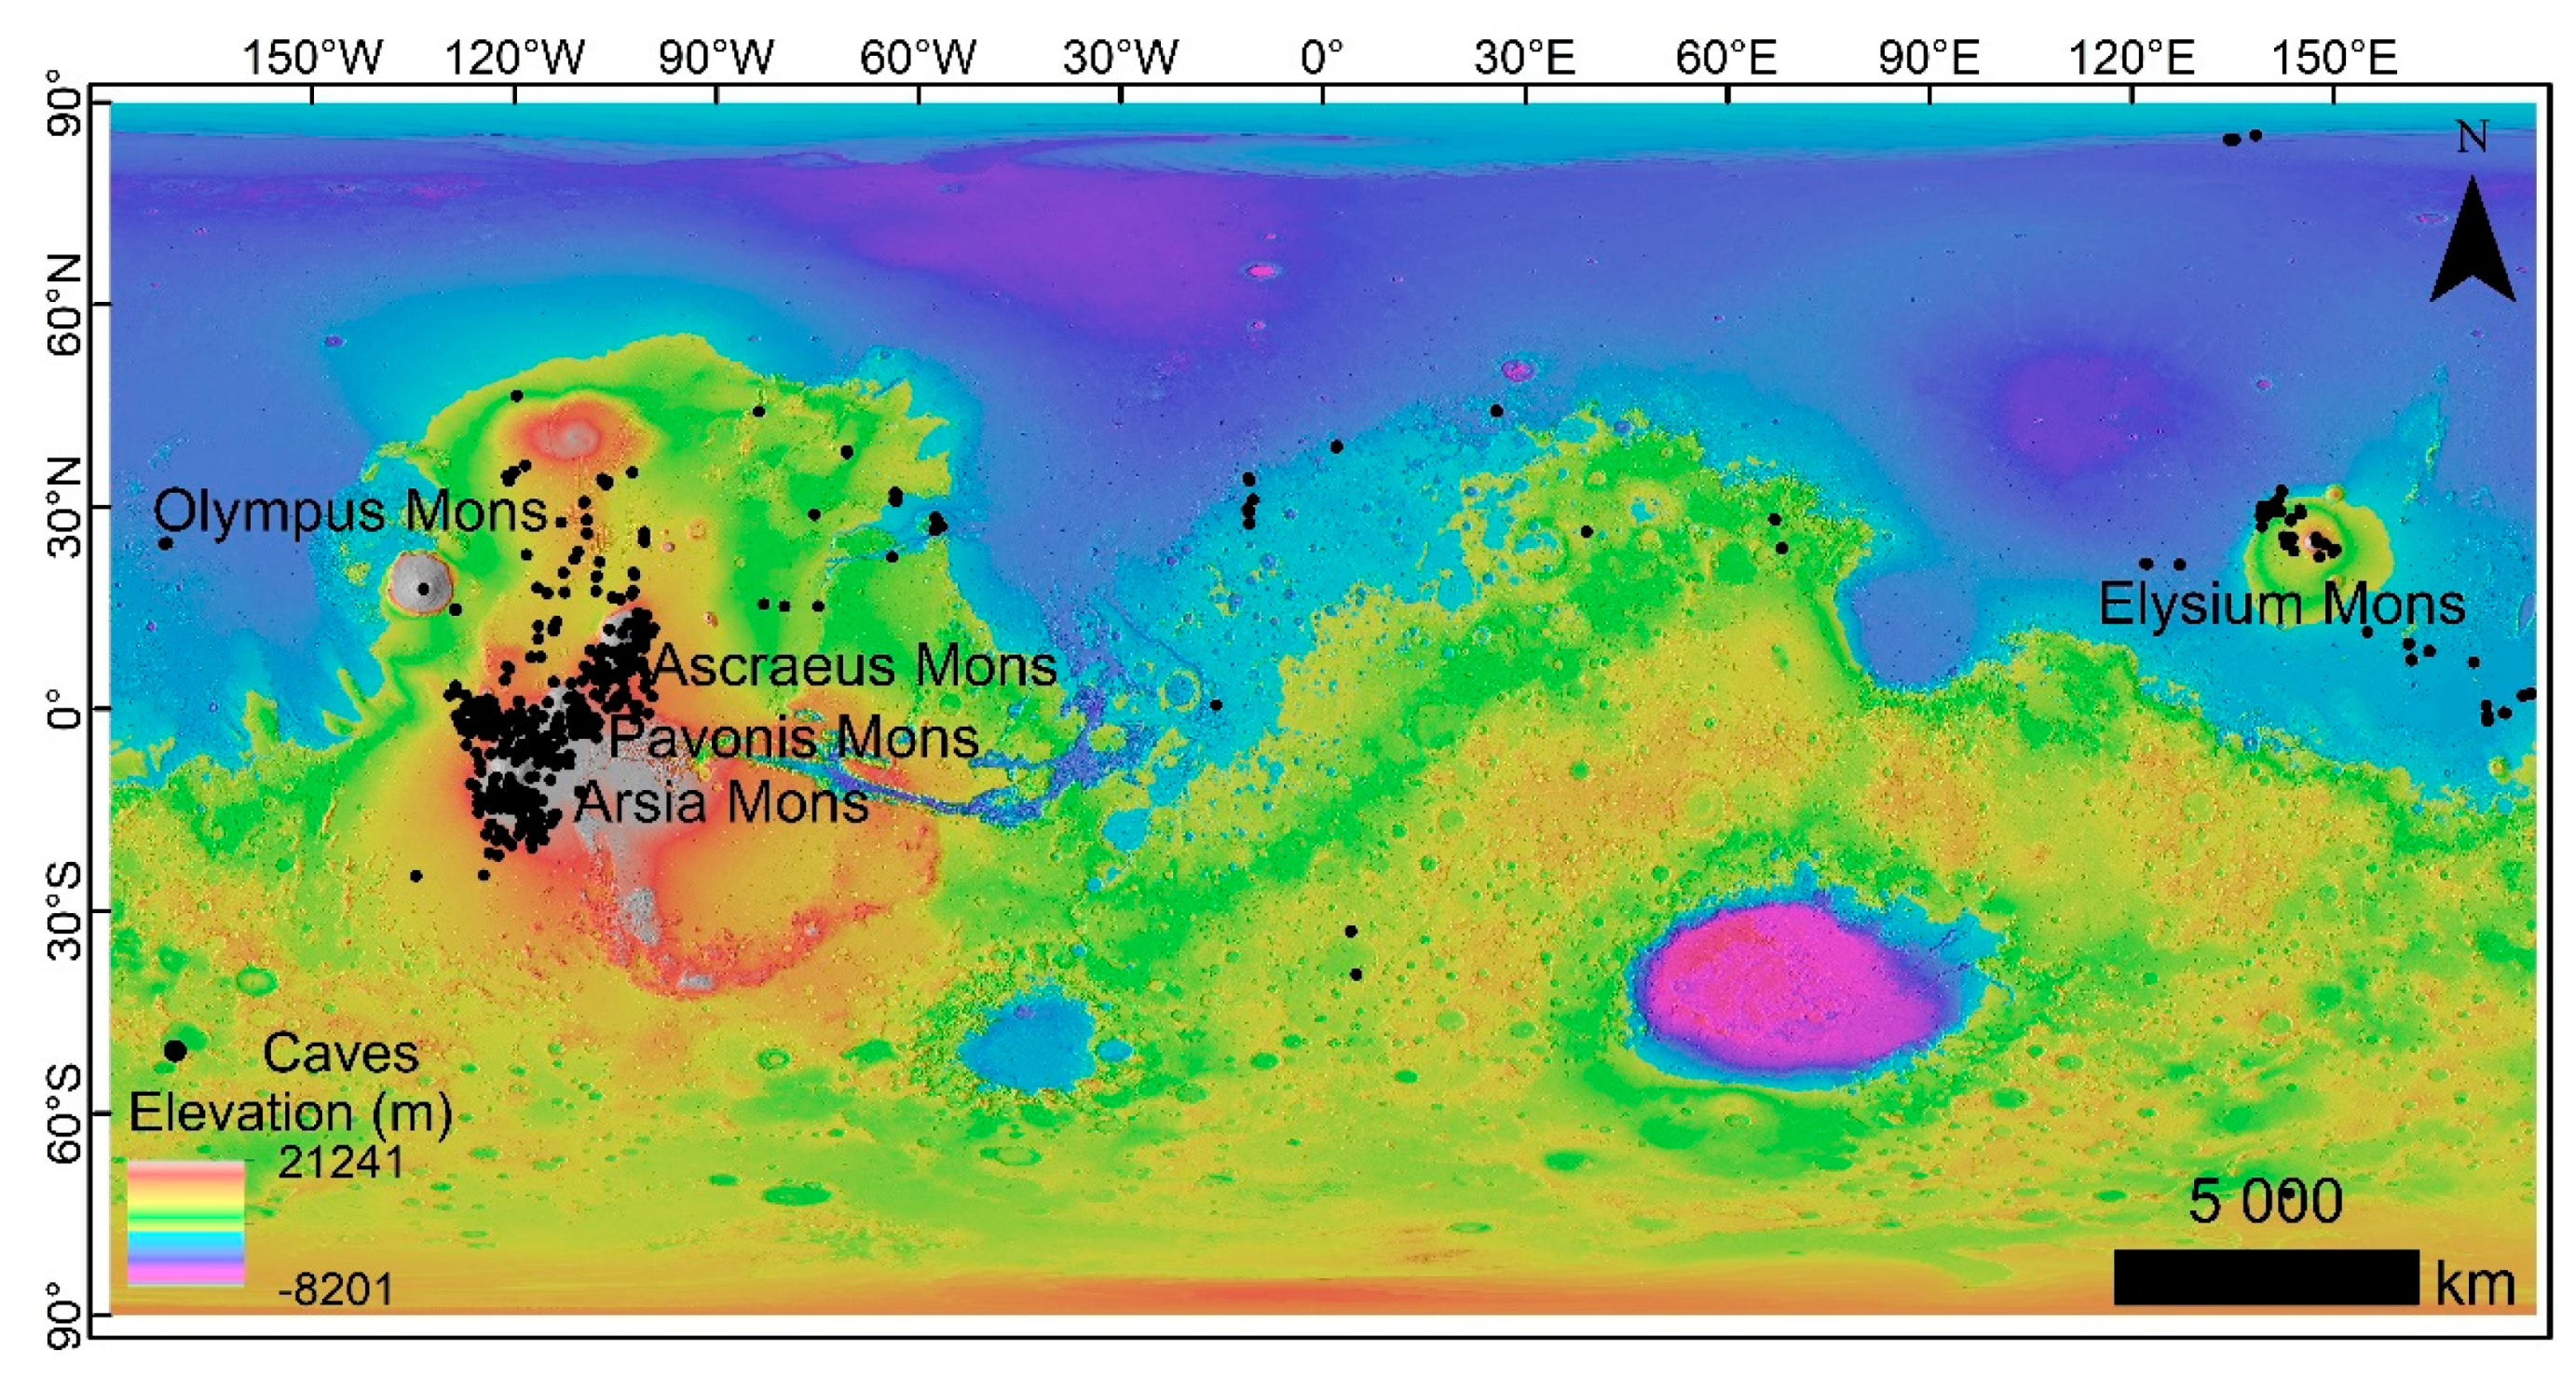
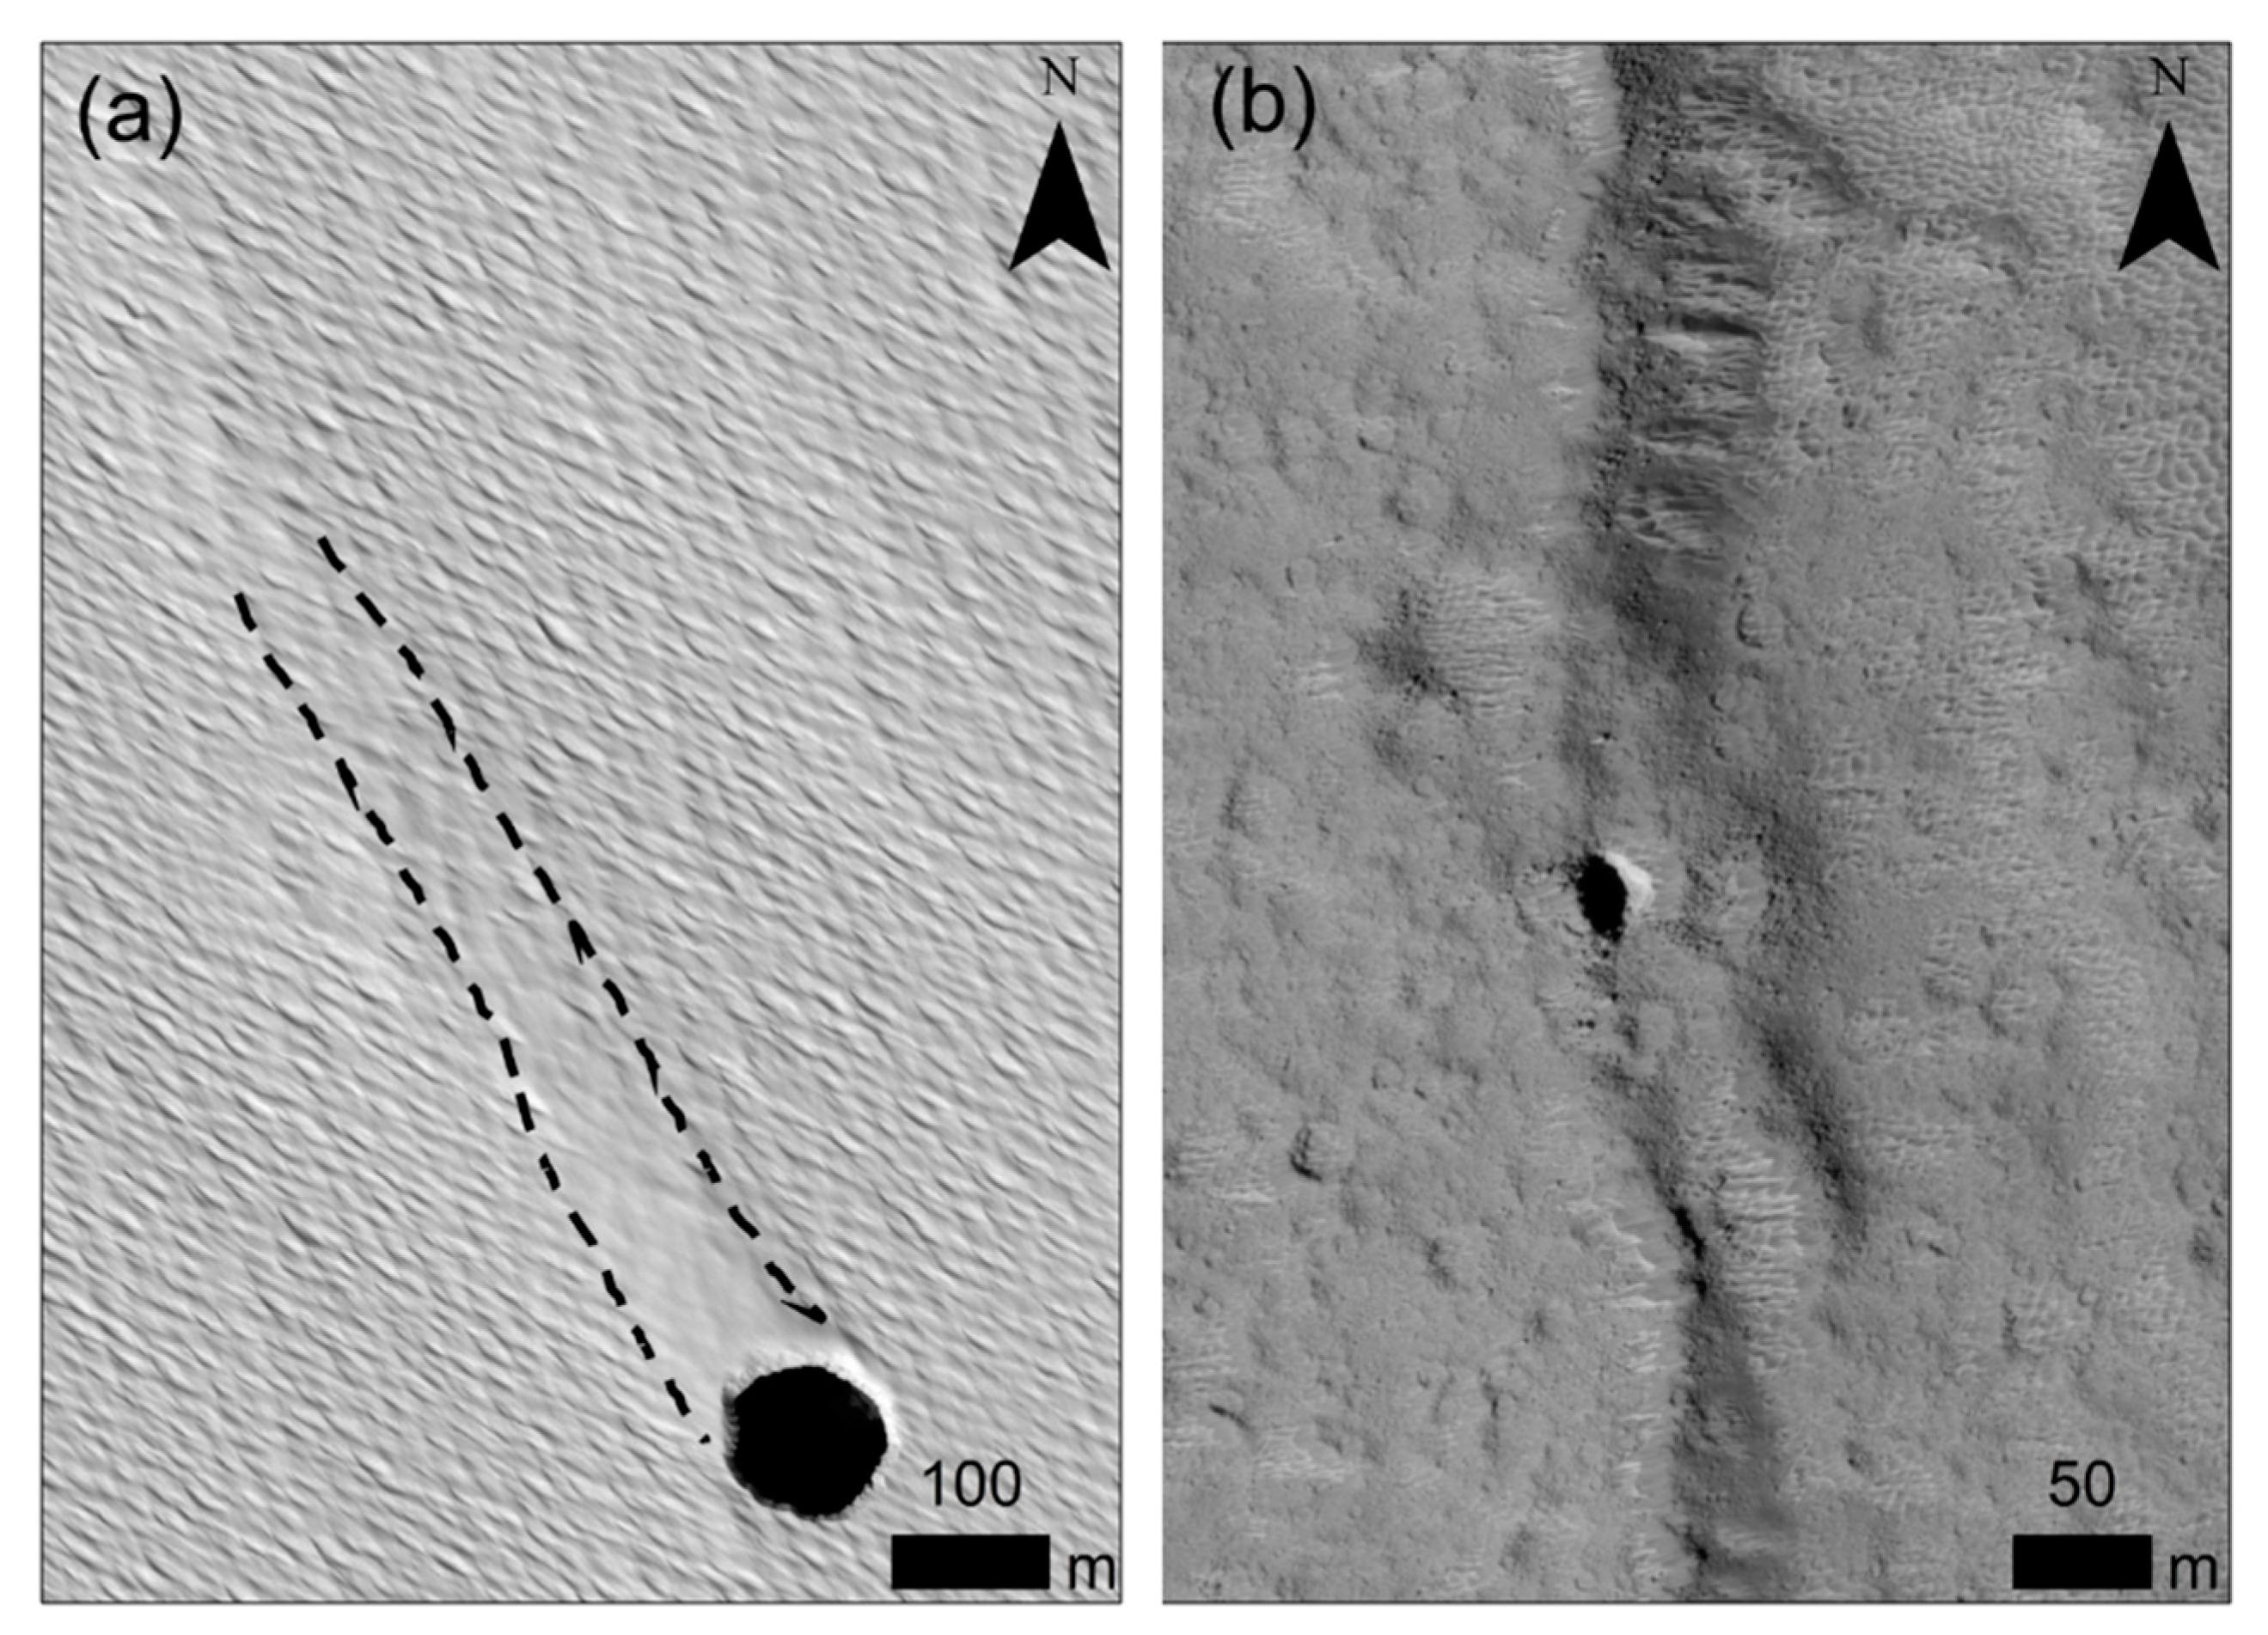
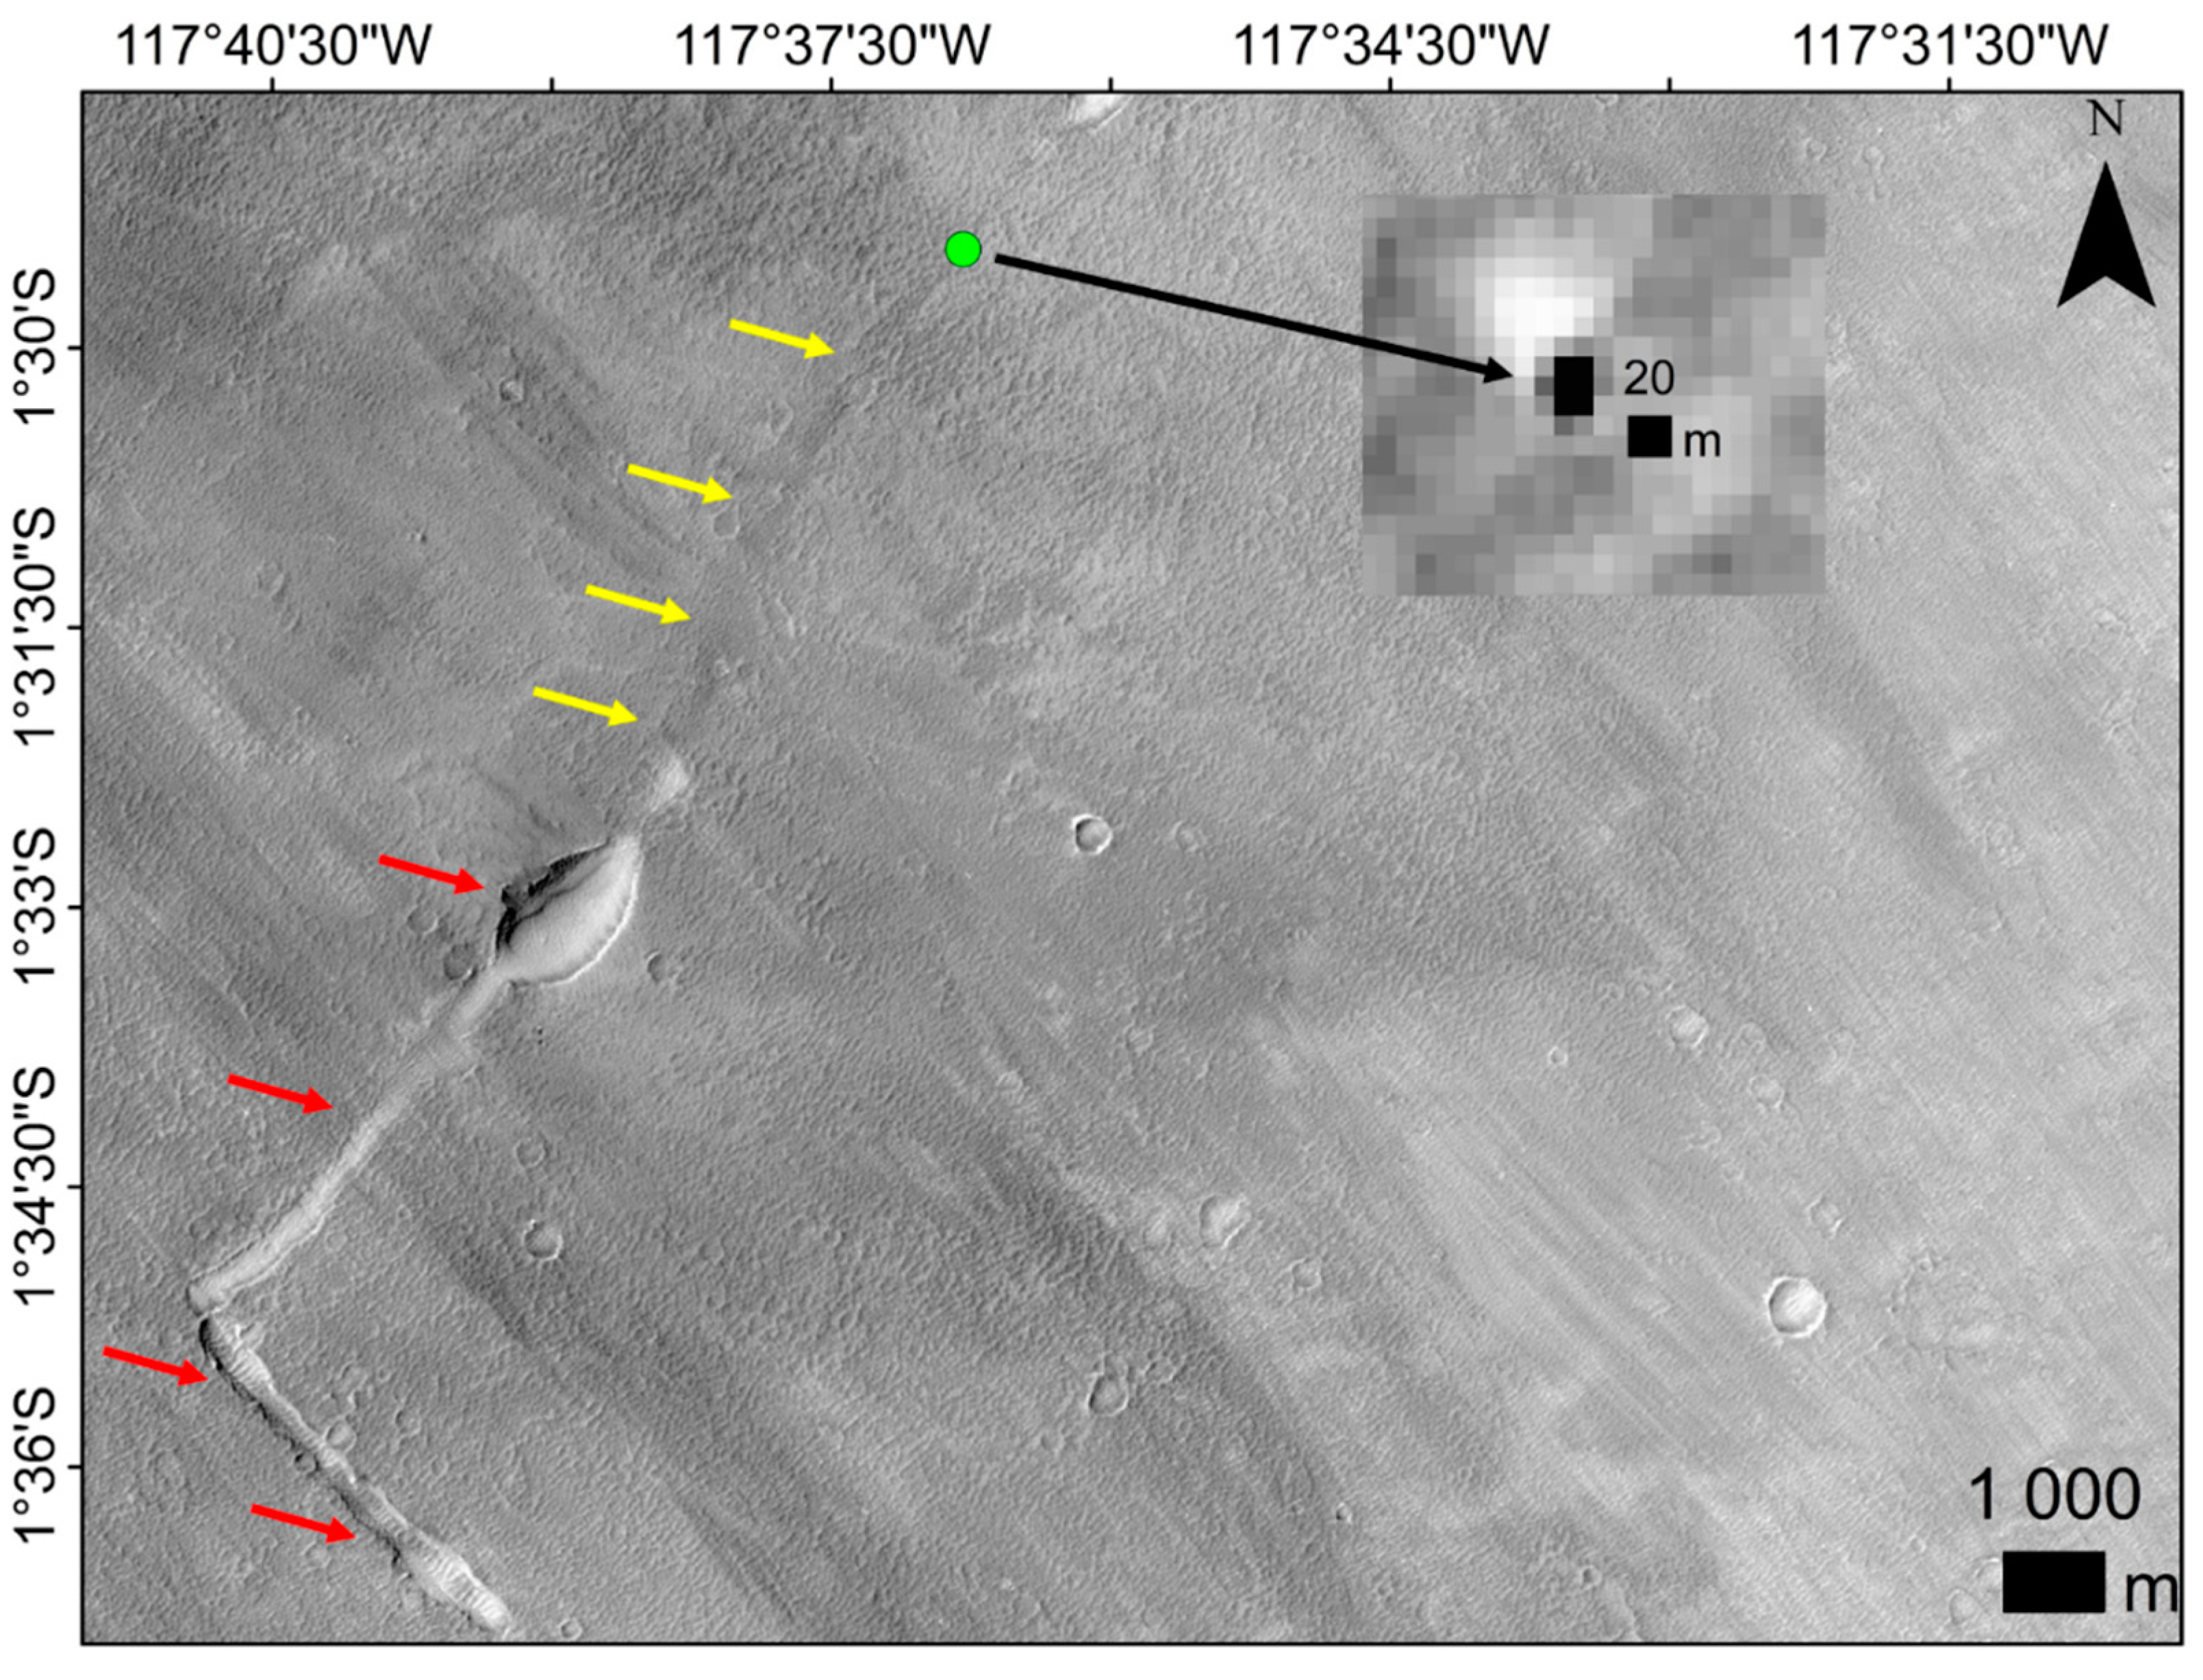
4.3. Possible Analogies with Martian lava flows
5. Conclusions
Author Contributions
Funding
Acknowledgments
Conflicts of Interest
References
- Rummel, J.D.; Beaty, D.W.; Jones, M.A.; Bakermans, C.; Barlow, N.G.; Boston, P.J.; Chevrier, V.F.; Clark, B.C.; de Vera, J.-P.P.; Gough, R.V.; et al. A new analysis of Mars “Special Regions”: Findings of the second MEPAG Special Regions Science Analysis Group (SR-SAG2). Astrobiology 2014, 14, 887–968. [Google Scholar] [CrossRef] [Green Version]
- Sam, L.; Bhardwaj, A.; Singh, S.; Martin-Torres, F.J. UAV Imaging of Small Caves in Icelandic Lava Field as Possible Mars Analogues. In Proceedings of the 3rd International Planetary Caves Conference, San Antonio, TX, USA, 18–21 February 2020. [Google Scholar]
- Martin-Torres, J.; Olsson, P.; Zorzano, M.P.; Bhardwaj, A.; Sam, L.; Singh, S. Martian Caves as Special Region Candidates. In Proceedings of the 3rd International Planetary Caves Conference, San Antonio, TX, USA, 18–21 February 2020. [Google Scholar]
- Boston, P.J.; Spilde, M.N.; Northup, D.E.; Melim, L.A.; Soroka, D.S.; Kleina, L.G.; Lavoie, K.H.; Hose, L.D.; Mallory, L.M.; Dahm, C.N.; et al. Cave Biosignature Suites: Microbes, Minerals, and Mars. Astrobiology 2001, 1, 25–55. [Google Scholar] [CrossRef]
- Léveillé, R.J.; Datta, S. Lava tubes and basaltic caves as astrobiological targets on Earth and Mars: A review. Planet. Space Sci. 2010, 58, 592–598. [Google Scholar] [CrossRef]
- Northup, D.E.; Melim, L.A.; Spilde, M.N.; Hathaway, J.J.M.; Garcia, M.G.; Moya, M.; Stone, F.D.; Boston, P.J.; Dapkevicius, M.L.N.E.; Riquelme, C. Lava cave microbial communities within mats and secondary mineral deposits: Implications for life detection on other planets. Astrobiology 2011, 11, 601–618. [Google Scholar] [CrossRef] [Green Version]
- Popa, R.; Smith, A.R.; Popa, R.; Boone, J.; Fisk, M. Olivine-respiring bacteria isolated from the rock-ice interface in a lava-tube cave, a Mars analog environment. Astrobiology 2012, 12, 9–18. [Google Scholar] [CrossRef] [PubMed]
- Stamenković, V.; Beegle, L.W.; Zacny, K.; Arumugam, D.D.; Baglioni, P.; Barba, N.; Baross, J.; Bell, M.S.; Bhartia, R.; Blank, J.G.; et al. The next frontier for planetary and human exploration. Nat. Astron. 2019, 3, 116–120. [Google Scholar] [CrossRef]
- Boston, P.J.; Frederick, R.D.; Welch, S.M.; Werker, J.; Meyer, T.R.; Sprungman, B.; Hildreth-Werker, V.; Thompson, S.L.; Murphy, D.L. Human utilization of subsurface extraterrestrial environments. Gravit. Space Biol. Bull. 2003, 16, 121–131. [Google Scholar] [PubMed]
- Horz, F. Lava Tubes—Potential Shelters for Habitats; Lunar bases and space activities of the 21st century; Lunar and Planetary Institute: Houston, TX, USA, 1985. [Google Scholar]
- Frederick, R.D.; Billings, T.L.; McGown, R.D.; Walden, B.E. Martian Ice Caves; Workshop on Concepts and Approaches for Mars Exploration, 18–20 July 2000; Lunar and Planetary Institute: Houston, TX, USA, 2000; Abstract number 6062; pp. 114–115. [Google Scholar]
- Williams, K.E.; McKay, C.P.; Toon, O.B.; Head, J.W. Do ice caves exist on Mars? Icarus 2010, 209, 358–368. [Google Scholar] [CrossRef] [Green Version]
- Daga, A.W.; Battler, M.M.; Burke, J.D.; Crawford, I.A.; Léveillé, R.J.; Simon, S.B.; Tan, L.T. Lunar and Martian Lava Tube Exploration as Part of an Overall Scientific Survey. In Proceedings of the NASA Solar System Exploration, Annual Meeting of the Lunar Exploration Analysis Group, Houston, TX, USA, 16–19 November 2009. [Google Scholar]
- Common Questions about InSight’s “Mole”. Available online: https://mars.nasa.gov/news/8444/common-questions-about-insights-mole?site=insight (accessed on 5 July 2019).
- Wasilewski, T.G. Evaluation of drilling-based water extraction methods for Martian ISRU from mid-latitude ice resources. Planet. Space Sci. 2018, 158, 16–24. [Google Scholar] [CrossRef]
- Cave Skylights Spotted on Mars|Science Mission Directorate. Available online: https://science.nasa.gov/science-news/science-at-nasa/2007/21sep_caves (accessed on 5 July 2019).
- Caves Spotted on Mars. Available online: http://www.nature.com/articles/news070312-11 (accessed on 5 July 2019).
- Gadányi, P. Caves Under Uplifted Surface Crusts of Basalt Lava Flows. In Proceedings of the 10th International Symposium on Pseudokarst, Gorizia, Italy, 29 April–2 May 2008; pp. 119–126. [Google Scholar]
- Calvari, S.; Pinkerton, H. Formation of lava tubes and extensive flow field during the 1991–1993 eruption of Mount Etna. J. Geophys. Res. Solid Earth 1998, 103, 27291–27301. [Google Scholar] [CrossRef]
- Calvari, S.; Pinkerton, H. Lava tube morphology on Etna and evidence for lava flow emplacement mechanisms. J. Volcanol. Geotherm. Res. 1999, 90, 263–280. [Google Scholar] [CrossRef]
- Duncan, A.M.; Guest, J.E.; Stofan, E.R.; Anderson, S.W.; Pinkerton, H.; Calvari, S. Development of tumuli in the medial portion of the 1983 aa flow-field, Mount Etna, Sicily. J. Volcanol. Geotherm. Res. 2004, 132, 173–187. [Google Scholar] [CrossRef]
- Favalli, M.; Fornaciai, A.; Nannipieri, L.; Harris, A.; Calvari, S.; Lormand, C. UAV-based remote sensing surveys of lava flow fields: A case study from Etna’s 1974 channel-fed lava flows. Bull. Volcanol. 2018, 80, 29. [Google Scholar] [CrossRef]
- Hon, K.; Kauahikaua, J.; Denlinger, R.; Mackay, K. Emplacement and inflation of pahoehoe sheet flows: Observations and measurements of active lava flows on Kilauea Volcano, Hawaii. Geol Soc Am Bull. 1994, 106, 351–370. [Google Scholar] [CrossRef]
- Peterson, D.W.; Holcomb, R.T.; Tilling, R.I.; Christiansen, R.L. Development of lava tubes in the light of observations at Mauna Ulu, Kilauea Volcano, Hawaii. Bull. Volcanol. 1994, 56, 343–360. [Google Scholar] [CrossRef]
- Kauahikaua, J.; Cashman, K.V.; Mattox, T.N.; Heliker, C.C.; Hon, K.A.; Mangan, M.T.; Thornber, C.R. Observations on basaltic lava streams in tubes from Kilauea Volcano, island of Hawai’i. J. Geophys. Res. Solid Earth 1998, 103, 27303–27323. [Google Scholar] [CrossRef]
- Orr, T.R.; Bleacher, J.E.; Patrick, M.R.; Wooten, K.M. A sinuous tumulus over an active lava tube at Kīlauea Volcano: Evolution, analogs, and hazard forecasts. J. Volcanol. Geotherm. Res. 2015, 291, 35–48. [Google Scholar] [CrossRef]
- Mclaughlin, D.B. Volcanism and aeolian deposition on Mars. Gsa Bull. 1954, 65, 715–718. [Google Scholar] [CrossRef]
- McLaughlin, D.B. The volcanic-aeolian hypothesis of Martian features. Publ. Astron. Soc. Pac. 1956, 68, 211–218. [Google Scholar] [CrossRef]
- Edgett, K.S.; Lancaster, N. Volcaniclastic aeolian dunes: Terrestrial examples and application to Martian sands. J. Arid Environ. 1993, 25, 271–297. [Google Scholar] [CrossRef]
- Edgett, K.S. Aeolian dunes as evidence for explosive volcanism in the Tharsis region of Mars. Icarus 1997, 130, 96–114. [Google Scholar] [CrossRef]
- Arnalds, O.; Dagsson-Waldhauserova, P.; Olafsson, H. The Icelandic volcanic aeolian environment: Processes and impacts—A review. Aeolian Res. 2016, 20, 176–195. [Google Scholar] [CrossRef] [Green Version]
- Gadányi, P. Formation, Types and Morphology of Basalt Lava Caves. Ph.D. Thesis, University of Pécs, Faculty of Natural Sciences Doctoral School of Earth Sciences, Pécs, Hungary, 2010. [Google Scholar]
- Hróarsson, B.; Jónsson, S.S. Lava Caves in the Hallmundarhraun Lava Flow, Western Iceland. In Proceedings of the 6th International Symposium on Vulcanospeleology, Hilo, HI, USA, 5–9 August 1991; pp. 85–88. [Google Scholar]
- Rossi, M.J. Morphology of the 1984 open-channel lava flow at Krafla volcano, northern Iceland. Geomorphology 1997, 20, 95–112. [Google Scholar] [CrossRef]
- Bhardwaj, A.; Sam, L.; Akanksha; Martín-Torres, F.J.; Kumar, R. UAVs as remote sensing platform in glaciology: Present applications and future prospects. Remote Sens. Environ. 2016, 175, 196–204. [Google Scholar] [CrossRef]
- Gaffey, C.; Bhardwaj, A. Applications of Unmanned Aerial Vehicles in Cryosphere: Latest Advances and Prospects. Remote Sens. 2020, 12, 948. [Google Scholar] [CrossRef] [Green Version]
- Mars Helicopter to Fly on NASA’s Next Red Planet Rover Mission. Available online: http://www.nasa.gov/press-release/mars-helicopter-to-fly-on-nasa-s-next-red-planet-rover-mission (accessed on 5 July 2019).
- Nakano, T.; Kamiya, I.; Tobita, M.; Iwahashi, J.; Nakajima, H. Landform monitoring in active volcano by UAV and SfM-MVS technique. ISPRS Int. Arch. Photogramm. Remote Sens. Spat. Inf. Sci. 2014, XL–8, 71–75. [Google Scholar] [CrossRef] [Green Version]
- Turner, N.R.; Perroy, R.L.; Hon, K. Lava flow hazard prediction and monitoring with UAS: A case study from the 2014–2015 Pāhoa lava flow crisis, Hawai’i. J. Appl. Volcanol. 2017, 6, 17. [Google Scholar] [CrossRef] [Green Version]
- Brož, P.; Krýza, O.; Wilson, L.; Conway, S.J.; Hauber, E.; Mazzini, A.; Raack, J.; Balme, M.R.; Sylvest, M.E.; Patel, M.R. Experimental evidence for lava-like mud flows under Martian surface conditions. Nat. Geosci. 2020. [Google Scholar] [CrossRef]
- Hjartardóttir, Á.R.; Einarsson, P.; Bramham, E.; Wright, T.J. The Krafla fissure swarm, Iceland, and its formation by rifting events. Bull. Volcanol. 2012, 74, 2139–2153. [Google Scholar] [CrossRef]
- Aufaristama, M.; Höskuldsson, A.; Jónsdóttir, I.; Ólafsdóttir, R. Mapping and Assessing Surface Morphology of Holocene Lava Field in Krafla (NE Iceland) Using Hyperspectral Remote Sensing. In Proceedings of the IOP Conference Series: Earth and Environmental Science; IOP Publishing Ltd.: Bristol, UK, 2016; Volume 29, p. 012002. [Google Scholar] [CrossRef] [Green Version]
- Bhardwaj, A.; Sam, L.; Martín-Torres, F.J.; Zorzano, M.-P.; Ramírez Luque, J.A. UAV imaging of a Martian brine analogue environment in a fluvio-aeolian setting. Remote Sens. 2019, 11, 2104. [Google Scholar] [CrossRef] [Green Version]
- Ullman, S. The interpretation of structure from motion. Proc. R. Soc. Lond. B Biol. Sci. 1979, 203, 405–426. [Google Scholar] [CrossRef]
- Manfreda, S.; Dvorak, P.; Mullerova, J.; Herban, S.; Vuono, P.; Arranz Justel, J.J.; Perks, M. Assessing the accuracy of Digital Surface Models derived from optical imagery acquired with Unmanned Aerial Systems. Drones 2019, 3, 15. [Google Scholar] [CrossRef] [Green Version]
- James, M.R.; Robson, S. Mitigating systematic error in topographic models derived from UAV and ground-based image networks. Earth Surf. Process. Landf. 2014, 39, 1413–1420. [Google Scholar] [CrossRef] [Green Version]
- Wackrow, R.; Chandler, J.H. Minimising systematic error surfaces in digital elevation models using oblique convergent imagery. Photogramm. Rec. 2011, 26, 16–31. [Google Scholar] [CrossRef] [Green Version]
- Sona, G.; Pinto, L.; Pagliari, D.; Passoni, D.; Gini, R. Experimental analysis of different software packages for orientation and digital surface modelling from UAV images. Earth Sci. Inf. 2014, 7, 97–107. [Google Scholar] [CrossRef]
- Burns, J.H.R.; Delparte, D.; Gates, R.D.; Takabayashi, M. Integrating structure-from-motion photogrammetry with geospatial software as a novel technique for quantifying 3D ecological characteristics of coral reefs. Peer J. 2015, 3, e1077. [Google Scholar] [CrossRef]
- Iizuka, K.; Itoh, M.; Shiodera, S.; Matsubara, T.; Dohar, M.; Watanabe, K. Advantages of unmanned aerial vehicle (UAV) photogrammetry for landscape analysis compared with satellite data: A case study of postmining sites in Indonesia. Cogent Geosci. 2018, 4, 1498180. [Google Scholar] [CrossRef]
- Kersten, T.P.; Lindstaedt, M. Image-Based Low-Cost Systems for Automatic 3D Recording and Modelling of Archaeological Finds and Objects. In Proceedings of the Progress in Cultural Heritage Preservation; Ioannides, M., Fritsch, D., Leissner, J., Davies, R., Remondino, F., Caffo, R., Eds.; Springer: Berlin/Heidelberg, Germany, 2012; pp. 1–10. [Google Scholar]
- Themistocleous, K.; Ioannides, M.; Agapiou, A.; Hadjimitsis, D.G. The Methodology of Documenting Cultural Heritage Sites Using Photogrammetry, UAV, and 3D Printing Techniques: The Case Study of Asinou Church in Cyprus. In Proceedings of the Third International Conference on Remote Sensing and Geoinformation of the Environment (RSCy2015); International Society for Optics and Photonics: Paphos, Cyprus, 2015; Volume 9535, p. 953510. [Google Scholar] [CrossRef]
- Verhoeven, G. Taking computer vision aloft—archaeological three-dimensional reconstructions from aerial photographs with photoscan. Archaeol. Prospect. 2011, 18, 67–73. [Google Scholar] [CrossRef]
- Furukawa, Y.; Ponce, J. Accurate Camera Calibration from Multi-View Stereo and Bundle Adjustment. Int. J. Comput. Vis. 2009, 84, 257–268. [Google Scholar] [CrossRef]
- Dirscherl, M.; Rossi, C. Geomorphometric analysis of the 2014–2015 Bárðarbunga volcanic eruption, Iceland. Remote Sens. Environ. 2018, 204, 244–259. [Google Scholar] [CrossRef]
- Bhardwaj, A.; Sam, L.; Martín-Torres, F.J.; Zorzano, M.-P.; Fonseca, R.M. Martian slope streaks as plausible indicators of transient water activity. Sci. Rep. 2017, 7, 7074. [Google Scholar] [CrossRef] [Green Version]
- Sam, L.; Bhardwaj, A.; Singh, S.; Kumar, R. Remote sensing flow velocity of debris-covered glaciers using Landsat 8 data. Prog. Phys. Geogr. Earth Environ. 2016, 40, 305–321. [Google Scholar] [CrossRef]
- Sam, L.; Bhardwaj, A.; Kumar, R.; Buchroithner, M.F.; Martín-Torres, F.J. Heterogeneity in topographic control on velocities of Western Himalayan glaciers. Sci. Rep. 2018, 8, 12843. [Google Scholar] [CrossRef] [PubMed] [Green Version]
- Singh, M.K.; Snehmani; Gupta, R.D.; Bhardwaj, A.; Joshi, P.K.; Ganju, A. High resolution DEM generation for complex snow covered Indian Himalayan Region using ADS80 aerial push-broom camera: A first time attempt. Arab. J. Geosci. 2015, 8, 1403–1414. [Google Scholar] [CrossRef]
- Singh, M.K.; Gupta, R.D.; Snehmani; Bhardwaj, A.; Ganju, A. Scenario-based validation of moderate resolution DEMs freely available for complex Himalayan terrain. Pure Appl. Geophys. 2016, 173, 463–485. [Google Scholar] [CrossRef]
- Snehmani; Bhardwaj, A.; Pandit, A.; Ganju, A. Demarcation of potential avalanche sites using remote sensing and ground observations: A case study of Gangotri glacier. Geocarto Int. 2014, 29, 520–535. [Google Scholar] [CrossRef]
- Burrough, P.A.; McDonnell, R.A.; Lloyd, C.D. Principles of Geographical Information Systems, 3rd ed.; OUP: Oxford, UK, 2015; ISBN 978-0-19-874284-5. [Google Scholar]
- Wilson, M.F.J.; O’Connell, B.; Brown, C.; Guinan, J.C.; Grehan, A.J. Multiscale Terrain Analysis of Multibeam Bathymetry Data for Habitat Mapping on the Continental Slope. Mar. Geod. 2007, 30, 3–35. [Google Scholar] [CrossRef] [Green Version]
- De Smith, M.J.; Goodchild, M.F.; Longley, P. Geospatial Analysis: A Comprehensive Guide to Principles, Techniques and Software Tools; Troubador Publishing Ltd.: Leicester, UK, 2007; ISBN 978-1-905886-60-9. [Google Scholar]
- Hong, I.-S.; Yi, Y.; Kim, E. Lunar pit craters presumed to be the entrances of lava caves by analogy to the Earth lava tube pits. J. Astron. Space Sci. 2014, 31, 131–140. [Google Scholar] [CrossRef] [Green Version]
- Skinner, C.E. Open Vertical Volcanic Conduits: A Preliminary Investigation of an Unusual Volcanic Cave form with Examples from Newberry Volcano and the Central High Cascades of Oregon. In Proceedings of the Third International Symposium on Vulcanospeleology, Bend, OR, USA, 30 July–1 August 1982; pp. 7–17. [Google Scholar]
- Fraedrich, W.; Heidari, N. Iceland from the West to the South; GeoGuide; Springer International Publishing: Cham, Switzerland, 2019; ISBN 978-3-319-90862-5. [Google Scholar]
- Porter, C.; Morin, P.; Howat, I.; Noh, M.-J.; Bates, B.; Peterman, K.; Keesey, S.; Schlenk, M.; Gardiner, J.; Tomko, K.; et al. ArcticDEM 2018. Harvard Dataverse, V1 Type: Dataset. Available online: https://dataverse.harvard.edu/dataset.xhtml?persistentId=doi:10.7910/DVN/OHHUKH (accessed on 14 May 2020).
- National Land Survey of Iceland web portal. Available online: http://atlas.lmi.is/mapview/?application=DEM (accessed on 4 June 2020).
- ÍslandsDEM Útgáfa 0, Lýsigagnagátt. Available online: https://gatt.lmi.is/geonetwork/srv/eng/catalog.search#/metadata/e6712430-a63c-4ae5-9158-c89d16da6361 (accessed on 4 June 2020).
- Müller, D.; Walter, T.R.; Schöpa, A.; Witt, T.; Steinke, B.; Gudmundsson, M.T.; Dürig, T. High-resolution Digital Elevation Modeling from TLS and UAV campaign reveals structural complexity at the 2014/2015 Holuhraun eruption site, Iceland. Front. Earth Sci. 2017, 5. [Google Scholar] [CrossRef] [Green Version]
- Swanson, D.A. Pahoehoe flows from the 1969–1971 Mauna Ulu eruption, Kilauea volcano, Hawaii. Gsa Bull. 1973, 84, 615–626. [Google Scholar] [CrossRef]
- Kilburn, C.R.J. Lava Flows and Flow Fields. In Encyclopedia of Volcanoes; Academic Press: San Diego, CA, USA, 2000; pp. 291–305. [Google Scholar]
- Murcia, H.; Németh, K.; Moufti, M.R.; Lindsay, J.M.; El-Masry, N.; Cronin, S.J.; Qaddah, A.; Smith, I.E.M. Late Holocene lava flow morphotypes of northern Harrat Rahat, Kingdom of Saudi Arabia: Implications for the description of continental lava fields. J. Asian Earth Sci. 2014, 84, 131–145. [Google Scholar] [CrossRef]
- Hon, K.; Johnson, J.; Gansecki, C.A. Field Interpretation of Active Volcanoes: A Handbook for Viewing Lava; Reveira, T., Ed.; Hawaii U.S: Geological Survey Hawaiian Volcano Observatory: Hilo, Hawaii, 2008. [Google Scholar]
- Pedersen, G.B.M.; Höskuldsson, A.; Riishuus, M.S.; Jónsdóttir, I.; Gudmundsson, M.T.; Sigmundsson, F.; Óskarsson, B.V.; Drouin, V.; Gallagher, C.; Askew, R.; et al. Nornahraun Lava Morphology and Mode of Emplacement. In Proceedings of the EGU General Assembly Conference, Vienna, Austria, 12–17 April 2015; Volume 17, p. 11958. [Google Scholar]
- Rowland, S.K.; Walker, G.P.L. Toothpaste lava: Characteristics and origin of a lava structural type transitional between pahoehoe and aa. Bull. Volcanol. 1987, 49, 631–641. [Google Scholar] [CrossRef]
- Walker, G.P.L. Structure, and origin by injection of lava under surface crust, of tumuli, “lava rises”, “lava-rise pits”, and “lava-inflation clefts” in Hawaii. Bull. Volcanol. 1991, 53, 546–558. [Google Scholar] [CrossRef]
- Kempe, S. Chapter 131—Volcanic Rock Caves. In Encyclopedia of Caves, 3rd ed.; White, W.B., Culver, D.C., Pipan, T., Eds.; Academic Press: Cambridge, MA, USA, 2019; ISBN 978-0-12-814124-3. [Google Scholar]
- Kempe, S. Principles of Pyroduct (Lava Tunnel) Formation. In Proceedings of the 15th International Congress of Speleology, Kerrville, TX, USA, 19–26 July 2009. [Google Scholar]
- Opheim, J.A.; Gudmundsson, A. Formation and geometry of fractures, and related volcanism, of the Krafla fissure swarm, northeast Iceland. Gsa Bull. 1989, 101, 1608–1622. [Google Scholar] [CrossRef]
- Crown, D.A.; Ramsey, M.S. Morphologic and thermophysical characteristics of lava flows southwest of Arsia Mons, Mars. J. Volcanol. Geotherm. Res. 2017, 342, 13–28. [Google Scholar] [CrossRef] [Green Version]
- Cushing, G.E.; Okubo, C.H.; Titus, T.N. Atypical pit craters on Mars: New insights from THEMIS, CTX, and HiRISE observations. J. Geophys. Res. Planets 2015, 120, 1023–1043. [Google Scholar] [CrossRef]
- Mars Global Cave Candidate Catalog—ScienceBase-Catalog. Available online: https://www.sciencebase.gov/catalog/item/5bd36eb1e4b0b3fc5ce51783 (accessed on 6 June 2020).
- Cushing, G. Candidate cave entrances on Mars. J. Cave Karst Stud. 2012, 74, 33–47. [Google Scholar] [CrossRef]
- A Volcanic Fissure. Available online: http://www.nasa.gov/image-feature/jpl/pia21601/a-volcanic-fissure (accessed on 1 June 2020).
- Wilson, L.; Mouginis-Mark, P.J.; Tyson, S.; Mackown, J.; Garbeil, H. Fissure eruptions in Tharsis, Mars: Implications for eruption conditions and magma sources. J. Volcanol. Geotherm. Res. 2009, 185, 28–46. [Google Scholar] [CrossRef]
- Wynne, J.J.; Titus, T.N.; Chong Diaz, G. On developing thermal cave detection techniques for earth, the moon and mars. Earth Planet. Sci. Lett. 2008, 272, 240–250. [Google Scholar] [CrossRef]


| Parameter | Value |
|---|---|
| Flight altitude | 70 m |
| Flight plan | Double grid |
| Battery used/flight | 1 |
| Side overlap | 80% |
| Front overlap | 85% |
| Camera Angle (from vertical) | 0°, 20° |
| Total flight time/flight | ~16 min |
| Total area captured | ~334,000 m2 |
| Total images captured | 990 |
| Lava Morphology | Description | Mean Slope (°) | Mean Roughness (mm) | Field Photo | Reference |
|---|---|---|---|---|---|
| 1. Pahoehoe lava | |||||
| Shelly pahoehoe | Characterized by fragile gas cavities, small tubes, and buckled fragments of the surface crust. Lobes often form the margin of the sheet flow. | 23.95 | 24.93 | 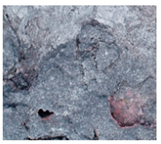 | [34,72] |
| Slabby pahoehoe | Slabs of broken crust, usually less than a meter to few meters across. Formed when the pahoehoe crust is tilted and stretched during flow. | 15.55 | 15.32 |  | [73,74] |
| Spiny pahoehoe | Flexible crusts ruck into tight folds before cooling. The smooth glassy surface is the result of its formation under very low strain rates, when the lava is extremely crystalline and viscous. Surface resembles segment of coiled rope. | 15.50 | 13.99 |  | [75,76,77] |
| 2. Aa lava | |||||
| Cauliflower aa | Appears as bulbous protrusions on the lava surface which breaks to give fragments up to decimeters across. Grey-black, often glassy surfaces rough at millimeter-scale. This is an initial aa lava type in the transformation from pahoehoe to rubbly aa. | 26.31 | 30.04 |  | [34,73] |
| Rubbly aa | Formed as the crust breaks to yield rounded rubble varying in dimensions from sand to blocks several meters in diameter. Have accumulated fragments, with a clinkery and blocky surface. | 24.97 | 27.42 | 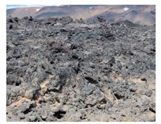 | [34,74] |
| Elevation Class | Elevation Range (m) | Area (km2) | Number of Caves | Mean Area of Cave Openings (m2) | Lava Morphology |
|---|---|---|---|---|---|
| High | 563.92–577.45 | 0.03 | 27 | 1.06 | Shelly pahoehoe, Cauliflower aa |
| Medium | 558.26–563.92 | 0.17 | 48 | 1.35 | Shelly pahoehoe, Spiny pahoehoe |
| Low | 553.81–558.26 | 0.13 | 6 | 0.45 | Slabby pahoehoe, Shelly pahoehoe, Rubbly aa |
| Total = 81 |
| Type | Description | Sketch | Reference |
|---|---|---|---|
| Open vertical conduit | These structures have oval or round shaped vertical passageways and are found in recent volcanic rocks, where lava rose to the surface and then waned. The openings are typically marked by a rootless small spatter cone called hornito. | 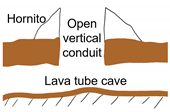 | [18,66] |
| Collapsed lava tunnel (Skylights) | Skylights are openings where the roof of the lava tube has collapsed. In an active flow, these skylights allow convective cooling of the lava. |  | [79,80] |
| Lava rise cave | Lava rise caves are formed as a result of inflation due to fluid lava accumulating under the solidified surface crust. Once the lava drains leaving a deflated center, if the uplifted surface crust can support itself, a flat cave remains under it. | 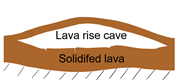 | [18] |
| Hidden or tumulus cave | Tumulus lava caves are formed when during volcanic activity below the arching surface crust, liquid lava is injected causing the surface crust to bulge as it solidifies without any horizontal shortening. Once the lava drains, the unstable section of the crust collapses revealing the tumulus cave. |  | [18] |
| Surface fractures | The observed small surface fractures are deep open cracks that are formed due to tensile stress in lava during and after solidification. | 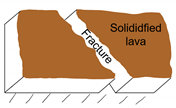 | [71,81] |
© 2020 by the authors. Licensee MDPI, Basel, Switzerland. This article is an open access article distributed under the terms and conditions of the Creative Commons Attribution (CC BY) license (http://creativecommons.org/licenses/by/4.0/).
Share and Cite
Sam, L.; Bhardwaj, A.; Singh, S.; Martin-Torres, F.J.; Zorzano, M.-P.; Ramírez Luque, J.A. Small Lava Caves as Possible Exploratory Targets on Mars: Analogies Drawn from UAV Imaging of an Icelandic Lava Field. Remote Sens. 2020, 12, 1970. https://doi.org/10.3390/rs12121970
Sam L, Bhardwaj A, Singh S, Martin-Torres FJ, Zorzano M-P, Ramírez Luque JA. Small Lava Caves as Possible Exploratory Targets on Mars: Analogies Drawn from UAV Imaging of an Icelandic Lava Field. Remote Sensing. 2020; 12(12):1970. https://doi.org/10.3390/rs12121970
Chicago/Turabian StyleSam, Lydia, Anshuman Bhardwaj, Shaktiman Singh, F. Javier Martin-Torres, Maria-Paz Zorzano, and Juan Antonio Ramírez Luque. 2020. "Small Lava Caves as Possible Exploratory Targets on Mars: Analogies Drawn from UAV Imaging of an Icelandic Lava Field" Remote Sensing 12, no. 12: 1970. https://doi.org/10.3390/rs12121970