Automatic Estimation of Crop Disease Severity Levels Based on Vegetation Index Normalization


1
College of Geoscience and Surveying Engineering, China University of Mining and Technology, Beijing 100083, China
2
State Key Laboratory of Coal Resources and Safe Mining, China University of Mining and Technology, Beijing 100083, China
3
United States Department of Agriculture-Agricultural Research Service, Aerial Application Technology Research Unit, College Station, TX 77845, USA
4
Anhui Engineering Laboratory of Agro-Ecological Big Data, Anhui University, Hefei 230601, Anhui, China
5
College of Information and Management Science, Henan Agricultural University, Zhengzhou 450002, Henan, China
6
Key Laboratory of Oasis Eco Agriculture, Xinjiang Production and Construction Group, Shihezi University, Shihezi 832003, Xinjiang, China
7
Institute of Remote Sensing and Digital Earth, Chinese Academy of Sciences, Beijing 100101, China
*
Author to whom correspondence should be addressed.
Remote Sens. 2020, 12(12), 1930; https://doi.org/10.3390/rs12121930
Submission received: 4 May 2020
/
Revised: 10 June 2020
/
Accepted: 12 June 2020
/
Published: 15 June 2020
(This article belongs to the Section Remote Sensing in Agriculture and Vegetation)
Abstract
:The timely monitoring of crop disease development is very important for precision agriculture applications. Remote sensing-based vegetation indices (VIs) can be good indicators of crop disease severity, but current methods are mainly dependent on manual ground survey results. Based on VI normalization, an automated crop disease severity grading method without the use of ground surveys was proposed in this study. This technique was applied to two cotton fields infested with different levels of cotton root rot in south Texas in the United States, where airborne hyperspectral imagery was collected. Six typical VIs were calculated from the hyperspectral imagery and their histograms indicated that VI normalization could eliminate the influences of variable field conditions and the VI value range variations, allowing a potentially broader scope of application. According to the analysis of the obtained results from the spectral dimension, spatial dimension and descriptive statistics, the disease grading results were in general agreement with previous ground survey results, proving the validity of the disease severity grading method. Although satisfactory results could be achieved from different types of VI, there is still room for further improvement through the exploration of more VIs. With the advantages of independence of ground surveys and potential universal applicability, the newly proposed crop disease grading method will be of great significance for crop disease monitoring over large geographical areas.
1. Introduction
Crop disease infection is one of the main variables undermining the profitability and sustainability of farming operations, so monitoring plant health conditions on a timely basis is important for effective agricultural field management [1]. For example, cotton as a significant crop is exceptionally susceptible to cotton root rot, a destructive soil-borne disease caused by the fungus Phymatotrichopsis omnivora. This disease happens all over the southwestern and south-central US. Infected plants show early symptoms with the leaves turning yellow and orange and then changing to dark brown before the plants die with dry leaves attached to them [2]. It is practically important to acquire timely cotton disease occurrence data over large areas so that preventive measures can be taken to improve cotton yield and quality [3].
Remote sensing makes it conceivable to screen crop disease quickly on a large scale, which has the advantages of being timely, easy to use, extensive, nondestructive, and objective [3]. Remote sensing has been utilized to recognize, screen and evaluate an assortment of diseases in various crops. Comprehensive reviews on the use of remote sensing for the detection of plant diseases are available [4]. Among different types of remote sensing techniques, hyperspectral remote sensing is one of the most effective approaches to discern features that are difficult to detect in the spectrum, due to its high spectral resolution [5]. Hyperspectral technology is broadly and effectively applied to monitor various types of stresses to crops [6,7].
Remote sensing has been effectively used to map disease occurrences in cotton fields [8]. In previous studies, Iterative Self-Organizing Data Analysis (ISODATA) unsupervised classification applied to multispectral image data has been utilized to recognize root rot infested areas [9]. With this strategy, the optimal number of spectral classes was determined based on the average transformed divergence for every classification map and the classes were then assigned to either root rot infested or non-infested zones [10]. Although supervised techniques had similar performance for mapping cotton root rot, the two unsupervised strategies, ISODATA applied to multispectral imagery or to normalized difference vegetation index (NDVI) imagery, were recommended because they are easy to operate [9].
The proper characterization and evaluation of disease dissemination and seriousness in near-real-time could give valuable information for decision-making with respect to the application of fungicide to the right location with the right amount at the right time in precision agriculture [11]. Traditionally, the most common strategy for disease identification has been visual surveys by experienced producers who can recognize subtle changes in plant color or curl of plant leaves and scout the area of disease infestation in the field [1,12]. This type of ground investigation is time-consuming and labor-intensive, and it is also difficult to precisely estimate the infested areas and seriousness over a wide range [13].
Based on remote sensing data, many forms of VIs have been used for crop disease detection, and empirical statistical models between VIs and disease severity levels can be established using discriminant analysis, linear regression analysis, support vector machine (SVM), and other statistical methods [5,14,15]. However, most studies have used field leaf or canopy spectra for model building, but not much effort has been taken to monitor disease severity on landscape levels [16]. Besides, empirical modeling still relies on manual field observation, and the accuracy may vary in different fields due to the influence of crop variety, sowing time, field conditions and so on, making it difficult to be applied in large-scale analysis [17].
Vegetation indices (VIs) enable the evaluation and observation of changes in canopy biophysical properties, such as leaf area index (LAI), chlorophyll content, and photosynthetically active radiation (PAR) [18]. It has been revealed that crop disease can severely influence the biophysical property values, which can explain why the severity level is significantly correlated to crop VI values [19,20]. However, there has not been any study that directly uses VIs to perform disease severity leveling without ground investigation. In addition, the value ranges of VIs and the crop growth conditions can vary greatly from field to field. Therefore, there is a high probability that the correlation between VI values and crop disease severity levels is not always significant, considering the above factors. Normalization, as a simple and effective data-processing method, has been utilized to eliminate the background differences for reflectance spectra [21], and has also been a basic mode in the construction of VIs. However, it has not been applied to eliminate the interferences of field management and VI value ranges.
In this research, based on VI normalization, a novel model for automatic crop disease severity estimation was proposed (Section 2). Airborne images of two fields with varying levels of cotton root rot and six typical VIs related to biomass, PAR, LAI, and chlorophyll contents were selected to conduct disease severity estimations using the newly proposed model (Section 2 and Section 3), and the validity of the results were evaluated from various perspectives (Section 3 and Section 4).
2. Materials and Methods
2.1. Study Area
The study area was located in a cropping region close to Edroy, Texas, USA (Figure 1a). Two fields (Field A and Field B) with different levels of cotton root rot were selected as the experimental areas in this research (Figure 1b). The root rot-infested area in Field A was relatively small, while Field B had a much more serious disease condition. The field boundaries were digitized on the PC screen utilizing the editor tools of ArcGIS10.3 (Esri, Redlands, CA, USA). The areas for the two fields were 63.95 ha and 58.28 ha separately.
2.2. Image Acquisition and Processing
A hyperspectral camera with visible to near-infrared (NIR) sensitivity (HyperSpec VNIR E Series, Headwall Photonics, Fitchburg, MA, USA) was installed on a Cessna 206 aircraft together with a two-camera imaging system to acquire hyperspectral imagery with a spatial resolution of 1.2 m at an altitude of 3050 m under sunny conditions on 20 July 2016. The hyperspectral imager captured 16-bit images with 91 spectral bands in the 430–900 nm spectral range. Based on the flight height (3050 m) and speed (240 km/h), the framing rate was 57 fps with an exposure time of 17 ms. The imagery was then orthorectified using the Headwall SpectralView software. Radiometric calibration of the imagery was carried out by applying an empirical line calibration using field-measured spectra of standard reference boards. The images for Field A and Field B were extracted from the original hyperspectral images (Figure 2).
2.3. Data Analysis
2.3.1. Cotton Root Rot Classification
The subset image for each field was classified into root rot-infested and non-infested zones utilizing the ISODATA method in ENVI software (version5.3, Harris Geospatial Solutions Inc., Broomfield, CO, USA). The unsupervised technique utilizes the minimum spectral difference to assign each pixel into a class dependent on the reflectance spectra. The procedure started with arbitrary class means from the image statistics and was performed repeatedly with the statistics recalculated. The classes were then compared with the reflectance imagery and field surveys to be grouped into root rot-infested and non-infested areas.
2.3.2. Calculation and Normalization of Vegetation Indices
The 91-band imagery captured by the hyperspectral sensor was used to compute six typical VIs related to biomass, PAR, LAI, and chlorophyll contents (Table 1).
Normalization can change the value ranges of different VIs to a range between 0 and 1. In this equation, let X be the original data, Xmax be the maximum and Xmin be the minimum, then the normalized data Xnorm can be derived as shown:
The normalization of the six VIs was performed using the ENVI normalization tool.
2.3.3. Disease Severity Assessment
The severity of the fungal disease in each pixel was assessed by the normalized VI, and a rating scale of 0 to 4 could be given, where: Level 0 (L0) = 0 to 0.2; Level 1 (L1) = 0.2 to 0.4; Level 2 (L2) = 0.4 to 0.6; Level 3 (L3) = 0.6 to 0.8; and Level 4 (L4) = 0.8 to 1 (Table 2). The intervals between different grades of disease severity were set to be the same to facilitate the automatic grading process. The grades in this research may not be completely in accordance with previous ground survey results, but sufficient to discriminate the different crop disease severity levels.
It is noteworthy that L0 pixels tend to have high VI values, not only because they are in the latent period when the disease symptoms are not very obvious, but also because of the errors due to root rot classification accuracy. Therefore, in the following disease severity estimation sections, only Levels 1–4 will be primarily considered. By displaying the disease severity levels on the VI maps, the distribution and development of the crop disease can be clearly observed.
2.3.4. Accuracy Evaluation of Disease Severity Levels
To analyze the influence of disease levels on crop spectra, the average spectra for different disease levels were calculated, and the pixel with the highest NDVI value in each field was selected as the reference spectrum for healthy plants. In addition to the qualitative comparison of variations of the reflective intensity and wave form, we also computed the spectral angle distances (SAD) [28] between each disease severity group and the healthy plants for further quantitative analysis. The SAD between two specific spectral signals t and r can be given as [29]:
where nb is the number of bands.
3. Results
3.1. Classification of Cotton Root Rot
The regrouped cotton root rot classification maps identified by the airborne imagery for the two cotton fields are shown in Figure 3. The white color inside each field depicts the root rot-infested zones, while the black color represents the non-infested zones. Care was taken to guarantee that the infested regions were accurately distinguished by visual comparison with RGB images. The field surveys revealed that cotton root rot was the predominant stressor and that there was no obvious interference from other factors in these fields, under which situation the classification accuracy utilizing the ISODATA and regrouping methodology can be guaranteed [30]. The percentage of root rot-infested zones ranges from 0.80% for Field A to 13.25% for Field B, representing slightly diseased and severely diseased fields in the area.
3.2. Calculation and Normalization of Vegetation Indices
According to the formulas in Table 1, the VIs for the two fields were calculated and the results are shown in Table 3. The value ranges of the different VIs varied greatly, making it difficult to perform a comparative analysis between them. Of all the six VIs, the enhanced vegetation index (EVI) had the most equalized value range and the largest standard deviation value, indicating its potential as a crop health status indicator. As for the two fields, Field B had lower mean VI values than Field A, indicating that disease severity is negatively correlated with VIs, which is in accordance with previous studies [31].
The histograms of the VIs for the two fields, before and after normalization, are shown in Figure 4. Obviously, the values of the six VIs differed greatly before normalization, which was consistent with the descriptive statistics given in Table 3. As for the two fields, the curve shapes of the histograms were close to each other, indicating that the value distribution patterns of the VIs were consistent between the two fields. After normalization, different VIs shared the same value range, which made it easy to perform a comparative analysis of the VIs. The EVI had the most equalized distribution. The green normalized difference vegetation index (GNDVI) had the most concentrated distribution in the high-value section, while Red Edge 2 (RedEdge) occupied more space in the lower value range. The histograms of the NDVI and the soil adjusted vegetation index (SAVI) almost overlapped with each other after normalization. Between the two fields, the curve shapes of the normalized VI histograms had no obvious differences, forming a clear contrast with those before normalization. This comparative analysis revealed that the normalization process could eliminate the influence of field conditions on VIs, which should be a very useful feature in large scale crop monitoring.
3.3. Root Rot Severity Assessment
Based on the classification results in Section 3.1, the histograms for the cotton root rot pixels can be extracted as shown in Figure 5. It was clear that the values of different VIs differed markedly before normalization, making it difficult to estimate the severity levels using uniform standards. However, the normalized VIs can be compared with each other, even in different fields. Moreover, all the VIs tended to have lower mean values in Field B than in Field A, indicating that the normalized VIs were negatively correlated with the disease occurrence. Consequently, the VI normalization could not only extract the disease severity information, but also eliminate the influence of field conditions in different fields. It should therefore be very applicable in building a universal technical scheme for disease severity assessment.
Based on the classification standards defined in Table 2, the six selected VIs were utilized to carry out disease severity assessment in the two fields, and the results are shown in Figure 6 and Figure 7. In Field A, the disease-infested area was relatively small, and the severity levels were generally low, indicating that the disease severity in this field was low or still at the early development stage. Among the six VIs, the EVI had the largest standard deviation (Table 3) and the most reasonable and balanced distribution pattern, while the assessment results of RedEdge overestimated the actual disease conditions (Figure 6). The other VIs had distribution maps similar to one another.
As for Field B (Figure 7), the infested area was significantly larger than that for Field A, and the disease severity levels were obviously higher than those for Field A, which were in accordance with the ground survey results. Nearly all pixels with high severity levels were located near the central parts of the infested areas, while pixels with lower levels were found in the surrounding areas. This is in agreement with previous research [32], which confirmed the reasonability of the disease severity grading results spatially.
3.4. Accuracy Assessment of Disease Severity Levels
The descriptive statistics of the original VI values for disease-infested pixels in Field A and Field B are given in Table 4 and Table 5, respectively. It can be seen that between Field A and Field B, the more severe the disease, the higher the proportion of pixels that had severity levels of more than three, which was consistent with the actual situation and proved the effectiveness of the grading method again. As for the different VIs, the distribution of the EVI obeyed the Gaussian distribution better, verifying its effectiveness. The grading results of the other VIs were shifted towards either higher levels (e.g., RedEdge) or lower levels (e.g., the GNDVI).
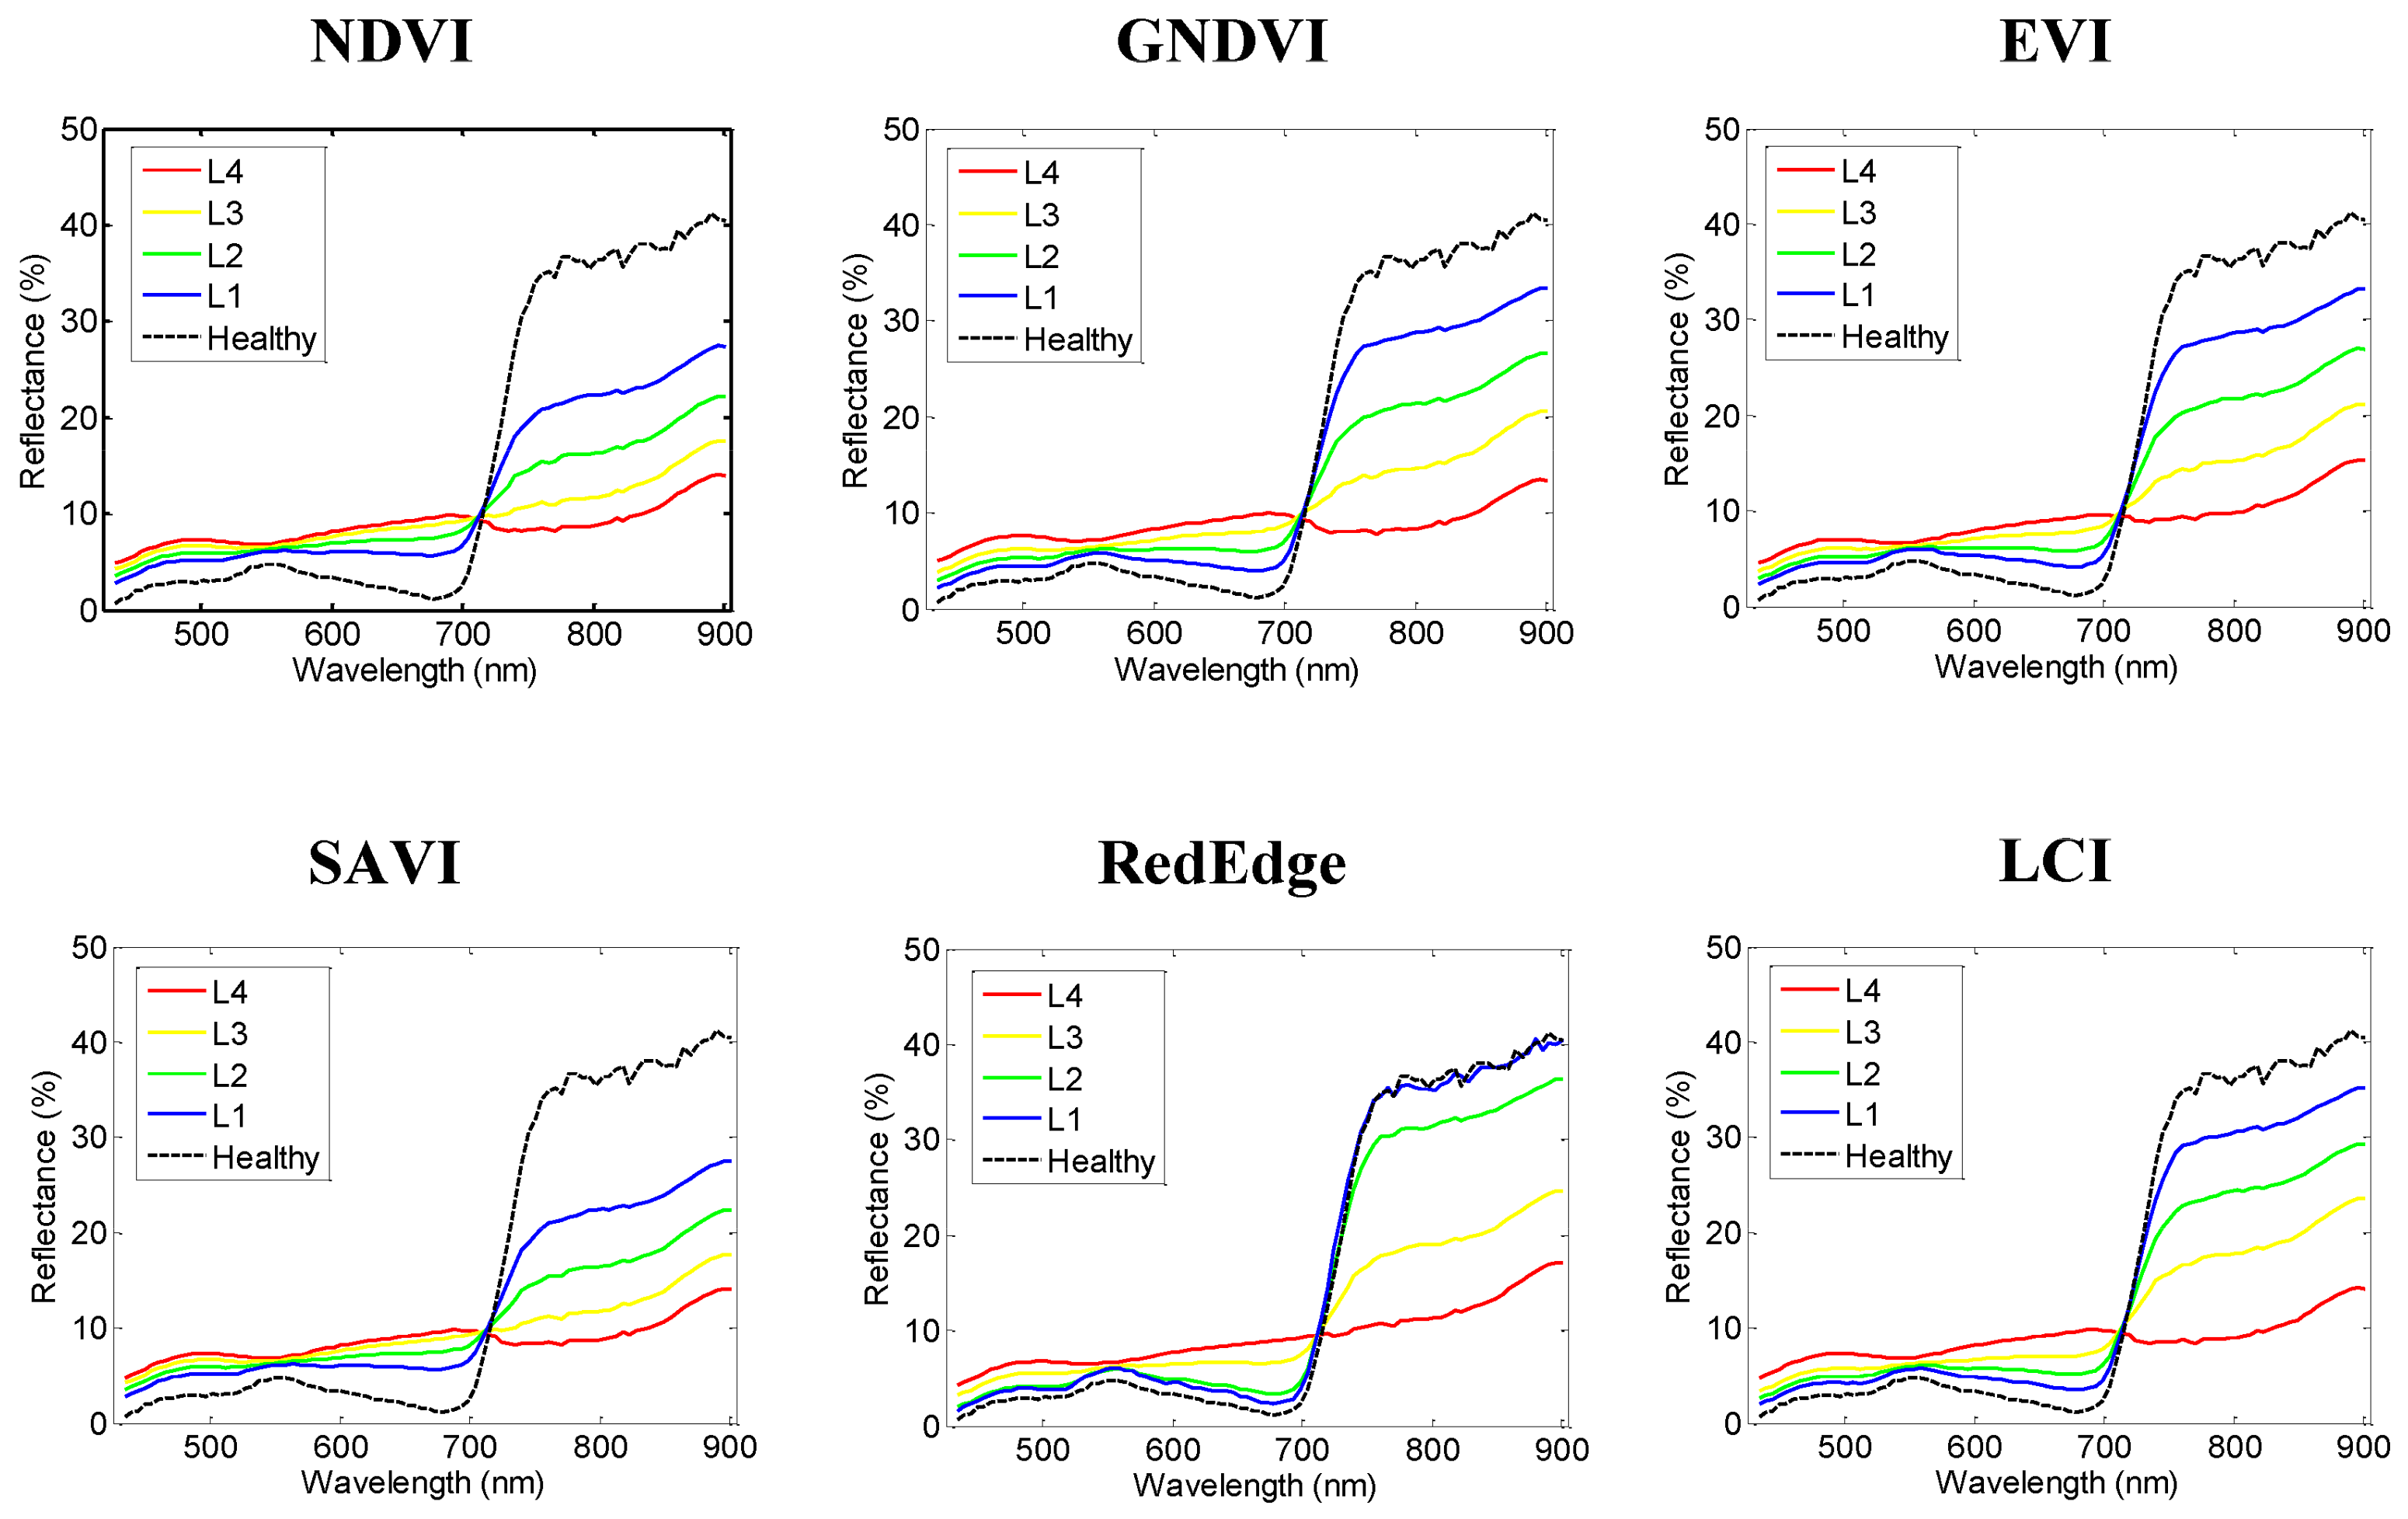
The mean spectra of the infested area at different severity levels and the spectra of healthy cotton with the highest NDVI value in Field A and Field B are shown in Figure 8 and Figure 9, respectively. It can be seen that the average spectra of each disease level are almost identical in the two fields, indicating that the disease severity grading results in different fields are highly comparable. Therefore, the newly proposed crop disease severity grading method is applicable to fields with different disease severity levels and field growing conditions, which is a very important feature for large area applications. The spectral comparison of infected and healthy plants indicated that the reflectance in the NIR range (700–900 nm) was essentially lower from infected plants than that from healthy ones. Conversely, significantly less light was absorbed in the visible region (400–700 nm), or reflectance in the visible region was significantly high from infected plants (Figure 8 and Figure 9). Nevertheless, the changes in the green bands between healthy and infected plants were not noteworthy in the two fields. These spectral variation patterns are in accordance with the ground survey results of previous research [15,33], further verifying the effectiveness of the disease grading method from another perspective.
The SADs between the average spectra and the healthy spectra are shown in Table 6. In general, the SAD increased with higher disease severity levels, indicating that plants at earlier stages of disease development tend to be similar to healthy plants. These results proved the validity of the disease severity grading method from the spectral perspective.
4. Discussion
Crop disease mapping based on image classification can estimate the infestation area but not the severity or the developing trend of the disease. The crop disease severity grading method proposed in this study can help fill this gap, as disease severity assessment has become increasingly important in agricultural disease and pest research. The existing research hierarchy for disease assessment is dependent on artificial ground surveys. Although satisfactory results could be obtained in selected fields, the site-specific models could not be easily extended to large scale applications. Therefore, a universal method for crop disease assessment, independent of ground survey, is highly demanded to fully make use of remote sensing in large area monitoring, which is also the aim of this research. With the help of this automatic method, ground surveys will not be necessary for many circumstances. When the user wants the accuracy to be further improved, the results of ground surveys can be incorporated to optimize the automatic disease severity grading model parameters. Another practical application of the methodology is to select the fields based on the VIs for limited scouting by trained individuals.
Spectral VIs, an effective dimension-reduction technique using only a limited number of bands strongly correlated to vegetation health, can be very useful in fulfilling the task of detecting the severity level of crop diseases. Due to the influence of planting time, management practice, and other variable crop growing conditions, different fields tend to have varying levels of VIs and there are normally no uniform thresholds for all fields. Therefore, unified threshold segmentation cannot be used for classification. The symptom expression in cotton plants due to disease infection is also a complex phenomenon impacted by factors such as cultivar type, prevailing weather and soil conditions. Therefore, it is indeed important to take the regional field conditions and management practices into consideration for various fields before crop disease grading. In addition, there are great variations in the ranges of VIs, which make it difficult to compare the values of different VIs directly. Normalization, a commonly used statistical method, has been proven to be capable of eliminating the influences of optical geometrics, terrain and other effects [34]. In fact, one basic assumption in this study is that normalization can eliminate the effects of field conditions among different fields and the range variations of different VIs. The fundamental idea of this methodology is that spectral differences between healthy plants and those infected with diseases can be uncovered and amplified by normalizing the data into zero-mean and unit-variance vectors [35]. Because the wavelengths are standardized before disease severity grading, the impacts of different ecological conditions, crop type, illumination, or sensor-specific effects can be reduced [12,36]. The histogram results proved that the basic assumption of this study was valid.
On the basis of the above assumption and research background, a novel crop disease grading method was proposed in this study, including the specific steps of crop classification, VI normalization, and disease grading. Two cotton fields infested with cotton root rot were selected as the experimental fields, and the grading results were evaluated from the spatial dimension, spectral dimension and statistical parameters. The performance of the six different VIs was generally consistent with each other, indicating that this disease grading method was applicable for most VIs. This is because cotton root rot can lead to the decline of chlorophyll and LAI, while VIs have been proved to be closely related to these physicochemical parameters [37]. The VIs, such as the NDVI and GNDVI, are standardized indices that utilize typical features of vegetation spectra, that is, low reflectance in the red domain due to chlorophyllabsorption and high reflectance plateau in the NIR region attributed to scattering caused by inner leaf structure. More specifically, subtle differences among the VIs could be observed, and EVI had the ideal result with the best contrast. RedEdge indices have been proven to be good indicators for crop diseases [32], but the grading results of RedEdge concentrated in the high-value area in this study, which was not very accurate. However, the results between the different fields were still comparable. The other VIs had similar but satisfactory results. It is noteworthy that some of the VI values used are already normalized values, so they cannot have a large standard deviation. In future research, more VIs, especially those without normalization in their calculation formulas, should be selected and evaluated by this method. In this study, only one set of airborne hyperspectral images taken from two experimental fields on one date was selected. In future studies, time series of remotely sensed datasets across large geographic regions will be collected to verify the effectiveness of this method.
In this study, the VI maps were calculated from the hyperspectral images to allow the calculation of spectral indices containing narrow bands and to prove the validity of the grading method through comparisons of continuous spectral curves for different grades. In fact, some studies have shown that broadband VIs can also achieve as good results as those from narrowband VIs [37]. Additionally, VIs derived from hyperspectral data may have more difficulty in distinguishing crop diseases when atmospheric conditions are poor compared to those from multispectral data [12]. As a result, there is a high possibility that the grading methodology proposed in this study could be applied to airborne or satellite multispectral images. In addition, the image data used in this study only covered the visible to NIR wavelengths, lacking shortwave infrared bands. Infection of disease or pest in crops can lead to water stress symptoms and increased reflectance in the shortwave infrared region [38]. Therefore, VIs containing shortwave infrared bands can be considered in future research for better results.
Spatial resolution has a great impact on the accuracy of crop disease classification, which is an essential step for the automatic disease grading method proposed. The spatial resolution of the manned aircraft data used is at submeter or meter level, which has been proved to be effective for crop disease monitoring in practice. However, the high cost of acquiring manned aircraft datasets makes it difficult to be used in every country or region. In recent years, unmanned aircraft vehicle (UAV) remote sensing has become a research hotspot in the field of precision agriculture [39,40]. It can obtain high-resolution data at a centimeter level, but its high resolution also brings interference information, such as soil and weeds. Satellite remote sensing data can cover large areas at extremely low cost, but the spatial resolutions of commonly used satellite sensors are usually much coarser, which will lead to the problem of mixed pixels. The best spatial resolution for crop disease grading needs to be further studied and validated.
Crop classification based on remote sensing has been able to achieve very high accuracy, but symptom discrimination of different stresses from airborne or satellite imagery is still a great challenge and remains to be further studied. Various stress factors, for example, drought, pests and nutrient insufficiencies, also cause a decrease in chlorophyll content, which in turn causes a blue shift in the red edge and other spectral feature parameters [41,42,43]. Since the remote sensing signal is not unique to a specific factor [16], for the early recognition of crop disease using remote sensing, field scouts can help to confirm the cause for the spectral signal at that location. Alternatively, if the fields are known to be infested with a specific disease, such as cotton root rot in this study, then a map of severity levels can be created. In future research, this grading method will be evaluated for the analysis of other crops, diseases and insect pests. Thus, using the database of various reference datasets corresponding to different crops as well as stress factors makes it conceivable to precisely identify the crop species and stress severity in the crops.
5. Conclusions
In this study, an automatic disease severity grading method based on VI normalization was proposed and evaluated using six typical VIs on two cotton fields infested with cotton root rot. The results showed that pixels with high disease severity levels had different spectral values from those of healthy plants and were generally located in the central parts of infested areas, which was consistent with previous studies based on ground surveys. In addition, a good comparability between the grading results of the two fields was observed, ensuring that the grading method was suitable for crop disease monitoring in large areas. Besides, the applicability of this method was established based on six commonly-used VIs, among which the EVI achieved the best result. Through exploration of more VIs in the future, the automatic disease severity grading method is expected to be further improved.
Author Contributions
H.Z. and C.Y. conceived and designed the experiments. H.Z. processed and analyzed the images, and drafted the manuscript. C.Y. guided the experimental design, participated in data collection, advised on data analysis, and revised the manuscript. W.G., L.Z., and D.Z. were involved in the process of the experiment, ground data collection, or manuscript revision. All authors have read and agreed to the published version of the manuscript.
Funding
This research was funded by the Open Research Fund of National Engineering Research Center for Agro-Ecological Big Data Analysis & Application, Anhui University (AE201901), the National Key Research and Development program (2016YFB0500502), the Fundamental Research Funds for the Central Universities (2020YQDC05 and 2020YJSDC26) and the China Scholarship Council (201806435005). The APC was funded by the U.S. Department of Agriculture.
Acknowledgments
The authors wish to thank Fred Gomez and Lee Denham of USDA-ARS in College Station, Texas for collecting the airborne images and ground data for this study. Mention of a commercial product is solely for the purpose of providing specific information and should not be construed as a product endorsement by the authors or the institutions with which the authors are affiliated.
Conflicts of Interest
The authors declare no conflict of interest.
References
- Liu, Z.; Huang, J.; Tao, R. Characterizing and estimating fungal disease severity of rice brown spot with hyperspectral reflectance data. Rice Sci. 2008, 15, 232–242. [Google Scholar] [CrossRef]
- Ashourloo, D.; Mobasheri, M.; Huete, A. Developing two spectral disease indices for detection of wheat leaf rust (Puccinia triticina). Remote Sens. 2014, 6, 4723–4740. [Google Scholar] [CrossRef] [Green Version]
- Jin, N.; Huang, W.; Ren, Y.; Luo, J.; Wu, Y.; Jing, Y.; Wang, D. Hyperspectral identification of cotton verticillium disease severity. Optik 2013, 124, 2569–2573. [Google Scholar] [CrossRef]
- Calderón, R.; Navas-Cortés, J.A.; Lucena, C.; Zarco-Tejada, P.J. High-resolution airborne hyperspectral and thermal imagery for early detection of Verticillium wilt of olive using fluorescence, temperature and narrow-band spectral indices. Remote Sens. Environ. 2013, 139, 231–245. [Google Scholar] [CrossRef]
- Zhang, J.; Pu, R.; Loraamm, R.W.; Yang, G.; Wang, J. Comparison between wavelet spectral features and conventional spectral features in detecting yellow rust for winter wheat. Comput. Electron. Agric. 2014, 100, 79–87. [Google Scholar] [CrossRef]
- Duveiller, G.; Weiss, M.; Baret, F.; Defourny, P. Retrieving wheat Green Area Index during the growing season from optical time series measurements based on neural network radiative transfer inversion. Remote Sens. Environ. 2011, 115, 887–896. [Google Scholar] [CrossRef]
- Zhang, J.; Pu, R.; Wang, J.; Huang, W.; Yuan, L.; Luo, J. Detecting powdery mildew of winter wheat using leaf level hyperspectral measurements. Comput. Electron. Agric. 2012, 85, 13–23. [Google Scholar] [CrossRef]
- Yang, C.; Everitt, J.H.; Fernandez, C.J. Comparison of airborne multispectral and hyperspectral imagery for mapping cotton root rot. Biosyst. Eng. 2010, 2, 131–139. [Google Scholar] [CrossRef]
- Yang, C.; Odvody, G.N.; Fernandez, C.J.; Landivar, J.A.; Minzenmayer, R.R.; Nichols, R.L. Evaluating unsupervised and supervised image classification methods for mapping cotton root rot. Precis. Agric. 2015, 16, 201–215. [Google Scholar] [CrossRef]
- Yang, C.H.; Odvody, G.N.; Fernandez, C.J.; Landivar, J.A.; Minzenmayer, R.R.; Nichols, R.L.; Thomasson, J.A. Monitoring cotton root rot progression within a growing season using airborne multispectral imagery. J. Cotton Sci. 2014, 18, 85–93. [Google Scholar]
- Yang, C.; Odvody, G.N.; Thomasson, J.A.; Isakeit, T.; Minzenmayer, R.R.; Drake, D.R.; Nichols, R.L. Site-Specific Management of Cotton Root Rot Using Airborne and High-Resolution Satellite Imagery and Variable-Rate Technology. Trans. ASABE. 2018, 61, 849–858. [Google Scholar] [CrossRef]
- Huang, W.; Guan, Q.; Luo, J.; Zhang, J.; Zhao, J.; Liang, D.; Huang, L.; Zhang, D. New optimized spectral indices for identifying and monitoring winter wheat diseases. IEEE J. Sel. Top. Appl. Earth Obs. Remote. Sens. 2014, 7, 2516–2524. [Google Scholar] [CrossRef]
- Kumar, N.; Niwas, R.; Khichar, M.L.; Saini, R.K.; Biswas, B. Effect of different growing environments on population dynamics of sucking pests in relation to various spectral indices in cotton. J. Indian Soc. Remote 2013, 41, 309–317. [Google Scholar] [CrossRef]
- Liu, L.; Song, X.; Li, C.; Qi, L.; Huang, W.; Wang, J. Monitoring and evaluation of the diseases of and yield winter wheat from multi-temporal remotely-sensed data. Trans. Chin. Soc. Agric. Eng. 2009, 25, 137–143. [Google Scholar]
- Prabhakar, M.; Prasad, Y.G.; Thirupathi, M.; Sreedevi, G.; Dharajothi, B.; Venkateswarlu, B. Use of ground based hyperspectral remote sensing for detection of stress in cotton caused by leafhopper (Hemiptera: Cicadellidae). Comput. Electron. Agric. 2011, 79, 189–198. [Google Scholar] [CrossRef]
- Chen, B.; Li, S.; Wang, K.; Zhou, G.; Bai, J. Evaluating the severity level of cotton Verticillium using spectral signature analysis. Int. J. Remote Sens. 2012, 33, 2706–2724. [Google Scholar] [CrossRef]
- Wu, M.; Yang, C.; Song, X.; Hoffmann, W.C.; Huang, W.; Niu, Z.; Wang, C.; Li, W.; Yu, B. Monitoring cotton root rot by synthetic Sentinel-2 NDVI time series using improved spatial and temporal data fusion. Sci. Rep. UK 2018, 8, 2016. [Google Scholar] [CrossRef] [Green Version]
- Ahamed, T.; Tian, L.; Zhang, Y.; Ting, K.C. A review of remote sensing methods for biomass feedstock production. Biomass Bioenergy 2011, 35, 2455–2469. [Google Scholar] [CrossRef]
- Yang, C.; Greenberg, S.M.; Everitt, J.H.; Fernandez, C.J. Assessing cotton defoliation, regrowth control and root rot infection using remote sensing technology. Int. J. Agric. Biol. Eng. 2011, 4, 1–11. [Google Scholar]
- Zhang, L.; Sun, X.; Wu, T.; Zhang, H. An analysis of shadow effects on spectral vegetation indexes using a ground-based imaging spectrometer. IEEE Geosci. Remote Sens. Lett. 2015, 12, 2188–2192. [Google Scholar] [CrossRef]
- Oumar, Z.; Mutanga, O.; Ismail, R. Predicting Thaumastocoris peregrinus damage using narrow band normalized indices and hyperspectral indices using field spectra resampled to the Hyperion sensor. Int. J. Appl. Earth Obs. 2013, 21, 113–121. [Google Scholar] [CrossRef]
- Tucker, C.J. Red and photographic infrared linear combinations for monitoring vegetation. Remote Sens. Environ. 1979, 8, 127–150. [Google Scholar] [CrossRef] [Green Version]
- Gitelson, A.A.; Merzlyak, M.N. Remote sensing of chlorophyll concentration in higher plant leaves. Adv. Space Res. 1998, 22, 689–692. [Google Scholar] [CrossRef]
- Haboudane, D.; Miller, J.R.; Tremblay, N.; Zarco-Tejada, P.J.; Dextraze, L. Integrated narrow-band vegetation indices for prediction of crop chlorophyll content for application to precision agriculture. Remote Sens. Environ. 2002, 81, 416–426. [Google Scholar] [CrossRef]
- Huete, A.R. A soil-adjusted vegetation index (SAVI). Remote Sens. Environ. 1988, 25, 295–309. [Google Scholar] [CrossRef]
- Cloutis, E.A.; Connery, D.R.; Major, D.J.; Dover, F.J. Airborne multi-spectral monitoring of agricultural crop status: Effect of time of year, crop type and crop condition parameter. Int. J. Remote Sens. 1996, 17, 2579–2601. [Google Scholar] [CrossRef]
- Datt, B. A new reflectance index for remote sensing of chlorophyll content in higher plants: Tests using Eucalyptus leaves. J. Plant. Physiol. 1999, 154, 30–36. [Google Scholar] [CrossRef]
- Kruse, F.A.; Lefkoff, A.B.; Boardman, J.W.; Heidebrecht, K.B.; Shapiro, A.T.; Barloon, P.J.; Goetz, A. The spectral image processing system (SIPS)—interactive visualization and analysis of imaging spectrometer data. Remote Sens. Environ. 1993, 44, 145–163. [Google Scholar] [CrossRef]
- Vishnu, S.; Nidamanuri, R.R.; Bremananth, R. Spectral material mapping using hyperspectral imagery: A review of spectral matching and library search methods. Geocarto Int. 2013, 28, 171–190. [Google Scholar] [CrossRef]
- Song, X.; Yang, C.; Wu, M.; Zhao, C.; Yang, G.; Hoffmann, W.; Huang, W. Evaluation of Sentinel-2A Satellite Imagery for Mapping Cotton Root Rot. Remote Sens. 2017, 9, 906. [Google Scholar] [CrossRef] [Green Version]
- Mirik, M.; Ansley, R.J.; Michels, G.J.; Elliott, N.C. Spectral vegetation indices selected for quantifying Russian wheat aphid (Diuraphis noxia) feeding damage in wheat (Triticum aestivum L.). Precis. Agric. 2012, 13, 501–516. [Google Scholar] [CrossRef]
- Izzuddin, M.A.; Nisfariza, M.N.; Ezzati, B.; Idris, A.S.; Steven, M.D.; Boyd, D. Analysis of airborne hyperspectral image using vegetation indices, red edge position and continuum removal for detection of ganoderma disease in oil palm. J. Oil Palm Res. 2018, 30, 416–428. [Google Scholar]
- Chen, B.; Li, S.K.; Wang, K.R.; Wang, F.Y.; Tan, H.Z.; Liu, G.Q.; Chen, J.L. Spectrum characteristics of cotton single leaf infected by verticillium wilt and estimation on severity level of disease. Sci. Agric. Sin. 2007, 40, 2709–2715. [Google Scholar]
- Clark, R.N.; Swayze, G.A.; Livo, K.E.; Kokaly, R.F.; Sutley, S.J.; Dalton, J.B.; McDougal, R.R.; Gent, C.A. Imaging spectroscopy: Earth and planetary remote sensing with the USGS Tetracorder and expert systems. J. Geophys. Res. 2003, 108, 5131. [Google Scholar] [CrossRef]
- Muhammed, H.H. Hyperspectral crop reflectance data for characterising and estimating fungal disease severity in wheat. Biosyst. Eng. 2005, 91, 9–20. [Google Scholar] [CrossRef]
- Lyon, J.G.; Yuan, D.; Lunetta, R.S.; Elvidge, C.D. A change detection experiment using vegetation indices. Photogramm. Eng. Remote Sens. 1998, 64, 143–150. [Google Scholar]
- Mutowo, G.; Mutanga, O.; Masocha, M. Mapping foliar N in miombo woodlands using sentinel-2 derived chlorophyll and structural indices. J. Appl. Remote Sens. 2018, 12, 46028. [Google Scholar] [CrossRef]
- Yang, C.; Cheng, C.; Chen, R. Changes in spectral characteristics of rice canopy infested with brown planthopper and leaffolder. Crop. Sci. 2007, 47, 329–335. [Google Scholar] [CrossRef]
- Adão, T.; Hruška, J.; Pádua, L.; Bessa, J.; Peres, E.; Morais, R.; Sousa, J.J. Hyperspectral imaging: A review on UAV-based sensors, data processing and applications for agriculture and forestry. Remote Sens. 2017, 9, 1110. [Google Scholar] [CrossRef] [Green Version]
- Raj, R.; Kar, S.; Nandan, R.; Jagarlapudi, A. Precision Agriculture and Unmanned Aerial Vehicles (UAVs). In Unmanned Aerial Vehicle: Applications in Agriculture and Environment; Springer: Berlin/Heidelberg, Germany, 2020; pp. 7–23. [Google Scholar]
- Qin, Z.; Zhang, M. Detection of rice sheath blight for in-season disease management using multispectral remote sensing. Int. J. Appl. Earth Obs. 2005, 7, 115–128. [Google Scholar] [CrossRef]
- Adams, M.L.; Norvell, W.A.; Philpot, W.D.; Peverly, J.H. Toward the discrimination of manganese, zinc, copper, and iron deficiency in ‘Bragg’soybean using spectral detection methods. Agron. J. 2000, 92, 268–274. [Google Scholar]
- Chen, P.; Zhang, J.; Li, M.; Lei, Y. Physiological change and hyperspectral character analysis of cotton leaves infested by Tetranychus turkestani. Chin. Bull. Entomol. 2007, 44, 61–65. [Google Scholar]
Figure 1.
Location of the study area: (a) Texas; (b) experimental fields (Field A in yellow and Field B in red).
Figure 1.
Location of the study area: (a) Texas; (b) experimental fields (Field A in yellow and Field B in red).
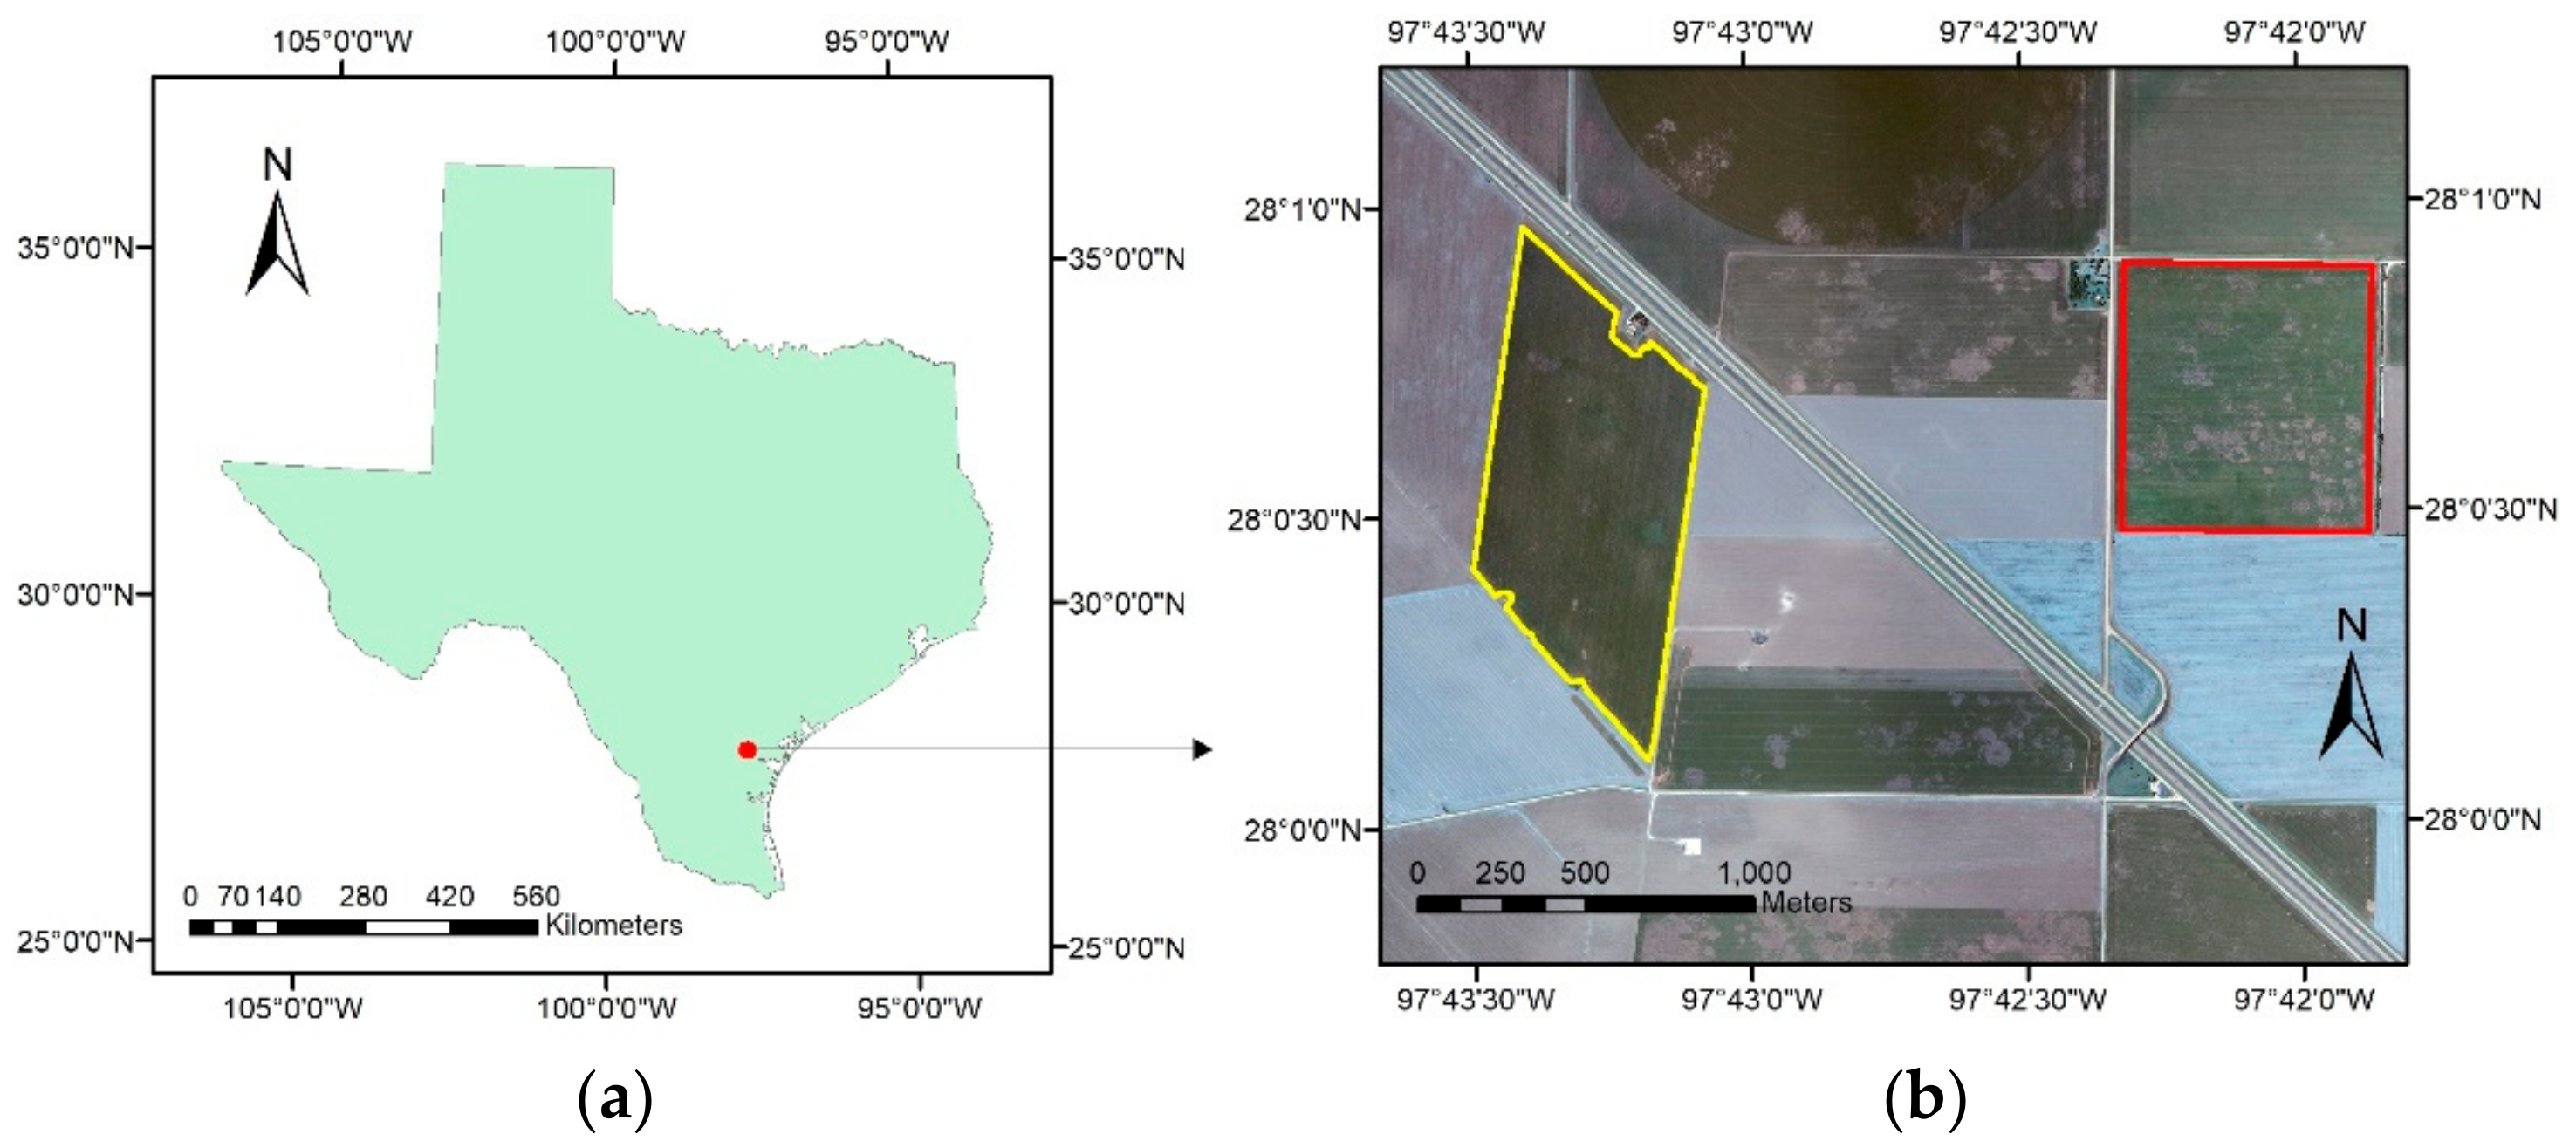
Figure 2.
Color-infrared composite images derived from hyperspectral images for two fields: (a) Field A and (b) Field B.
Figure 2.
Color-infrared composite images derived from hyperspectral images for two fields: (a) Field A and (b) Field B.
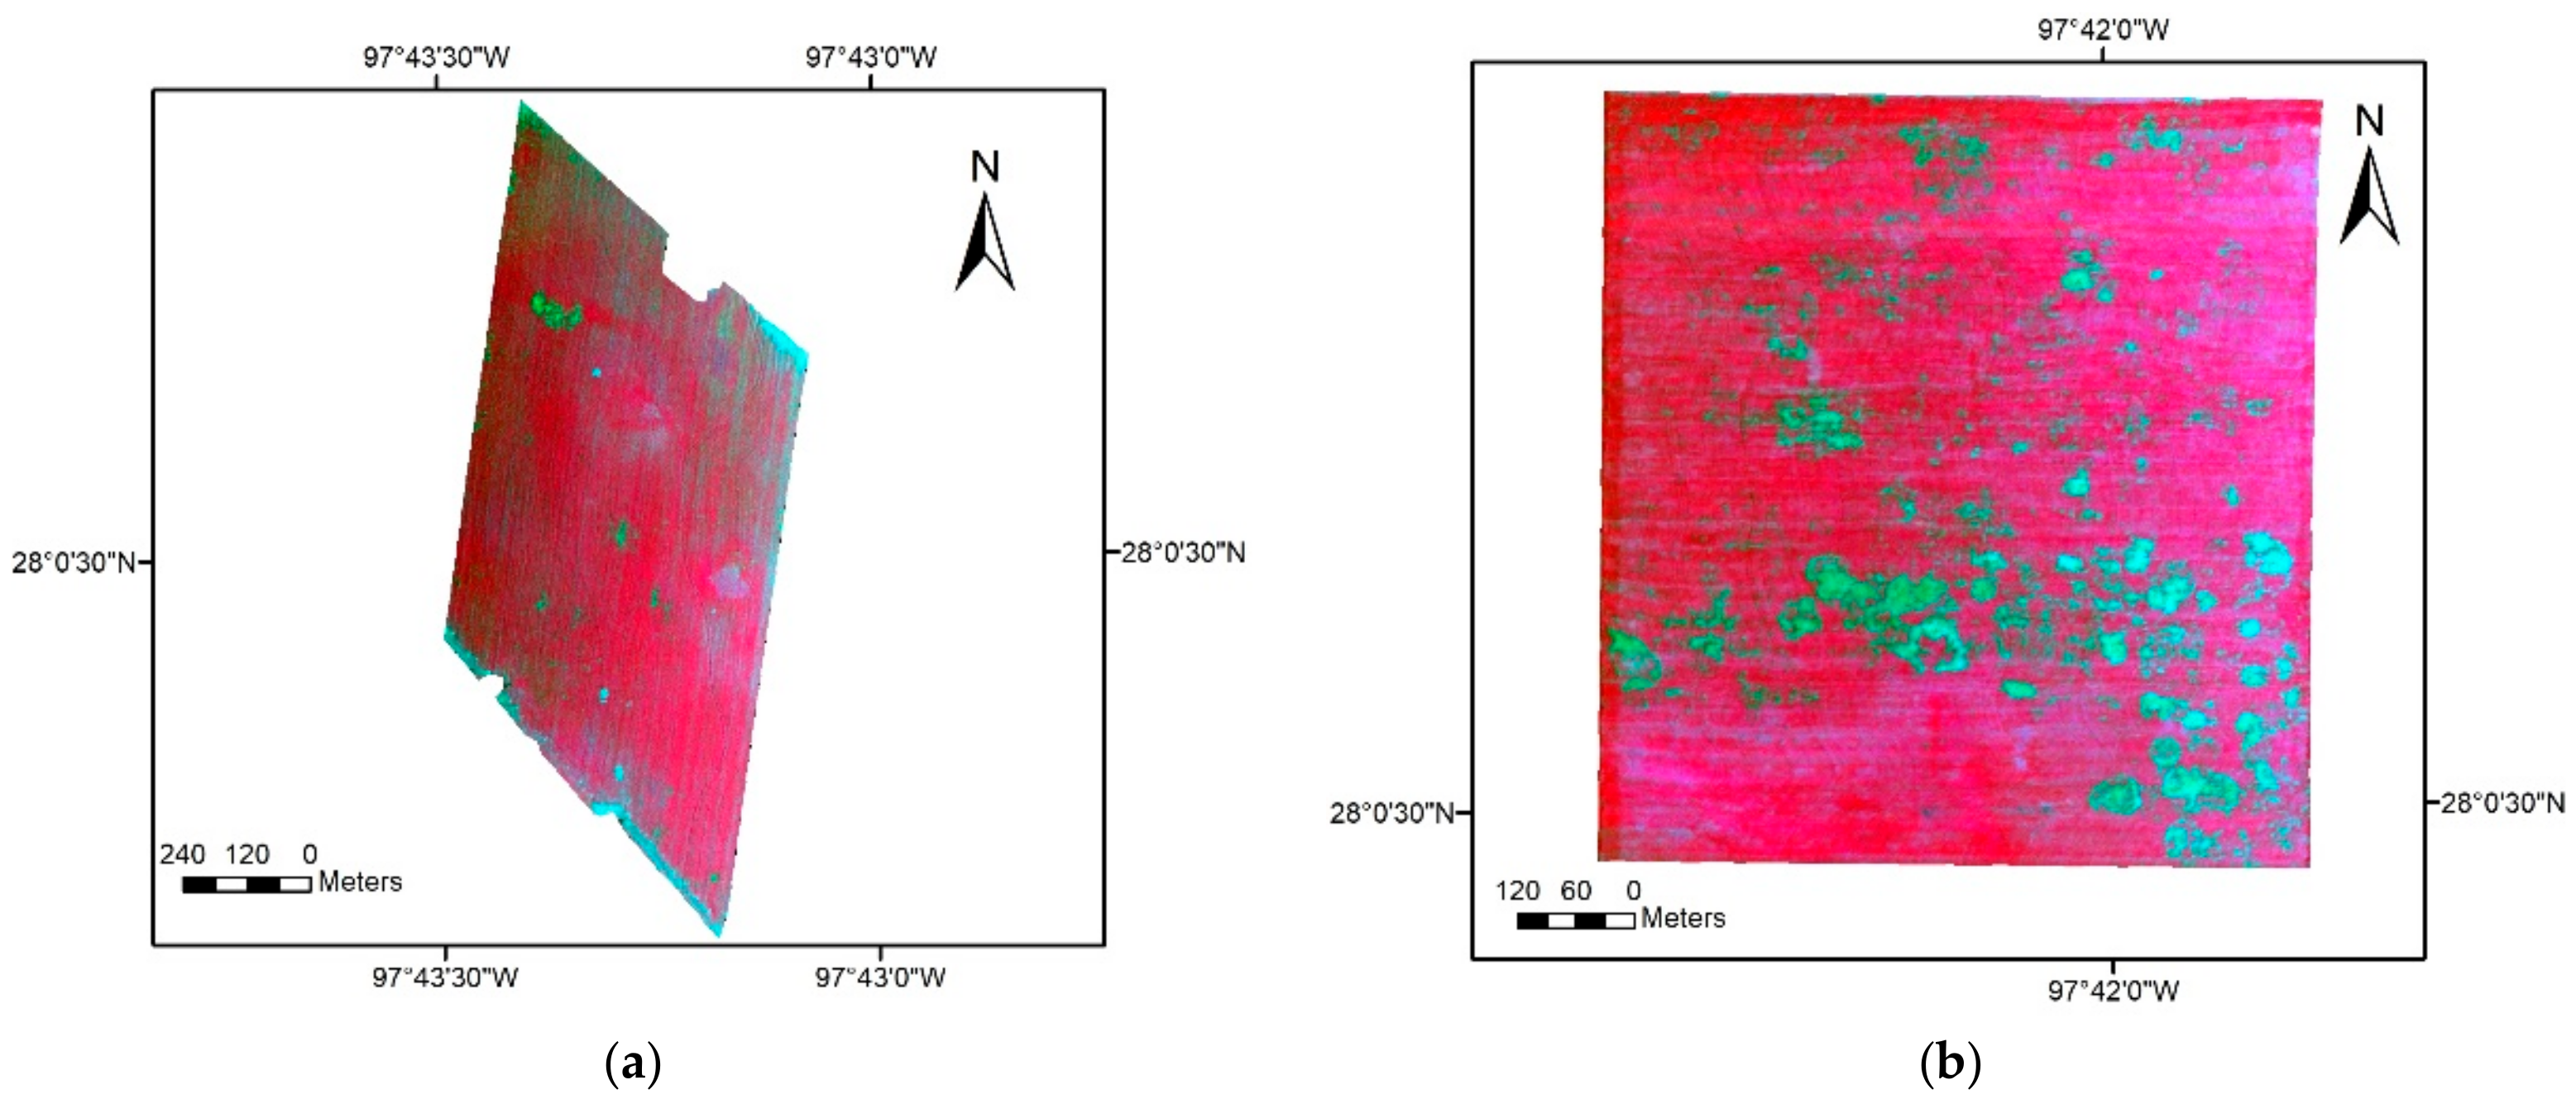
Figure 3.
Classification maps for two fields: (a) Field A and (b) Field B. White within each field represents root rot areas, while black depicts non-infested areas.
Figure 3.
Classification maps for two fields: (a) Field A and (b) Field B. White within each field represents root rot areas, while black depicts non-infested areas.
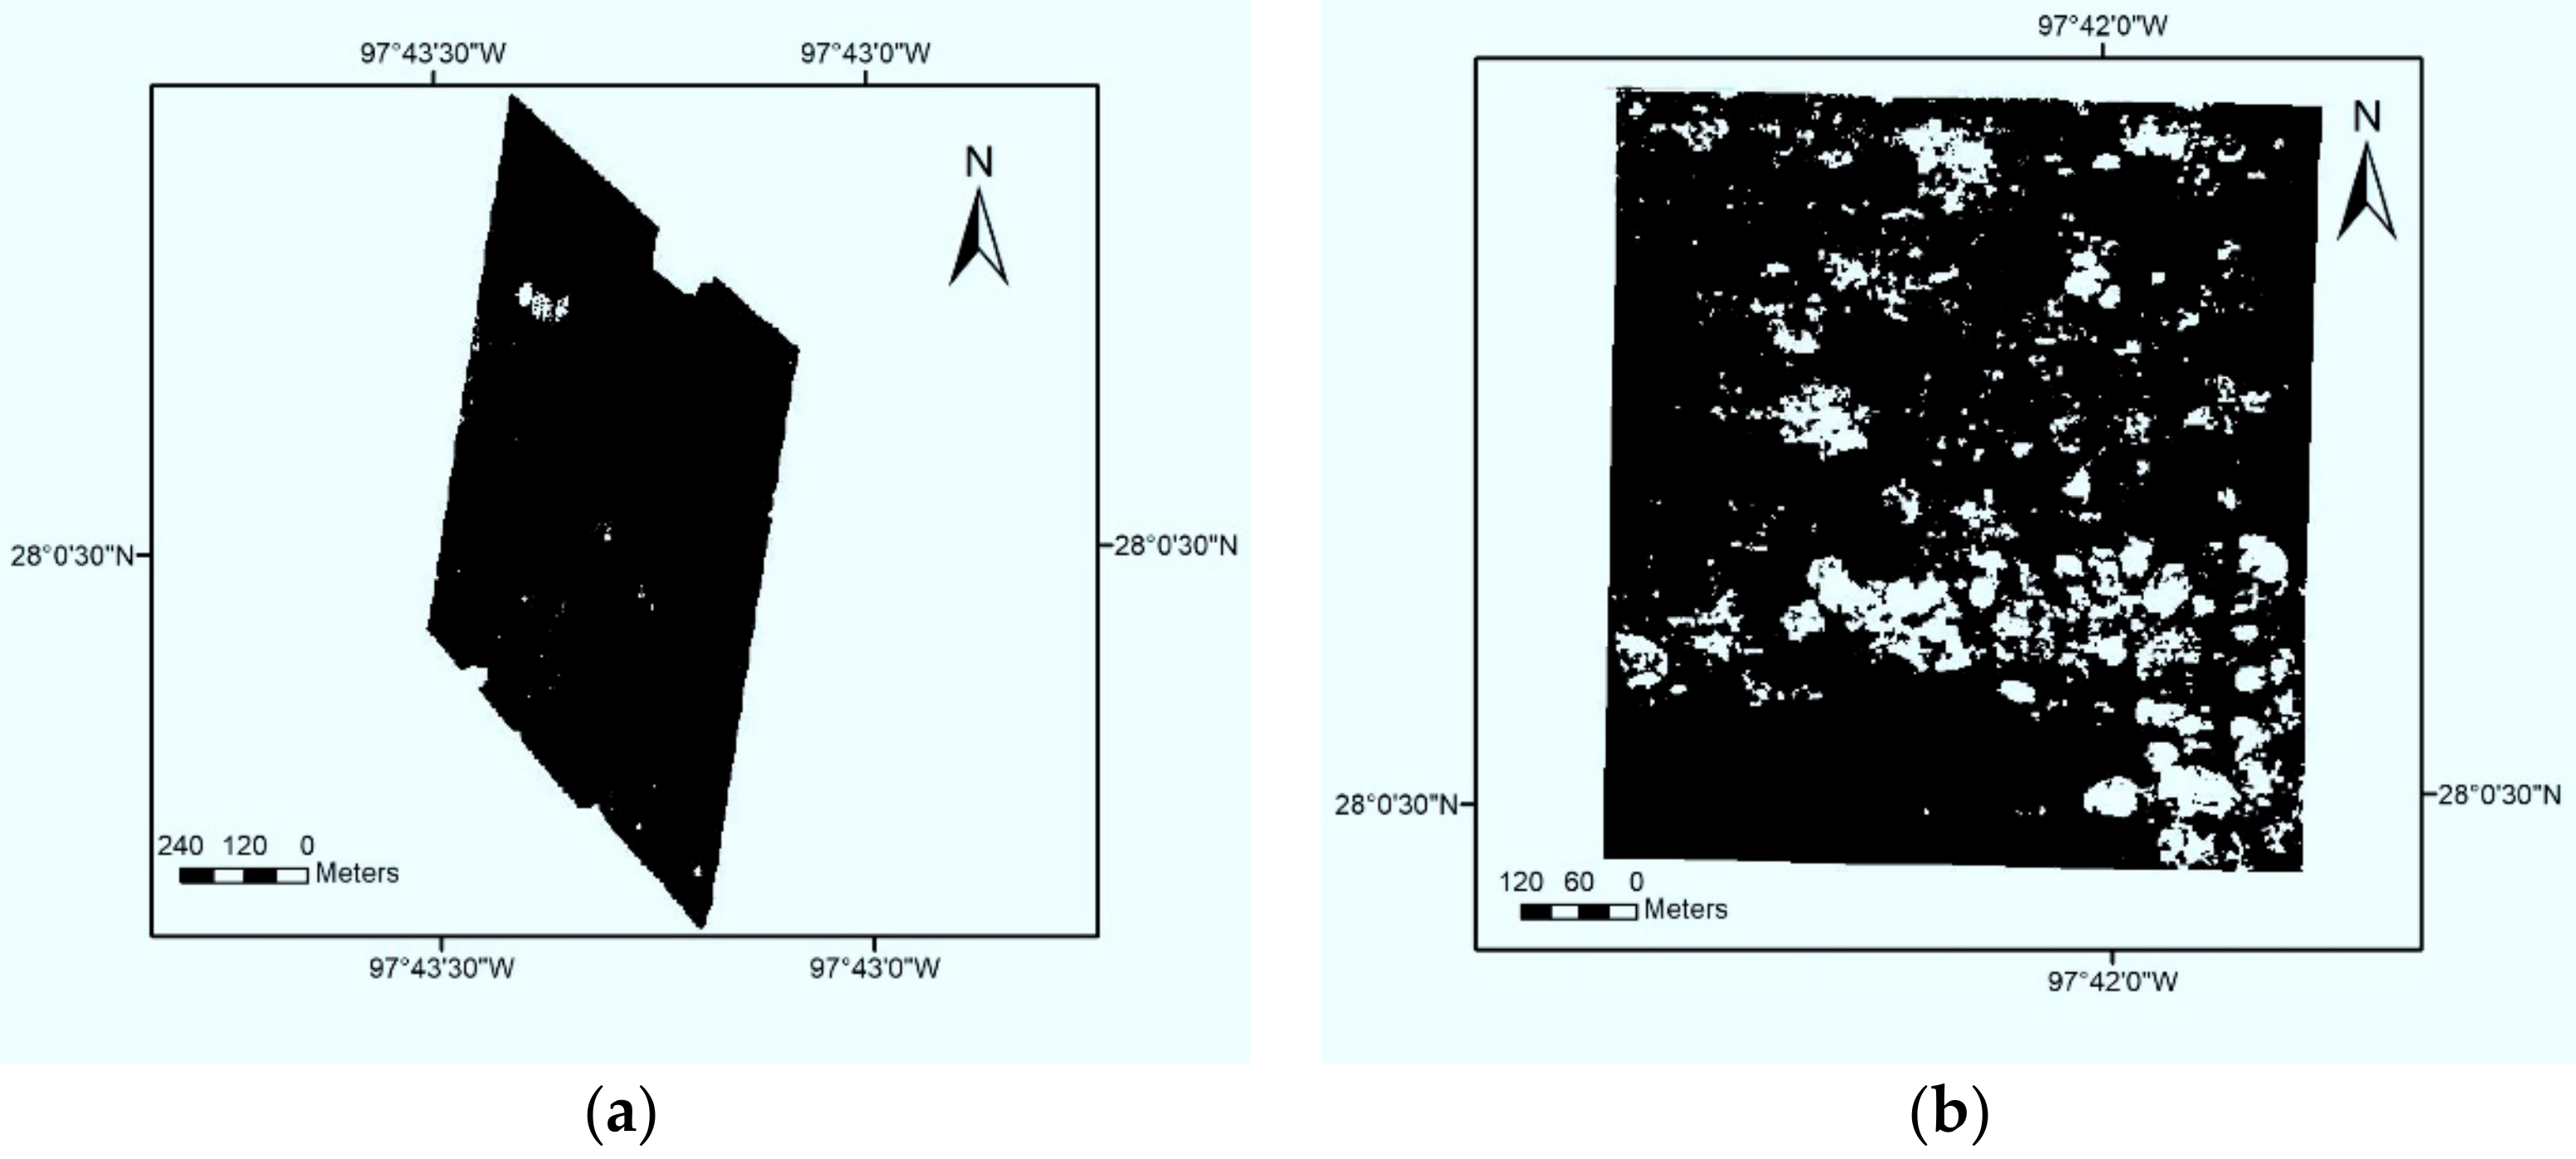
Figure 4.
Histograms of six vegetation indices in the two experimental fields.
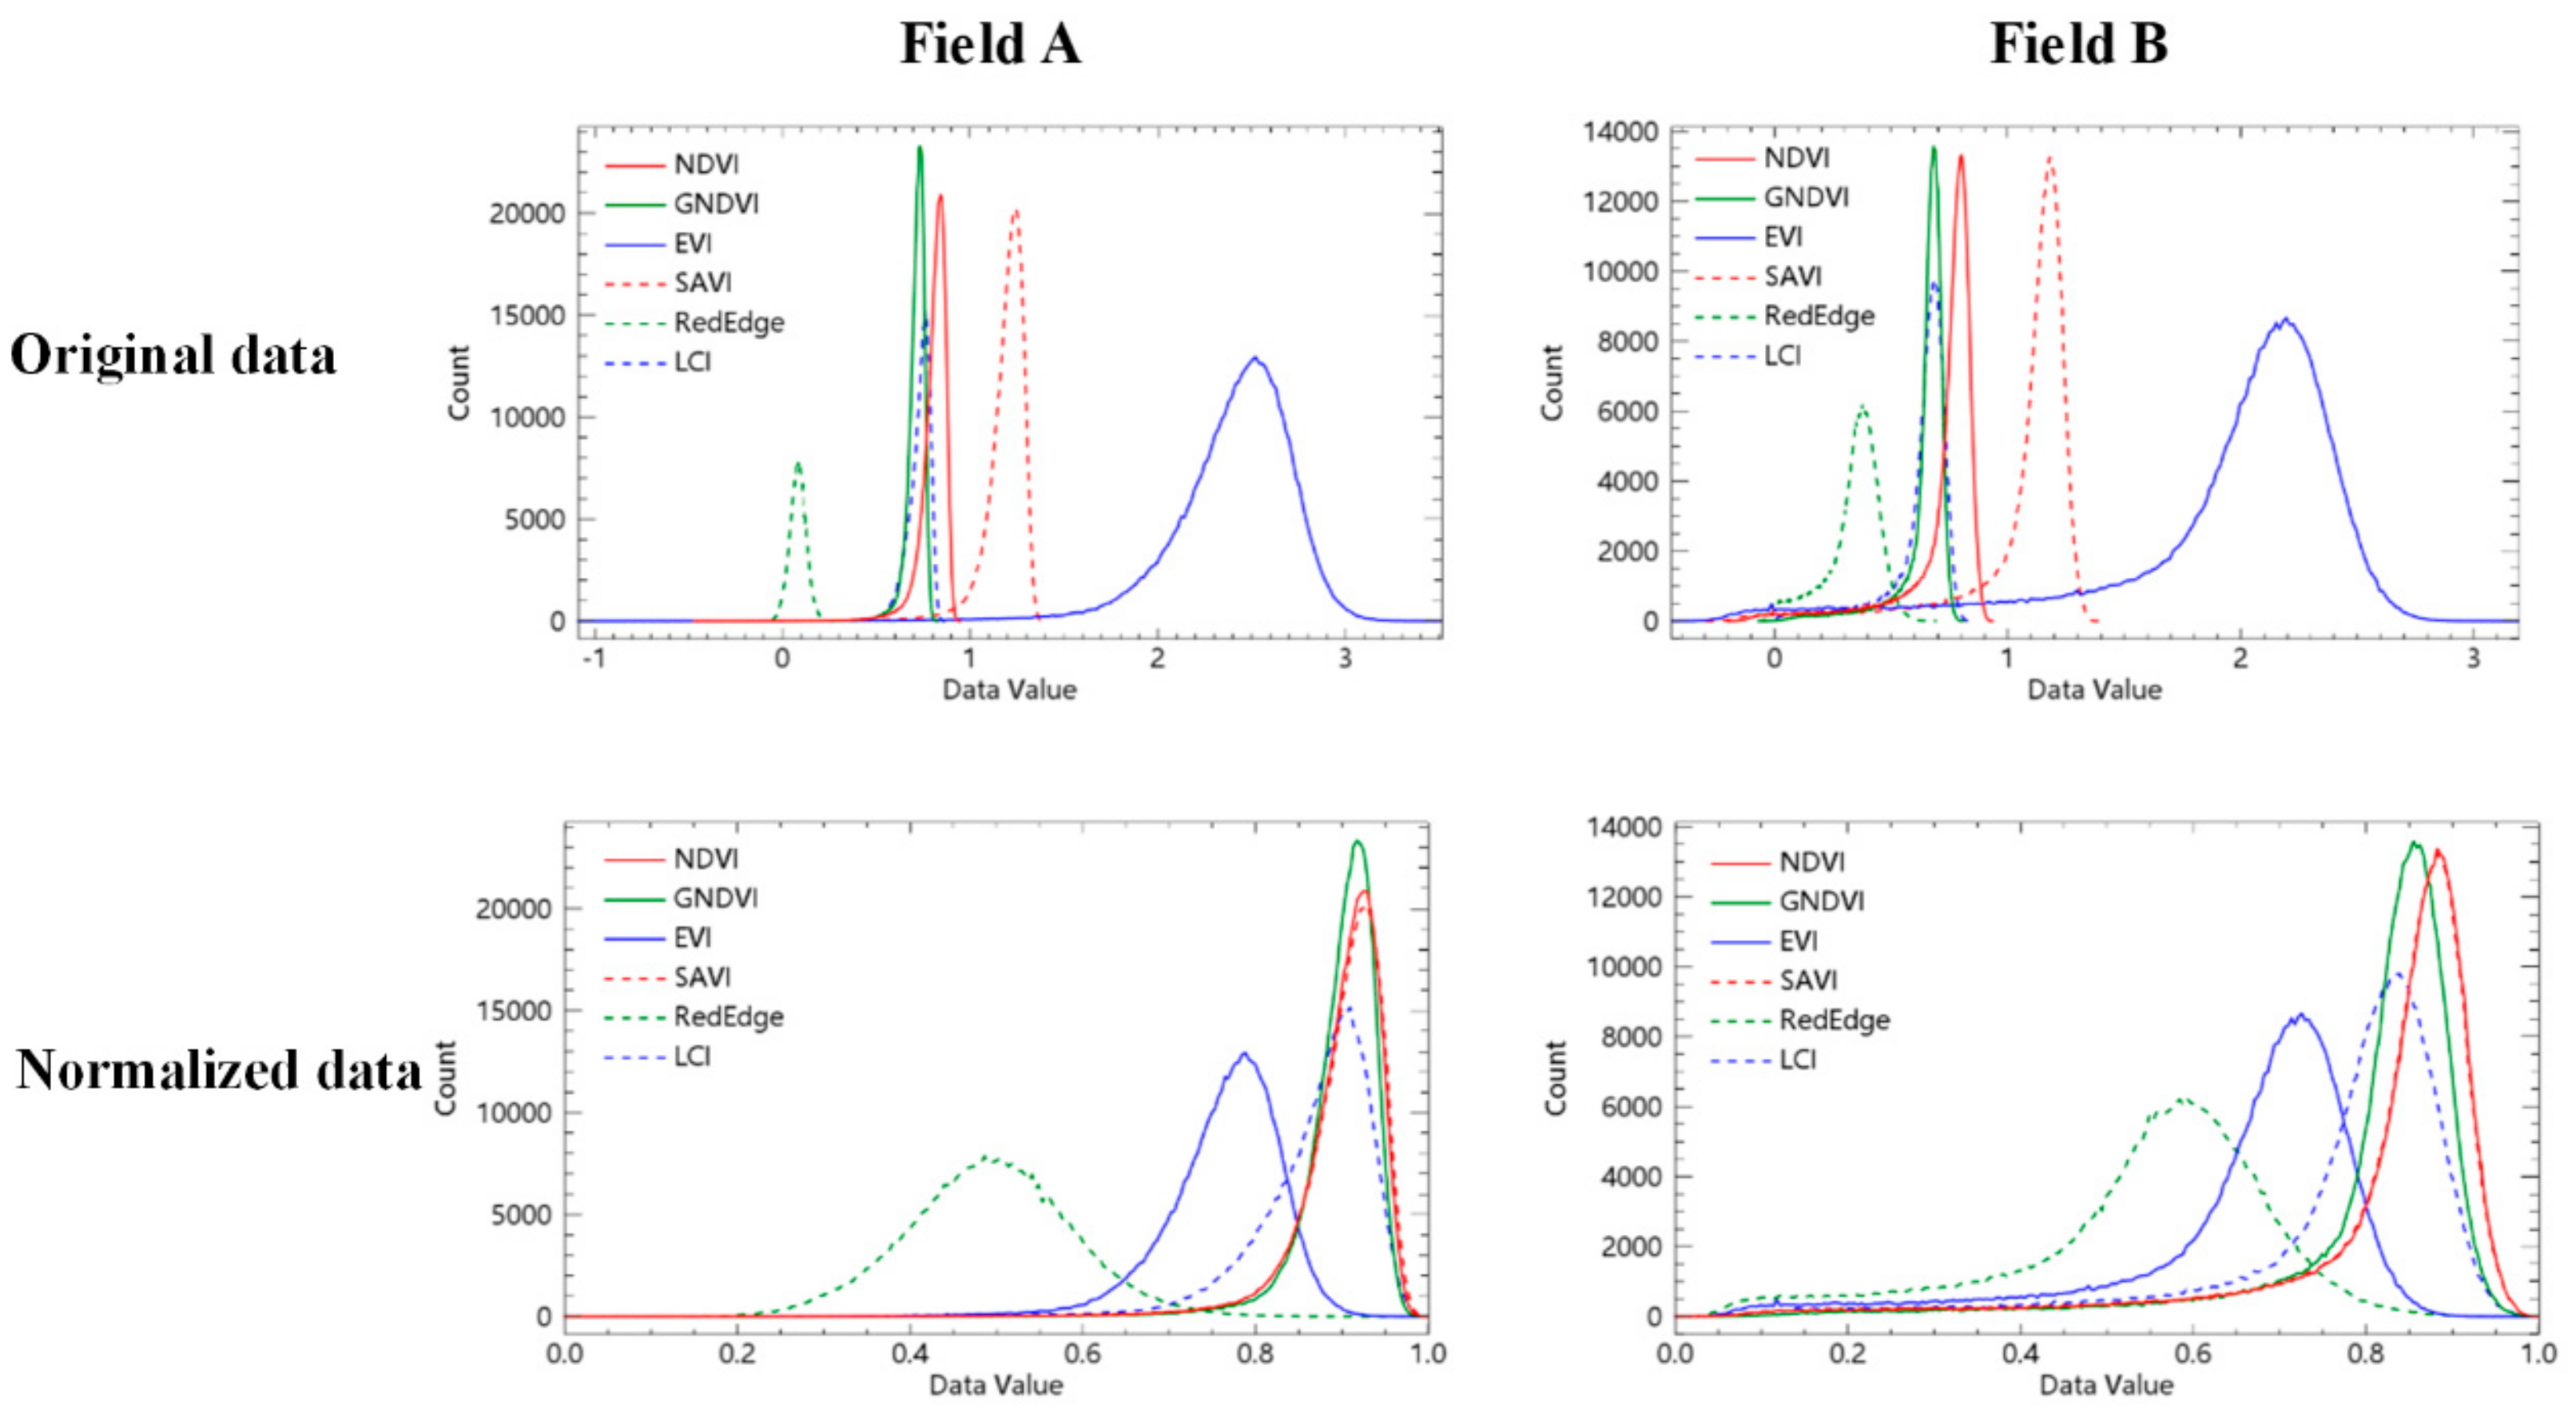
Figure 5.
Histograms of six vegetation indices in cotton root rot-infested areas.

Figure 6.
Distribution maps of the severity levels of cotton root rot in Field A.

Figure 7.
Distribution maps of the severity levels of cotton root rot in Field B.
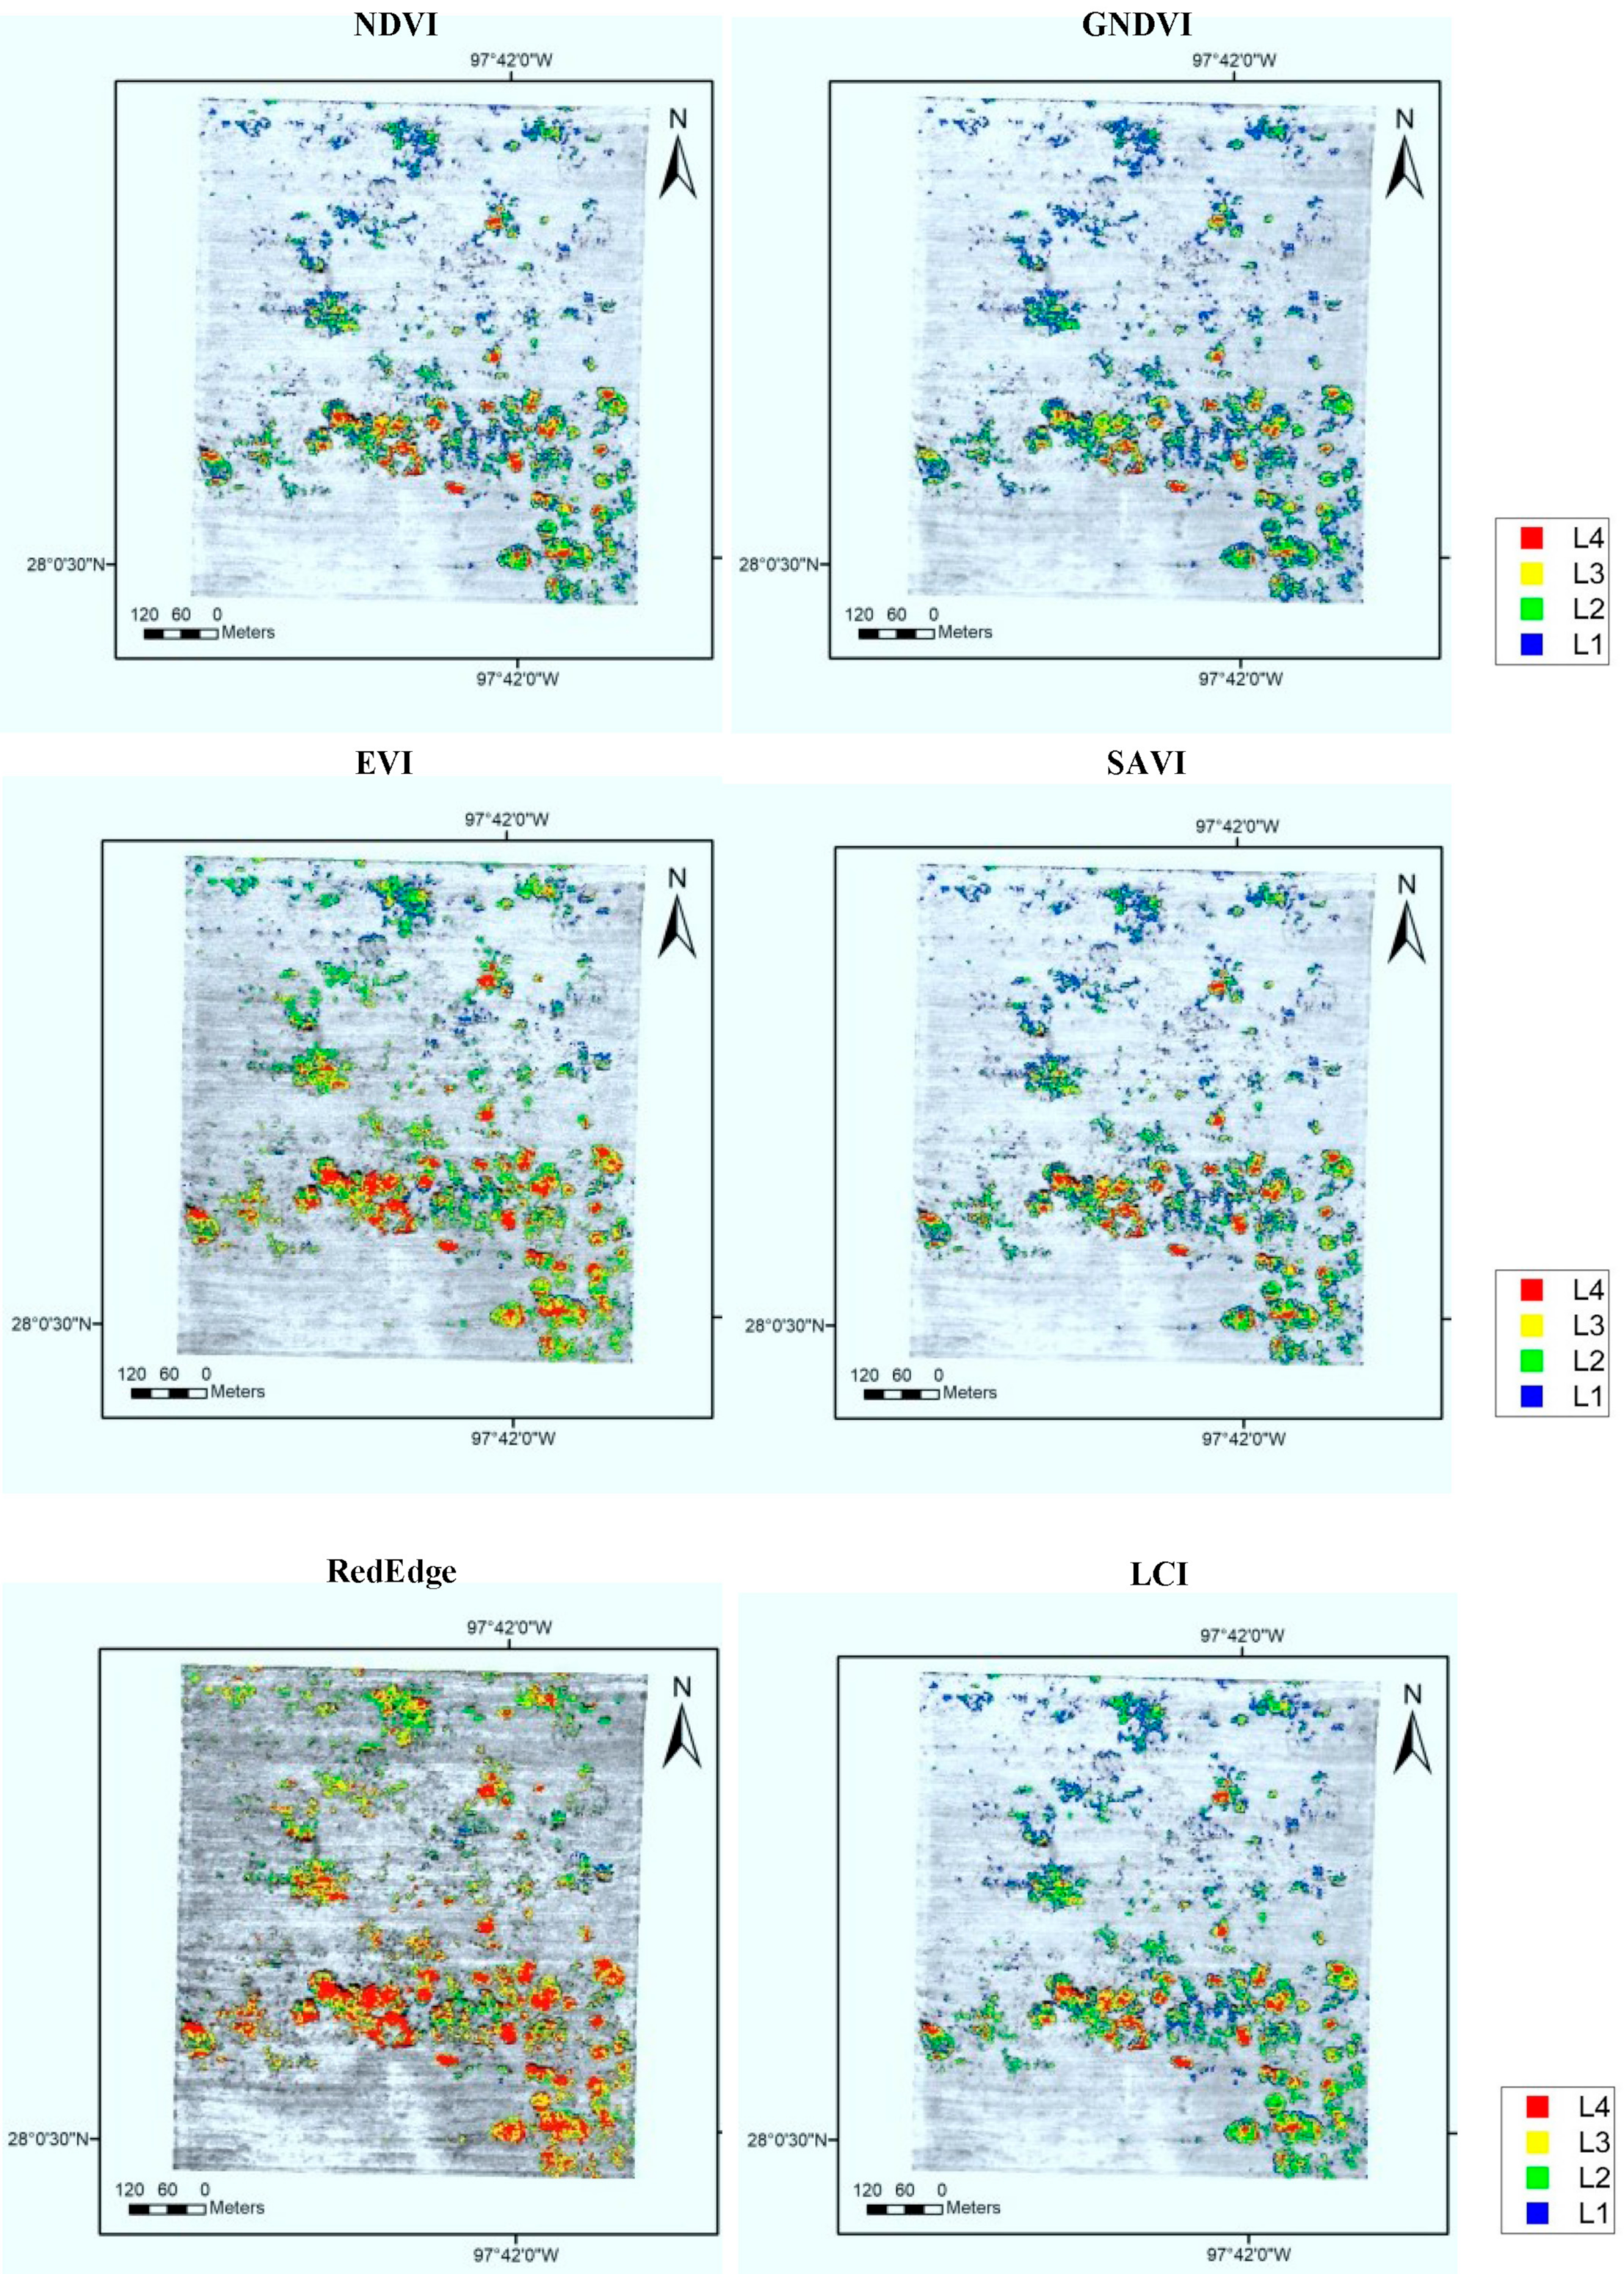
Figure 8.
Average spectra of different severity levels of cotton root rot in Field A.
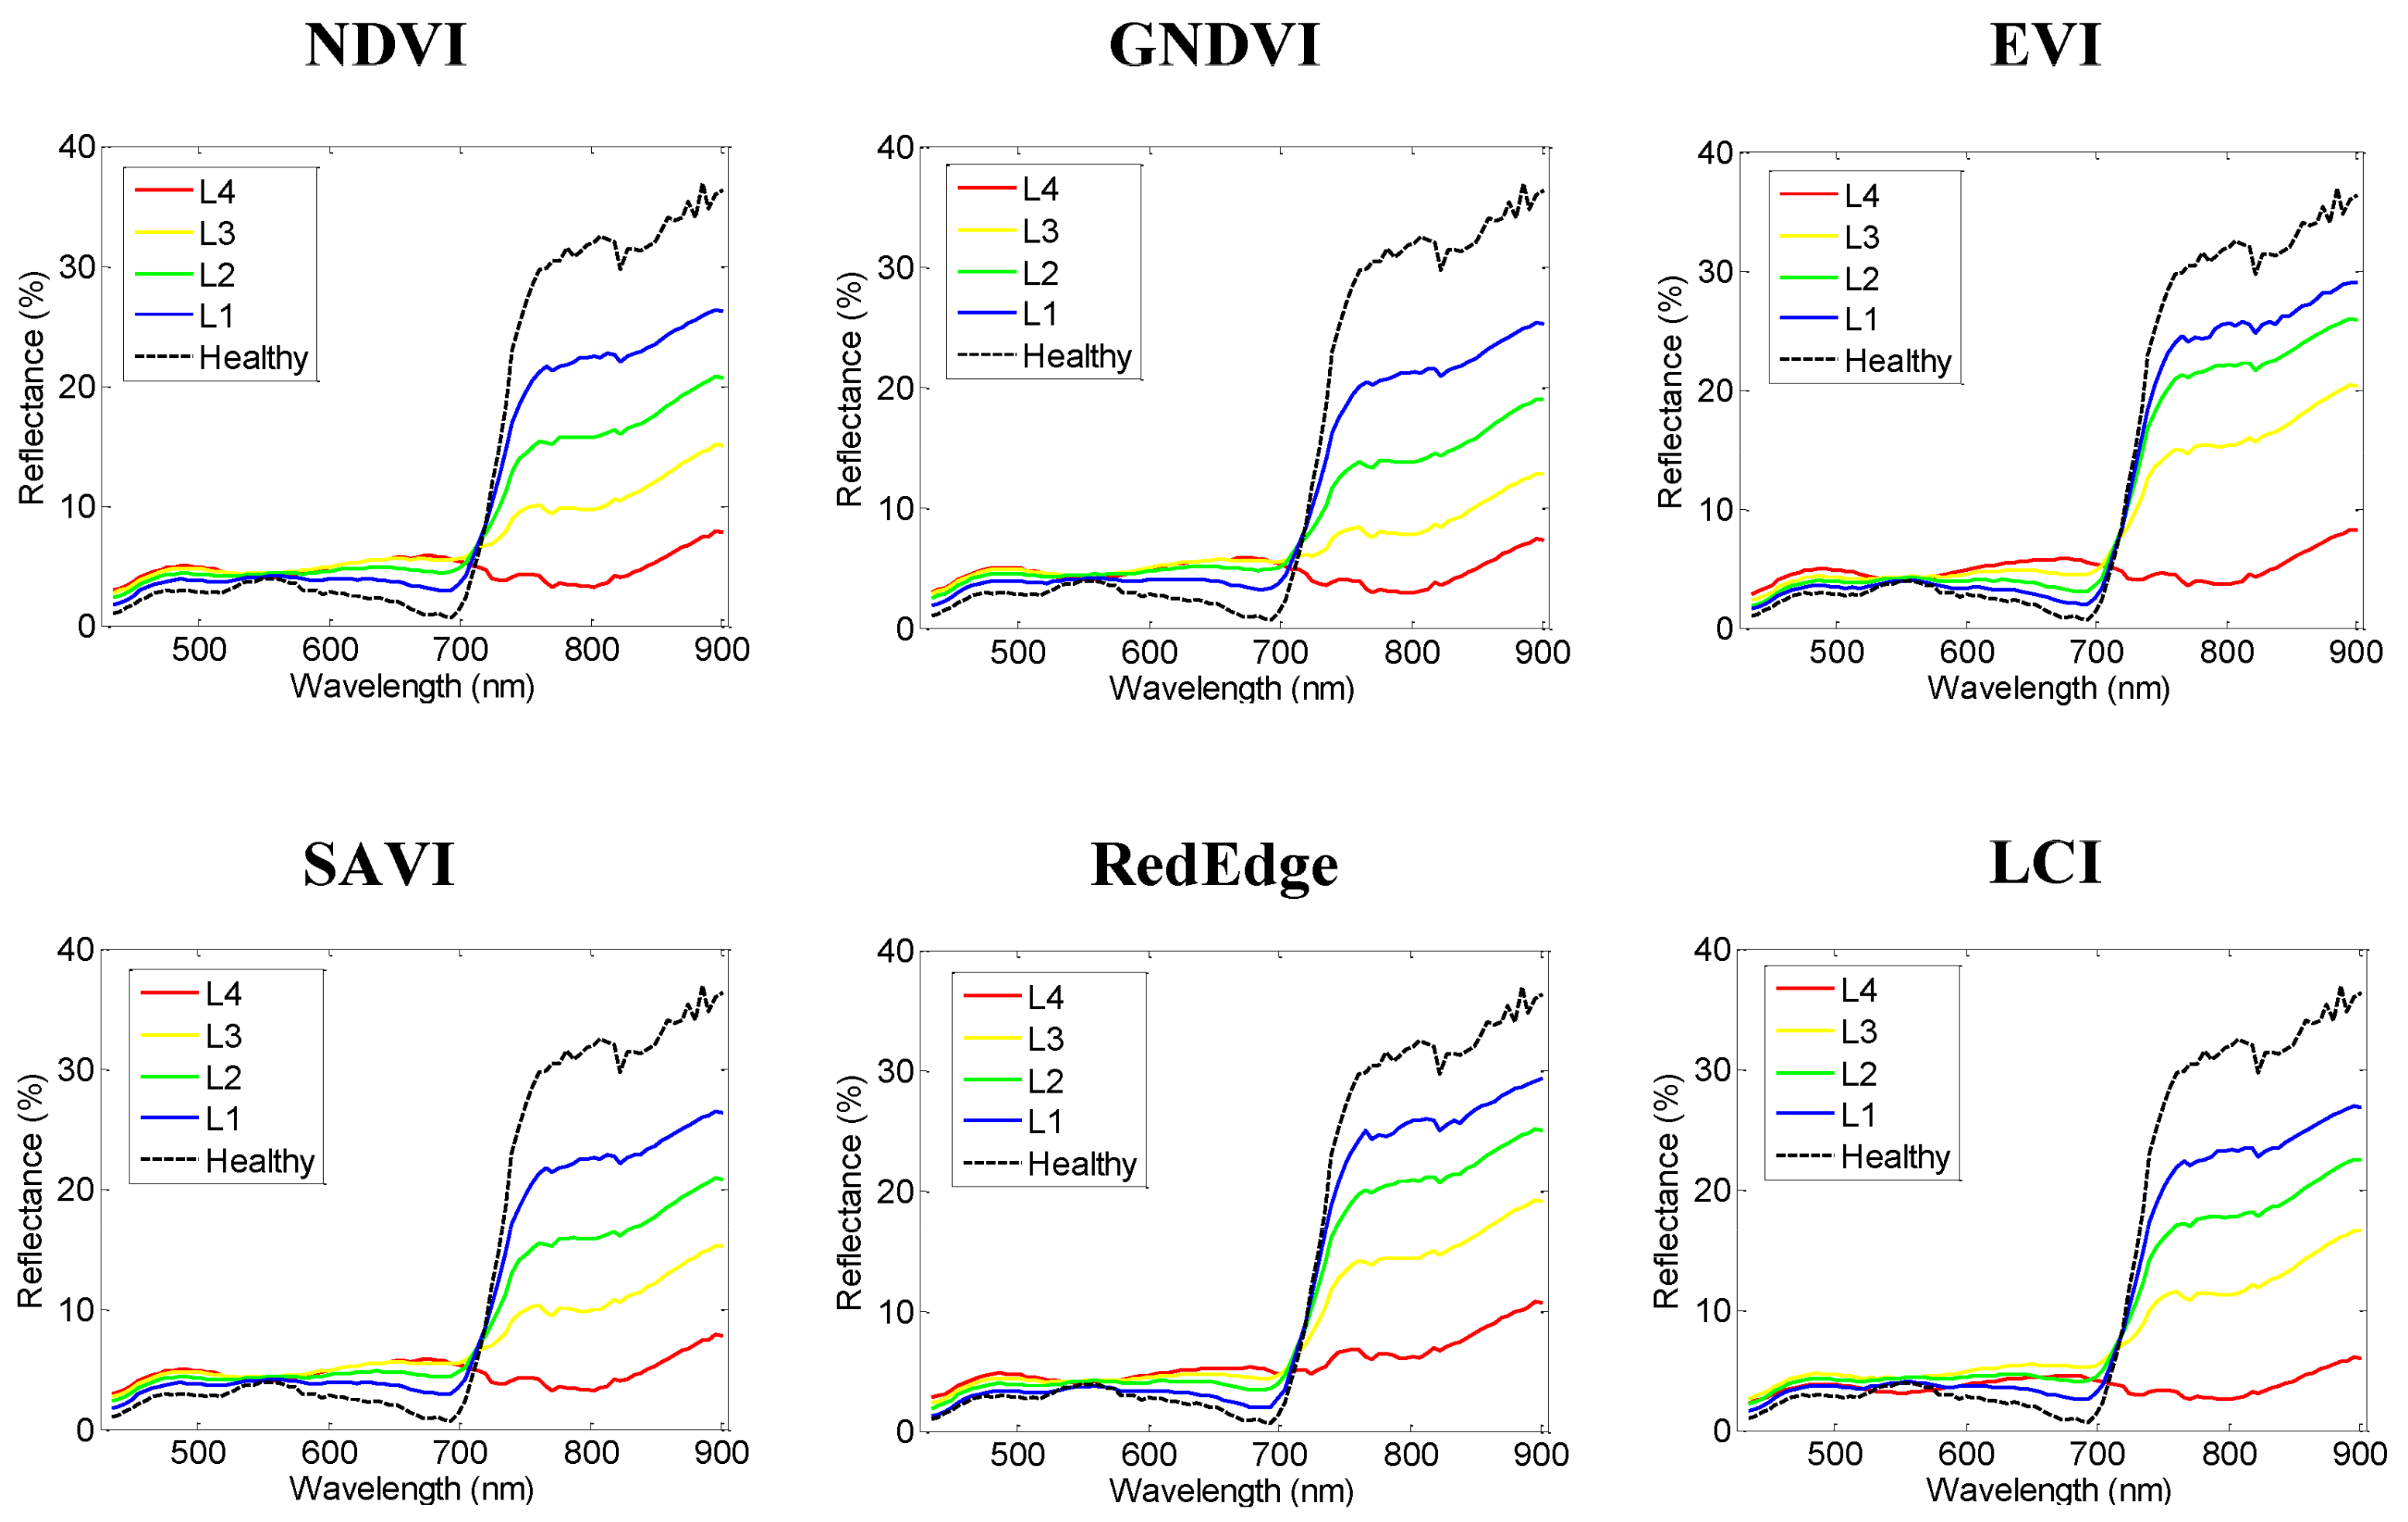
Figure 9.
Average spectra of different severity levels of cotton root rot in Field B.

Table 1.
Vegetation indices applied in this study.
| Vegetation Index | Abbrev. | Formula | Application | Reference |
|---|---|---|---|---|
| Normalized difference vegetation index | NDVI | (R800 − R670)/(R800 + R670) | Biomass | [22] |
| Green normalized difference vegetation index | GNDVI | (R800 − R550)/(R800 + R550) | PAR, vegetation cover | [23] |
| Enhanced vegetation index | EVI | 2.5(R800 − R670)/(R800 + 6R670 − 7.5R450 + 1) | Biomass, LAI | [24] |
| Soil adjusted vegetation index | SAVI | (1 + L)(R800 − R670)/(R800 + R670 + L) | Biomass, soil background | [25] |
| Red edge 2 | RedEdge | (R710 − R680)/(R710 + R680) | Chlorophyll content | [26] |
| Leaf chlorophyll index | LCI | (R850 − R710)/(R850 + R680) | Chlorophyll content | [27] |
Note: L = 0.5. LAI, leaf area index; PAR, photosynthetically active radiation.
Table 2.
Gradings of cotton root rot pixels based on normalized vegetation indices.
| Severity Level | Symptom Description | Normalized Vegetation Indices |
|---|---|---|
| Level 4 (L4) | Extremely severe | 0.8–1.0 |
| Level 3 (L3) | Severe | 0.6–0.8 |
| Level 2 (L2) | Medium | 0.4–0.6 |
| Level 1 (L1) | Slight | 0.2–0.4 |
| Level 0 (L0) | Latency period | 0.0–0.2 |
Table 3.
Descriptive statistics of six vegetation indices in two experimental fields.
| Field | Vegetation Index | Min. | Max. | Mean | Std. Dev. |
|---|---|---|---|---|---|
| A | NDVI | −0.4697 | 0.9475 | 0.8079 | 0.0775 |
| GNDVI | −0.3225 | 0.8269 | 0.7130 | 0.0544 | |
| EVI | −1.0867 | 3.5126 | 2.4153 | 0.3185 | |
| SAVI | −0.6640 | 1.4000 | 1.1916 | 0.1154 | |
| RedEdge | −0.1445 | 0.3202 | 0.0840 | 0.0441 | |
| LCI | −0.1175 | 0.8571 | 0.7277 | 0.0678 | |
| B | NDVI | −0.2028 | 0.9356 | 0.7225 | 0.1724 |
| GNDVI | −0.0511 | 0.8066 | 0.6430 | 0.1093 | |
| EVI | −0.4417 | 3.1930 | 1.9429 | 0.5463 | |
| SAVI | −0.2942 | 1.3850 | 1.0673 | 0.2564 | |
| RedEdge | −0.0724 | 0.6904 | 0.3397 | 0.1159 | |
| LCI | −0.0633 | 0.8335 | 0.6265 | 0.1361 |
Table 4.
Descriptive statistics of different severity levels of cotton root rot in Field A.
| Vegetation Index | Severity Level | Min. | Max. | Mean | Number of Pixels |
|---|---|---|---|---|---|
| NDVI | L4 | −0.4697 | −0.1873 | −0.2862 | 59 |
| L3 | −0.1750 | 0.0970 | −0.0156 | 176 | |
| L2 | 0.0979 | 0.3805 | 0.2667 | 484 | |
| L1 | 0.3808 | 0.6639 | 0.5460 | 1470 | |
| GNDVI | L4 | −0.3225 | −0.0935 | −0.1657 | 35 |
| L3 | −0.0922 | 0.1371 | 0.0389 | 116 | |
| L2 | 0.1417 | 0.3670 | 0.2748 | 288 | |
| L1 | 0.3681 | 0.5970 | 0.5124 | 1256 | |
| EVI | L4 | −1.0867 | −0.1726 | −0.4488 | 91 |
| L3 | −0.1699 | 0.7439 | 0.3749 | 537 | |
| L2 | 0.7473 | 1.6613 | 1.2551 | 1465 | |
| L1 | 1.6626 | 2.5721 | 2.0241 | 1433 | |
| SAVI | L4 | −0.6640 | −0.2678 | −0.4064 | 59 |
| L3 | −0.2501 | 0.1547 | −0.0113 | 188 | |
| L2 | 0.1626 | 0.5692 | 0.4029 | 500 | |
| L1 | 0.5698 | 0.9804 | 0.8079 | 1477 | |
| RedEdge | L4 | −0.0947 | −0.0521 | −0.0614 | 35 |
| L3 | −0.0518 | 0.0407 | 0.0087 | 2190 | |
| L2 | 0.0407 | 0.1329 | 0.0646 | 1317 | |
| L1 | 0.1341 | 0.1822 | 0.1522 | 23 | |
| LCI | L4 | −0.1175 | 0.0747 | 0.0065 | 75 |
| L3 | 0.0773 | 0.2708 | 0.1974 | 235 | |
| L2 | 0.2714 | 0.4649 | 0.3850 | 695 | |
| L1 | 0.4650 | 0.6589 | 0.5688 | 1687 |
Table 5.
Descriptive statistics of different severity levels of cotton root rot in Field B.
| Vegetation Index | Severity Level | Min. | Max. | Mean | Number of Pixels |
|---|---|---|---|---|---|
| NDVI | L4 | −0.2028 | 0.0240 | −0.0436 | 5128 |
| L3 | 0.0240 | 0.2508 | 0.1411 | 10,249 | |
| L2 | 0.2508 | 0.4776 | 0.3716 | 13,750 | |
| L1 | 0.4776 | 0.7044 | 0.5901 | 17,668 | |
| GNDVI | L4 | −0.0511 | 0.1204 | 0.0792 | 2491 |
| L3 | 0.1205 | 0.2920 | 0.2119 | 8477 | |
| L2 | 0.2920 | 0.4635 | 0.3863 | 13,394 | |
| L1 | 0.4637 | 0.6350 | 0.5522 | 22,074 | |
| EVI | L4 | −0.2942 | 0.2853 | 0.0378 | 10,648 |
| L3 | 0.2853 | 1.0121 | 0.6572 | 17,483 | |
| L2 | 1.0122 | 1.7391 | 1.3579 | 17,366 | |
| L1 | 1.7392 | 2.4655 | 2.0048 | 8087 | |
| SAVI | L4 | −0.2942 | 0.0403 | −0.0607 | 5278 |
| L3 | 0.0404 | 0.3749 | 0.2126 | 10,328 | |
| L2 | 0.3749 | 0.7094 | 0.5528 | 13,884 | |
| L1 | 0.7094 | 1.0439 | 0.8750 | 17,521 | |
| RedEdge | L4 | −0.0724 | 0.0802 | 0.0258 | 17,931 |
| L3 | 0.0802 | 0.2327 | 0.1532 | 23,505 | |
| L2 | 0.2328 | 0.3853 | 0.2934 | 10,799 | |
| L1 | 0.3853 | 0.5356 | 0.4204 | 1538 | |
| LCI | L4 | −0.0633 | 0.1161 | 0.0620 | 5713 |
| L3 | 0.1161 | 0.2954 | 0.2088 | 12,194 | |
| L2 | 0.2955 | 0.4748 | 0.3897 | 16,599 | |
| L1 | 0.4748 | 0.6541 | 0.5580 | 16,063 |
Table 6.
Spectral angel differences between the healthy cotton plant spectrum and the average infected plant spectra of different severity levels of cotton root rot in two experimental fields.
Table 6.
Spectral angel differences between the healthy cotton plant spectrum and the average infected plant spectra of different severity levels of cotton root rot in two experimental fields.
| Field | Vegetation Index | L4 | L3 | L2 | L1 |
|---|---|---|---|---|---|
| A | NDVI | 0.8116 | 0.4159 | 0.2312 | 0.1086 |
| GNDVI | 0.8471 | 0.5020 | 0.2809 | 0.1261 | |
| EVI | 0.7764 | 0.2386 | 0.1172 | 0.0631 | |
| SAVI | 0.8116 | 0.4086 | 0.2277 | 0.1074 | |
| RedEdge | 0.5685 | 0.2534 | 0.1366 | 0.0590 | |
| LCI | 0.8076 | 0.3580 | 0.1910 | 0.0899 | |
| B | NDVI | 0.6825 | 0.5279 | 0.3563 | 0.2111 |
| GNDVI | 0.7140 | 0.4127 | 0.2307 | 0.1064 | |
| EVI | 0.6212 | 0.3899 | 0.2204 | 0.1157 | |
| SAVI | 0.6808 | 0.5246 | 0.3531 | 0.2088 | |
| RedEdge | 0.5459 | 0.2807 | 0.0815 | 0.0503 | |
| LCI | 0.6736 | 0.3142 | 0.1734 | 0.0838 |
© 2020 by the authors. Licensee MDPI, Basel, Switzerland. This article is an open access article distributed under the terms and conditions of the Creative Commons Attribution (CC BY) license (http://creativecommons.org/licenses/by/4.0/).
Share and Cite
MDPI and ACS Style
Zhao, H.; Yang, C.; Guo, W.; Zhang, L.; Zhang, D. Automatic Estimation of Crop Disease Severity Levels Based on Vegetation Index Normalization. Remote Sens. 2020, 12, 1930. https://doi.org/10.3390/rs12121930
AMA Style
Zhao H, Yang C, Guo W, Zhang L, Zhang D. Automatic Estimation of Crop Disease Severity Levels Based on Vegetation Index Normalization. Remote Sensing. 2020; 12(12):1930. https://doi.org/10.3390/rs12121930
Chicago/Turabian StyleZhao, Hengqian, Chenghai Yang, Wei Guo, Lifu Zhang, and Dongyan Zhang. 2020. "Automatic Estimation of Crop Disease Severity Levels Based on Vegetation Index Normalization" Remote Sensing 12, no. 12: 1930. https://doi.org/10.3390/rs12121930
Note that from the first issue of 2016, this journal uses article numbers instead of page numbers. See further details here.