Abstract
Monitoring variability in outlet glaciers can improve the understanding of feedbacks associated with calving, ocean thermal forcing, and climate change. In this study, we present a remote-sensing investigation of Dalk Glacier in East Antarctica to analyze its dynamic changes. Terminus positions and surface ice velocities were estimated from Landsat and Sentinel-1 data, and the high-precision Worldview digital elevation model (DEM) was generated to determine the location of the potential ice rumple. We detected the cyclic behavior of glacier terminus changes and similar periodic increases in surface velocity since 2000. The terminus retreated in 2006, 2009, 2010, and 2016 and advanced in other years. The surface velocity of Dalk Glacier has a 5-year cycle with interannual speed-ups in 2007, 2012, and 2017. Our observations show the relationship between velocity changes and terminus variations, as well as the driving role of the ice rumple. Ice velocity often increases after calving events and continuous retreats. The loss of buttressing provided by an ice rumple may be a primary factor for increases in ice velocity. Given the restriction of the ice rumple, the surface velocity remains relatively stable when the glacier advances. The calving events may be linked to the unstable terminus caused by the ice rumple.
1. Introduction
The floating ice shelves, which cover over three-quarters of the periphery of Antarctica, play important mechanical roles in buttressing the outlet glaciers of the ice sheet [1,2]. These ice shelves are highly sensitive to a changing climate due to direct contact with the ocean [3,4,5]. Calving events or reductions in thickness of ice shelves have been observed to accelerate upstream tributary glaciers dramatically [6,7], contributing to mean global sea level rise [8,9].
In recent years, many floating ice shelves and outlet glaciers have changed rapidly. Flow acceleration and ice thinning of vast ice shelves have been observed in West Antarctica, much of which is a response to oceanic forcing [10,11,12]. On the Antarctic Peninsula, major ice shelves have collapsed catastrophically and retreated significantly due to warming oceans, rising atmospheric temperatures, and declining sea ice, thereby resulting in the acceleration and thinning of upstream glaciers [6,13,14,15,16]. In East Antarctica, thinning has also been reported in some large ice shelves [10,12,17], and the dynamic changes of several outlet glaciers were confirmed to be related to sea ice conditions, subglacial floods, or intense melting [18,19,20,21]. During the period of 2000–2012, outlet glaciers in Wilkes Land displayed an anomalous signal of ice front retreat [18], which is linked to sea ice changes. The acceleration of Byrd Glacier in 2009 was observed during a lake drainage event [19]. The ice velocity of the Polar Record Glacier, which is sensitive to melt at both the surface and base, increased significantly during 2005–2015 [21]. Most outlet glaciers in East Antarctica are in a relatively stable state with irregular temporal variations (e.g., Totten Glacier) [22] or periodic rebirth of ice tongues (e.g., Mertz Glacier) [23].
Studying changes in outlet glacier dynamics and flow regimes of ice shelves can help understand, quantify, and evaluate their constraining effects on upstream ice flows. Ice shelves in Antarctica lose mass mainly from the calving of icebergs and basal melt, and both are of approximately equal importance across the whole ice sheet [3,12]. Thinning and calving events have been widely investigated along the margins of Wilkes Land [11,18]. In addition, regional outlet glaciers may be susceptible to coupled ocean-climate forcing and various local obstacles, such as ice rises or ice rumples [24,25]. Ice rumples or pinning points are small-scale grounded features, which significantly impact the grounding-zone dynamics and stability of ice shelves [26,27,28]. They provide substantial sources of buttressing to ice shelves, but the process and evolution remain poorly understood [24,29].
To better understand the mechanisms of change in regional outlet glaciers, we use high temporal and spatial resolution multisource satellite data to derive 20-year long time series of terminus changes and velocity variations for Dalk Glacier in East Antarctica. Combining the high-resolution surface elevation from Worldview-1, we determine the location of the ice rumple that buttresses upstream ice flow and affects glacier terminus stability.
2. Study Site
Dalk Glacier (69°25′ S, 76°27′ E), or Dålk Glacier, is a 15 km-long outlet glacier located in the Ingrid Christensen Coast, East Antarctica (Figure 1). It drains into the southeast part of Prydz Bay between the Larsemann Hills and Steinnes, forming a floating ice tongue that is approximately 8 km long and 3 km wide.
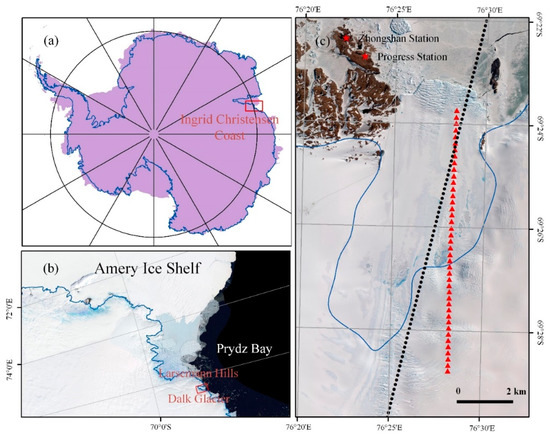
Figure 1.
(a) and (b) show the location of Dalk Glacier along the Ingrid Christensen Coast, East Antarctica. (c) An overview of Dalk Glacier. The background is a Worldview-2 image acquired on 2 January 2016. Blue lines indicate the location of the grounding line. Black dots are ICESat/GLAS altimeter data from 19 March 2008. Red triangle points are radio-echo sounding data acquired in 1990/91.
Previous studies have focused on the morphology and ice velocity of Dalk Glacier [30,31,32], but research on the long-term dynamic changes and driving forces is limited. Landsat and Radarsat images were used to monitor the terminus locations in 1973–1997, and a frontal disintegration was discovered in 1988. The average annual velocity for 1990–1997 was 190.55 m a−1 at the front of Dalk Glacier [30]. During the 21st and 24th Chinese National Antarctic Research Expeditions, several monitoring marks were placed on the surface of the glacier by helicopters. Surface velocities from 2007 to 2012 were evaluated based on the forward intersection method, and no obvious yearly ice-flow increases were found [32]. During this interval, seasonal velocity changes and ice-flow acceleration were observed in 2009 when an ice-calving event occurred [33]. Dalk Glacier showed alternating patterns between advance and retreat from 2000 to 2016 [31].
3. Data
We employed multisource satellite data to study the changes in terminus positions and surface ice velocities of Dalk Glacier in 2000–2019 (Table 1). Images acquired by the Enhanced Thematic Mapper Plus (ETM+) mounted on Landsat 7 and the Operational Land Imager mounted on Landsat 8 were used to investigate the annual ice velocity of Dalk Glacier. All Landsat images were obtained during the austral summer and with cloud cover under 10%. The monthly surface velocities were measured from 20 scenes of Sentinel-1 synthetic aperture radar (SAR) images acquired from August 2016 to September 2017. The Reference Elevation Model of Antarctica (REMA) dataset [34] was used as the reference DEM for geocoding and coregistering the Sentinel-1 imagery employed in the intensity offset tracking technique. The freely available Global Land Ice Velocity Extraction from Landsat (GoLIVE) dataset [35] from October 2015 to February 2017 was used as a supplement to the calculated surface velocities. All cloud-free Landsat images acquired between 2000 and 2019, and Sentinel-1 images acquired between August 2016 and September 2017 were employed to map glacier margins and extract terminus positions.

Table 1.
Multiple sensors for glacier terminus and surface velocity.
We used the 0.5 m-resolution stereo panchromatic dataset acquired by Worldview-1 on 6 October 2015 to generate surface elevations of Dalk Glacier. The altimeter data (GLA12 L2 Global Altimetry Data Version 34) [36] from the NASA ICESat GLAS instrument, acquired in 2004–2008, and the REMA dataset were used to validate the Worldview DEM (WVDEM). To evaluate the floating condition of the ice tongue, we used airborne radio-echo sounding (RES) measurements acquired in 1990/91 from the Australian Antarctic Data Centre (AADC) [37] to analyze the difference between the actual ice thickness and the equivalent ice thickness calculated from surface elevation.
4. Methods
4.1. Terminus Position
The terminus positions of Dalk Glacier were delineated, and changes were estimated using the Landsat 7 ETM+ and Landsat 8 OLI panchromatic band images and Sentinel-1 intensity images. The glacier terminus was detected manually based on the different reflectances of the ice front, sea ice, and seawater. After mapping the terminus, temporal variations in the terminus position were calculated using the common box method [38]. This method used an open-ended box that approximately delineated the sides of the glacier to calculate the glacier area in this box, with a chosen reference line and the terminus as its upper and lower ranges. Temporal variations in the terminus position were estimated by dividing the calculated glacier area by the width of the box.
Errors in the terminus positions were mainly caused by inaccuracy in the mapping of the glacier terminus. All Landsat images were accurately coregistered with the Landsat 8 image in 2017 during preprocessing. The errors in the terminus positions were controlled within one pixel (<15 m).
4.2. Surface Velocity
4.2.1. Velocity from Landsat
We tracked features in pairs of Landsat images acquired in austral summer at approximately one-year intervals during 2000–2019 to calculate the annual horizontal displacement of Dalk Glacier using the COSI-Corr (Co-registration of Optically Sensed Images and Correlation) [39,40]. The scan gaps, which account for approximately 22% of SLC-Off Landsat 7 images, were filled using a local linear histogram matching technique [41]. High-precision coregistration of Landsat 7 images was performed manually using the Landsat 8 image acquired in 2013 as the reference. The well-distributed tie points (30–50) were carefully selected and optimized from stationary features, such as bedrock outcrops or slow-moving (0–10 m a−1) areas. Once the above preprocessing was completed, cross-correlation analysis was performed by a Fourier-based frequency correlator to extract displacements along the East/West (X) and North/South (Y) directions. The cross-correlation process was iteratively conducted from a large search window to a smaller window. To ensure the efficiency of this operation and the accuracy of matching, we determined the optimal window sizes after extensive tests. The sizes of the initial search window (tracking patch) and the final window were finally set as 256 × 256 and 64 × 64 pixels, respectively. The tracking step was set as 8 pixels in both the X and Y directions, which means that the resolution of the velocity map is 120 × 120 m.
4.2.2. Velocity from Sentinel-1
To retrieve monthly surface velocities over Dalk Glacier, we used the GAMMA software [42,43] to apply the intensity offset tracking algorithm [44] with 20 scenes of Sentinel-1 synthetic aperture radar (SAR) images acquired from August 2016 to September 2017. The fine coregistration and deramping procedures are required before offset tracking [42,45]. We adopted a coregistration strategy that considers the topography (REMA). After obtaining the DEM in SAR coordinates, we derived the coregistration lookup table, which was then refined by correcting the offset between the transformed master and slave images. The optimized lookup table and offset polynomials estimated by matching algorithm were used to coregister the image pairs, and the residual offsets were confined within 0.02 pixels. Subsequently, we deramped each TOPS-mode data for the azimuth spectrum ramp before applying oversampling. In the offset tracking process, different search windows were tested, and the window size of 640×128 pixels was finally selected. The tracking step was set as 100×20 pixels in the range and azimuth directions. We used REMA to geocode velocity maps with a bicubic-log spline interpolation and regularize the velocity field into a 200 m grid.
4.2.3. Filtering and Calibration
Erroneous matches are common in raw velocity fields obtained from feature tracking or offset tracking. We used a statistical filtering methodology to remove mismatches [46]. First, we computed the median and interquartile range (IQR) from the raw two-direction displacement fields in patches (5 × 5 pixels). Speed greater than 0.5-fold IQR from the median was discarded in each patch. The mean displacement field (dx and dy) and the gradient threshold (σdx and σdy) were estimated from the remaining values. Finally, raw velocity fields with σdx and σdy larger than 30 m were discarded.
Despite the high geolocation accuracy of Landsat images, residual geolocation errors (3–10 m for Landsat 8) introduce some offsets into the tracking algorithm [47]. We used the method reported by Fahnestock et al. [47] to correct the potential biases in the velocity maps caused by geolocation errors. This method takes advantage of the fact that most geolocation errors between multi-temporal Landsat 8 images are presented as plane shifts. We calculated the average X and Y displacement on the ice-free stable ground (exposed bedrocks). The X and Y shifts were then performed to calibrate each velocity field. Given that we coregistered the Landsat 7 images to Landsat 8, we simply calibrated all Landsat velocities using the same method.
4.2.4. Error Analysis and Time Series Extraction
The errors of final surface velocity are strongly dependent on coregistration accuracy and time intervals between images in a pair [47,48]. We analyzed velocity errors by testing image pairs with different time intervals and from varying sensors. Similar to Wendleder et al. [49], the error and corresponding standard deviation (±1σ) of each surface ice velocity were calculated by extracting residual speed at widely distributed non-moving points over the exposed bedrocks. Given the different spatial coverage of sensors, the number of control points varied from 100 for Landsat to 200 for Sentinel-1. Table 2 shows the mean velocity errors for each sensor and time interval.
Table 2.
Errors analysis of surface velocities averaged for each sensor and time interval.
We used three rectangular boxes (approximately 1 km × 1 km) to extract and analyze the ice velocity time series of different regions at Dalk Glacier. The front region (FT), grounding line region (GL), and upstream region (UP) are located between 8 and 9 km downstream, −0.5 and 0.5 km, and 2 and 3 km upstream from the grounding line, respectively. The FT region is located behind the southernmost terminus position. We used this region selection strategy to obtain effective velocity values and improve the credibility of the variation analysis.
4.3. Surface Elevation and Ice Thickness
The Worldview DEM (WVDEM) was generated using the LPS (IMAGINE Photogrammetry) tool in ERDAS Imagine. The ancillary data provided with the images were imported to obtain the initial orientation of each image. Tie points were generated automatically with a search size of 81 pixels in most areas and added manually in large slope regions. The final DEM with 5 m resolution was extracted and improved after iterative point collection and rational function refinement. The calculated WVDEMs were geodetic heights, which were relative to the WGS84 ellipsoid. We used the ICESat data acquired in 2008 and the REMA dataset to validate the WVDEM. In comparison with REMA, we analyzed the differences in the range of the entire scene and the ice tongue. All mean differences and standard deviations are shown in Table 3.
Table 3.
Accuracy analysis of the Worldview DEM.
To assess the floating conditions, the ice thickness of Dalk Glacier was estimated using the WVDEM. On the basis of the principle of hydrostatic equilibrium (HE), the ice thickness of the free-floating ice tongue at Dalk Glacier can be determined from its freeboard height [50]:
where Z is the ice thickness, hfb is the freeboard height, hfn is the firn density correction, ρw is the density of seawater, and ρi is the ice density. The densities of seawater and ice were set as 1027 and 917 kg m−3, respectively [51]. The firn density correction was adopted from a firn densification model (FDM) and resampled to 1 km grid spacing [52,53]. The freeboard height was calculated by subtracting the local sea surface geodetic height, which was the mean height in the bay measured by ICESat during 2004–2008, from the WVDEM.
5. Results
5.1. Terminus Positions and Calving Events
Figure 2 indicates that Dalk Glacier presents an alternating pattern between advance and retreat from 2003 to 2017. The glacier terminus retreated in 2006, 2009, 2010, and 2016 and advanced in other years. Taking the first year of continuous advance as the dividing year, we categorized terminus position changes from 2003 to 2017 into three stages. The periods from 2003 to 2007 and from 2011 to 2017 belonged to the same type, in which large areas of glacial ice disintegrated after 3–5 years of terminus advance. The readvance was interrupted by sporadic calving events in the stage from 2007 to 2011. We monitored the minimum glacier extent in 2011 (31.24 km2) and the maximum glacier extent (33.55 km2) in 2016. The most significant retreat occurred in 2016, with an area reduction of approximately 2.19 km2. Massive icebergs calved in February and March 2016, and subsequent fragmentation during the austral winter led to the largest area loss in this period.
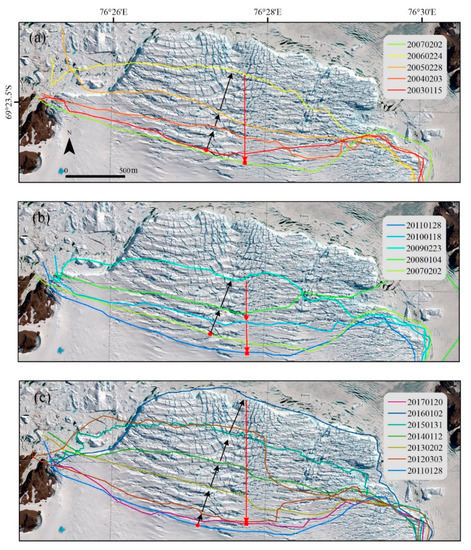
Figure 2.
Three advance and retreat stages of Dalk Glacier during 2003–2017. The background is the Worldview-2 image acquired on 2 January 2016. The black arrows represent the glacier advance, while the red arrows represent the terminus retreat.
Many calving events were observed from 2000 to 2019. Multisource satellite images between 11 January 2016 and 7 September 2016 illustrated the evolution of calving events in 2016 (Appendix A Figure A1). In the initial stage, an east section (~1.1 km2) of ice had broken away from the ice front before 28 February. An approximately 0.6 km2 section of the western ice tongue disintegrated before 31 March 2016. Throughout the austral winter of 2016, the terminus of Dalk Glacier had no evident calving until 31 August. For 19–31 August 2016, significant fracturing in the glacier terminus occurred, which caused a considerable amount of ice to break up, and a large amount of ice mélange formed in the glacier fjord. The preferential disintegration on the east side of the ice front may be related to the near-shore current from east to west.
5.2. Surface Velocity
From Landsat 7/8 and Sentinel-1 images, we obtained 15 annual ice velocity results between 2000 and 2019 and 13 monthly ice velocity results from August 2016 to September 2017. Given the lack of suitable images, the annual ice velocities for 2001, 2002, 2003, 2010, and 2013 are missing in our study. We find that long interval pairs in the tracking algorithm lead to small errors in the final surface velocity (Table 2). The mean errors of the Sentinel-1 velocity derived from image pairs with 12 and 24-day intervals are 7.62 and 4.03 m a−1, respectively. The errors of the Landsat 8 velocity with intervals of 352 and 368 days are 2.24 and 1.73 m a−1, respectively, while the Landsat 7 velocity errors with the same time intervals are 5.63 and 3.92 m a−1, respectively. The accuracy of ice velocity calculated from Landsat 8 is higher than that extracted from Landsat 7. The magnitude of these velocity errors is comparable with those reported in the scientific literatures [49,54].
The surface velocity maps show the flow characteristics of Dalk Glacier (Figure 3): the ice stream narrows as it crosses the grounding line, forming a floating ice tongue with a mean speed of ~170 m a−1 and a maximum speed at the terminus of ~220 m a−1. Another relatively fast ice flow in the upstream region appears approximately 1 km away from the grounding line. We failed to estimate the ice velocity in the west side and southeastern convergence regions of Dalk Glacier, which may be caused by the turning of the ice stream and steep terrain.
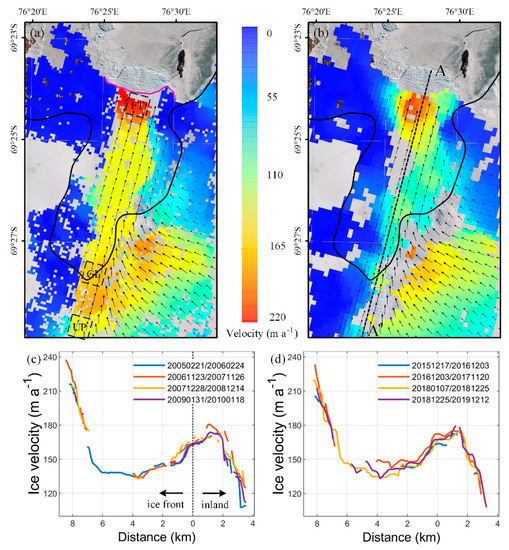
Figure 3.
Surface ice velocity at Dalk Glacier. (a) Surface velocity map derived from Landsat 7 images (20050221/20060224). The black and pink lines are the grounding line and southernmost terminus position on 28 January 2011. The black dashed rectangular boxes are regions for temporal velocity analysis. (b) Surface ice velocity derived from Sentinel-1 images (20160807/20160831). AA’ is the location of the centerline profile. (c) and (d) are interannual velocity variations along AA’ before and after large calvings in 2006 and 2016, respectively. The black dashed line shows the position of the grounding line.
The annual velocity profiles along the centerline (AA’) that were calculated for 2005–2009 and 2015–2019 reveal the interannual velocity variation before and after large calving events in 2006 and 2016 (Figure 3). The largest velocities of Dalk Glacier reached ~230 m a−1 at the terminus in 2007 and 2017. We found that the surface velocity in 2005–2009 and 2015–2019 showed similar interannual change patterns, with a speedup in the years (2007 and 2017) following large calvings (2006 and 2016). It slowed down to the pre-calving speed in the subsequent years. The velocity fluctuation of the glacier front was significant, whereas the change in the grounding area was small.
To further examine the interannual and seasonal velocity changes, we analyzed the time series of the averaged speeds of three chosen regions (Figure 4). For the years 2000 to 2019, we observed interannual changes in all three regions of Dalk Glacier. Significant velocity increases of approximately 25 ± 3.9 m a−1 (~12%) in the FT region in 2007, 2012, and 2017 were observed, while the velocities of the GL and UP regions increased by approximately 10 ± 8.7 m a−1 (~6%) in 2012. In 2017, the velocity of the GL and UP regions increased slightly.
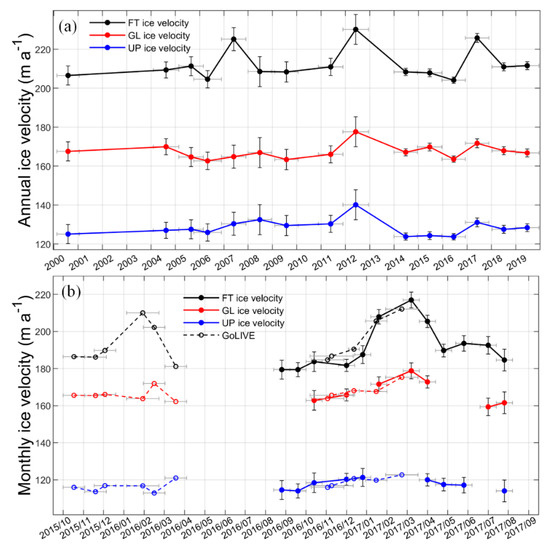
Figure 4.
Variations in the ice velocity of Dalk Glacier. (a) Interannual velocity changes at the front (FT), grounding line (GL), and upstream (UP) regions in 2000–2019. (b) Seasonal velocity variations from October 2015 to September 2017. Vertical bars are error bars and horizontal bars are temporal baselines of the image pairs used in velocity calculation.
On the basis of the GoLIVE dataset from October 2015 to February 2017 and the Sentinel-1 monthly velocities from August 2016 to September 2017 (Figure 4b), we found that the ice velocity at Dalk Glacier had a significant increase in the austral summer. The GoLIVE dataset matched well with our Sentinel-1 velocity at monthly scale. From the austral spring in 2015 to winter 2016, the FT region began to accelerate in November 2015 and reached its maximum in February 2016. From August 2016 to September 2017, the ice velocity increased from October/November 2016, peaked in March 2017, and decreased rapidly from March to May 2017. In addition, the summer acceleration of Dalk Glacier increased after calving events. In 2015/2016, the seasonal velocity fluctuations of the FT and GL regions were ~30 (~16%) and ~10 m a−1 (~6%), respectively. The Sentinel-1 monthly velocities showed a seasonal acceleration of ~35 ± 6.6 (~19%) and ~15 ± 6.6 m a−1 (~9%) in the FT and GL regions, respectively, in 2016/2017.
5.3. Elevations and Ice Rumple
Figure 5a illustrates the surface elevation of Dalk Glacier (WVDEM) derived from the Worldview in-track stereo image pair. The glacier surface elevation ranges from 50 m to 550 m. The ice tongue is relatively flat at approximately 100–130 m. The topography of Dalk Glacier differs significantly between the east and west. The east side of the glacier is steeper than the west side, and the west side of the glacier has many exposed rocks near the coastline. The agreement between the WVDEM and REMA was highest in low-slope areas (Figure 5b). Abnormal elevation pixels with approximately 20 m errors appeared in steep regions, mostly in the eastern part of Dalk Glacier. In comparison with REMA, the mean difference and standard deviation were −1.23 and 5.94 m (Table 3), respectively, over the whole scene, but 0.47 and 1.6 m, respectively, at the ice tongue.
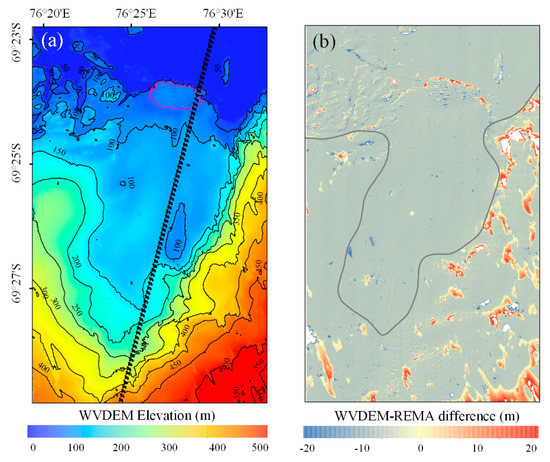
Figure 5.
(a) Surface elevation of Dalk Glacier. Black lines are contours with 50-m intervals. Black dots are footprints of ICESat data. The pink line donates the possible ice rumple border. (b) Elevation difference between WVDEM and the Reference Elevation Model of Antarctica (REMA). The grey line shows the position of the grounding line.
From the WVDEM, we detected a small “ice bump” (~2 km × 1 km) at the front portion of Dalk Glacier. The enlarged view of this special landscape is shown in Figure 6. Along the longitudinal profile (BB’), the upstream surface elevation decreased from 110 m to 65 m and then increased by approximately 30 m. The elevation of the inflection point where the surface terrain changed from descent to ascent was ~65 m. Thus, we used the 65 m contour as a threshold to extract the possible range of the “ice bump”. From the surface elevation and flow characteristics, we speculate that the “ice bump” is an ice rumple. First, it is very small and rises only a few tens of meters. Second, the ice tongue flows across it without stagnation. These features are typical of ice rumples in Antarctica [24].
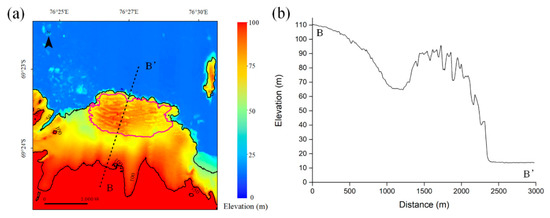
Figure 6.
Overview of the ice rumple at the terminus of Dalk Glacier. (a) DEM of the glacier terminus at Dalk Glacier. (b) Elevation along the longitudinal profile (BB’). The pink line shows the possible range of the ice rumple.
To confirm the ice rumple further, we analyzed the floating status and potential pinning points of the ice front. When the bottom of the ice tongue comes into contact with the pinning point or bedrock, the ice rumple forms on the upper surface [27]. We evaluated the floating status by comparing the equivalent ice tongue thickness calculated based on the HE assumption and the historical airborne radio-echo sounding (RES) measurements of the actual ice thickness (Figure 7). The HE assumption is valid if the ice tongue is freely floating. Therefore, the anomalous ice tongue area with a large difference between the equivalent ice thickness and the actual ice thickness can be regarded as the grounded region. Given that the error of the WVDEM at the ice tongue is < 4 m and ±1–3 m FDM error in coastal areas [53], the accuracy of the WVDEM-derived ice thickness is better than 44.76 m based on error propagation. Considering the uncertainty of RES (~75 m) [37] and statistics of the differences between equivalent ice thickness and RES data in AIS (mean error minus three times the standard deviation is −209.45 m) [55], we used the large threshold of ±209.45 m to estimate the ice thickness anomaly area. As illustrated in Figure 7, the HE assumption breaks down at the terminus, which demonstrates possible frontal pinning points and a grounding ice rumple.
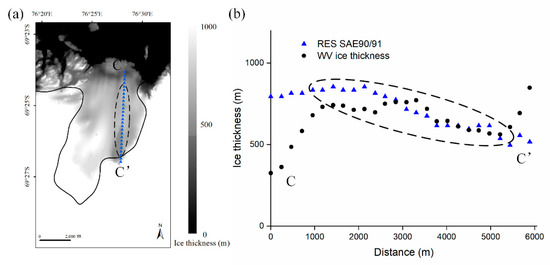
Figure 7.
(a) Ice thicknesses of Dalk Glacier derived from WVDEM. Triangle points denote the locations of radio-echo sounding (RES) data. Points in black ellipsoid indicate floating regions, while others reveal grounded regions. (b) Comparison between RES and WVDEM-derived ice thickness. Points in black ellipsoid correspond to points marked with ellipsoid in (a).
5.4. Linkage between Terminus Change, Velocity Variation, and Ice Rumple
Our analyses indicate that the acceleration of Dalk Glacier is correlated with the terminus retreat (Figure 8a). During the retreat stage, Dalk Glacier usually underwent major disintegrations within 1 year (2006 and 2016) or sporadic disintegrations that can last for 2 years (2009–2010). In 2007, 2011, and 2017, the increase in the speed of the FT region occurred when the terminus retreated to a similar position (6.7–6.9 km). The accelerations of GL and UP areas in 2012 and 2017 were also likely to be related to calving events. In the advancing stage of the glacier, the FT ice velocity usually decreased to pre-calving rates and then remained relatively stable. The surface velocity at the glacier front decreased by approximately 20 ± 4.3 m a−1 in 2008, 2014, and 2018, while no significant change was observed in speeds from 2009 to 2011, 2014 to 2016, and 2018 to 2019. Therefore, the interannual velocity variations and terminus changes of Dalk Glacier presented similar periodicity (approximately 5 years).
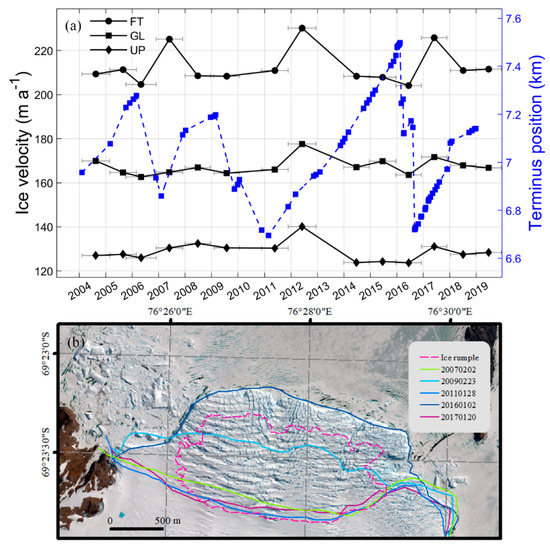
Figure 8.
Link between terminus change, velocity variation, and ice rumple. (a) Terminus changes and velocity variations of Dalk Glacier in 2004–2017. Short grey lines donate the overlay time of image pairs used in velocity calculation. (b) Positions of glacier terminus and the ice rumple. The pink dotted line shows the possible range of the ice rumple. Colored solid lines are the maximum and minimum glacier extents for each advance and retreat phase.
Our observations also demonstrated the possible link between the ice rumple and the terminus changes (Figure 8b). The ice rumple blocked the ice flow, forming transverse crevasses and weakening the stability of the glacier terminus. Consequently, periodic calving events occurred. By analyzing the maximum glacier extent in each cycle, we found that retreat or calving usually occurred when the terminus advanced to the seaward edge of the ice rumple. The minimum glacier extent in each cycle shows that the terminus eventually retreats to the landward edge of the ice rumple.
6. Discussion
The Sentinel-1 mission has allowed nearly continuous monitoring of Dalk Glacier since 2016, offering the capability of detecting calving events in polar night and seasonal or sub-seasonal velocity fluctuations. The combination of optical data and SAR data not only overcomes the effects of cloud and night but also improves the details of change detection. Stereo images from Worldview-1 are particularly successful in obtaining high-precision and high-resolution DEM without control points, which can be utilized to investigate the complete ice tongue elevation at a specific moment and the first observation of the ice rumple range at the front of Dalk Glacier.
Our results are in good agreement with the previous assessment of changes in the terminus and ice flow of Dalk Glacier [31,33]. Liu et al. [31] analyzed the terminus positions and observed the pattern of alternating between advance and retreat. Our study confirmed their observations and added more details to the terminus positions between 2000 and 2019. Relatively large disintegrations occurred in 2006 and 2016, resulting in the significant retreats of the terminus, while sporadic disintegrations were observed from 2009 to 2011. We found a 3–5 year calving cycle of the ice tongue. Besides, we observed that the terminus also disintegrated many times between austral summer and winter in 2016. Ai et al. [33] found seasonal velocity changes at the glacier front from 2007 to 2012. This conclusion agreed with our observed seasonal velocity fluctuations. In the summers from 2015 to 2017, the ice flow of the ice tongue accelerated. Previous surface velocity studies focused only on short time series and single events. However, our studies, based on multisource remote sensing data, investigated the continuous, long-term interannual velocity time series and analyzed the detailed sub-seasonal velocity changes before and after the calving events. Our results show that the interannual glacier speedup underlies a 5-year cycle. In 2007, 2012, and 2017, the annual velocity of the glacier front increased. After the disintegrations in 2016, we also detected that the seasonal speed fluctuations increased by ~4.5%.
The surface velocity of Dalk Glacier showed significant seasonal variations. According to other studies of ice shelves and glaciers in East Antarctica, the increased velocities in the austral summer are very likely related to sea ice conditions. The seasonal variability of the Totten ice shelf has been confirmed to be closely linked to the presence of sea ice at the ice shelf front [56]. Liang et al. [21] also reported that the seasonal velocity variations of the Polar Record Glacier (PRG) are affected by the change of sea ice. PRG and Dalk Glacier are just ~50 kilometers apart, and they are both located in Prydz Bay. Considering the similar sea ice conditions at the front of neighboring glaciers, we suppose that the seasonal velocity change of Dalk Glacier is also affected by the sea ice change.
The analysis of interannual velocity variations and terminus position changes indicates that the speedup of Dalk Glacier is correlated with the terminus retreat. The accelerations in 2007 and 2017 were linked to major disintegrations in 2006 and 2016, whereas the surface velocity increased in 2012 after continuous small-scale calvings in 2009 and 2010. The commonality of these acceleration phenomena is that the terminus undergoes a large magnitude of retreat and detaches from the observed ice rumple. We suspect that the acceleration after the terminus retreated to the landward edge of the ice rumple is resulted from the reduced buttressing of the ice rumple. Few studies have reported the impact of ice rumples on glacier flow, which may considerably buttress ice tongues and ice shelves [24], and retreat from regions of similar resistance elsewhere have led to accelerated ice flow [56]. Thus, we attribute the interannual acceleration of Dalk Glacier to the loss of buttressing from the separation of terminus and the ice rumple.
Observations in this study demonstrate that the ice rumple plays an important role in the frequent ice-dynamical changes of Dalk Glacier. Under the impact of the ice rumple, interannual ice-flow accelerations and terminus position changes in Dalk Glacier have similar periodic patterns. The ice rumple influences the change in surface velocity. As mentioned above, the cycle acceleration is related to the periodic non-contact of this pinning point. The ice rumple also provides a significant constraint effect for the Dalk ice tongue. Callens et al. [26] reported that several ice rises and pinning points in West Ragnhild Glacier make its ice shelf locally grounded, which dominate the dynamics and ensure stability by providing buttressing and slowing down the flow upstream. In our cases, the ice rumple restrained and slowed down the Dalk ice tongue during the period of sustained terminus advance. As the ice tongue regained its advance and started contact with the ice rumple, the ice velocity gradually decreased to its pre-calving rates. In the years 2008–2011, 2013–2016, and 2018–2019, the increased terminus velocity decreased by about 20 ± 4.3 m a−1 in the first year and remained relatively stable in other years. The terminus position change is also linked to the ice rumple. Since the ice rumple is a locally elevated feature and located near the terminus, the stress generated in the locations where the ice contacts the rumple enhances ice fracture, as evident in the along-flow changes in crevassing in Figure 6b. Although uncertainties exist in the method of extracting the ice rumple range using a single surface elevation, the impact of ice rumple on the terminus change is still evident. The southernmost terminus position in each cycle is near the landward edge of the ice rumple, while the northernmost terminus position is also limited. The 3–5 year calving cycle of Dalk Glacier is mainly controlled by the ice rumple. Calving is a complex process influenced by several factors, including atmospheric, oceanographic, and glaciological forcing [57]. The intrusion of warm modified circumpolar deep water (mCDW) into Prydz Bay [58,59] and a strong peak in ocean temperatures in 2010 at the neighboring PRG [21] were observed. These independent observations of ocean warming suggest that oceanic forcing was the possible cause of the sporadic disintegrations in 2009 and 2010.
7. Conclusions
In this study, a comprehensive overview of dynamic changes in Dalk Glacier since 2000 was performed using multisource satellite data. The measurements of the glacier terminus position and surface velocity were conducted. In 2000–2019, the alternation between the advances and retreats of calving fronts, significant interannual accelerations, and increased seasonal fluctuations in surface velocity were monitored. Our results show the cyclic behavior of Dalk Glacier changes. The terminus position underlies a 3–5 year cycle, with the glacier retreating in 2006, 2009, 2010, and 2016 and advancing in other years. The surface velocity of Dalk Glacier underlies a 5-year cycle with interannual speed-ups in 2007, 2012, and 2017. Our study indicates that surface velocity changes at Dalk Glacier have a certain relationship with its terminus positions. The speedup often occurs after calving events and retreats. In addition, disintegrations contribute to the loss in buttressing of the ice rumple and cause corresponding increases in the velocities of different regions.
Our study highlights the strong response of the dynamics of Dalk Glacier to locally grounding features. We found a kilometer-sized frontal ice rumple in Dalk Glacier that provides a significant buttressing effect and affects the terminus changes and surface velocity. The terminus of Dalk Glacier usually continues to retreat to the landward edge of the ice rumple region, followed by a significant increase in surface velocity. The restriction of the ice rumple causes the relatively stable speed in the glacial advance phases. Influenced by the ice rumple, the interannual velocity increases, and terminus variations have similar periodic patterns. We found that the calving of Dalk Glacier was influenced by the ice rumple. Normally, calving events occur when the ice tongue covers the complete ice rumple region, and the evolution is affected by coastal ocean current erosion.
Author Contributions
Y.C. and C.Z. jointly designed the study. Y.C. conducted the surface velocity and DEM calculations, wrote large parts of the manuscript, and compiled all figures. C.Z. helped to improve the analysis and the glaciological interpretation of the data. S.A. provides the interpretation of the ice rumple. Q.L. and L.Z. helped to improve the manuscript. R.L. mapped all glacier fronts. H.L. helped to analyze the ice thickness. All authors have read and agreed to the published version of the manuscript.
Funding
This work was funded by the National Natural Science Foundation of China (No. 41776200, 41531069 and 41941010), and the National Key Research and Development Program of China (2018YFC1406102).
Acknowledgments
We acknowledge the European Space Agency for providing Sentinel-1 data. Landsat imagery was provided by the US Geological Survey Earth Resources Observation Science Center. The Worldview images were purchased from DigitalGlobe. The GLAS/ICESat L2 altimeter data was distributed by the National Snow and Ice Data Center Distributed Active Archive Center. Airborne radio-echo sounding (RES) measurements can be accessed using the Australian Antarctic Data Centre. The meteorological observation data sets were kindly provided by the Chinese National Arctic and Antarctica Data Center.
Conflicts of Interest
The authors declare no conflict of interest.
Appendix A

Figure A1.
Landsat 8 and Sentinel-1 imagery showing the evolution of the largest calving event in 2016. The red dashed line shows the terminus position on 22 January 2017.
References
- Dupont, T.K.; Alley, R.B. Assessment of the importance of ice-shelf buttressing to ice-sheet flow. Geophys. Res. Lett. 2005, 32. [Google Scholar] [CrossRef]
- Fürst, J.J.; Durand, G.; Gillet-Chaulet, F.; Tavard, L.; Rankl, M.; Braun, M.; Gagliardini, O. The safety band of Antarctic ice shelves. Nat. Clim. Chang. 2016, 6, 479–482. [Google Scholar] [CrossRef]
- Depoorter, M.A.; Bamber, J.L.; Griggs, J.A.; Lenaerts, J.T.; Ligtenberg, S.R.; van den Broeke, M.R.; Moholdt, G. Calving fluxes and basal melt rates of Antarctic ice shelves. Nature 2013, 502, 89–92. [Google Scholar] [CrossRef] [PubMed]
- Lenaerts, J.T.M.; Lhermitte, S.; Drews, R.; Ligtenberg, S.R.M.; Berger, S.; Helm, V.; Smeets, C.J.P.P.; van den Broeke, M.R.; van de Berg, W.J.; van Meijgaard, E.; et al. Meltwater produced by wind-albedo interaction stored in an East Antarctic ice shelf. Nat. Clim. Chang. 2016, 7, 58–62. [Google Scholar] [CrossRef]
- Reese, R.; Gudmundsson, G.H.; Levermann, A.; Winkelmann, R. The far reach of ice-shelf thinning in Antarctica. Nat. Clim. Chang. 2017, 8, 53. [Google Scholar] [CrossRef]
- Scambos, T.A.; Bohlander, J.A.; Shuman, C.A.; Skvarca, P. Glacier acceleration and thinning after ice shelf collapse in the Larsen B embayment, Antarctica. Geophys. Res. Lett. 2004, 31. [Google Scholar] [CrossRef]
- De Rydt, J.; Gudmundsson, G.H.; Rott, H.; Bamber, J.L. Modeling the instantaneous response of glaciers after the collapse of the Larsen B Ice Shelf. Geophys. Res. Lett. 2015, 42, 5355–5363. [Google Scholar] [CrossRef]
- Shepherd, A.; Wingham, D.; Wallis, D.; Giles, K.; Laxon, S.; Sundal, A.V. Recent loss of floating ice and the consequent sea level contribution. Geophys. Res. Lett. 2010, 37. [Google Scholar] [CrossRef]
- Gudmundsson, G.H.; Paolo, F.S.; Adusumilli, S.; Fricker, H.A. Instantaneous Antarctic ice sheet mass loss driven by thinning ice shelves. Geophys. Res. Lett. 2019, 46, 13903–13909. [Google Scholar] [CrossRef]
- Pritchard, H.D.; Arthern, R.J.; Vaughan, D.G.; Edwards, L.A. Extensive dynamic thinning on the margins of the Greenland and Antarctic ice sheets. Nature 2009, 461, 971–975. [Google Scholar] [CrossRef]
- Paolo, F.S.; Fricker, H.A.; Padman, L. Volume loss from Antarctic ice shelves is accelerating. Science 2015, 348, 327–331. [Google Scholar] [CrossRef]
- Rignot, E.; Jacobs, S.; Mouginot, J.; Scheuchl, B. Ice-shelf melting around Antarctica. Science 2013, 341, 266–270. [Google Scholar] [CrossRef] [PubMed]
- Vaughan, D.G.; Marshall, G.J.; Connolley, W.M.; Parkinson, C.; Mulvaney, R.; Hodgson, D.A.; King, J.C.; Pudsey, C.J.; Turner, J. Recent rapid regional climate warming on the Antarctic Peninsula. Clim. Chang. 2003, 60, 243–274. [Google Scholar] [CrossRef]
- Vaughan, D.G.; Doake, C.S.M. Recent atmospheric warming and retreat of ice shelves on the Antarctic Peninsula. Nature 1996, 379, 328–331. [Google Scholar] [CrossRef]
- Meredith, M.P.; King, J.C. Rapid climate change in the ocean west of the Antarctic Peninsula during the second half of the 20th century. Geophys. Res. Lett. 2005, 32. [Google Scholar] [CrossRef]
- Stammerjohn, S.E.; Martinson, D.G.; Smith, R.C.; Yuan, X.; Rind, D. Trends in Antarctic annual sea ice retreat and advance and their relation to El Niño–Southern Oscillation and Southern Annular Mode variability. J. Geophys. Res. 2008, 113. [Google Scholar] [CrossRef]
- Pritchard, H.D.; Ligtenberg, S.R.; Fricker, H.A.; Vaughan, D.G.; van den Broeke, M.R.; Padman, L. Antarctic ice-sheet loss driven by basal melting of ice shelves. Nature 2012, 484, 502–505. [Google Scholar] [CrossRef]
- Miles, B.W.J.; Stokes, C.R.; Jamieson, S.S.R. Pan-ice-sheet glacier terminus change in East Antarctica reveals sensitivity of Wilkes Land to sea-ice changes. Sci. Adv. 2016, 2, e1501350. [Google Scholar] [CrossRef]
- Stearns, L.A.; Smith, B.E.; Hamilton, G.S. Increased flow speed on a large east antarctic outlet glacier caused by subglacial floods. Nat. Geosci. 2008, 1, 827–831. [Google Scholar] [CrossRef]
- Rignot, E.; Mouginot, J.; Scheuchl, B.; van den Broeke, M.; van Wessem, M.J.; Morlighem, M. Four decades of Antarctic Ice Sheet mass balance from 1979–2017. Proc. Natl. Acad. Sci. USA 2019, 116, 1095–1103. [Google Scholar] [CrossRef]
- Liang, Q.; Zhou, C.; Howat, I.M.; Jeong, S.; Liu, R.; Chen, Y. Ice flow variations at Polar Record Glacier, East Antarctica. J. Glaciol. 2019, 65, 279–287. [Google Scholar] [CrossRef]
- Li, X.; Rignot, E.; Mouginot, J.; Scheuchl, B. Ice flow dynamics and mass loss of Totten Glacier, East Antarctica, from 1989 to 2015. Geophys. Res. Lett. 2016, 43, 6366–6373. [Google Scholar] [CrossRef]
- Giles, A.B. The Mertz Glacier Tongue, East Antarctica. Changes in the past 100 years and its cyclic nature-Past, present and future. Remote Sens. Environ. 2017, 191, 30–37. [Google Scholar] [CrossRef]
- Matsuoka, K.; Hindmarsh, R.C.A.; Moholdt, G.; Bentley, M.J.; Pritchard, H.D.; Brown, J.; Conway, H.; Drews, R.; Durand, G.; Goldberg, D.; et al. Antarctic ice rises and rumples: Their properties and significance for ice-sheet dynamics and evolution. Earth-Sci. Rev. 2015, 150, 724–745. [Google Scholar] [CrossRef]
- Gulick, S.P.S.; Shevenell, A.E.; Montelli, A.; Fernandez, R.; Smith, C.; Warny, S.; Bohaty, S.M.; Sjunneskog, C.; Leventer, A.; Frederick, B.; et al. Initiation and long-term instability of the East Antarctic Ice Sheet. Nature 2017, 552, 225–229. [Google Scholar] [CrossRef]
- Callens, D.; Matsuoka, K.; Steinhage, D.; Smith, B.; Witrant, E.; Pattyn, F. Transition of flow regime along a marine-terminating outlet glacier in East Antarctica. Cryosphere 2014, 8, 867–875. [Google Scholar] [CrossRef]
- Favier, L.; Gagliardini, O.; Durand, G.; Zwinger, T. A three-dimensional full Stokes model of the grounding line dynamics: Effect of a pinning point beneath the ice shelf. Cryosphere 2012, 6, 101–112. [Google Scholar] [CrossRef]
- Kim, S.H.; Kim, D.; Kim, H.-C. Progressive Degradation of an Ice Rumple in the Thwaites Ice Shelf, Antarctica, as Observed from High-Resolution Digital Elevation Models. Remote Sens. 2018, 10, 1236. [Google Scholar] [CrossRef]
- Roberts, J.; Galton-Fenzi, B.K.; Paolo, F.S.; Donnelly, C.; Gwyther, D.E.; Padman, L.; Young, D.; Warner, R.; Greenbaum, J.; Fricker, H.A. Ocean forced variability of Totten Glacier mass loss. Geol. Soc. Lond. Spec. Publ. 2018, 461, 175–186. [Google Scholar] [CrossRef]
- Sun, J.; Huo, D.; Sun, Z. The study of remote sensing on monitoring ice velocities of the Polar Record Glacier and the Dark Glacier. Chin. J. Polar Res. 2001, 13, 117–128. [Google Scholar]
- Liu, R.; Zhou, C.; Liang, Q. Monitoring the changes of ice shelf and glaciers around Zhongshan Station using multiple-source remote sensing data. Chin. J. Polar Res. 2017, 29, 446–453. [Google Scholar]
- Huang, J.; E, D.; Zhang, S. Surface flow features of the Dark Glacier in East Antarctica from in-situ observation. J. Glaciol. Geocryol. 2015, 37, 1150–1159. [Google Scholar]
- Ai, S.; Wang, S.; Li, Y.; Moholdt, G.; Zhou, C.; Liu, L.; Yang, Y. High-precision ice-flow velocities from ground observations on Dalk Glacier, Antarctica. Polar Sci. 2019, 19, 13–23. [Google Scholar] [CrossRef]
- Howat, I.M.; Porter, C.; Smith, B.E.; Noh, M.J.; Morin, P. The reference elevation model of antarctica. Cryosphere 2019, 13, 665–674. [Google Scholar] [CrossRef]
- Scambos, T.; Fahnestock, M.; Moon, T.; Gardner, A.; Klinger, M. Global Land Ice Velocity Extraction from Landsat 8 (GoLIVE); NSIDC (National Snow and Ice Data Center): Boulder, CO, USA, 2016. [Google Scholar]
- Zwally, H.J.; Schutz, R.; Bentley, C.; Bufton, J.; Herring, T.; Minster, J.; Spinhirne, J.; Thomas, R. GLAS/ICESat L2 Antarctic and Greenland Ice Sheet Altimetry Data, Version 34; NASA National Snow and Ice Data Center Distributed Active Archive Center: Boulder, CO, USA, 2014. [Google Scholar] [CrossRef]
- Allison, I.; Hyland, G. Amery Ice Shelf Compiled and Merged Ice Thickness Datasets, Australian Antarctic Data Centre. 2014. Available online: https://data.aad.gov.au/metadata/records/AIS_thickness_bottom (accessed on 20 December 2017).
- Moon, T.; Joughin, I. Changes in ice front position on Greenland’s outlet glaciers from 1992 to 2007. J. Geophys. Res. 2008, 113. [Google Scholar] [CrossRef]
- Leprince, S.; Barbot, S.; Ayoub, F.; Avouac, J.-P. Automatic and precise orthorectification, coregistration, and subpixel correlation of satellite images, application to ground deformation measurements. IEEE Trans. Geosci. Remote Sens. 2007, 45, 1529–1558. [Google Scholar] [CrossRef]
- Scherler, D.; Leprince, S.; Strecker, M. Glacier-surface velocities in alpine terrain from optical satellite imagery—Accuracy improvement and quality assessment. Remote Sens. Environ. 2008, 112, 3806–3819. [Google Scholar] [CrossRef]
- Scaramuzza, P.; Micijevic, E.; Chander, G. SLC gap-filled products phase one methodology. In Landsat Technical Notes, Volume No. 5; USGS: Reston, VA, USA, 2004. [Google Scholar]
- Wegnüller, U.; Werner, C.; Strozzi, T.; Wiesmann, A.; Frey, O.; Santoro, M. Sentinel-1 support in the GAMMA Software. Procedia Comput. Sci. 2016, 100, 1305–1312. [Google Scholar] [CrossRef]
- Werner, C.; Wegmüller, U.; Strozzi, T.; Wiesmann, A. Gamma SAR and interferometric processing software. In Proceedings of the ERS-ENVISAT Symposium, Gothenburg, Sweden, 16–20 October 2000; Volume 1620, p. 1620. [Google Scholar]
- Strozzi, T.; Luckman, A.; Murray, T.; Wegmuller, U.; Werner, C.L. Glacier motion estimation using SAR offset-tracking procedures. IEEE Trans. Geosci. Remote Sens. 2002, 40, 2384–2391. [Google Scholar] [CrossRef]
- Sánchez-Gámez, P.; Navarro, F.J. Glacier Surface Velocity Retrieval Using D-InSAR and Offset Tracking Techniques Applied to Ascending and Descending Passes of Sentinel-1 Data for Southern Ellesmere Ice Caps, Canadian Arctic. Remote Sens. 2017, 9, 442. [Google Scholar] [CrossRef]
- Han, H.; Im, J.; Kim, H. cheol Variations in ice velocities of Pine Island Glacier Ice Shelf evaluated using multispectral image matching of Landsat time series data. Remote Sens. Environ. 2016, 186, 358–371. [Google Scholar] [CrossRef]
- Fahnestock, M.; Scambos, T.; Moon, T.; Gardner, A.; Haran, T.; Klinger, M. Rapid large-area mapping of ice flow using Landsat 8. Remote Sens. Environ. 2016, 185, 84–94. [Google Scholar] [CrossRef]
- Melkonian, A.K.; Willis, M.J.; Pritchard, M.E.; Stewart, A.J. Recent changes in glacier velocities and thinning at Novaya Zemlya. Remote Sens. Environ. 2016, 174, 244–257. [Google Scholar] [CrossRef]
- Wendleder, A.; Friedl, P.; Mayer, C. Impacts of climate and supraglacial lakes on the surface velocity of Baltoro Glacier from 1992 to 2017. Remote Sens. 2018, 10, 1681. [Google Scholar] [CrossRef]
- Griggs, J.A.; Bamber, J.L. Antarctic ice-shelf thickness from satellite radar altimetry. J. Glaciol. 2011, 57, 485–498. [Google Scholar] [CrossRef]
- Fricker, H.A.; Popov, S.; Allison, I.; Young, N. Distribution of marine ice beneath the Amery Ice Shelf. Geophys. Res. Lett. 2001, 28, 2241–2244. [Google Scholar] [CrossRef]
- Ligtenberg, S.R.M.M.; Helsen, M.M.; Van Den Broeke, M.R. An improved semi-empirical model for the densification of Antarctic firn. Cryosphere 2011, 5, 809–819. [Google Scholar] [CrossRef]
- Ligtenberg, S.R.M.M.; Kuipers Munneke, P.; van den Broeke, M.R. Present and future variations in Antarctic firn air content. Cryosphere 2014, 8, 1711–1723. [Google Scholar] [CrossRef]
- Millan, R.; Mouginot, J.; Rabatel, A.; Jeong, S.; Cusicanqui, D.; Derkacheva, A.; Chekki, M. Mapping Surface Flow Velocity of Glaciers at Regional Scale Using a Multiple Sensors Approach. Remote Sens. 2019, 11, 2498. [Google Scholar] [CrossRef]
- Lei, H.; Zhou, C.; Chen, Y. Determination of grounding line on the Amery Ice Shelf using Sentinel-1 radar interferometry data. Adv. Polar Sci. 2017, 28, 204–213. [Google Scholar]
- Greene, C.A.; Young, D.A.; Gwyther, D.E.; Galton-Fenzi, B.K.; Blankenship, D.D. Seasonal dynamics of Totten Ice Shelf controlled by sea ice buttressing. Cryosphere 2018, 12, 2869–2882. [Google Scholar] [CrossRef]
- Chester, M.L.; Kulessa, B.; Luckman, A.J.; Bassis, J.N.; Kuipers Munneke, P. Systems analysis of complex glaciological processes and application to calving of Amery Ice Shelf, East Antarctica. Ann. Glaciol. 2017, 58, 60–71. [Google Scholar] [CrossRef][Green Version]
- Herraiz-Borreguero, L.; Church, J.A.; Allison, I.; Peña-Molino, B.; Coleman, R.; Tomczak, M.; Craven, M. Basal melt, seasonal water mass transformation, ocean current variability, and deep convection processes along the Amery Ice Shelf calving front, East Antarctica. J. Geophys. Res. Oceans 2016, 121, 4946–4965. [Google Scholar] [CrossRef]
- Williams, G.D.; Herraiz-Borreguero, L.; Roquet, F.; Tamura, T.; Ohshima, K.I.; Fukamachi, Y.; Fraser, A.D.; Gao, L.; Chen, H.; McMahon, C.R. The suppression of Antarctic bottom water formation by melting ice shelves in Prydz Bay. Nat. Commun. 2016, 7, 12577. [Google Scholar] [CrossRef] [PubMed]
© 2020 by the authors. Licensee MDPI, Basel, Switzerland. This article is an open access article distributed under the terms and conditions of the Creative Commons Attribution (CC BY) license (http://creativecommons.org/licenses/by/4.0/).