A Preliminary Assessment of the Gauge-Adjusted Near-Real-Time GSMaP Precipitation Estimate over Mainland China


1
State Key Laboratory of Hydrology-Water Resources and Hydraulic Engineering, Hohai University, Nanjing 210098, China
2
School of Earth Sciences and Engineering, Hohai University, Nanjing 211100, China
*
Author to whom correspondence should be addressed.
Remote Sens. 2020, 12(1), 141; https://doi.org/10.3390/rs12010141
Submission received: 1 November 2019
/
Revised: 18 December 2019
/
Accepted: 29 December 2019
/
Published: 1 January 2020
(This article belongs to the Special Issue Remote Sensing of Precipitation: Part II)
Abstract
:The near-real-time satellite-derived precipitation estimates are attractive for a wide range of applications like extreme precipitation monitoring and natural hazard warning. Recently, a gauge-adjusted near-real-time GSMaP precipitation estimate (GSMaP_Gauge_NRT) was produced to improve the quality of the original GSMaP_NRT. In this study, efforts were taken to investigate and validate the performance of the GSMaP_Gauge_NRT using gauge observations over Mainland China. The analyses indicated that GSMaP_NRT generally overestimated the gauge precipitation in China. After calibration, the GSMaP_Gauge_NRT effectively reduced this bias and was more consistent with gauge observations. Results also showed that the correction scheme of GSMaP_Gauge_NRT mainly acted on hit events and could hardly make up the miss events of the satellite precipitation estimates. Finally, we extended the evaluation to the global scale for a broader view of GSMaP_Gauge_NRT. The global comparisons exhibited that the GSMaP_Gauge_NRT was in good agreement with the GSMaP_Gauge product. In conclusion, the GSMaP_Gauge_NRT had better performance than the GSMaP_NRT and was a more reliable near-real-time satellite precipitation product.
1. Introduction
Reliable precipitation estimates are crucial because of their role in flood monitoring, crop yield, and water resource management [1,2,3]. However, in many regions of Earth, like the oceans, deserts, and mountains, ground-based observing networks from gauges and radars are sparse or even nonexistent, which restricts our understanding of global water cycle and local hydrological processes [4,5,6]. The recent development of precipitation-retrieval techniques from satellite-based remote sensing makes it possible of measuring precipitation on the global scale. The remote sensing of precipitation combines the advantage of the frequency sampling of infrared (IR) sensors derived from geostationary (GEO) satellites and the superior accuracy (but poor sampling) of passive microwave (PMW) sensors carried onboard the low earth orbiting (LEO) satellites, in an effort to produce precipitation data with extensive spatial coverage and fine resolutions [7,8,9].
To date, various satellite precipitation missions have been implemented and their products have been made available to the public. Previous satellite precipitation missions include the NASA’s Tropical Rainfall Measuring Mission (TRMM [10]), NOAA’s Climate Prediction Center (CPC) morphing technique (CMORPH [11]), JAXA’s Global Satellite Mapping of Precipitation (GSMaP [12]), the Precipitation Estimation from Remotely Sensed Information using Artificial Neural Networks (PERSIANN [13]), the Climate Hazard Group InfraRed Precipitation (CHIRP [14]), and the successor of TRMM: Global Precipitation Measurement (GPM [3]). These satellite precipitation missions and products have benefitted the hydrology and meteorology community in relevant researches and applications. However, more recent studies have found that satellite precipitation products contain considerable errors due to the indirect retrieval methods of remote sensing [15,16,17,18,19,20,21,22,23]. One of the most effective strategies to diminish these errors is combining ground-based data to adjust the satellite precipitation products. For example, the 3B42 product is one of the most popular gauge-adjusted satellite precipitation products at the TRMM era, which incorporates the monthly Global Precipitation Climatology Centre (GPCC) gauge data to increase the accuracy of its original satellite-only 3B42RT product. Today, numerous studies have demonstrated that the 3B42 shows substantial improvement than the 3B42RT, with lower bias and better detection skills [24,25,26,27,28]. However, the 3B42 data is not available in real-time, and researchers must wait ~2.5 months after observation time, while the delay of pure satellite-derived 3B42RT is only 8 h [29]. Obviously, traditional gauge-adjusted schemes depend on the time availability of gauge data. Nevertheless, collecting and processing gauge data in real-time is not possible on a global scale, especially in underdeveloped countries and areas, which delay the availability of satellite precipitation products. The question of the availability exists widely in the gauge-adjusted satellite precipitation products. For example, if someone want to use PERSIANN-CDR or GSMaP_Gauge data, they must wait ~3 months or ~3 days after observation, respectively [21,30].
In some cases, the real-time availability precipitation data is more critical for applications like rainstorm monitoring and flash flood warning, and it does not seem practical to use the traditionally delayed gauge-adjusted satellite precipitation products [31,32]. Thus, it is important to reduce the error of satellite precipitation estimates as much as possible without jeopardizing its near-real-time availability. To this end, a climatological calibration algorithm (CCA) was proposed in the TRMM Multisatellite Precipitation Analysis (TMPA) real-time system. This method utilizes climatological gauge information to alleviate errors and keep the timeliness of 3B42RT itself [9]. Yong et al. [31] initially investigated the performance of CCA in the 3B42RT precipitation estimates over two different basins of China using a local dense rain gauge. The author found that the systematic errors in 3B42RT were minimized overall after the CCA calibration. Nevertheless, the author also highlighted that the performance of calibrated precipitation became worse in high-latitude areas, or areas beyond the 40° latitude belts. In addition, from a global map view of error analysis, Yong et al. [9] demonstrated that the CCA calibrated 3B42RT precipitation has large bias in mountainous regions (especially over the Tibetan Plateau). Theoretically, the CCA is used in the GPM near-real-time runs of the Integrated Multisatellite Retrievals for GPM (IMERG) algorithm. However, considering the unstable performance of CCA, the developers of the IMERG algorithm are re-evaluating the CCA calibration. Meantime, the IMERG near-real-time products do not currently have climatological calibration.
As the Japanese counterpart of IMERG, the GSMaP is another mainstream satellite precipitation product at GPM era, which was produced by reliable physical models and by distributing hourly global precipitation map with 0.1° × 0.1° resolution [20,33,34]. To satisfy different application requirements, there are two main groups of GSMaP products: Near-real-time and standard products. As the name implies, the near-real-time product is intended to provide available satellite precipitation quickly, while the standard product applies more PMW/IR sources to create relative accurate precipitation estimates. Correspondingly, the near-real-time product has about a 3-h delay, and the standard product has a large latency of about 3 d. To reduce bias on the satellite-derived GSMaP products, gauge-adjusted GSMaP products are developed using ground-gauge measurement as a calibrator. The gauge-calibrated product of standard GSMaP_MVK is GSMaP_Gauge, which adjusted by daily CPC gauge data. Many studies have assessed and compared the performances of GSMaP_Gauge over the last few years and have shown that GSMaP_Gauge is a satisfactory gauge-adjusted satellite precipitation estimation around the world, especially over East Asia [34,35,36,37,38].
Recently, in the GSMaP project, the GSMaP_Gauge_NRT was produced by a GSMaP algorithm team, aiming to improve the accuracy of near-real-time product of GSMaP (i.e., GSMaP_NRT) and maintain its timeliness. Section 2.2 describes the calibration procedure of GSMaP_Gauge_NRT in detail. Thus, it is crucial to understand the performance of new GSMaP_Gauge_NRT product timely. In the official document of GSMaP, the GSMaP developers eagerly encouraged people to evaluate and validate the GSMaP_Gauge_NRT in different regions. Therefore, in this study, we systematically assessed the performance of the GSMaP_Gauge_NRT precipitation estimates and the original uncalibrated GSMaP_NRT over the Mainland China. The rest of this paper is organized as follows. In Section 2, we describe the study area, the precipitation data and the error metrics. Then, a presentation of results and discussion in this study are provided in Section 3 and Section 4, respectively. Finally, the summary and conclusions are given in Section 5.
2. Materials and Methods
2.1. Study Area
China, which covers an area of about 9.6 million km2, is located in the eastern Asia. The terrain of China is complex and varied, with flat plains and hills in the east and high mountains and plateaus in the west. The elevation of China has an overall descending tendency from west to the east. Specially, the world’s “Third Pole”, the Tibetan Plateau (TP), is situated in southwest China. Generally, the climate on the China features hot and rainy summers and cold and dry winters due to the effects of monsoon system and topography. In addition, the annual precipitation in China varies greatly, with an obvious gradient from southeast to northwest, except for some parts of northwestern Xinjiang. Over southeast China, a huge amount of water vapor from the Pacific Ocean is brought by the Asian monsoon in the summer, producing abundant precipitation (exceeding 800 mm/year). Over the inland areas of western China, which are far from the ocean, monsoon precipitation becomes negligible and the continental climate dominates (with annual precipitation less than 400 mm). Considering the diverse climate in China, following Yong et al. [39], we separated mainland China into four representative climate regions based on the annual precipitation (Figure 1a): (1) The humid region, mainly covering the southeast of China and dominated by the subtropical monsoon with the average annual precipitation (AAP) above 800 mm; (2) the semi-humid region (AAP between 400–800 mm), including northeast China, North China, and southeast parts of TP; (3) the semi-arid region (AAP of 200–400 mm), which consists of two parts, one region extending from the southwest TP into the North Inner Mongolia with a narrow strip, and another region located in the Ili river valley; (4) the arid region (AAP < 200 mm), a main desert areas in China, including the most of Xinjiang and western part of Inner Mongolia.
2.2. Data Sources
2.2.1. Rain Gauge Data
A gridded precipitation product (0.25° × 0.25°) of the China Gauge-Based Daily Precipitation Analysis (CGDPA) was used as the ground reference dataset. This dataset was produced and is routinely operated by the National Meteorological Information Center (NMIC) of the China Meteorological Administration (CMA). Based on amassing ~2400 gauge stations across Mainland China, the NMIC uses a modified interpolation method of climatology-based optimal interpolation (OI) proposed by Xie et al. [40] to yield the daily gridded CGDPA product. All the gauge data inputted in the CGDPA are manually recorded by bucket rain gauges and must pass a strict quality control procedure including the extreme values’ check, internal consistency check, and spatial consistency check [41]. The validation reports of Shen and Xiong [42] demonstrated that the CGDPA is a more reliable precipitation product than other existing surface observation datasets over Mainland China, and the authors recommended it as a reliable ground-based data to various meteorological and hydrological applications. At present, the CGDPA is available as the official gridded daily precipitation dataset in the CMA website and can be downloaded from http://data.cma.cn/site/index.html. Considering the ease of access and high-quality of CGDPA, a large number of studies have used the CGDPA to assess the satellite precipitation products over China [39,43,44,45]. Figure 1a shows the number of gauge stations in each 0.25° grid box of CGDPA. Clearly, about 80% of the gauges are located in the eastern China with low elevations, while relatively sparse gauges are distributed over the western mountains and deserts, especially over the TP.
2.2.2. GSMaP Near-Real-Time Precipitation Products
As one of Japanese GPM projects, GSMaP was implemented under the Japanese Precipitation Measuring Mission (PMM) science team with the target of providing a global precipitation map with high precision and high resolution [34]. The GSMaP algorithm uses various of PMW/IR sensors to produce the “best” precipitation estimates through several steps. First, several PMW radiometers carried by different satellites, such as the GPM microwave imager (GMI), TRMM microwave imager (TMI), special sensor microwave imager/sounder (SSMIS), advanced microwave scanning radiometer 2 (AMSR2), advanced microwave sounding unit-A (AMSU-A), and microwave humidity sounder (MHS), are used to retrieve quantitative precipitation estimates [33,46]. Then, it uses the cloud motion vector derived from successive geo-IR images to propagate the precipitation area for filling the gaps between PMW-based estimates, which is similar to CMORPH. In addition, a Kalman filter model is applied to modify precipitation rates after propagation. Finally, the forward and backward propagated precipitation estimates are weighted and combined to produce the standard GSMaP_MVK product. At the beginning of design, the GSMaP algorithm developers did not consider near-real-time operation and data availability. To meet this demand, a near-real-time product of the GSMaP (GSMaP_NRT) with resolutions of 0.1° and 1 h was developed. Different from GSMaP_MVK, the GSMaP_NRT only employs forward cloud movement to hold operability in near-real-time. The emergence of GSMaP_NRT product attracts a lot of data users, owing to its short latency (~3 h after observation). To reduce the bias in the GSMaP_NRT product, a new algorithm introducing gauge information to GSMaP_NRT (i.e., GSMaP_Gauge_NRT) is currently under development. In the GSMaP_Gauge_NRT product, a precipitation error parameters model was created based on the historical database of GSMaP_Gauge. Then, these parameters were used to adjust the GSMaP_NRT estimation in near-real-time to improve the precision of GSMaP_NRT. Considering that the GSMaP_Gauge_NRT product does not use the gauge measurement directly, this makes the GSMaP_Gauge_NRT independent of the ground gauge observations. Recently, the latest GSMaP algorithm upgraded to version 7, and its near-real-time products were made available after 17 January 2017. In this study, the GSMaP_Gauge_NRT product and the uncalibrated GSMaP_NRT product were investigated over a complete two-year period (from September 2017 to August 2019). Both satellite precipitations were aggregated into daily amounts, with a 0.25° × 0.25° resolution corresponding to the gauge data.
2.3. Methods
In this study, we conducted the assessment and comparison of GSMaP precipitation based on continuous statistical metrics and contingency table metrics. The continuous metrics included correlation coefficient (CC), mean error (ME), root mean squared error (RMSE), and relative bias (BIAS), which are widely used to quantitatively represent the degree of agreement and the error between satellite precipitation and gauge observations. These continuous metrics were calculated by the following equation:
where and are the precipitation values from satellite estimation and gauge data, respectively; correspondingly, and are their mean precipitation, and n is the number of samples.
In addition, three contingency table metrics were adopted to evaluate the capability of satellite precipitation in the detection of precipitation events. These categorical metrics were the probability of detection (POD), false alarm ratio (FAR), and critical success index (CSI). POD is usually used to represent the fraction of precipitation events that correctly detected by satellite among all the actual precipitation events. FAR denotes the ratio of false alarm by satellite among the total satellite detected events. The CSI, combining the correct hit, false alarm, and missed event, is a more comprehensive score. The formulas of these contingency table metrics are listed below:
where H, M, and F are the numbers of different precipitation events: Hit (both satellite estimates and gauge observations detect rain), miss (observed rain that is not detected by satellite), false (rain detected but not observed). Here, a commonly used threshold of 1.0 mm/day was set to define the rain/no rain event, as suggested by many previous studies [47,48,49,50].
For more detailed description of above continuous statistical metrics and contingency table metrics, readers can refer to Yong et al. [25] and Lu et al. [30]. We need to point out that all metrics were calculated in the 0.25° × 0.25° grid boxes with at least one gauge in order to ensure more convincing results (gauge distribution shows in Figure 1a). However, we also calculated metric value in every grid box to enable a visualization when presenting continuous spatial distribution (Figure 2).
3. Results
3.1. Daily Mean Precipitation
Figure 1b–d displays the spatial distributions of two-year daily mean precipitation for GSMaP and CGDPA precipitation products. Generally speaking, the spatial distributions of GSMaP and CGDPA precipitations were similar, showing a downward gradient from the southeast China to the northwest China. However, a pronounced difference in the precipitation amount was found between the gauge observations and GSMaP satellite precipitation products. For example, compared with the CGDPA, the GSMaP_NRT tended to underestimate the gauge observations in the southeast and overestimated them in the northwest. Impressively, the GSMaP_NRT significantly overestimated the gauge precipitation in the Sichuan province due to the indirect retrieval of satellite precipitation. After the parameterized gauge calibration, the errors in GSMaP_NRT were effectively suppressed, and the GSMaP_Gauge_NRT had a more reliable performance than the GSMaP_NRT in capturing the spatial patterns of precipitation over China. Therefore, the GSMaP_Gauge_NRT combined historical gauge information to reduce biases, making it consistent with the ground measurements. This suggests that the parameterized adjustment procedures can effectively enhance the quality of the original GSMaP_NRT satellite precipitation estimates.
3.2. Comparison and Validation of GSMaP_NRT and GSMaP_Gauge_NRT Products
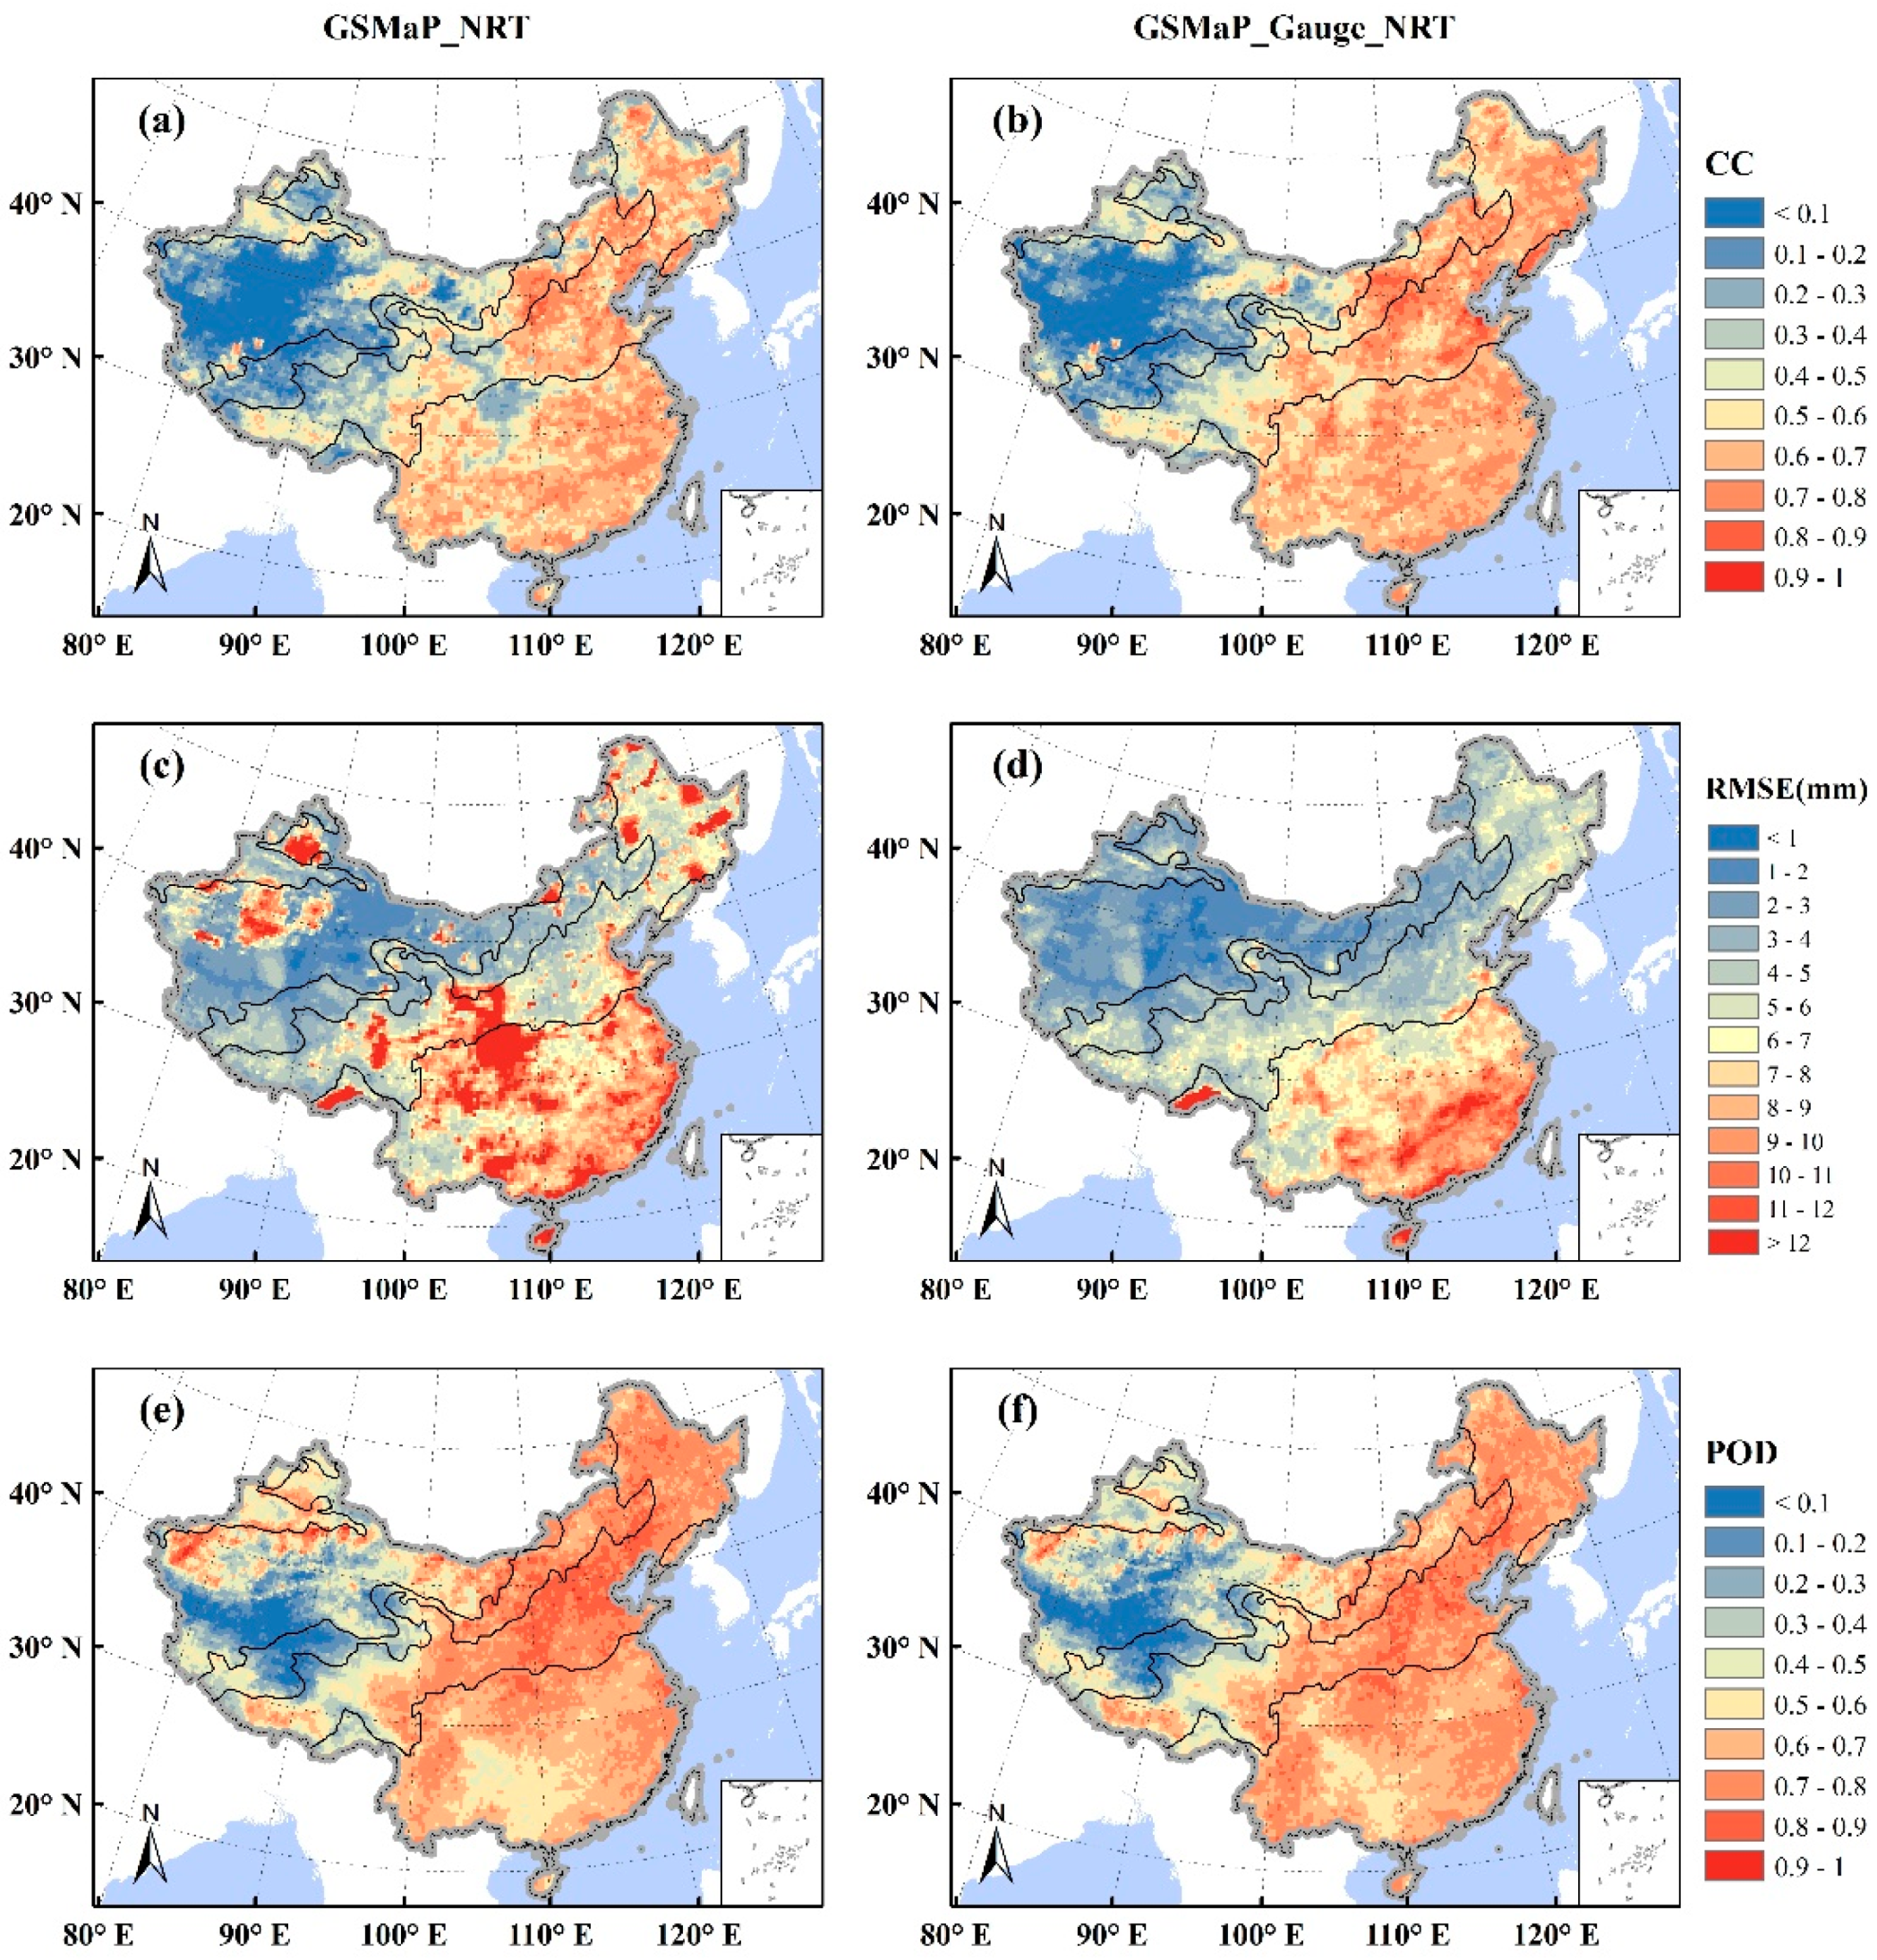
Figure 2 shows the spatial maps of CC, RMSE, and POD, which were computed from two GSMaP products against gauge observations over the Mainland China at the 0.25° × 0.25° resolution grid. Generally speaking, the spatial distributions of GSMaP_Gauge_NRT exhibited a great improvement compared to that of the GSMaP_NRT, with higher CC, lower RMSE, and slightly better POD values. Over Mainland China, the CC increased from 0.58 with GSMaP_NRT to 0.67 with GSMaP_Gauge_NRT and the RMSE dropped from 9.11 mm to 7.07, besides a small change of POD between GSMaP_NRT (0.69) and GSMaP_Gauge_NRT (0.70). With respect to the spatial performance of error metrics, both GSMaP_NRT and GSMaP_Gauge_NRT products exhibited similar features. That is, worse values of CC and POD occurred in the northwest and improved toward the southeast, while higher RMSE existed in the southeast. This phenomenon was reasonable because the RMSE value increased with increasing precipitation amounts, and southeastern China has more precipitation than other areas in China. Distributions of CC, RMSE, and POD indicate that GSMaP_Gauge_NRT performs better than GSMaP_NRT over Mainland China, suggesting that the calibration in near-real-time can effectively reduce the error and improve detectability of GSMaP_NRT.
We further inquired about the temporal behavior and the seasonal statistics of the GSMaP_NRT and GSMaP_Gauge_NRT products over Mainland China. In order to ensure a more accurate comparison, only those grids that contained at least one gauge were taken to compute the statistical indices. Figure 3 depicts the monthly precipitation and monthly variations of statistical metrics from gauges and GSMaP precipitation products by calculating at daily scale. Table 1 summarizes the seasonal statistics including spring (March–May), summer (June–August), autumn (September–November), and winter (December–February). It can be see that both GSMaP_NRT and GSMaP_Gauge_NRT products can generally capture the intra-annual and seasonal variation patterns of precipitation over China, with the rainy summer and dry winter (Figure 3a). The GSMaP_NRT showed much more precipitation than gauge observations in most months, and the GSMaP_Gauge_NRT reduced this overestimation, which was more consistent with gauge observations. The time series of statistical indices clearly show that the GSMaP_Gauge_NRT outperforms GSMaP_NRT with higher correlation, lower error, and better detection (Figure 3b–d). This further confirms that the calibration in the GSMaP_Gauge_NRT can substantially improve the quality of the original GSMaP_NRT precipitation product. However, it is worth noting that the BIAS was increased in some months. This issue may be due to the fact that the overestimation and underestimation at different regions could cancel each other out when calculating the BIAS value. Focusing on the curves of CC and RMSE, we can conclude that the GSMaP_Gauge_NRT had better agreement with gauge observations than the GSMaP_NRT products over China. In addition, we note that the performance of satellite precipitation productions showed obvious seasonally dependent variations, with better statistical indices in summer and worse in winter (Table 1). Taking CC as an example, the value of CC decreased from 0.62 in summer to 0.41 in winter for GSMaP_NRT and from 0.67 to 0.58 for GSMaP_Gauge_NRT. During the winter months, the snow brought by the westerly winds was the main form of precipitation in the north and west regions of China. However, the complex radiative properties of ice particles and snowflakes restricted the retrieval capability of microwave radiation. On the one hand, the low-frequency channels of PMW sensors contain limited snow detection information, but account for most of PMW channels and are traditionally used to retrieve rain drops. On the other hand, more snow-related high-frequency channels will be seriously interfered in the snow-covered background surfaces, which often present a similar passive microwave signature as the falling snow [51]. Therefore, measuring solid precipitation and snow is a challenging task for the satellite precipitation retrievals, which was pointed by many previous studies [15,23,25,52]. The GSMaP_Gauge_NRT product can combine the gauge information to reduce the precipitation error of GSMaP_NRT in winter, showing more consistency with gauge observations.
Considering the diverse climate of China, it was rational to subdivide national-scale evaluation into regional analyses. Figure 4 shows the scatterplots of daily GSMaP_NRT and GSMaP_Gauge_NRT against gauge observations for the selected grids over different climate regions. Clearly, over the four climate regions, all the scatterplots show that the scatter points of GSMaP_Gauge_NRT were clustered closer to the 1:1 line than those of GSMaP_NRT estimates, meaning that the GSMaP_Gauge_NRT was more in agreement with gauge observations. The GSMaP_NRT estimate significantly overestimated the gauge precipitation with BIAS range from 0.82% to 149.08% (see left column in Figure 4). After the calibration, these biases were effectively minimized in the GSMaP_Gauge_NRT product. Correspondingly, the CC values increased from GSMaP_NRT to GSMaP_Gauge_NRT, and the RMSE values showed an apparent downward trend. However, in terms of the contingency table statistics, the improvements were not obvious. This suggests that the calibration can effectively reduce the bias but is not good at improving the skill of detecting rainy events. Additionally, Figure 4 illustrates that the two near-real-time GSMaP products had different performances at four climate regimes, with better agreement from gauge observations over the humid region (Figure 4a,b) and an unsatisfactory performance over the arid region (Figure 4g,h). This was likely caused by the different retrieval skills of rainfall types over different climate regimes. The arid region, covered with desert and high mountains, was dominated by short-lived convective precipitation and orographic precipitation. However, the satellite-based precipitation retrieval had difficulty coping with these two precipitation conditions. Moreover, the light rainfall and winter snow in arid region further imposed another challenge to the satellite-based precipitation estimates. Consequently, the satellite precipitation products usually had an unsatisfactory performance over the arid region in China, and this is consistent with the result of Yong et al. [39] and Chen et al. [46]. Compared to GSMaP_NRT, the GSMaP_Gauge_NRT obviously improved the data accuracy, but it had low CC (0.36) and BIAS (35.08%) values over the arid region. Such results indicate that the current near-real-time gage calibration algorithm of GSMaP still have significant room for further improving the data quality over the arid region.
Theoretically, a value of satellite precipitation can be divided into four categories based on its ability to identify rain occurrences. A hit event means that both the satellite estimate and gauge reference detected rain, while miss precipitation suggests that a rain event was reported by gauge observation but not detected by satellite. In contrast, false precipitation means that precipitation was detected by satellite but not observed by gauge, and the rest part of precipitation means that that both satellite and gauge showed no rain. Based on the different precipitation events, we further computed the intensity distributions of daily precipitation amount to look into the error characteristics of GSMaP products (Figure 5). The rainfall intensity was binned with logarithmic scale across the range of 1–256 mm/day, and the daily averaged precipitation accumulation of each bin was calculated on the y-axis. The intensity distribution, which has different error components, can reveal detailed information on the error features at the event scale. As shown in Figure 5, the intensity distributions of total precipitation were generally similar to those of hit precipitation, suggesting that hit event was the dominate component of total precipitation. However, over the arid region, the false precipitation also accounted for a considerable proportion of the total precipitation. Considering that the false precipitation will amplify the total precipitation amount of satellite, the obvious overestimation of two near-real-time GSMaP products over the arid region was partly caused by the false rainy events. On the other hand, compared to GSMaP_NRT, the intensity distributions of GSMaP_Gauge_NRT were closer to the gauge observations (first column in Figure 5), which indicates that the GSMaP_Gauge_NRT has better performance than the GSMaP_NRT. Additionally, it can be seen that the calibration of GSMaP_Gauge_NRT mainly changed the intensity distributions at a moderate–high rain rate. For example, the GSMaP_NRT had more precipitation amounts than gauge observations over the semi-humid region (Figure 5e). After the calibration, the curve of GSMaP_Gauge_NRT descended and was more consist with the gauge. In the third column of Figure 5, it was found that the GSMaP_NRT and GSMaP_Gauge_NRT showed basically identical intensity distributions of miss precipitation over all four climate regions. This implies that the GSMaP_Gauge_NRT failed to correct precipitation events undetected by the satellites in the calibration process. Therefore, the future correction efforts of incorporating different precipitation component is recommended to improve the precision of satellite precipitation.
3.3. Global View of GSMaP_NRT and GSMaP_Gauge_NRT
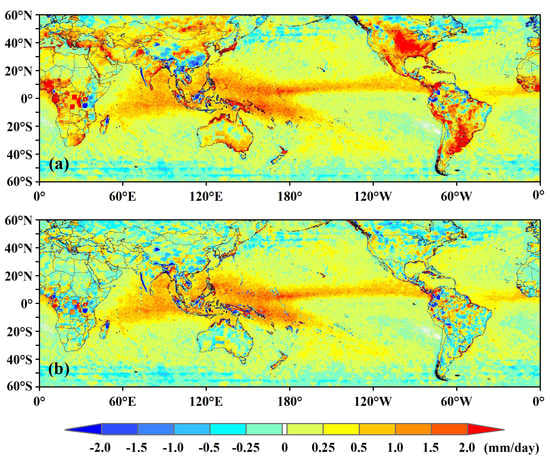
In the previous section, we compared the GSMaP_NRT with GSMaP_Gauge_NRT satellite precipitation products over the Mainland China. The results showed that the GSMaP_Gauge_NRT effectively reduced the error in GSMaP_NRT and was more consistent with gauge observations. To obtain a much broader view of GSMaP_Gauge_NRT at other regions, we extended the comparison to the global scale. Operationally, it is usually difficult to validate the satellite precipitation products on the global scale using gauge observations, due to the fact that the ground gauge networks are sparse or nonexistent in many regions like oceans, deserts, and mountains. In order to provide a globally consistent evaluation, we chose the GSMaP_Gauge product as the reference data for global comparison. Figure 6 displays the spatial difference between the two near-real-time GSMaP products and the standard GSMaP_Gauge product. It can be seen that the GSMaP_NRT underestimated the precipitation in the southeastern China, which was consistent with the evaluation results when using CGDPA as a reference. The calibrated GSMaP_Gauge_NRT substantially decreased this underestimation and was closer to the GSMaP_Gauge. Globally, the GSMaP_NRT exhibited positive bias over most parts of the world. Most notably, along the intertropical convergence zone (ITPC) extending toward Central America, eastern United States, southern parts of South America, and West Africa, the GSMaP_NRT tended to overestimate precipitation. After the real-time calibration, these positive biases were effectively reduced. Besides, compared to the GSMaP_Gauge, the GSMaP_Gauge_NRT only had slight underestimations over most parts of world, except for the ITPC, with an overestimation (Figure 6b). Considering that the development of GSMaP_Gauge_NRT intended to make the GSMaP near-real-time products as close to the GSMaP_Gauge product as possible, we believe that the parameterized gauge calibration effectively reduced the errors in GSMaP_NRT, and that the calibrated GSMaP_Gauge_NRT is a better product than GSMaP_NRT.
4. Discussion
Remote sensing of precipitation provides an alternative source for precipitation data beyond ground observations. To date, numerous studies have reported the performance of satellite precipitation products in many areas around the world [20,53,54,55,56,57,58]. However, most of these evaluations focused on the post-real-time products that are usually available after a few days or months [59,60,61]. The near-real-time satellite precipitation products are more attractive for some application scenarios, owing to their timeliness. To the best of our knowledge, our study is a first evaluation of the gauge-adjusted near-real-time GSMaP precipitation estimate. The results in this study showed that the GSMaP_Gauge_NRT has a more reliable performance than its original GSMaP_NRT over China. This provides a positive feedback to the GSMaP algorithm team, as they expected. In the TRMM era, the CCA was proposed to improve the accuracy of TMPA-RT. However, this climatological calibration is not currently used in IMERG near-real-time products due to its poor performance at high latitudes and altitudes [9,31]. In the GPM era, the GSMaP and IMERG were the most popular high-resolution satellite precipitation products, and the GSMaP_NRT and IMERG-early were their near-real-time products with latency periods of 3 h and 4 h, respectively. Therefore, when the CCA is applied in the IMERG product, it is necessary to compare these two near-real-time products of GSMaP and IMERG, and this work can be continued in the future.
As a preliminary assessment of the near-real-time GSMaP precipitation estimate, we performed the validation at daily scale considering the availability of reference data. Previous studies found that the performances of satellite precipitation products are sensitive to the spatiotemporal scale [62,63]. Such a resampling in this study may lose the potential characters of GSMaP products at their original resolutions. However, our study mainly focused on the comparing of GSMaP_Gauge_NRT and GSMaP_NRT. Thus, this modification of scale should not change the conclusions of our study. In the next work, we will investigate the performance of GSMaP_Gauge_NRT product in sub-daily or hourly time scales.
The evaluation showed that the calibrated GSMaP_Gauge_NRT has better performance than the original GSMaP_NRT. Thus, it is reasonable to choose the GSMaP_Gauge_NRT precipitation product for users with their requirement of near-real-time data. Of course, more researches are needed for knowing the application potentiality of GSMaP_Gauge_NRT. The performance of the IMERG near-real-time products have been investigated in capturing extreme precipitation events [64,65]. The results of these studies indicated that the IMERG has a promising potential for monitoring typhoon rainfall. Considering the accuracy improvement of GSMaP_Gauge_NRT, further application researches, like rainstorm monitoring and hydrological simulation, are encouraged. This will provide useful feedbacks and insights about the GSMaP_Gauge_NRT to decision-makers and the scientific community.
5. Conclusions
Recently, the GSMaP algorithm developers proposed a parameterized gauge calibration method to reduce the errors in GSMaP_NRT without jeopardizing its near-real-time availability. In this study, we compared and validated the calibrated GSMaP_Gauge_NRT product with the original GSMaP_NRT over the Mainland China, by using a high-quality ground gauge reference dataset.
Our analyses showed that the GSMaP_NRT product can well-capture spatial patterns of precipitation across the China, but it significantly overestimates the reference precipitation with BIAS of 15.84%. After bias adjustment, this overestimation was obviously reduced, with slight overestimation for GSMaP_Gauge_NRT (4.46%). Correspondingly, the value of CC rose from 0.58 for GSMaP_NRT to 0.67 for GSMaP_Gauge_NRT, and the RMSE was reduced from 9.11 mm to 7.07 mm. This indicates that the parameterized calibration strategy can effectively decrease the bias in the GSMaP_NRT, and that the calibrated GSMaP_Gauge_NRT has a better performance than the original GSMaP_NRT.
In terms of the contingency table statistics, we found that the improvements in the contingency table statistics were not obvious. This suggests that the calibration can effectively reduce the bias but is not good at improving the skill of detecting precipitation events. When we decomposed satellite precipitation into different rainy events, the results further validated that the correction scheme mainly occurred in the hit event and could hardly make up the rainfall missed by the satellites. Thus, we highlight that incorporation of precipitation components is of vital importance for future calibration work.
Finally, our evaluation was extended to the global scale to examine the performance of GSMaP_Gauge_NRT from a broader perspective. The global analysis showed that the bias in GSMaP_ NRT was generally alleviated after gauge calibration and the calibrated GSMaP_Gauge_NRT product was in good agreement with the GSMaP_Gauge product. Therefore, to summarize, all of the results in this study suggest that GSMaP_Gauge_NRT can effectively reduce the uncertainties in GSMaP_NRT after the calibration and that the GSMaP_Gauge_NRT is a more reliable near-real-time satellite precipitation product than the original GSMaP_NRT. As a preliminary assessment of GSMaP_Gauge_NRT product, we hope that this study provides useful information for algorithm developers and product users. Considering the diverse nature of the world’s topography and climate characteristics, future studies are encouraged to evaluate and validate the performance of GSMaP_Gauge_NRT product in more regions using local density gauge networks.
Author Contributions
D.L. and B.Y. designed the framework of this study; D.L. performed the experiments and wrote the draft of the manuscript; B.Y. supervised the research and revised the manuscript. All authors have read and agreed to the published version of the manuscript.
Funding
This work was financially supported by National Key Research and Development Program of China (2018YFA0605402) and the National Natural Science Foundation of China (51979073, 91647203).
Acknowledgments
The authors are grateful to the GSMaP science team in the JAXA for making satellite precipitation data available, and thank to the CMA for providing ground-based precipitation data. Additionally, the authors wish to extend their appreciation to the editors and four anonymous reviews for their thoughtful comments and insightful suggestions.
Conflicts of Interest
The authors declare no conflict of interest.
References
- Michaelides, S.; Levizzani, V.; Anagnostou, E.; Bauer, P.; Kasparis, T.; Lane, J.E. Precipitation: Measurement, remote sensing, climatology and modeling. Atmos. Res. 2009, 94, 512–533. [Google Scholar] [CrossRef]
- Kidd, C.; Huffman, G. Review global precipitation measurement. Meteorol. Appl. 2011, 18, 334–353. [Google Scholar] [CrossRef]
- Hou, A.Y.; Kakar, R.K.; Neeck, S.; Azarbarzin, A.A.; Kummerow, C.D.; Kojima, M.; Oki, R.; Nakamura, K.; Iguchi, T. The global precipitation measurement mission. Bull. Am. Meteorol. Soc. 2014, 95, 701–722. [Google Scholar] [CrossRef]
- Anagnostou, E.N.; Maggioni, V.; Nikolopoulos, E.I.; Meskele, T.; Hossain, F.; Papadopoulos, A. Benchmarking high-resolution global satellite rainfall products to radar and rain-gauge rainfall estimates. IEEE Trans. Geosci. Remote Sens. 2010, 48, 1667–1683. [Google Scholar] [CrossRef]
- Behrangi, A.; Khakbaz, B.; Jaw, T.C.; AghaKouchak, A.; Hsu, K.; Sorooshian, S. Hydrologic evaluation of satellite precipitation products over a mid-size basin. J. Hydrol. 2011, 397, 225–237. [Google Scholar] [CrossRef] [Green Version]
- Massari, C.; Crow, W.; Brocca, L. An assessment of the performance of global rainfall estimates without ground-based observations. Hydrol. Earth Syst. Sci. 2017, 21, 4347–4361. [Google Scholar] [CrossRef] [Green Version]
- Sapiano, M.R.P.; Arkin, P.A. An intercomparison and validation of high-resolution satellite precipitation estimates with 3-hourly gauge data. J. Hydrometeorol. 2009, 10, 149–166. [Google Scholar] [CrossRef]
- Tapiador, F.J.; Turk, F.J.; Petersen, W.; Hou, A.Y.; García-Ortega, E.; Machado, L.A.T.; Angelis, C.F.; Salio, P.; Kidd, C.; Huffman, G.J.; et al. Global precipitation measurement: Methods, datasets and applications. Atmos. Res. 2012, 104, 70–97. [Google Scholar] [CrossRef]
- Yong, B.; Liu, D.; Gourley, J.J.; Tian, Y.; Huffman, G.J.; Ren, L.; Hong, Y. Global view of real-time TRMM multisatellite precipitation analysis: Implications for its successor global precipitation measurement mission. Bull. Am. Meteorol. Soc. 2015, 96, 283–296. [Google Scholar] [CrossRef]
- Huffman, G.J.; Adler, R.F.; Bolvin, D.T.; Gu, G.; Nelkin, E.G.; Bowman, K.P.; Hong, Y.; Stocker, E.F.; Wolff, D.B. The TRMM multisatellite precipitation analysis (TMPA): Quasi-global, multiyear, combined-sensor precipitation estimates at fine scales. J. Hydrometeorol. 2007, 8, 38–55. [Google Scholar] [CrossRef]
- Joyce, R.J.; Janowiak, J.E.; Arkin, P.A.; Xie, P. CMORPH: A method that produces global precipitation estimates from passive microwave and infrared data at high spatial and temporal resolution. J. Hydrometeorol. 2004, 5, 487–503. [Google Scholar] [CrossRef]
- Kubota, T.; Shige, S.; Hashizume, H.; Aonashi, K.; Takahashi, N.; Seto, S.; Hirose, M.; Takayabu, Y.N.; Nakagawa, K.; Iwanami, K.; et al. Global precipitation map using satellite-borne microwave radiometers by the GSMaP Project: Production and validation. IEEE Trans. Geosci. Remote Sens. 2007, 45, 2259–2275. [Google Scholar] [CrossRef]
- Hsu, K.; Gao, X.; Sorooshian, S.; Gupta, H.V. Precipitation estimation from remotely sensed information using artificial neural networks. J. Appl. Meteorol. 1997, 36, 1176–1190. [Google Scholar] [CrossRef]
- Funk, C.; Peterson, P.; Landsfeld, M.; Pedreros, D.; Verdin, J.; Shukla, S.; Husak, G.; Rowland, J.; Harrison, L.; Hoell, A.; et al. The climate hazards infrared precipitation with stations—A new environmental record for monitoring extremes. Sci. Data 2015, 2, 150066. [Google Scholar] [CrossRef] [PubMed] [Green Version]
- Ebert, E.E.; Janowiak, J.E.; Kidd, C. Comparison of near-real-time precipitation estimates from satellite observations and numerical models. Bull. Am. Meteorol. Soc. 2007, 88, 47–64. [Google Scholar] [CrossRef] [Green Version]
- Tian, Y.; Peters-Lidard, C.D.; Adler, R.F.; Kubota, T.; Ushio, T. Evaluation of GSMaP precipitation estimates over the contiguous United States. J. Hydrometeorpl. 2010, 11, 566–574. [Google Scholar] [CrossRef]
- Stampoulis, D.; Anagnostou, E.N. Evaluation of global satellite rainfall products over continental Europe. J. Hydrometeorol. 2012, 13, 588–603. [Google Scholar] [CrossRef]
- Gebremichael, M.; Bitew, M.M.; Hirpa, F.A.; Tesfay, G.N. Accuracy of satellite rainfall estimates in the Blue Nile Basin: Lowland plain versus highland mountain. Water Resour. Res. 2014, 50, 8775–8790. [Google Scholar] [CrossRef]
- Katsanos, D.; Retalis, A.; Michaelides, S. Validation of a high-resolution precipitation database (CHIRPS) over Cyprus for a 30-year period. Atmos. Res. 2016, 169, 459–464. [Google Scholar] [CrossRef]
- Maggioni, V.; Meyers, P.C.; Robinson, M.D. A review of merged high-resolution satellite precipitation product accuracy during the Tropical Rainfall Measuring Mission (TRMM) era. J. Hydrometeorol. 2016, 17, 1101–1117. [Google Scholar] [CrossRef]
- Nguyen, P.; Ombadi, M.; Sorooshian, S.; Hsu, K.; AghaKouchak, A.; Braithwaite, D.; Ashouri, H.; Thorstensen, A.R. The PERSIANN family of global satellite precipitation data: A review and evaluation of products. Hydrol. Earth Syst. Sci. 2018, 22, 5801–5816. [Google Scholar] [CrossRef] [Green Version]
- Khan, S.; Maggioni, V. Assessment of level-3 gridded Global Precipitation Mission (GPM) products over oceans. Remote Sens. 2019, 11, 255. [Google Scholar] [CrossRef] [Green Version]
- Beck, H.E.; Pan, M.; Roy, T.; Weedon, G.P.; Pappenberger, F.; Van Dijk, A.I.J.M.; Huffman, G.J.; Adler, R.F.; Wood, E.F. Daily evaluation of 26 precipitation datasets using Stage-IV gauge-radar data for the CONUS. Hydrol. Earth Syst. Sci. 2019, 23, 207–224. [Google Scholar] [CrossRef] [Green Version]
- Habib, E.; Henschke, A.; Adler, R.F. Evaluation of TMPA satellite-based research and real-time rainfall estimates during six tropical-related heavy rainfall events over Louisiana, USA. Atmos. Res. 2009, 94, 373–388. [Google Scholar] [CrossRef]
- Yong, B.; Hong, Y.; Ren, L.; Gourley, J.; Huffman, G.; Chen, X.; Wang, W.; Khan, S. Hydrologic evaluation of multisatellite precipitation analysis standard precipitation products in basins beyond its inclined latitude band: A case study in Laohahe basin, China. Water Resour. Res. 2010, 46. [Google Scholar] [CrossRef] [Green Version]
- Chen, S.; Hong, Y.; Gourley, J.J.; Huffman, G.J.; Tian, Y.; Cao, Q.; Yong, B.; Kirstetter, P.E.; Hu, J.; Hardy, J.; et al. Evaluation of the successive V6 and V7 TRMM multisatellite precipitation analysis over the Continental United States. Water Resour. Res. 2013, 49, 8174–8186. [Google Scholar] [CrossRef]
- Liu, Z. Comparison of precipitation estimates between Version 7 3-hourly TRMM Multi-Satellite Precipitation Analysis (TMPA) near-real-time and research products. Atmos. Res. 2015, 153, 119–133. [Google Scholar] [CrossRef] [Green Version]
- Prakash, S.; Mitra, A.K.; AghaKouchak, A.; Pai, D.S. Error characterization of TRMM Multisatellite Precipitation Analysis (TMPA-3B42) products over India for different seasons. J. Hydrol. 2015, 529, 1302–1312. [Google Scholar] [CrossRef]
- Huffman, G.J. The Transition in Multi-Satellite Products from TRMM to GPM (TMPA to IMERG); NASA: Washington, DC, USA, 2018. Available online: https://pmm.nasa.gov/sites/default/files/document_files/TMPA-to-IMERG_transition_0.pdf (accessed on 6 September 2019).
- Lu, D.; Yong, B. Evaluation and hydrological utility of the latest GPM IMERG V5 and GSMaP V7 precipitation products over the Tibetan Plateau. Remote Sens. 2018, 10, 2022. [Google Scholar] [CrossRef] [Green Version]
- Yong, B.; Ren, L.; Hong, Y.; Gourley, J.J.; Tian, Y.; Huffman, G.J.; Chen, X.; Wang, W.; Wen, Y. First evaluation of the climatological calibration algorithm in the real-time TMPA precipitation estimates over two basins at high and low latitudes. Water Resour. Res. 2013, 49, 2461–2472. [Google Scholar] [CrossRef] [Green Version]
- Tang, G.; Zeng, Z.; Ma, M.; Liu, R.; Wen, Y.; Hong, Y. Can near-real-time satellite precipitation products capture rainstorms and guide flood warning for the 2016 summer in south China? IEEE Geosci. Remote Sens. Lett. 2017, 14, 1208–1212. [Google Scholar] [CrossRef]
- Zhu, Z.; Yong, B.; Ke, L.; Wang, G.; Ren, L.; Chen, X. Tracing the error sources of global satellite mapping of precipitation for GPM (GPM-GSMaP) over the Tibetan Plateau, China. IEEE J. Sel. Top. Appl. Earth Obs. Remote Sens. 2018, 11, 2181–2191. [Google Scholar] [CrossRef]
- Mega, T.; Ushio, T.; Takahiro, M.; Kubota, T.; Kachi, M.; Oki, R. Gauge-adjusted global satellite mapping of precipitation. IEEE Trans. Geosci. Remote Sens. 2019, 57, 1928–1935. [Google Scholar] [CrossRef]
- Aonashi, K.; Awaka, J.; Hirose, M.; Kozu, T.; Kubota, T.; Liu, G.; Shige, S.; Kida, S.; Seto, S.; Takahashi, N.; et al. GSMaP passive microwave precipitation retrieval algorithm: Algorithm description and validation. J. Meteorolog. Soc. Jpn. Ser. II 2009, 119–136. [Google Scholar] [CrossRef] [Green Version]
- Chen, Z.; Qin, Y.; Shen, Y.; Zhang, S. Evaluation of global satellite mapping of precipitation project daily precipitation estimates over the Chinese mainland. Adv. Meteorol. 2016, 2016, 9365294. [Google Scholar] [CrossRef]
- Yong, B.; Wang, J.; Ren, L.; You, Y.; Xie, P.; Hong, Y. Evaluating four multisatellite precipitation estimates over the Diaoyu Islands during Typhoon seasons. J. Hydrometeorol. 2016, 17, 1623–1641. [Google Scholar] [CrossRef]
- Satgé, F.; Hussain, Y.; Bonnet, M.P.; Hussain, B.M.; Martinez-Carvajal, H.; Akhter, G.; Uagoda, R. Benefits of the Successive GPM Based Satellite Precipitation Estimates IMERG–V03,–V04,–V05 and GSMaP–V06,–V07 Over Diverse Geomorphic and Meteorological Regions of Pakistan. Remote Sens. 2018, 10, 1373. [Google Scholar] [CrossRef] [Green Version]
- Yong, B.; Chen, B.; Tian, Y.; Yu, Z.; Hong, Y. Error-component analysis of TRMM-based multi-satellite precipitation estimates over mainland China. Remote Sens. 2016, 8, 440. [Google Scholar] [CrossRef] [Green Version]
- Xie, P.; Chen, M.; Yang, S.; Yatagai, A.; Hayasaka, T.; Fukushima, Y.; Liu, C. A gauge-based analysis of daily precipitation over East Asia. J. Hydrometeor. 2007, 8, 607–626. [Google Scholar] [CrossRef]
- Shen, Y.; Xiong, A.; Wang, Y.; Xie, P. Performance of high-resolution satellite precipitation products over China. J. Geophys. Res. Atmos. 2010, 115. [Google Scholar] [CrossRef]
- Shen, Y.; Xiong, A. Validation and comparison of a new gauge-based precipitation analysis over mainland China. Int. J. Climatol. 2016, 36, 252–265. [Google Scholar] [CrossRef]
- Guo, H.; Chen, S.; Bao, A.; Behrangi, A.; Hong, Y.; Ndayisaba, F.; Hu, J.; Stepanian, P.M. Early assessment of integrated multi-satellite retrievals for global precipitation measurement over China. Atmos. Res. 2016, 176, 121–133. [Google Scholar] [CrossRef]
- Zhao, H.; Yang, S.; You, S.; Huang, Y.; Wang, Q.; Zhou, Q. Comprehensive evaluation of two successive V3 and V4 IMERG Final Run precipitation products over mainland China. Remote Sens. 2017, 10, 34. [Google Scholar] [CrossRef] [Green Version]
- Sun, W.; Ma, J.; Yang, G.; Li, W. Statistical and Hydrological Evaluations of Multi-Satellite Precipitation Products over Fujiang River Basin in Humid Southeast China. Remote Sens. 2018, 10, 1898. [Google Scholar] [CrossRef] [Green Version]
- Chen, H.; Yong, B.; Gourley, J.J.; Liu, J.; Ren, L.; Wang, W.; Hong, Y.; Zhang, J. Impact of the crucial geographic and climatic factors on the input source errors of GPM-based global satellite precipitation estimates. J. Hydrol. 2019, 575, 1–16. [Google Scholar] [CrossRef]
- Tian, Y.; Peters-Lidard, C.D.; Eylander, J.B.; Joyce, R.J.; Huffman, G.J.; Adler, R.F.; Hsu, K.; Turk, F.J.; Garcia, M.; Zeng, J. Component analysis of errors in satellite-basd precipitation estimates. J. Geophys. Res. Atmos. 2009, 114. [Google Scholar] [CrossRef] [Green Version]
- Li, Z.; Yang, D.; Hong, Y. Multi-scale evaluation of high-resolution multi-sensor blended global precipitation products over the Yangtze River. J. Hydrol. 2013, 500, 157–169. [Google Scholar] [CrossRef]
- Kim, K.; Park, J.; Baik, J.; Choi, M. Evaluation of topographical and seasonal feature using GPM IMERG and TRMM 3B42 over Far-East Asia. Atmos. Res. 2017, 187, 95–105. [Google Scholar] [CrossRef]
- Xu, F.; Guo, B.; Ye, B.; Ye, Q.; Chen, H.; Ju, X.; Guo, J.; Wang, Z. Systematical Evaluation of GPM IMERG and TRMM 3B42V7 Precipitation Products in the Huang-Huai-Hai Plain, China. Remote Sens. 2019, 11, 697. [Google Scholar] [CrossRef] [Green Version]
- You, Y.; Wang, N.Y.; Ferraro, R.; Rudlosky, S. Quantifying the snowfall detection performance of the GPM microwave imager channels over land. J. Hydrometeor. 2017, 18, 729–751. [Google Scholar] [CrossRef]
- Ferraro, R.R.; Smith, E.A.; Berg, W.; Huffman, G.J. A screening methodology for passive microwave precipitation retrieval algorithms. J. Atmos. Sci. 1998, 55, 1583–1600. [Google Scholar] [CrossRef]
- Dinku, T.; Ruiz, F.; Connor, S.J.; Ceccato, P. Validation and intercomparison of satellite rainfall estimates over Colombia. J. Appl. Meteorol. Climatol. 2009, 49, 1004–1014. [Google Scholar] [CrossRef]
- Tan, M.L.; Ibrahim, A.L.; Duan, Z.; Cracknell, A.P.; Chaplot, V. Evaluation of six high-resolution satellite and ground-based precipitation products over Malaysia. Remote Sens. 2015, 7, 1504. [Google Scholar] [CrossRef] [Green Version]
- Duan, Z.; Liu, J.; Tuo, Y.; Chiogna, G.; Disse, M. Evaluation of eight high spatial resolution gridded precipitation products in Adige Basin (Italy) at multiple temporal and spatial scales. Sci. Total Environ. 2016, 573, 1536–1553. [Google Scholar] [CrossRef] [PubMed] [Green Version]
- Maggioni, V.; Massari, C. On the performance of satellite precipitation products in riverine flood modeling: A review. J. Hydrol. 2018, 558, 214–224. [Google Scholar] [CrossRef]
- Sun, Q.; Miao, C.; Duan, Q.; Ashouri, H.; Sorooshian, S.; Hsu, K.-L. A review of global precipitation datasets: Data sources, estimation, and intercomparisons. Rev. Geogr. 2018, 56, 79–107. [Google Scholar] [CrossRef] [Green Version]
- Prakash, S. Performance assessment of CHIRPS, MSWEP, SM2RAIN-CCI, and TMPA precipitation products across India. J. Hydrol. 2019, 571, 50–59. [Google Scholar] [CrossRef]
- Cattani, E.; Merino, A.; Levizzani, V. Evaluation of monthly satellite-derived precipitation products over East Africa. J. Hydrometeorol. 2016, 17, 2555–2573. [Google Scholar] [CrossRef]
- Rozante, J.; Vila, D.; Barboza Chiquetto, J.; Fernandes, A.; Souza Alvim, D. Evaluation of TRMM/GPM blended daily products over Brazil. Remote Sens. 2018, 10, 882. [Google Scholar] [CrossRef] [Green Version]
- Navarro, A.; García-Ortega, E.; Merino, A.; Sánchez, J.L.; Kummerow, C.; Tapiador, F.J. Assessment of IMERG Precipitation Estimates over Europe. Remote Sens. 2019, 11, 2470. [Google Scholar] [CrossRef] [Green Version]
- Tan, J.; Petersen, W.A.; Kirstetter, P.E.; Tian, Y. Performance of IMERG as a function of spatiotemporal scale. J. Hydrometeorol. 2017, 18, 307–319. [Google Scholar] [CrossRef] [PubMed]
- Omranian, E.; Sharif, H.O. Evaluation of the Global Precipitation Measurement (GPM) satellite rainfall products over the lower Colorado River basin, Texas. J. Am. Water Resour. Assoc. 2018, 54, 882–898. [Google Scholar] [CrossRef]
- Su, X.; Shum, C.K.; Luo, Z. Evaluating imerg v04 final run for monitoring three heavy rain events over mainland China in 2016. IEEE Geosci. Remote Sens. Lett. 2018, 15, 444–448. [Google Scholar] [CrossRef]
- Huang, C.; Hu, J.; Chen, S.; Zhang, A.; Liang, Z.; Tong, X.; Xiao, L.; Min, C.; Zhang, Z. How Well Can IMERG Products Capture Typhoon Extreme Precipitation Events over Southern China? Remote Sens. 2019, 11, 70. [Google Scholar] [CrossRef] [Green Version]
Figure 1.
(a) Distribution of station density used in this study. Four climate regions (①–④: Humid, semi-humid, semi-arid, arid) are outlined in Mainland China. (b–d) Daily mean precipitation over Mainland China during the period of September 2017–August 2019, from gauge observations, GSMaP_NRT, and GSMaP_Gauge_NRT precipitations.

Figure 2.
Spatial distribution of statistical indices derived from the GSMaP_NRT (left column) and GSMaP_Gauge_NRT (right column) daily precipitation at 0.25° × 0.25° resolution over the Mainland China: (a,b) Correlation coefficient (CC), (c,d) root mean square error (RMSE), and (e,f) probablility of detection (POD).

Figure 3.
(a) Time series of mean monthly precipitation and monthly variations of statistical indices over grid boxes with at least one gauge in Mainland China: (b) Correlation coefficient (CC), (c) root mean square error (RMSE), (d) relative bias (BIAS), and (e) probablility of detection (POD).
Figure 3.
(a) Time series of mean monthly precipitation and monthly variations of statistical indices over grid boxes with at least one gauge in Mainland China: (b) Correlation coefficient (CC), (c) root mean square error (RMSE), (d) relative bias (BIAS), and (e) probablility of detection (POD).

Figure 4.
Scatterplots of the daily precipitation for GSMaP_NRT (left) and GSMaP_Gauge_NRT (right) versus gauge observations at selected grid boxes over four climate regions: (a,b) Humid region; (c,d) semi-humid region; (e,f) semi-arid region; (g,h) arid region.
Figure 4.
Scatterplots of the daily precipitation for GSMaP_NRT (left) and GSMaP_Gauge_NRT (right) versus gauge observations at selected grid boxes over four climate regions: (a,b) Humid region; (c,d) semi-humid region; (e,f) semi-arid region; (g,h) arid region.

Figure 5.
Daily intensity distribution of the total, hit, miss, and false precipitation over four climate regions: (a–d) Humid region; (e–h) semi-humid region; (i–l) semi-arid region; and (m–p) arid region. The total observed precipitation (black line) is also shown in the first two columns.
Figure 5.
Daily intensity distribution of the total, hit, miss, and false precipitation over four climate regions: (a–d) Humid region; (e–h) semi-humid region; (i–l) semi-arid region; and (m–p) arid region. The total observed precipitation (black line) is also shown in the first two columns.

Figure 6.
Global map of mean daily precipitation difference between (a) GSMaP_NRT and GSMaP_Gauge and (b) GSMaP_Gauge_NRT and GSMaP_Gauge.
Figure 6.
Global map of mean daily precipitation difference between (a) GSMaP_NRT and GSMaP_Gauge and (b) GSMaP_Gauge_NRT and GSMaP_Gauge.


Table 1.
Seasonal statistics of GSMaP_NRT and GSMaP_Gauge_NRT against ground observations from selected 0.25° grid boxes over the Mainland China.
Table 1.
Seasonal statistics of GSMaP_NRT and GSMaP_Gauge_NRT against ground observations from selected 0.25° grid boxes over the Mainland China.
| Season | Product | CC | ME (mm) | BIAS (%) | RMSE (mm) | POD | FAR | CSI |
|---|---|---|---|---|---|---|---|---|
| Annual | GSMaP_NRT | 0.58 | 0.40 | 15.84 | 9.11 | 0.69 | 0.33 | 0.52 |
| GSMaP_Gauge_NRT | 0.67 | 0.11 | 4.46 | 7.07 | 0.70 | 0.35 | 0.51 | |
| Spring | GSMaP_NRT | 0.61 | 0.88 | 34.49 | 8.91 | 0.76 | 0.36 | 0.54 |
| GSMaP_Gauge_NRT | 0.68 | −0.03 | −1.23 | 6.29 | 0.74 | 0.34 | 0.53 | |
| Summer | GSMaP_NRT | 0.62 | 0.33 | 6.48 | 12.26 | 0.76 | 0.26 | 0.60 |
| GSMaP_Gauge_NRT | 0.67 | 0.01 | 0.27 | 10.59 | 0.76 | 0.24 | 0.61 | |
| Autumn | GSMaP_NRT | 0.48 | 0.32 | 16.15 | 8.71 | 0.67 | 0.36 | 0.48 |
| GSMaP_Gauge_NRT | 0.65 | 0.39 | 19.41 | 6.12 | 0.72 | 0.45 | 0.45 | |
| Winter | GSMaP_NRT | 0.41 | 0.06 | 7.07 | 6.15 | 0.42 | 0.41 | 0.32 |
| GSMaP_Gauge_NRT | 0.58 | 0.07 | 8.33 | 4.56 | 0.43 | 0.45 | 0.32 |
© 2020 by the authors. Licensee MDPI, Basel, Switzerland. This article is an open access article distributed under the terms and conditions of the Creative Commons Attribution (CC BY) license (http://creativecommons.org/licenses/by/4.0/).
Share and Cite
MDPI and ACS Style
Lu, D.; Yong, B. A Preliminary Assessment of the Gauge-Adjusted Near-Real-Time GSMaP Precipitation Estimate over Mainland China. Remote Sens. 2020, 12, 141. https://doi.org/10.3390/rs12010141
AMA Style
Lu D, Yong B. A Preliminary Assessment of the Gauge-Adjusted Near-Real-Time GSMaP Precipitation Estimate over Mainland China. Remote Sensing. 2020; 12(1):141. https://doi.org/10.3390/rs12010141
Chicago/Turabian StyleLu, Dekai, and Bin Yong. 2020. "A Preliminary Assessment of the Gauge-Adjusted Near-Real-Time GSMaP Precipitation Estimate over Mainland China" Remote Sensing 12, no. 1: 141. https://doi.org/10.3390/rs12010141
Note that from the first issue of 2016, this journal uses article numbers instead of page numbers. See further details here.