Dam Leakage Detection by Borehole Radar: A Case-History Study


1
College of Geo-Exploration Science and Technology, Jilin University, Changchun 130026, China
2
Ministry of Land and Resources Key Laboratory of Applied Geophysics, Jilin University, Changchun 130026, China
*
Author to whom correspondence should be addressed.
Remote Sens. 2019, 11(8), 969; https://doi.org/10.3390/rs11080969
Submission received: 13 March 2019
/
Revised: 11 April 2019
/
Accepted: 15 April 2019
/
Published: 23 April 2019
(This article belongs to the Special Issue Recent Progress in Ground Penetrating Radar Remote Sensing)
Abstract
:A borehole radar investigation was performed at the Sanzuodian reservoir, Chifeng, China to assess possible leakage paths located in the deep dam foundation. The key methodologies used include both single-hole reflection and cross-hole radar tomography, which make a high-resolution identification of the hydraulic connection paths between upstream and downstream sides possible. The leakage paths are characterized by direct wave loss due to high electromagnetic attenuation in the single-hole reflection profile and the nearly horizontal-banded low-velocity zone in the cross-hole velocity tomography due to possible large internal erosion. Meanwhile, some small structures inside the dam, including the core wall thickness changing point, the connecting point between asphalt and concrete walls, and the contacting interface between the dry and the water-saturated formations can be identified from the single-hole reflection profile clearly. Interpreted leakage paths are proven by the water flow measurement. Borehole radar is a useful high-resolution tool, suitable for deep leakage detection and evaluation.

1. Introduction
Dam leakage is a very important issue for safety concerns in our society. The formation of dam leakage is very complicated, and the reasons for dam leakage and relevant reinforcement schemes can be provided through geophysical prospecting. The effective methods for dam leakage detection can be classified into non-geophysical and geophysical ones. Non-geophysical methods include isotope tracing and flow field detection, etc., while geophysical methods include ERT (Electrical Resistivity Tomography), self-potential (SP), electromagnetic (EM), electrical sounding (ES), and ground penetrating radar (GPR) et al. [1,2,3,4,5,6,7,8,9,10].
Isotope tracing is an essential way to detect fluid flow. People use the tracing method to study a drainage gallery found in a hydropower station where the interconnection experiments have proved this result [1]. Flow field measurement is carried out within a borehole by a flow meter.
Because of the sensitive resistivity change in the leakage zone, ERT is efficient at detecting dam leakage. In Sweden, an embankment called Hällby is the first one equipped with a permanent monitoring system for resistivity measurements [2]. What is unique about this long-term data is that the system makes a measurement every single day and there is evidence that resistivity monitoring is probably capable of detecting the development of internal erosion even at an early stage. As a tool in preventative geotechnical asset maintenance, ERT imaging is able to work as a monitoring framework that controls the movement of water and identifies factors that may cause failure in the embankments [3]. There was a study conducted to investigate the mechanism of the abnormal leakage with the assistance of ERT after several unusual leaks appeared on the downstream face of an earth dam after the dam had been reconstructed to raise the maximum reservoir water level [4]. A methodology was proposed based on 3D direct numerical simulations of the ERT acquisition using a realistic topography of the study site [5]. The method was first evaluated on a set of synthetic dyke configurations. Then, it was applied to experimental static and time lapse ERT data set acquired before and after repair works carried out on a leaking zone of an earth-filled canal dyke in the center of France [5]. In addition, three original electrode arrays for the effective leakage detection of concrete hydraulic facilities through electrical resistivity surveys are proposed and a numerical modeling and two field tests were performed to verify these new arrays and interpretation methods [6].
A new protocol for SP measurements involving a brine injection was carried out, and was used to find leakages and to measure their fluid permeability in quantities [7]. A network of non-polarizing electrodes was used to perform time-lapse SP measurements at the dam crest when the brine was injected into the upstream of the seepage zone and measured the permeability of the leaking area [7].
In the context of dam inspection, surface GPR is a high-resolution tool; however, it has limited penetrating depth. There are changes in the water content in leakage zones, which will appear differently in their electromagnetic qualities, which may in turn count as an advantage in the application of the GPR method. GPR is used to examine the dam body, and thus make a prediction about the location of the fracture zone in the dam, subsequently coming up with practicable technological measures [8]. The GPR technique has also been utilized in detecting some common subsurface voids inside dykes and dams in Southern China, and the results show that GPR is totally capable of uncovering termite nests inside dykes and dams. This technique proves to be beneficial for real-time retrieval of detection results and precise position, and the application is less susceptible to locality and climate compared to other approaches [9]. GPR was also used for the monitoring and diagnostics of one of the largest dams in the Basilicata region (Southern Italy). The investigation aims to detect and localize underground sandstone banks that are potential ways of water flow below the dam [10].
Instead of using a single method, a combination of various approaches has come to be preferred because it is more informative [11]. With respect to dam leakage detection, a combinative method is more applicable. A dam that was currently suffering severe water infiltration and leakage through its bedrocks was investigated with several geophysical methods including electromagnetic (EM), electrical sounding (ES) and electrical resistivity tomography (ERT) [12]. By analyzing the comprehensive outputs of all of these methods, a serious vertical leakage was found, which could have occurred in certain locations via fractures and faults, which would have hit the main valley and passed through the dam lake. Utilizing isotope tracing tests and resistivity tomographic tests, various inversion results of three different earth rock-fill dam models were compared with the actual leakage passages [13]. It turned out that isotope tracing tests can predict the leakage and the direction of the seepage; also, the degree of the leakage can be determined by the horizontal and the vertical seepage velocity; however, proper determination of the leakage passages’ position and the range of leakage are rather difficult using this method. Comparatively, the positions of the leakage passages can be accurately and directly reflected through ERT tests [13]. At Dadu basin in China, people performed an integrated geophysical investigation to assess the condition of the dam curtain [14]. The flow-field fitting method made possible the identification of the hydraulic connections between the dam foundation and both upstream and downstream surface water sources, as well as location of the anomalous leakage outlets in the dam foundation. Although the flow-field fitting method has some limitations, its capacity for resistivity logging to identify the internal erosion that has not yet developed into seepage pathways make up for this. To evaluate the seepage phenomena, a study was conducted through the application of the ground penetrating radar survey (GPR), piezometric analysis, and temperature field evaluation techniques, as well as the construction of the dam’s flow net model [15]. This proves that the GPR profiles have depicted the crucial zones in the dam body, identified the water seepage paths from the reservoir to the downstream side of the dam, and assessed the seepage rate. Along with cores, visual inspection, and permeability logging performed by an updated drilling system, GPR observations obtained on an earth embankment are utilized to detect decompressed zones associated with leakage areas visible at the foot of the downstream slope and locate potential voids underneath the paved revetment [16]. This multidisciplinary method, which complies with the dyke inspection methodology, was found to be effective in assessing earth embankments. Newer applications of engineering geophysics during the construction phase, dam safety assessment, and sustainable management have been introduced [17]. The survey of these case studies broadens the perspective of how geophysical methods can be applied to dam projects throughout a dam’s life cycle, strengthening the linkage between geophysical surveillance and engineering significance at all stages [17]. In addition, people have investigated the combined use of extensive geotechnical, hydrogeological and geophysical techniques to assess the condition of a small earth dyke with a permanent hydraulic head [18]. Four techniques (GEM2, ERT, Self-Potential and microgravimetry) were used to assess the post flood damage of earth dams [19]. Different methods have different characteristics and detect different physical properties. They are often complementary. Therefore, the combination of multiple methods can eliminate the inherent defects of a single method, play a complementary role, and greatly improve the capability to solve practical problems.
As the leakages grow deeper, the surface geophysical methods, though combined with other methods, do not work well, due to limited investigation depth and resolution; borehole approaches like borehole radar, borehole-to-surface electrical resistivity tomography and cross-hole seismic tomographic imaging become crucial choices, because borehole tools can closely approach targets [20,21]. A borehole radar system was initially developed for cross-hole radar tomography and was claimed to be useful for imaging the grouting sphere throughout the foundation rocks at dam construction sites; however, no practical leakage inspection has yet been reported [22]. We presented some incomplete results [23] previously; the extended and completed results and analysis are presented here.
The borehole radar method provides both a single-hole reflection profile and cross-hole tomography. Single-hole reflection profile can provide direct wave and reflection event information, while cross-hole tomography can delineate the leakage path between two holes, all of which are related to water leakage within the dam. In addition, water flow provides a direct index to water leakage within a borehole. These data provide a combined complementary approach superior to previous one.
Focusing on deep leakage path detection of the high dam, we investigate the feasibility of borehole radar combined with the water flow data and present a complete and comprehensive case history study.
2. Methodology
We utilize borehole data combined with water flow test data to detect possible deep leakage paths.
Borehole radar is a geophysical tool which can overcome the shortcomings of surface GPR, and which is characterized by deep investigation capability and high resolution [24]. It includes three operation modes: single-hole reflection, cross-hole radar, and surface-to-borehole measurements. Although the reflection wave is the main focus for the single-hole reflection, the direct wave may sometimes include more important information. Cross-hole radar measurements mainly use first arrival time for velocity [25]. The water flow meter measures the water movement within the borehole.
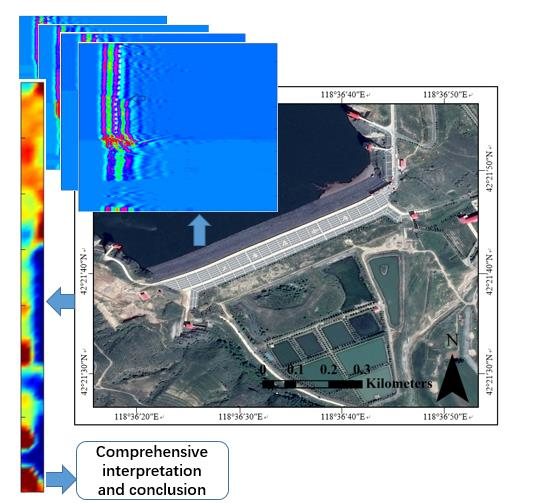
The workflow adopted is:
- (1)
- Describe the test site in detail.
- (2)
- Present the single-hole reflection data and the corresponding interpreted results.
- (3)
- Present the cross-hole radar data and the velocity tomography result, and the corresponding interpreted results.
- (4)
- Present the comprehensive interpreted results of combined water flow data, and prove their feasibility.
3. Field Site Description
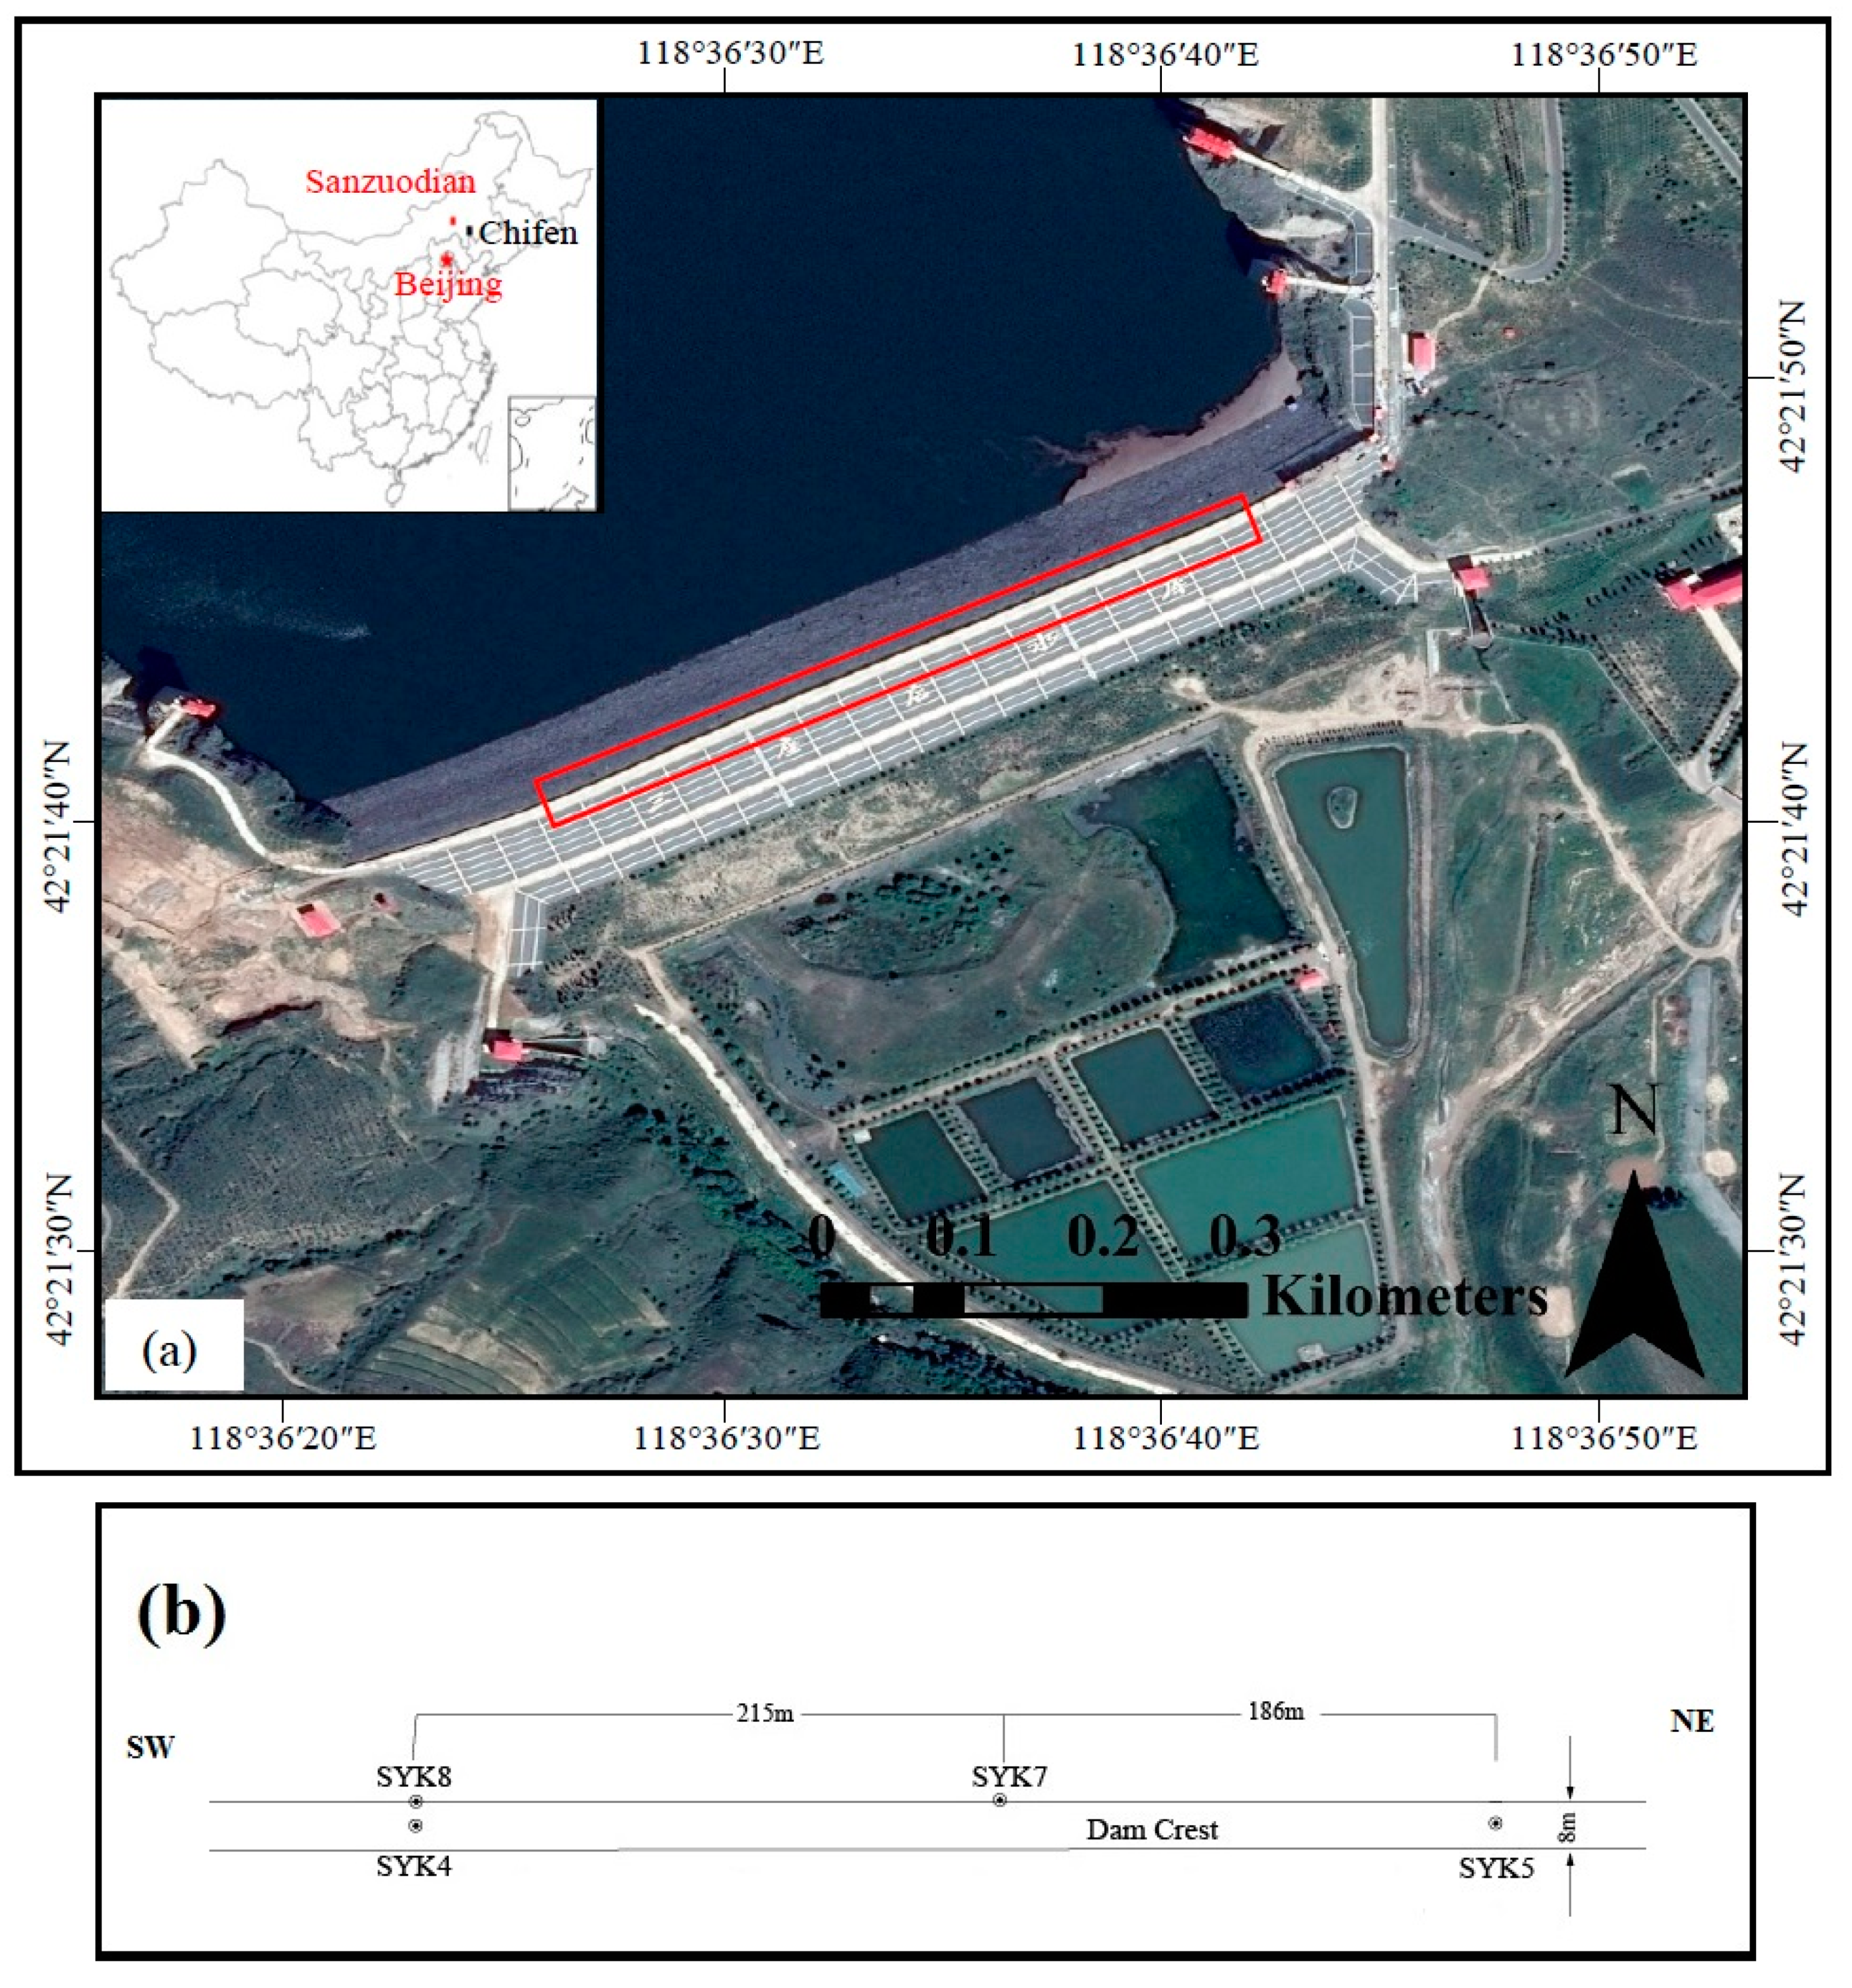
The Sanzuodian Reservoir is located upstream of the west Liaohe River, 35 km from Chifeng city, China, as shown in Figure 1a. The normal water level of the reservoir is 724.0 m above sea level; the dead water level is 707.0 m above sea level; the designed flood level is 729.09 m above sea level; and the total storage capacity is 324 million m3.
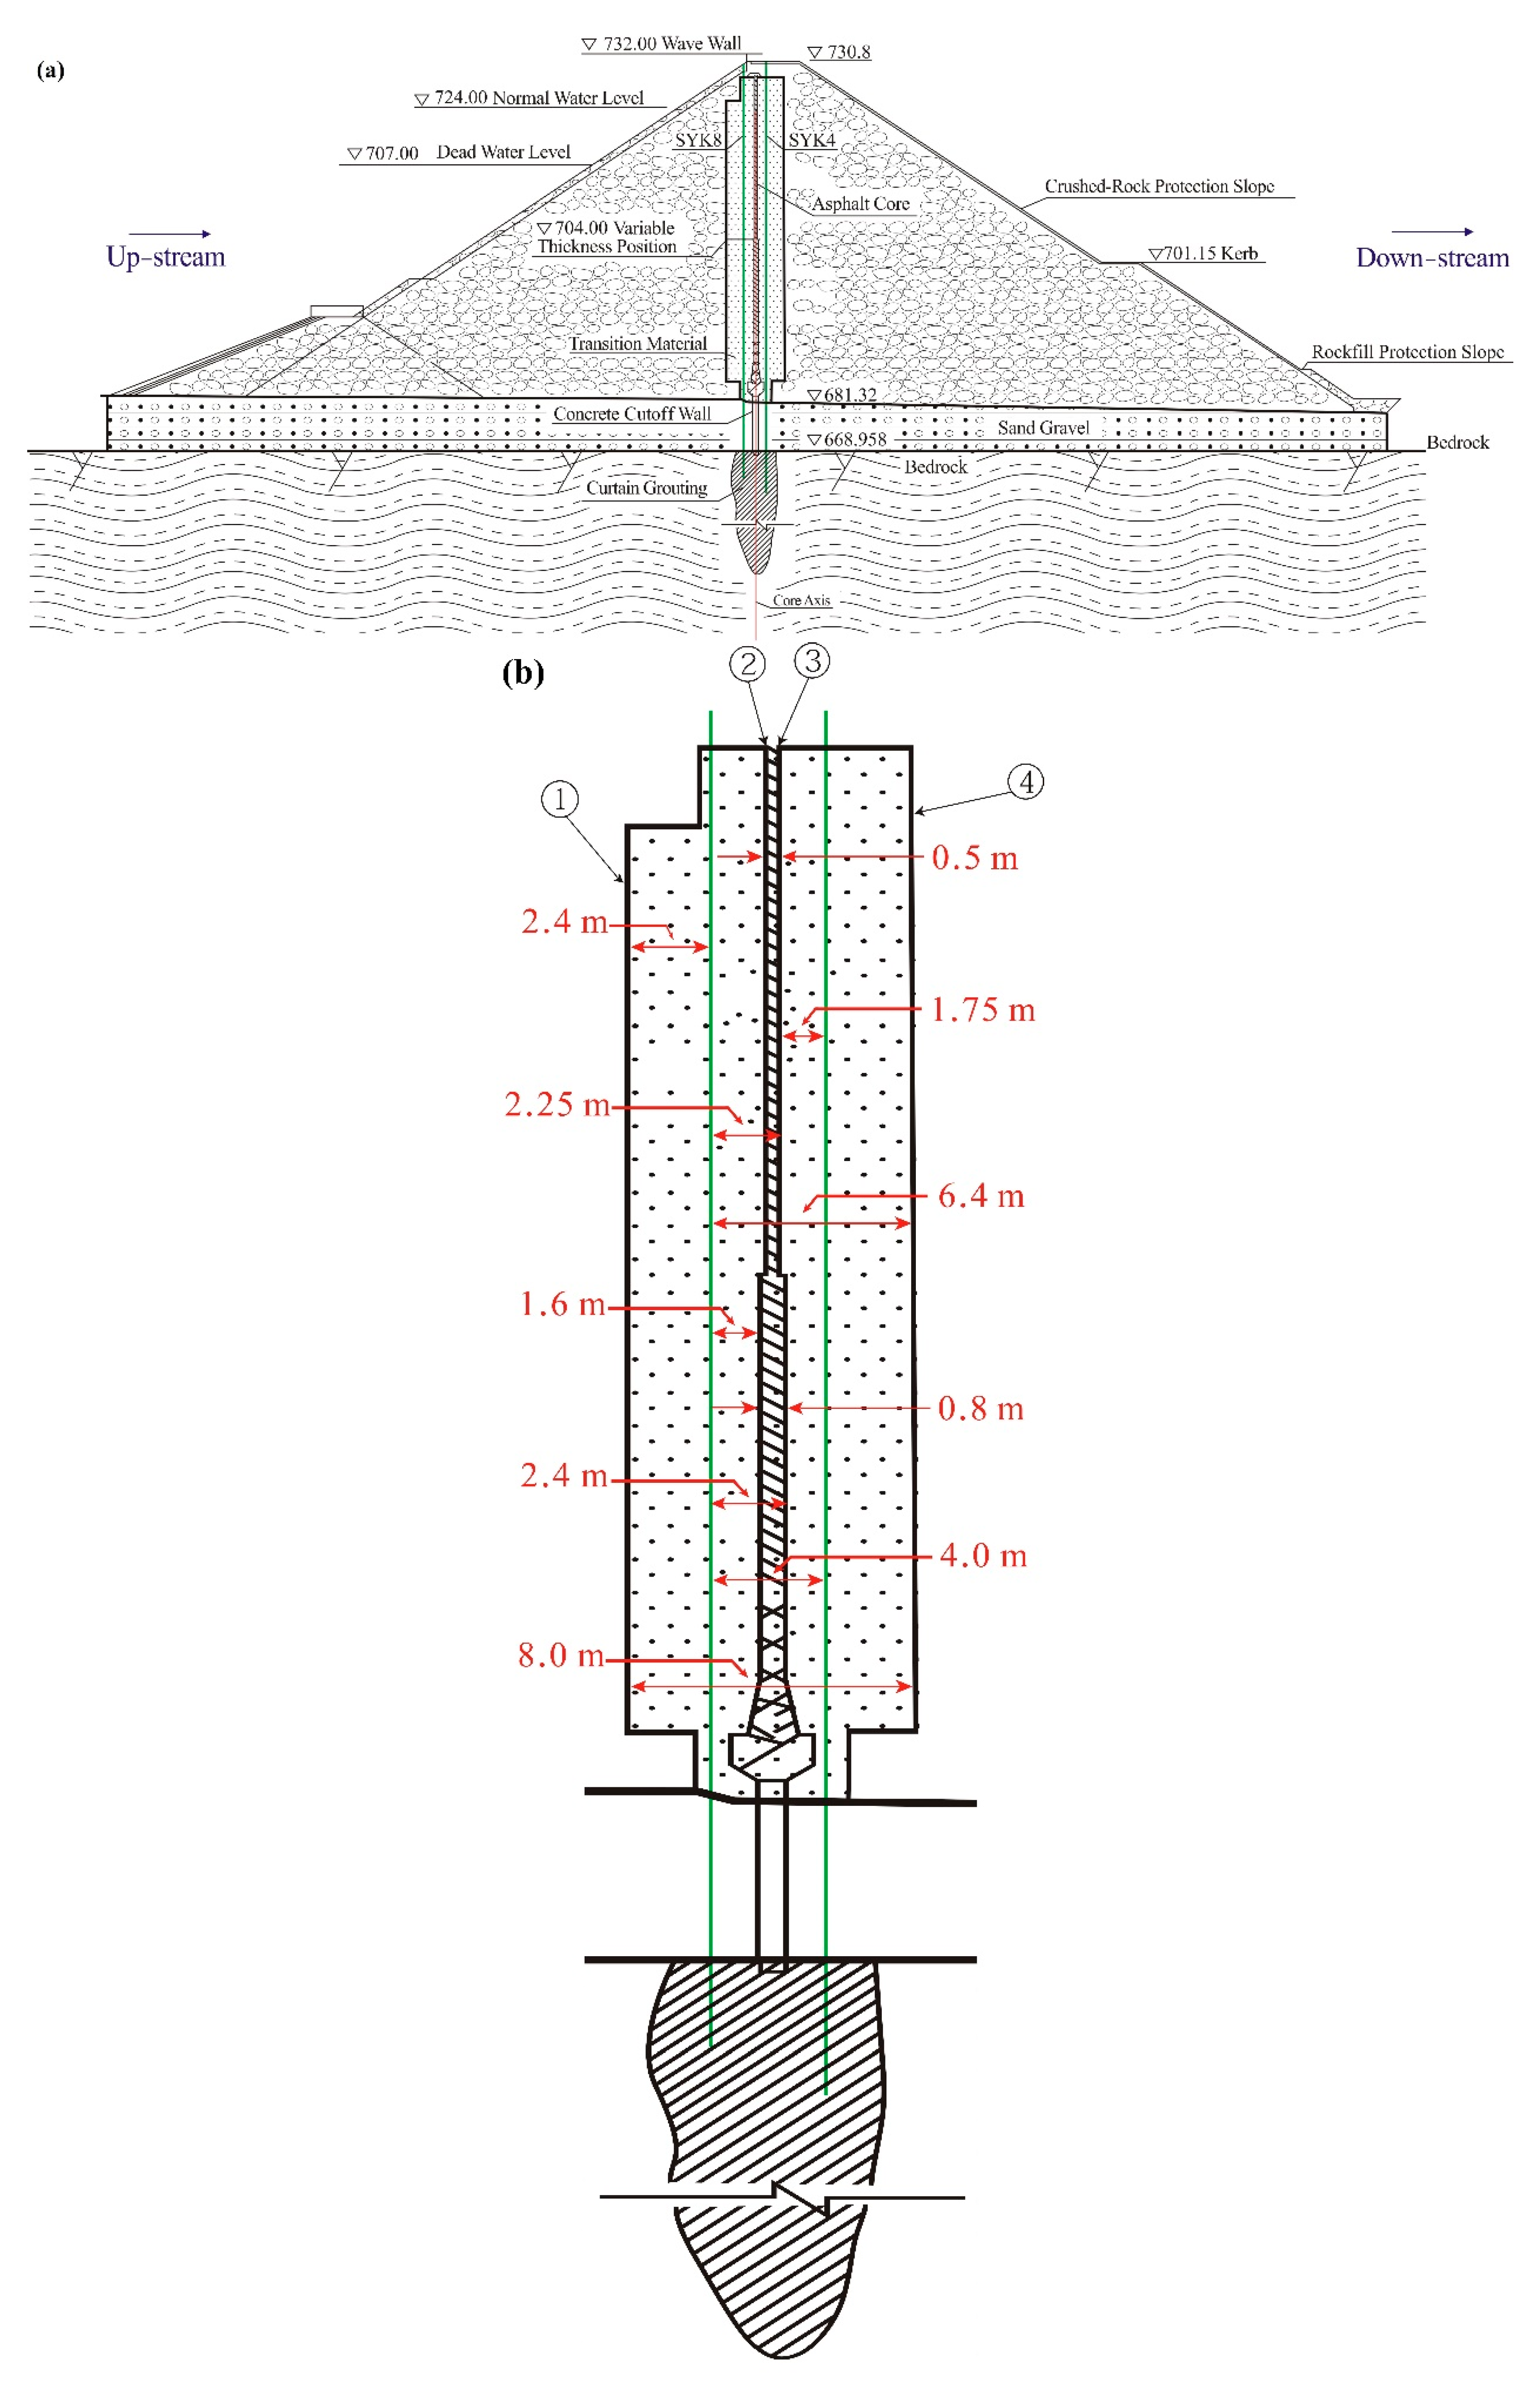
As shown in Figure 2a, the dam is a rock-filled one, including an asphalt or concrete core wall contained in the 8.8 m thick transitional material wall. The length, width and elevation of the dam crest are 614.40 m, 8.00 m and 730.80 m. The variable cross-section form is used for the asphalt core wall of the dam: for the elevation from 685.35 m to 704.00 m, the thickness of the wall is 0.8 m; for the elevation from 704.00 to 729.04 m, the thickness of the wall is 0.5 m. The asphalt concrete core wall connects with the concrete core wall through a small concrete platform, of which the width is 2.5 m and the height is 2.0 m. From the riverbed to the bedrock, the concrete core wall is used for preventing seepage. The thickness of the concrete core wall is 0.8 m; the maximum height is about 30 m, and the bottom of the wall is embedded in the bedrock as deep as 0.5 to 1.0 m. Below the concrete core wall is a single row of grouting curtain, the elevation of the bottom of the grouting hole is 620.00 m, and the interval among the grouting holes is 2.0 m.
The reservoir began to store water in May 2009, after the water storage safety identification was issued by the authority. In March 2013, a free flow appeared in the downstream, and this increased further in April. As the water level reached 699.6 m above sea level, the free flow reached 300 m3/h in the downstream.
To detect seepage zones, a large number of observation holes were drilled in and around the top of the dam, and water flow measurements are carried out through these holes. Most of the holes were completed with metal casing, while some of them used PVC pipe, including SYK4, SYK5, SYK7, and SYK8, among which SYK4 and SYK5 are located on the upstream side of the reservoir 2 m away from the axis of the core wall, while SYK7 and SYK8 are located on the downstream side of the reservoir, 2 m away from the axis of the core wall, as shown in Figure 1b. SYK8, SYK4 are neighboring holes separated by a distance of 4 m, with the core wall axis in between them. We conducted single-hole radar reflection measurement in these 4 boreholes and cross-hole radar measurement in SYK4 and SYK8 to evaluate the borehole radar’s feasibility for detecting dam leakage.
From left to right, as shown in Figure 2b, there are four vertical physical interfaces near the borehole: the two sides of the transitional material wall (8.8 m thick including core wall) are designated as interface 1 and 4; the two sides of the asphalt core wall (0.5 m thick in the upper part, 0.8 m in down part) are designated as interface 2 and 3 here. Above the thickness change point, the distances from the borehole SYK8 (same for SYK7) to interfaces 1–4 are 2.4 m, 1.75 m, 2.25 m, and 6.4 m, respectively. Below that point, the distances become 2.4 m, 1.6 m, 2.4 m, and 6.4 m, respectively, due to the increasing thickness of the core wall. The distances from the borehole SYK4 (same for SYK5) to interfaces 1–4 are 6.4 m, 2.25 m, 1.75 m, and 2.4 m, respectively, above the thickness change point. Below this point, the distances become 6.4 m, 2.4 m, 1.6 m, and 2.4 m, respectively, due to the increasing thickness of the core wall.
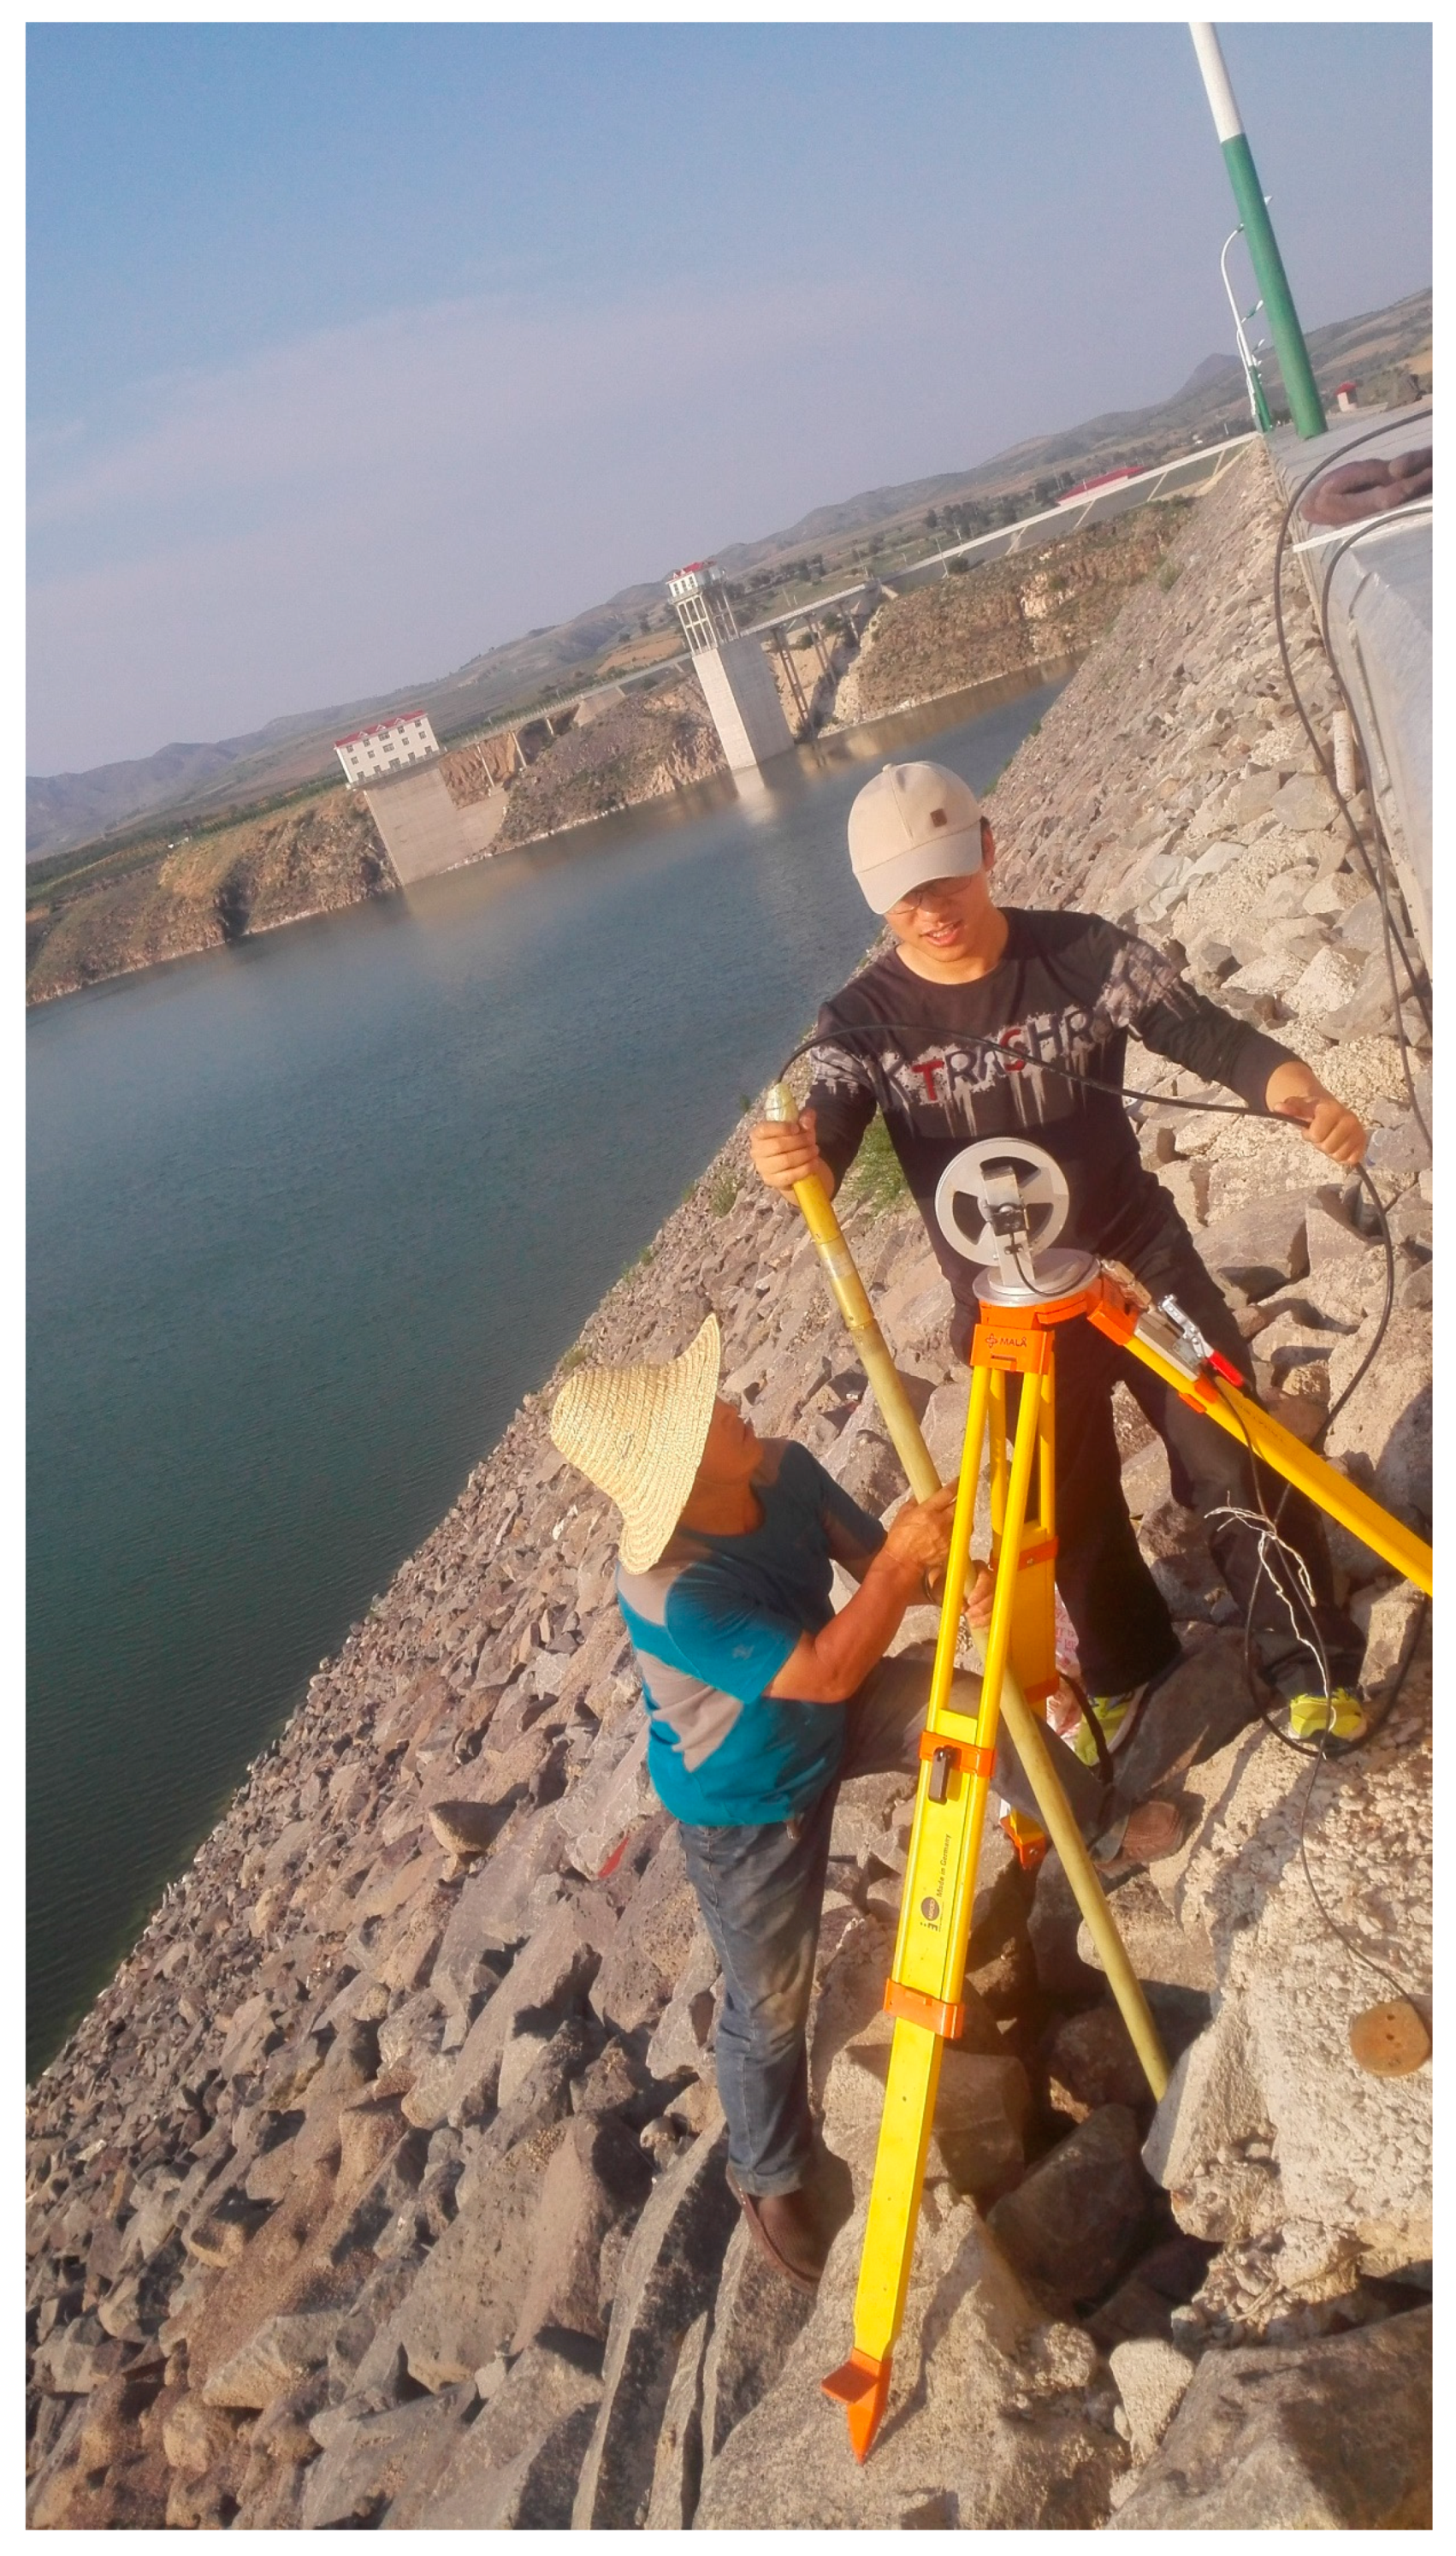
The radar system used in the test is the RAMAC radar of MALA Company, with an antenna with dominant frequency of 100 MHz. A photo for the field operation is shown in Figure 3.
4. Single-Hole Reflection Measurement
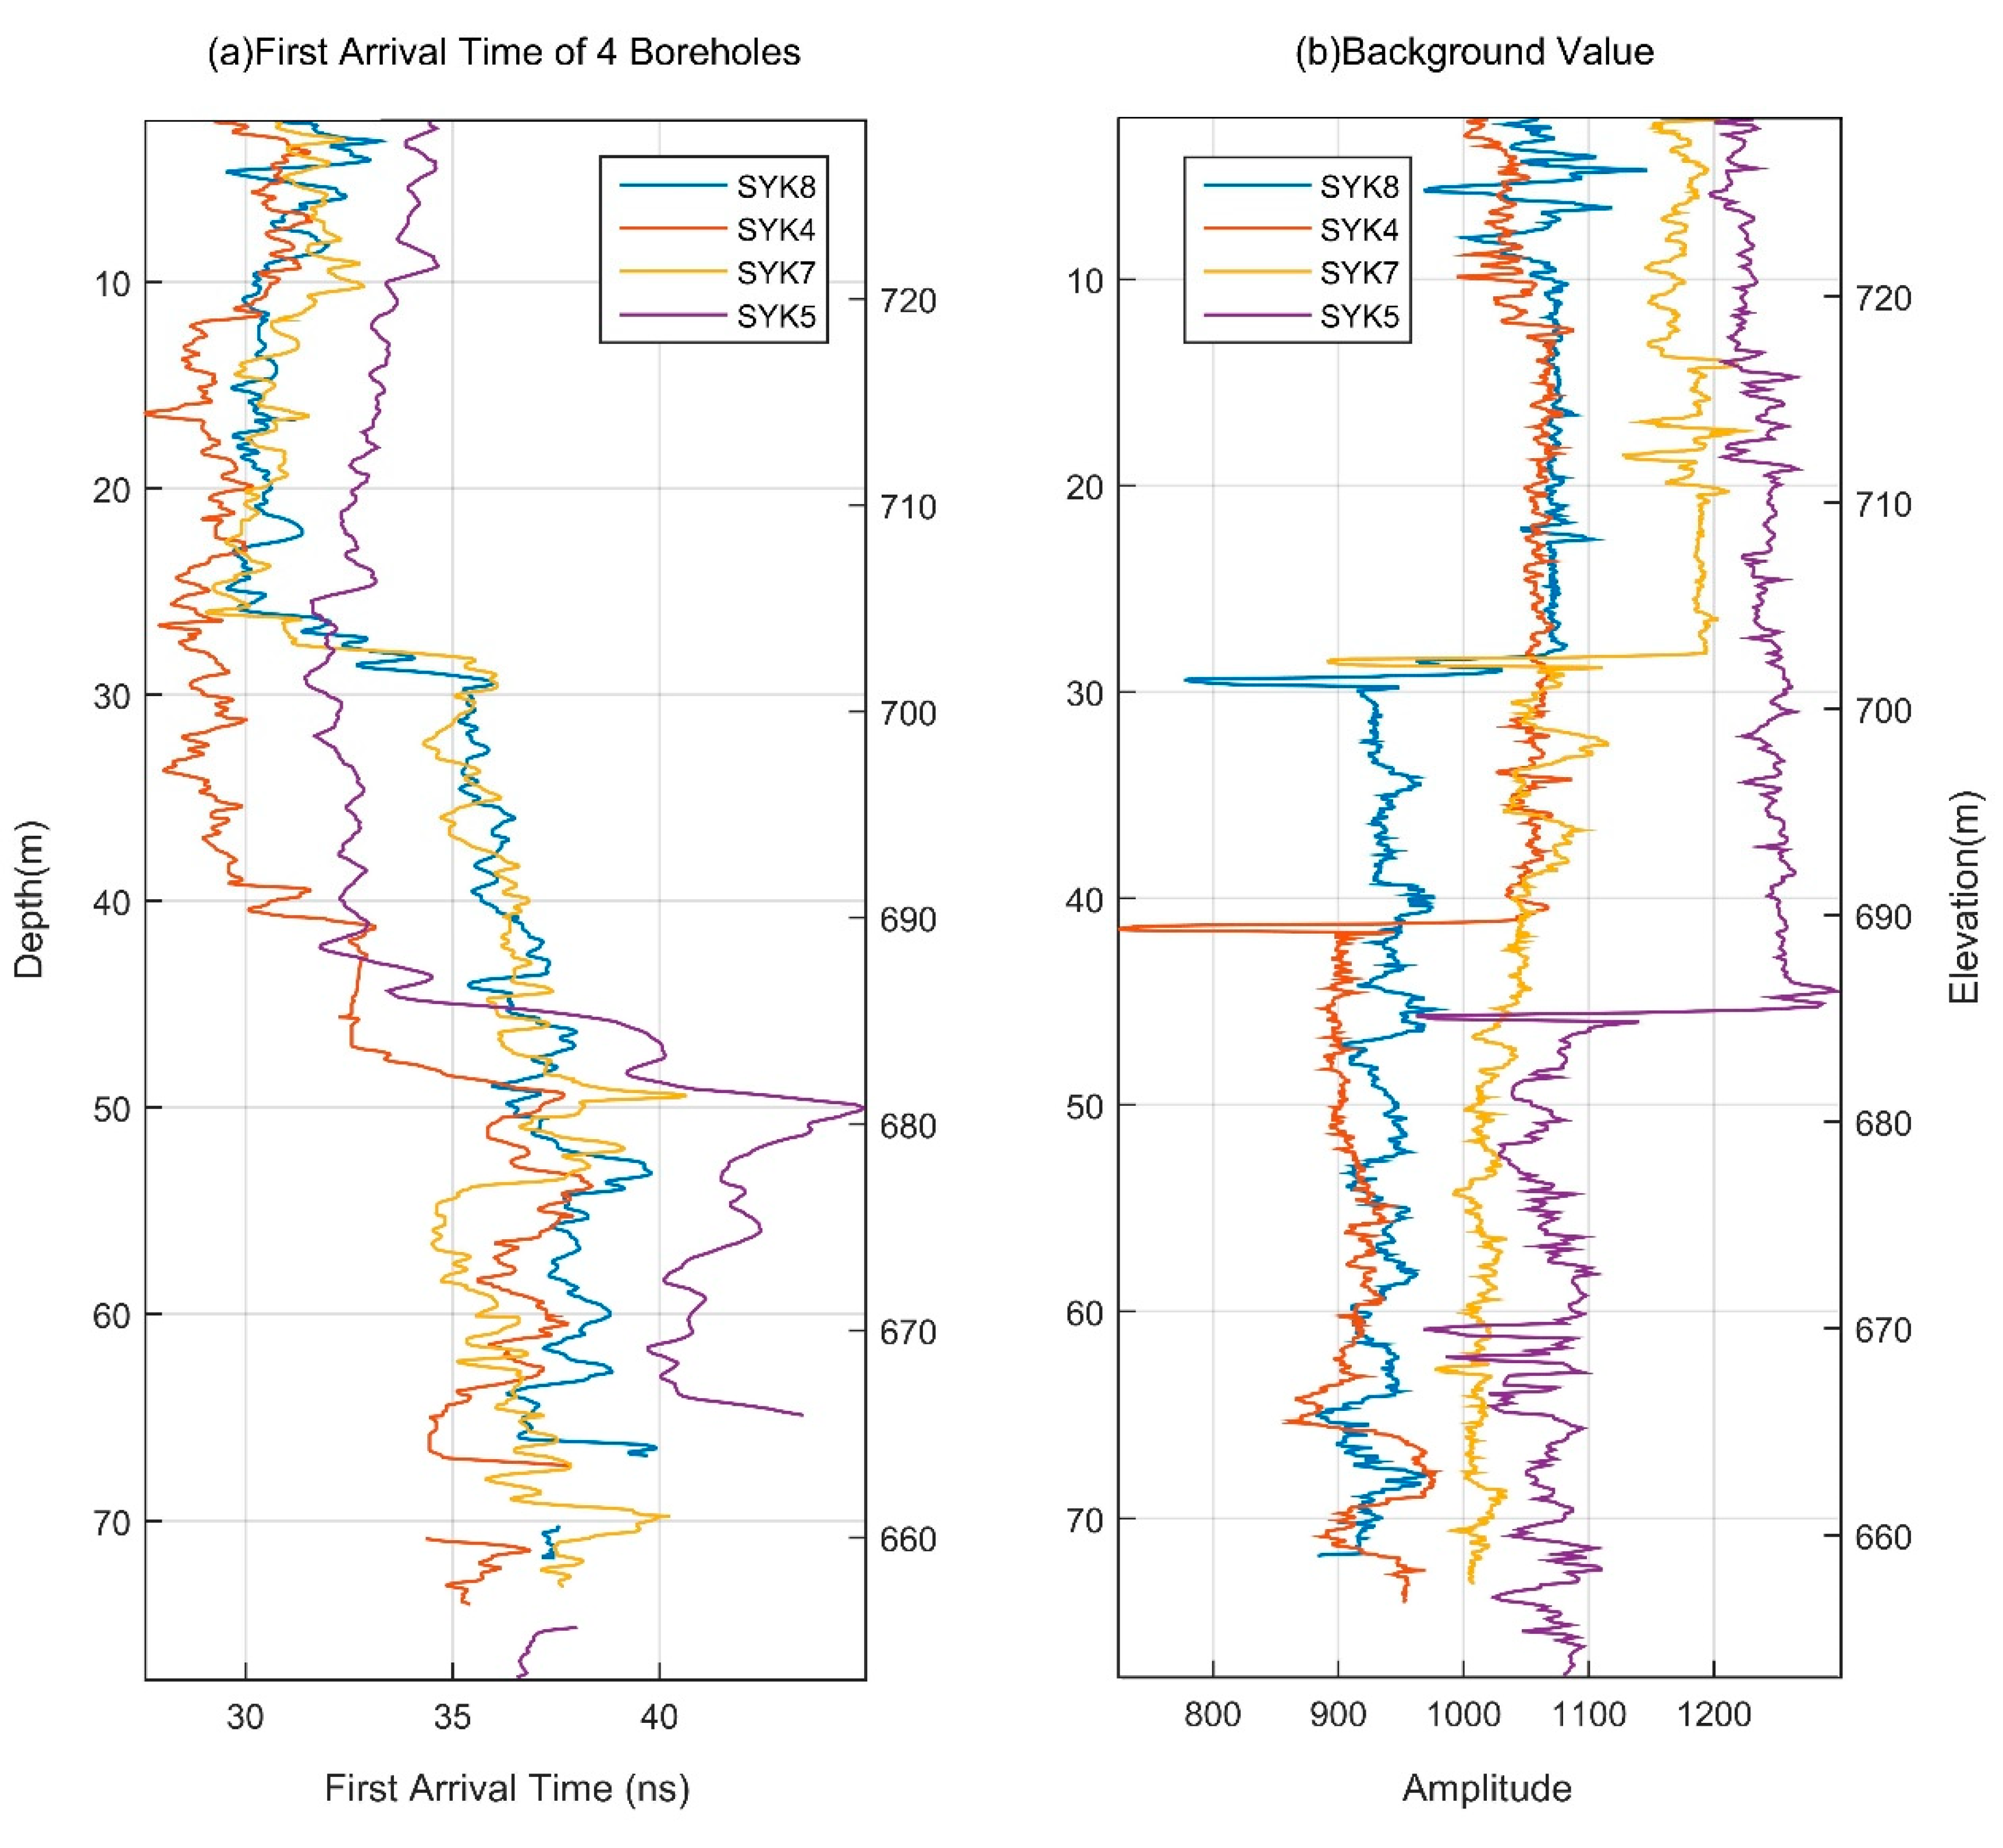
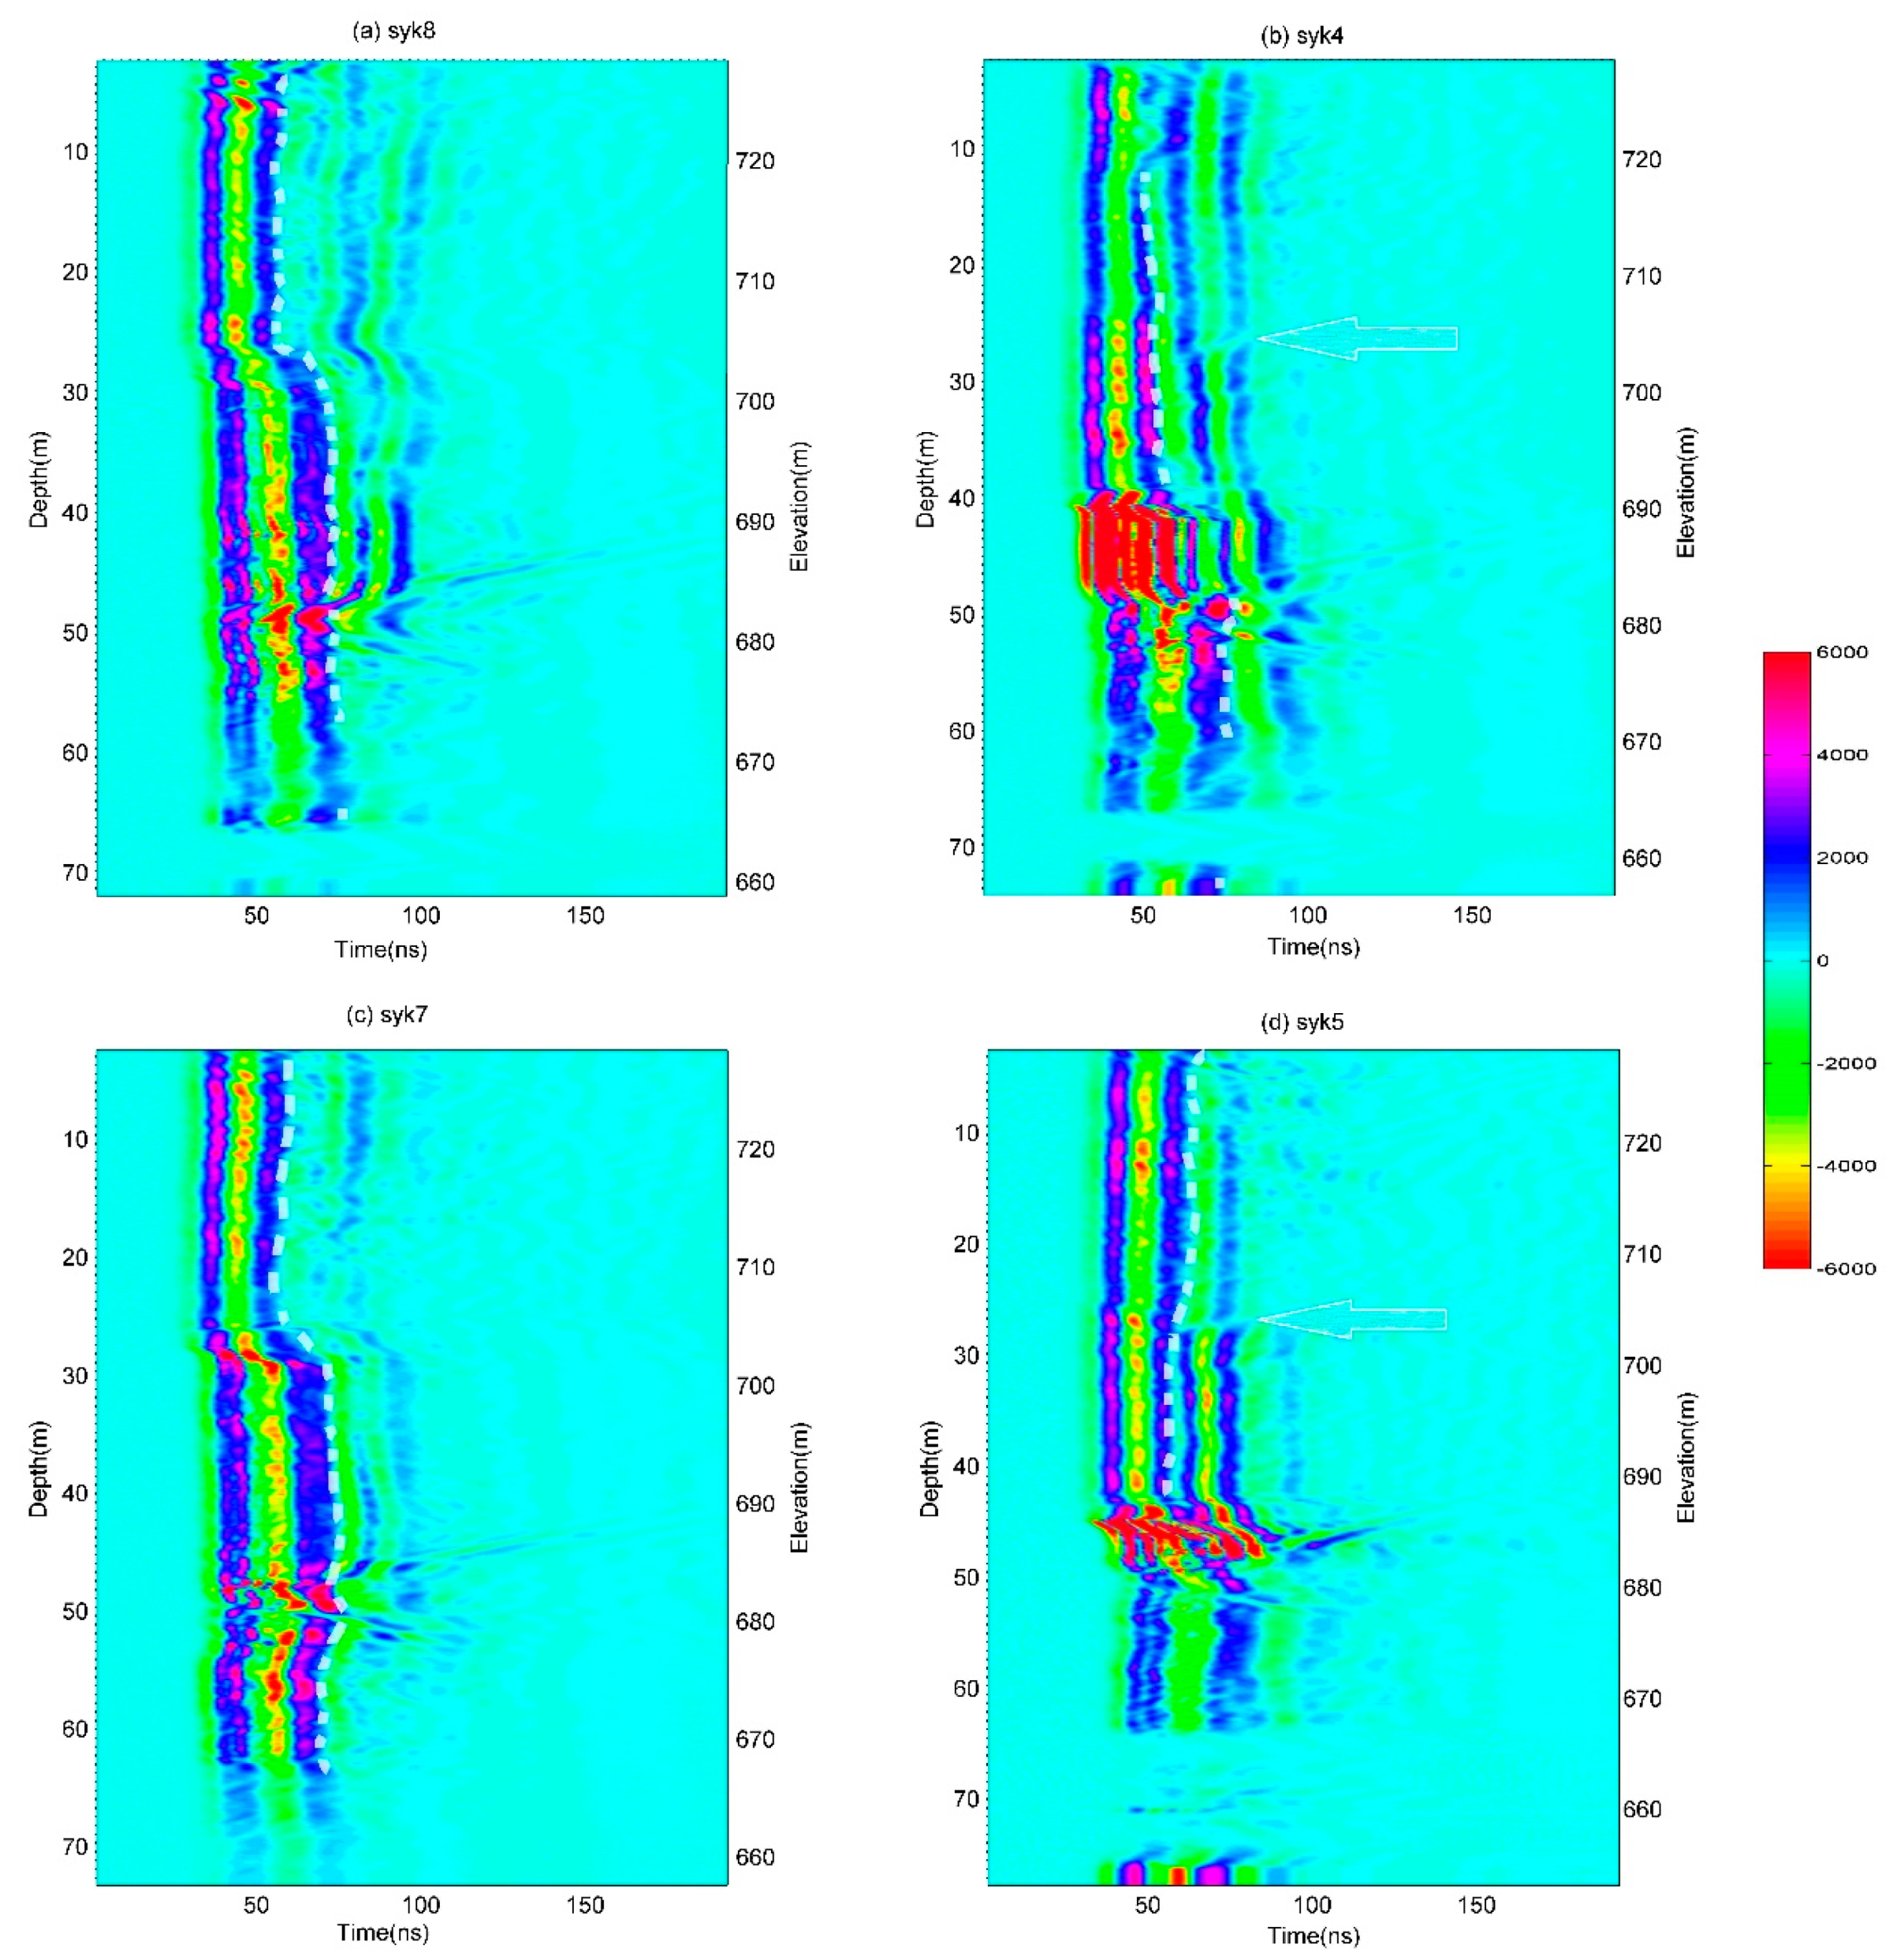
Single-hole reflection measurement was carried out in these four boreholes to detect leakage. The first arrival time of the direct wave and the background value, i.e., the direct current (DC) component, are picked from the raw data trace by trace, as shown in Figure 4. The data processing procedure includes time zero correction, depth corrections, and background removal. The processed radar data were displayed in the Hue Saturation Value (HSV) color modes to highlight the subtle change, as shown in Figure 5. The color scales of the four profiles are the same, from −6000 to 6000, for comparison purposes. Both the depth and the elevation of the borehole are marked in the figure, but the interpretations are based on elevation, because engineering design conventionally uses elevation. The depth of 2.283 m corresponds to an elevation of 728.5 m. We tried to interpret the radar profiles step by step on the basis of a full understanding of the dam design and the related geological information.
4.1. Horizontal Interface Analysis
A clear horizontal interface can be noticed in any of the four profiles shown in Figure 5b, and the interface splits each figure into upper and lower zones represented by different colors. The split means the background value is different in the upper and lower zones. The average DC values in the upper zones for SYK8, SYK4, SYK7, SYK5 are about 1070, 1060, 1160, and 1240, respectively. They become about 940, 910, 1050, and 1050, in the lower zones, respectively. The interface is interpreted as the boundary between the water-saturated zones and the dry zones. Its elevation is about 702.1 m on the upstream side (SYK8 and SYK7), which is the same as the water level at the time in the water reservoir. For the boreholes SYK4 and SYK5 on the downstream side, the elevation becomes 689.6 m and 684.8 m, respectively, which corresponds to the original rough ground elevation. The different water saturation leads to different DC components which are larger in the dry layer than in the water-saturated layer. The occurrence of the DC shift is due to the different surrounding environments affecting the electronic circuit. The complicated internal mechanism is too difficult to interpret, and is beyond the scope of the current study.
Other direct wave phenomena also prove the existence of this interface; the direct wave arrives later and the waveforms become wider as the borehole radar sonde enters the water-saturated formation, where the wave travels more slowly than in the dry one, as shown in Figure 4a. The subsequent wave at different depths exhibits different characteristics and reflects the dam structure and surrounding situations.
4.2. Asphalt Core Wall’s Thickness Changing Point
The asphalt core wall’s thickness changing point can be noticed clearly from SYK5 and SYK4 data at about 704 m, which are characterized by event discontinuity, marked by arrows, but not clearly from SYK8 and SYK7 data located on the upstream side, possibly due to the disturbance from the near interface between the dry and the water-saturated formations.
4.3. Connecting Point between Asphalt and Concrete Core Wall
The connecting point between the asphalt and the concrete core wall is very clear in all four profiles at about 683 m. The signal appears as a hyperbola, which is characteristic of a point-like target. The shape of the connecting platform cannot be discerned, due to its long wavelength. Below that point, the radar wave shows different features, because the formation changes from transitional material to sand gravel.
4.4. Direct Wave Analysis
We find that the direct wave disappears at certain intervals in all four profiles, as shown in Figure 4, i.e., from 660.3 m to 663.8 m for SYK8, from 659.5 m to 663.5 m for SYK4, from 657.6 m to 667.6 m for SYK7, from 655.4 m to 666.5 m for SYK5. These intervals are located in the grouting curtain or the sand gravel, according to the engineering design. According to our knowledge and experience, the direct wave disappears only when the antennas are located in highly conductive material or in a metal casing. Since there is no metal casing in this case, it is deduced that the conductive water flushes the formation, and greatly attenuates the direct wave. Therefore, leakages are possibly occurring near those intervals. The direct loss is an important index for water leakage in this situation.
4.5. Reflection Wave Analysis
Now we move on to reflection wave analysis and interpretation. The reflected waves are overlapped partially by the direct wave, because the reflected wave arrives before the direct wave finishes. We try to draw white dotted lines to separate the parts dominated by direct and the reflected waves.
For boreholes SYK8 and SYK7, located on the upstream side, take the 2.77 m antenna offset into consideration and neglect the ray path bending due to refraction; the two-way traveling distances (TWTD) from interfaces 1–4 are about 5.54 m, 4.46 m, 5.28 m, and 13.10 m, respectively, in the upper part of the dam. The reflections from interfaces 1–3 cannot be distinguished, because their TWTDs are too close. The reflection event is a superposition of different reflections from interfaces 1, 2 and 3. As shown in Figure 4a,c, the reflection from interface 4 cannot be found due to its great distance from the borehole. We find a fluctuant reflection event above the asphalt/concrete connection point, both in the water-saturated and dry zone, from the single-hole reflection profiles for SYK8, which is inconsistent with the vertically straight dam structure. This kind of fluctuation is deduced to be due to the material inhomogeneity. Below the asphalt/concrete connecting point, the reflection events are obscure. As for SYK7, the reflection event in 703.8–717.8 m is disturbed by the point-like reflectors and shows broken features.
For boreholes SYK4 and SYK5, as shown in Figure 4b,d, the reflections show similar characteristic as at SYK7 and SYK8. Both the reflected wave amplitude and the arrival time show changes at different depths. Reflection events are interfered with by point reflectors from place to place. We cannot see the reflection from interface 1.
The reflected wave does not play an important role in leakage detection, at least in this situation.
5. Cross-Hole Radar Measurement
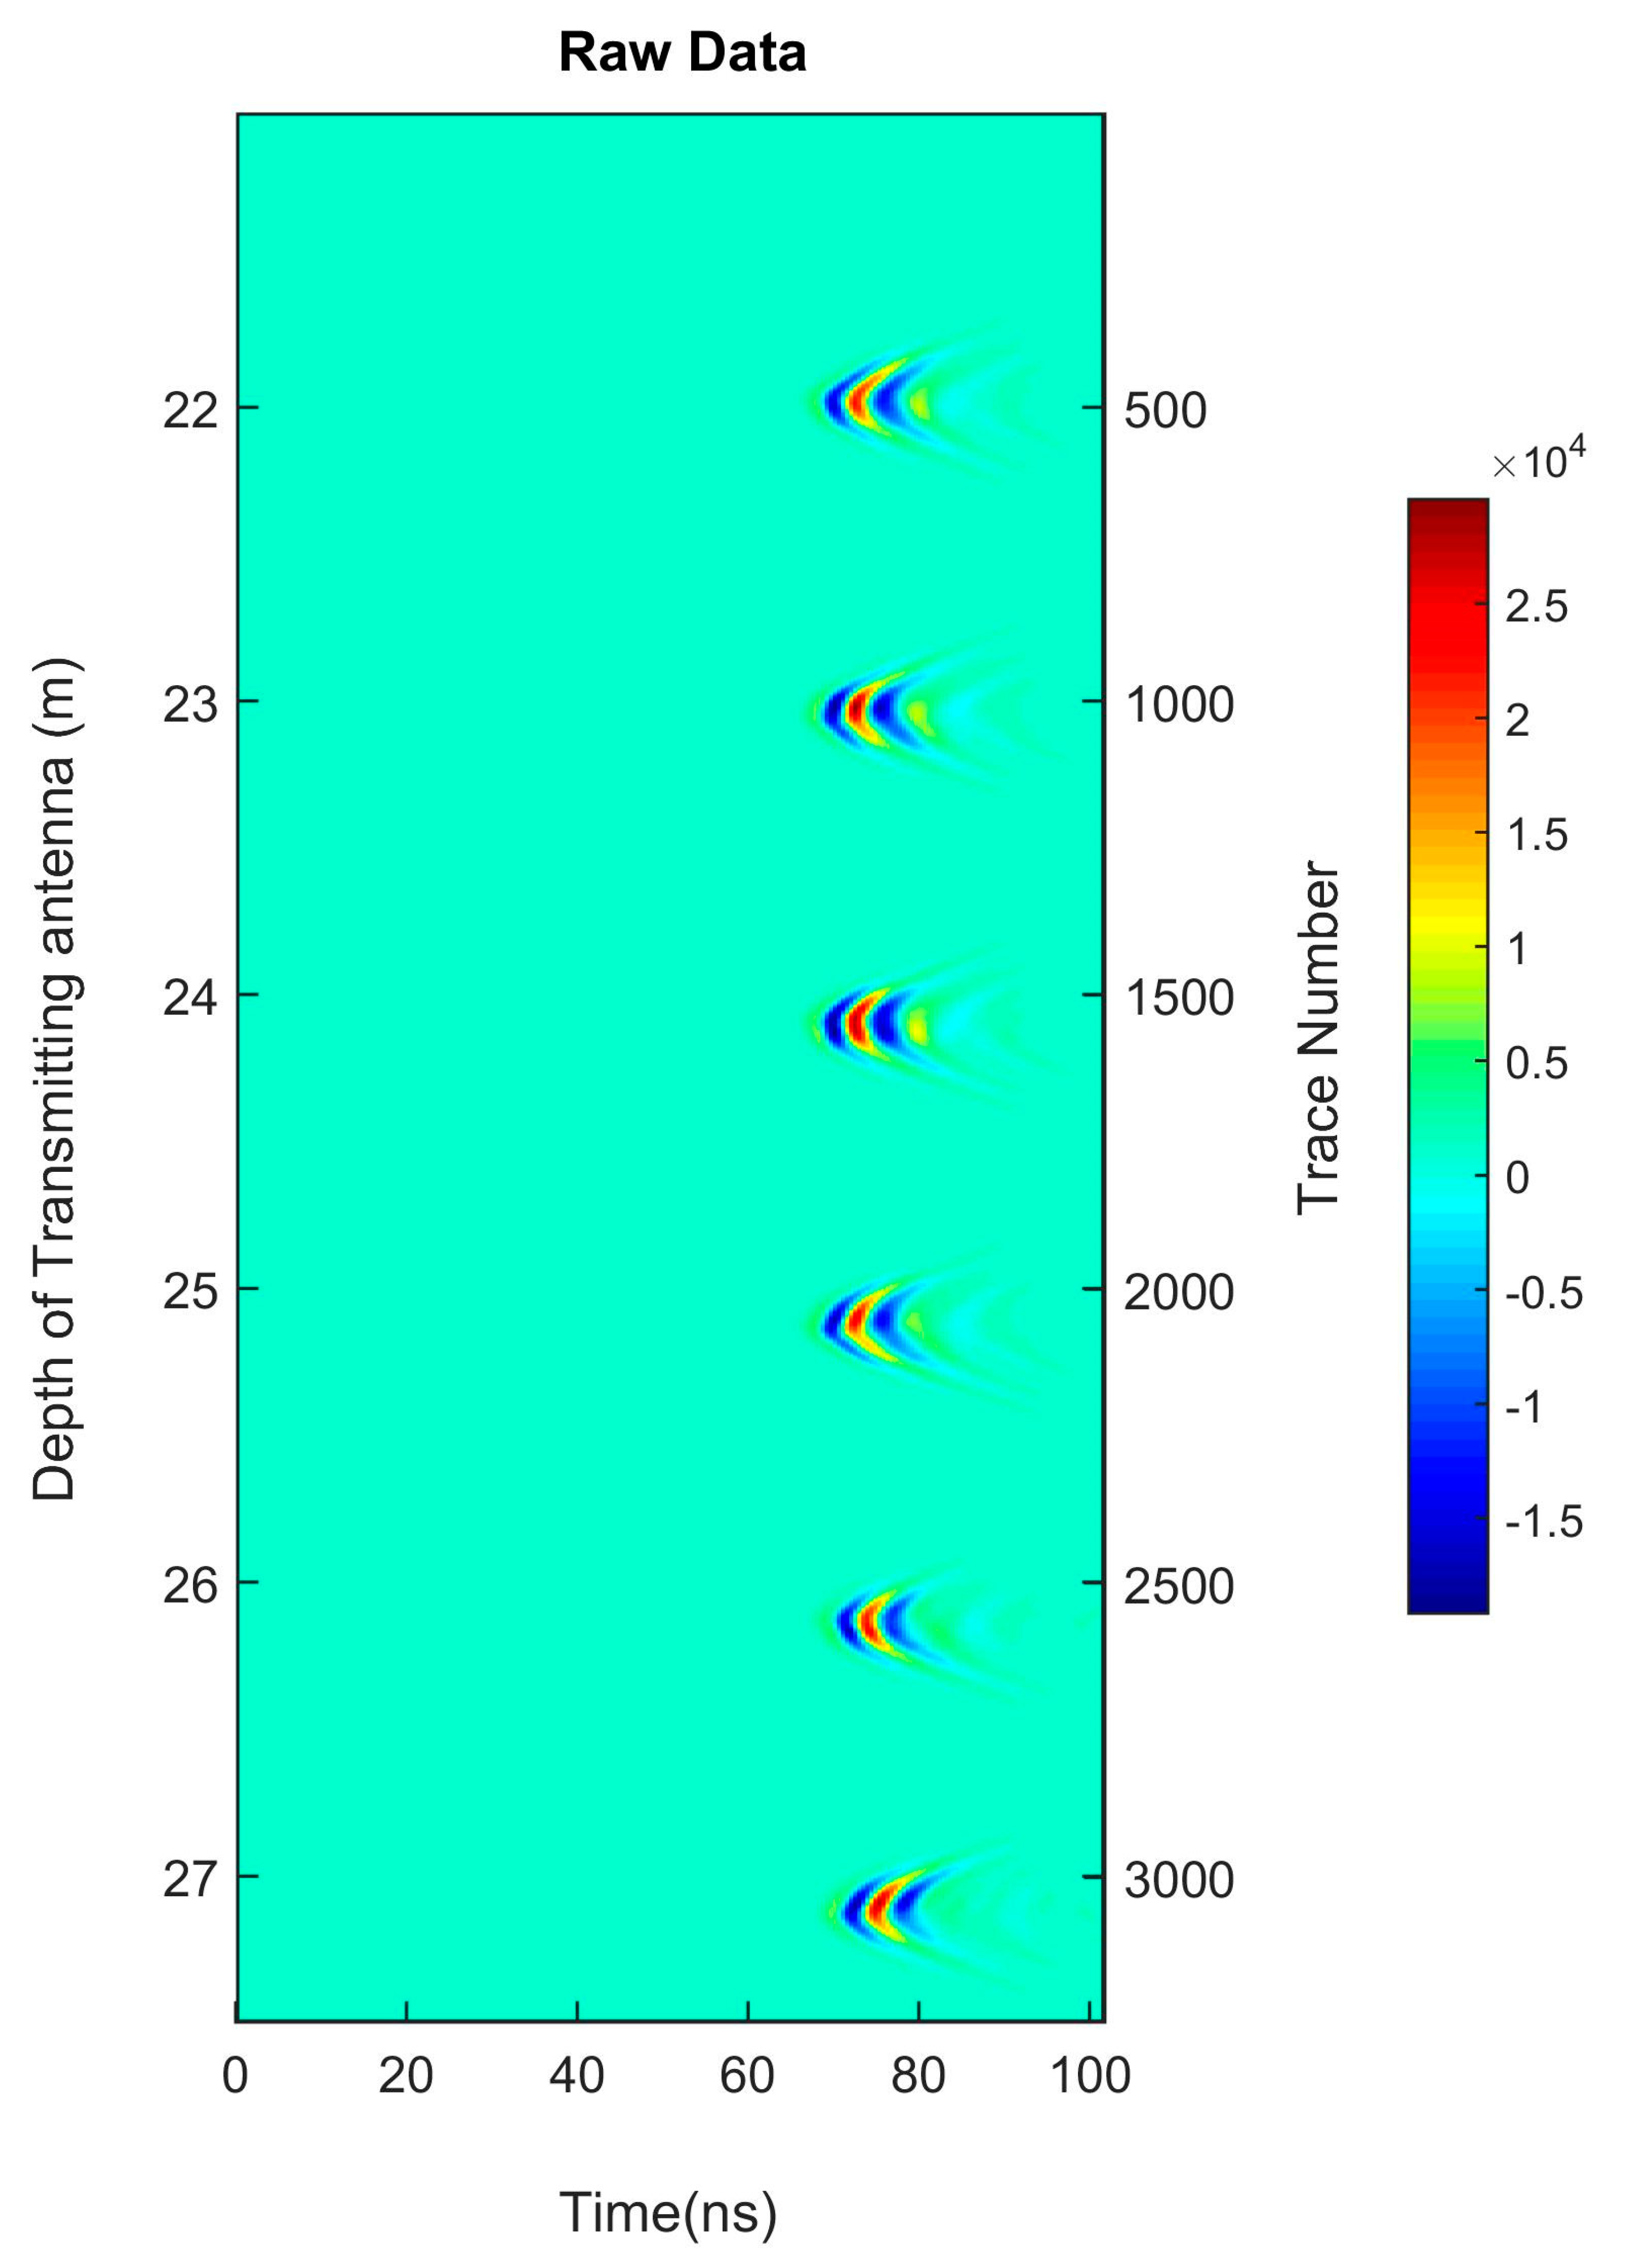
In the cross-hole radar measurement, we fix the transmitting antenna in SYK8, move the receiving antenna in SYK4, and repeat this process by changing the fixed transmitting position. The moving range of the transmitting antenna is from 0 m to 70 m, with a 1 m moving step. The receiving antenna moves in the depth range of 0 m to 74 m, with a step of 0.048 m. The signal acquisition is triggered by the distance measuring wheel. Part of the raw data is shown in Figure 6.
We use travel time tomography for cross-hole radar data processing [25]. A self-developed software package, Pick_FAT Ver2.0, is used to extract first arrival travel time. Three methods, i.e., manual extraction, maximum signal-to-noise ratio (MSNR) method [26], and digital image segmentation (DIS) [27], are available in this software. Generally, we first pick up the first arrival travel time automatically by MSNR or DIS and then correct some sudden change points manually. The extracted travel time data is resampled to adapt the tomography grid size, which is optional. Time zero correction is necessary before first arrival time picking to ensure the accuracy of the picking. The software can select the travel time data for inversion by ray angle relative to the horizontal direction, because the data of large angle data often has low signal to noise ratio and affects the inversion effect. We do not include the data whose ray angles are larger than 40 degrees during the inversion.
We use another self-developed software package BRH_TOMO Ver 3.0 for cross-hole radar velocity tomography. This software cannot only perform straight ray tracing but also bent ray tracing to calculate the ray path. Bent ray tracing is based on the wavefront method.
We use the bent ray method to process the cross-hole radar data. The purpose of our inversion is to find the suitable model by solving the following optimization problems for a given λ,
where and are the target functions in the data space and the model space, s is the slowness, λ is the weighted factor used to measure the ratio between and . and are expressed as follows,
where L is the coefficient vector. To calculate the minimum of (1), we take the partial derivative of and let it be zero; we can derive the matrix system form as shown below,
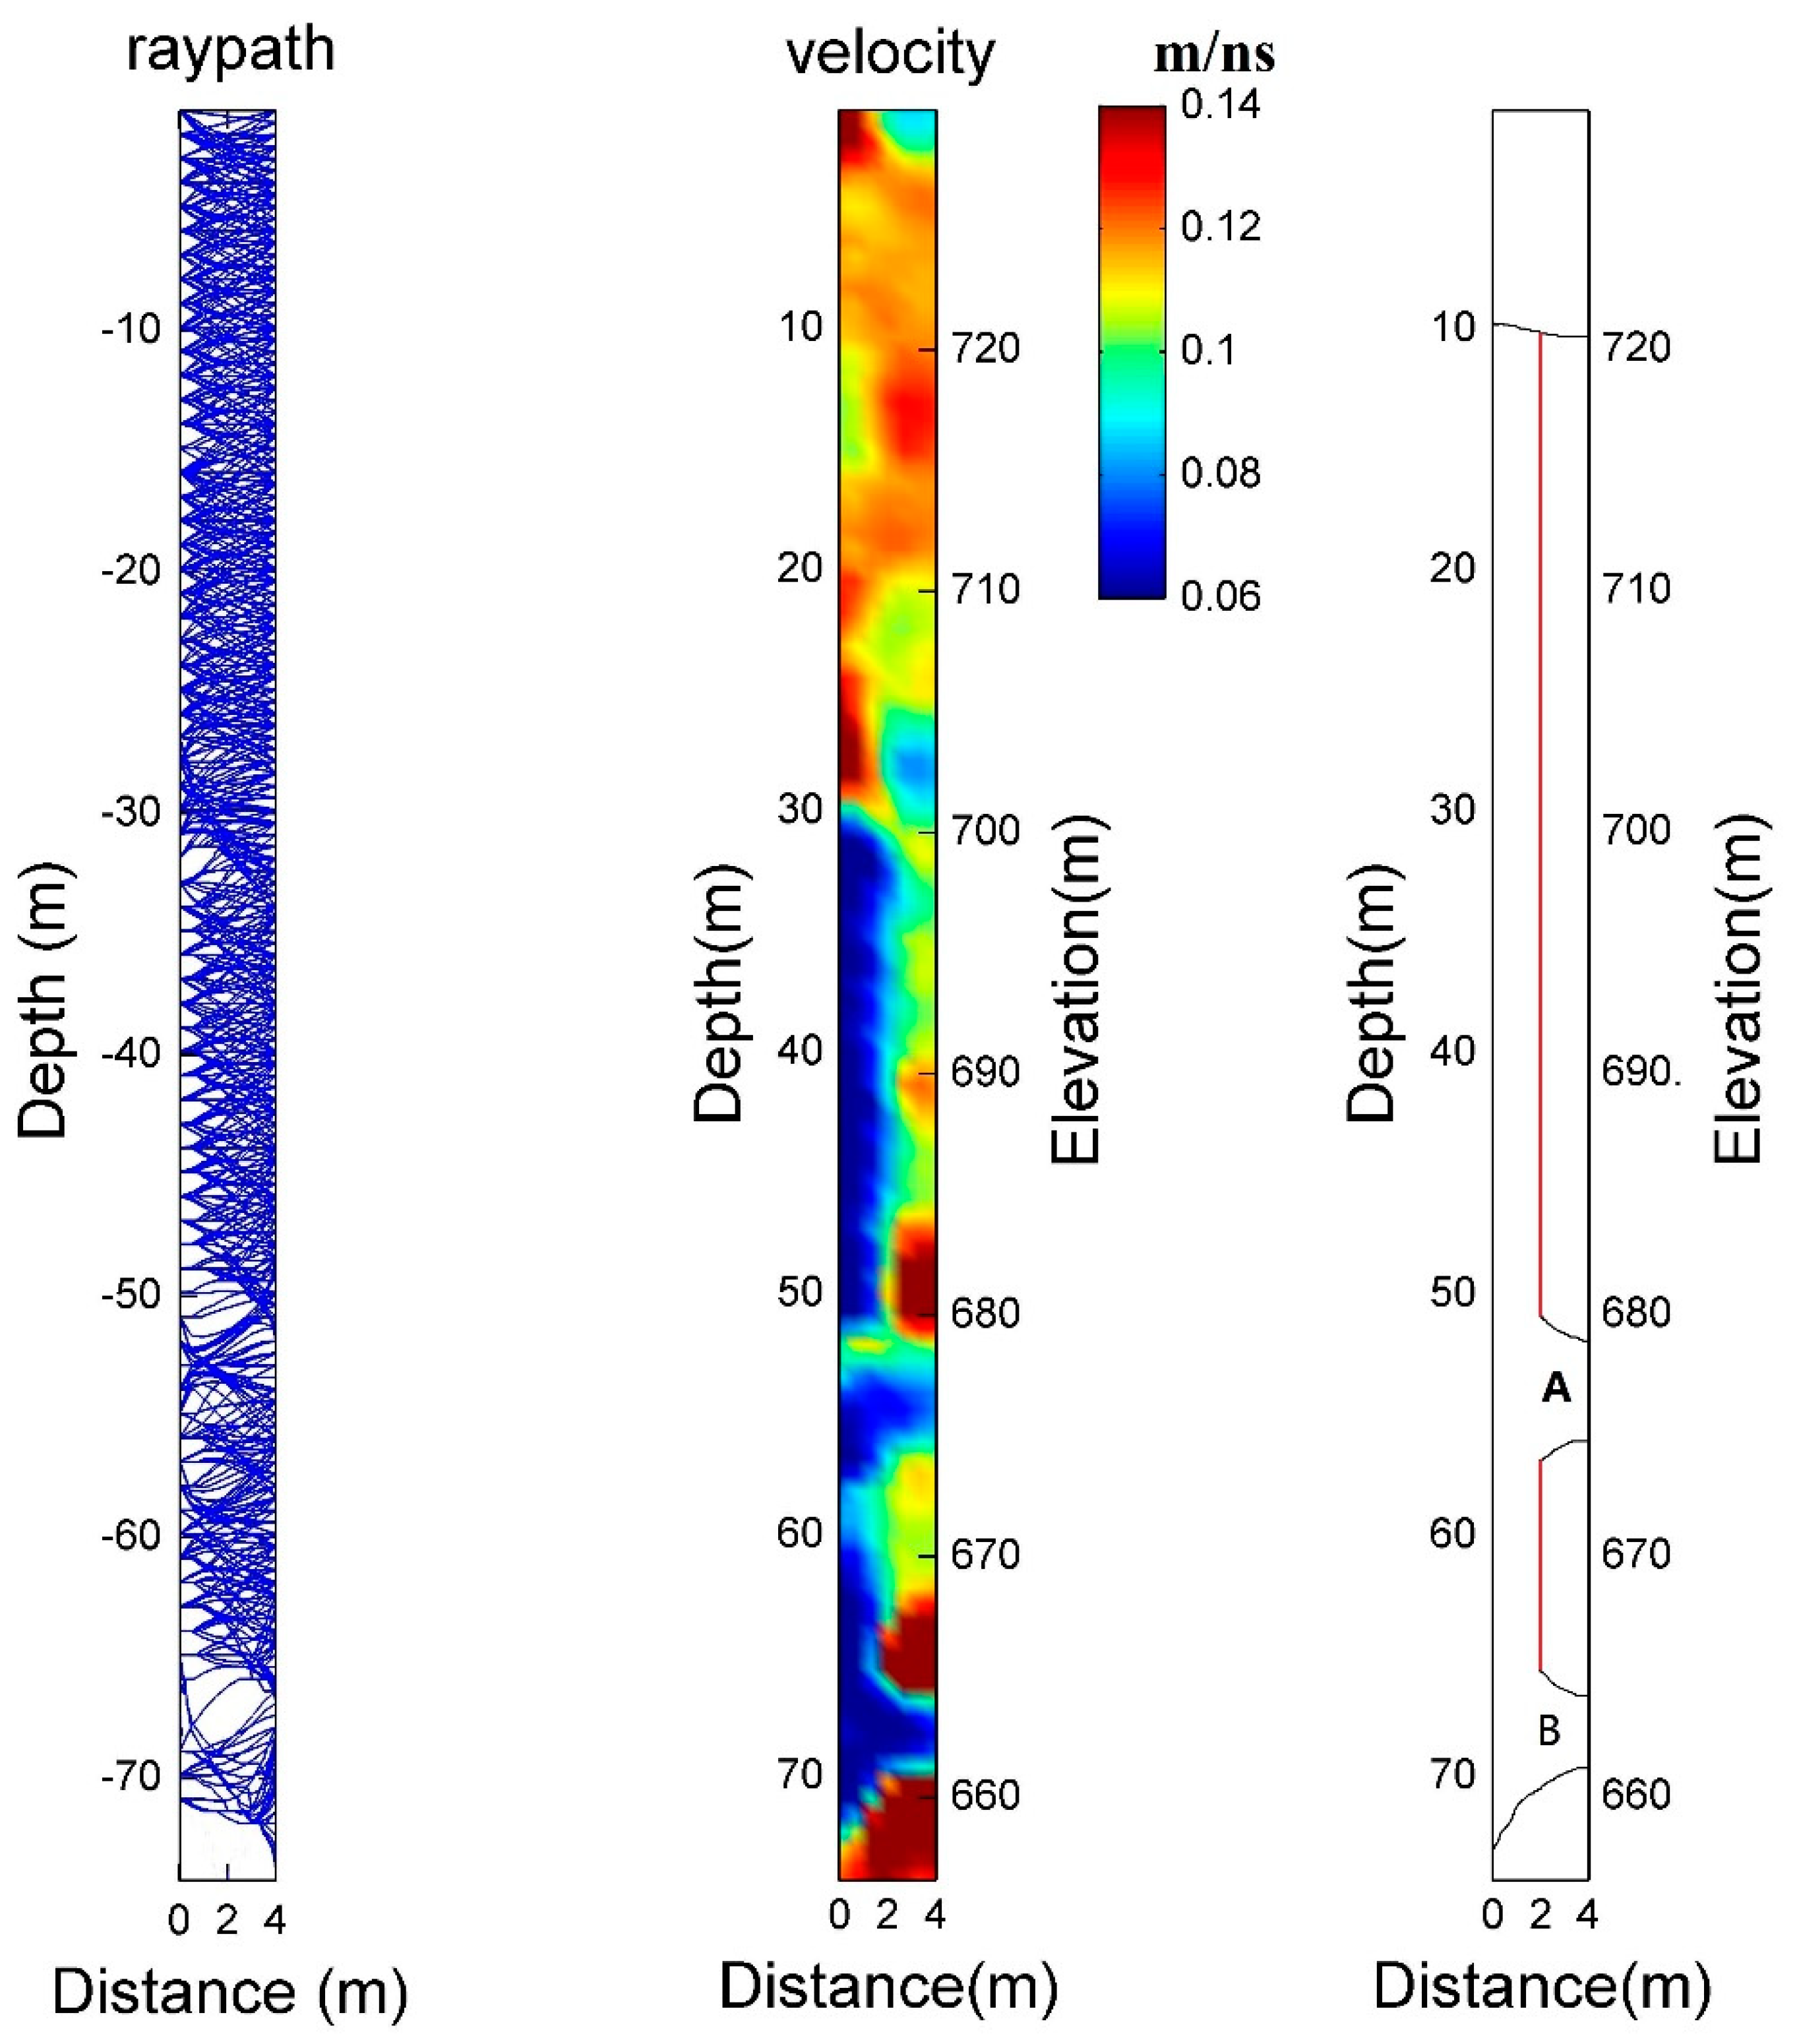
In (4), set the weighted factor λ to be 5, the identity matrix operator is selected as the data weighted matrix , the Laplace operator is selected as the model weighted matrix . We use the bi-conjugate gradient stabilized method (BICGSTAB) to solve the above matrix system, and use Multi-stencils Fast Marching Method (MSFM) for ray tracing. Giving an initial value, we can use the iteration method to obtain the solution to (4). The ray path, the inverted velocity tomography, and the interpreted results, are shown in Figure 7a–c, respectively, velocity is in m/ns.
We interpret the tomography as follows:
- (1)
- From the top to about 720 m, the inverted velocity is basically the same, with only one exception of a low-velocity zone at the top-right corner. From 720 m to the bottom of the dam, the upstream side differs from the downstream side clearly, with only a few exceptional intervals. The left-right difference shows the existence of the core wall, whose geometry cannot be imaged clearly due to the resolution limitation.
- (2)
- On the upstream side (left side in the figure), there is a clear horizontal interface at 700 m, which is in agreement with the elevation of the water level at the time of measurement. Above this interface, the dam body is basically dry, and is characterized by high velocity. Below this interface, it shows low-velocity features.
- (3)
- On the downstream side (right side in the figure), the velocity distribution is heterogeneous. However, two clear horizontal banded zones exhibit low-velocity features; one is from about 675 m to 678 m, which is marked by “A”, and is characterized by transitional low-velocity feature, and the other one is from 662 to 665 m, which is marked by “B”, and is characterized by low velocity and crosses the dam completely. These two zones are the possibly permeable leakage path of the dam. The bottom one has a high probability of water leakage due to its velocity distribution characteristic passing through the section completely.
6. Discussion
We combine the single-hole reflection, the cross-hole tomography, the water flow measurement, and the engineering design for final comprehensive interpretation. For the single-hole reflection measurement, both the reflected and the direct wave signals can sense the subsurface formation in different ways. Reflected wave mainly detects the reflecting interface, separately from the borehole. The principle of the single-hole reflection is similar to that of the surface GPR, which has a near-distance blind zone due to the overlapping of the direct wave and the early reflected wave. The direct wave in the single-hole reflection measurement primarily reflects the physical parameters of the medium between the transmitter and the receiver, including the conductivity and the dielectric constant, which are mainly determined by water content and conducting mineral content. The radial detecting range of the direct wave depends on the antennas’ offset and frequency, and is on an order of magnitude of about one wavelength. The direct wave method can detect water leakage spatially only if the boreholes penetrate through the leakage zone. The cross-hole radar tomography mainly measures the physical distribution between two holes. While the water flow meter measures the water movement within the borehole; it does not reflect the surrounding water leakage distribution, because the leakage path could be curved. Here, the optical flow meter is utilized.
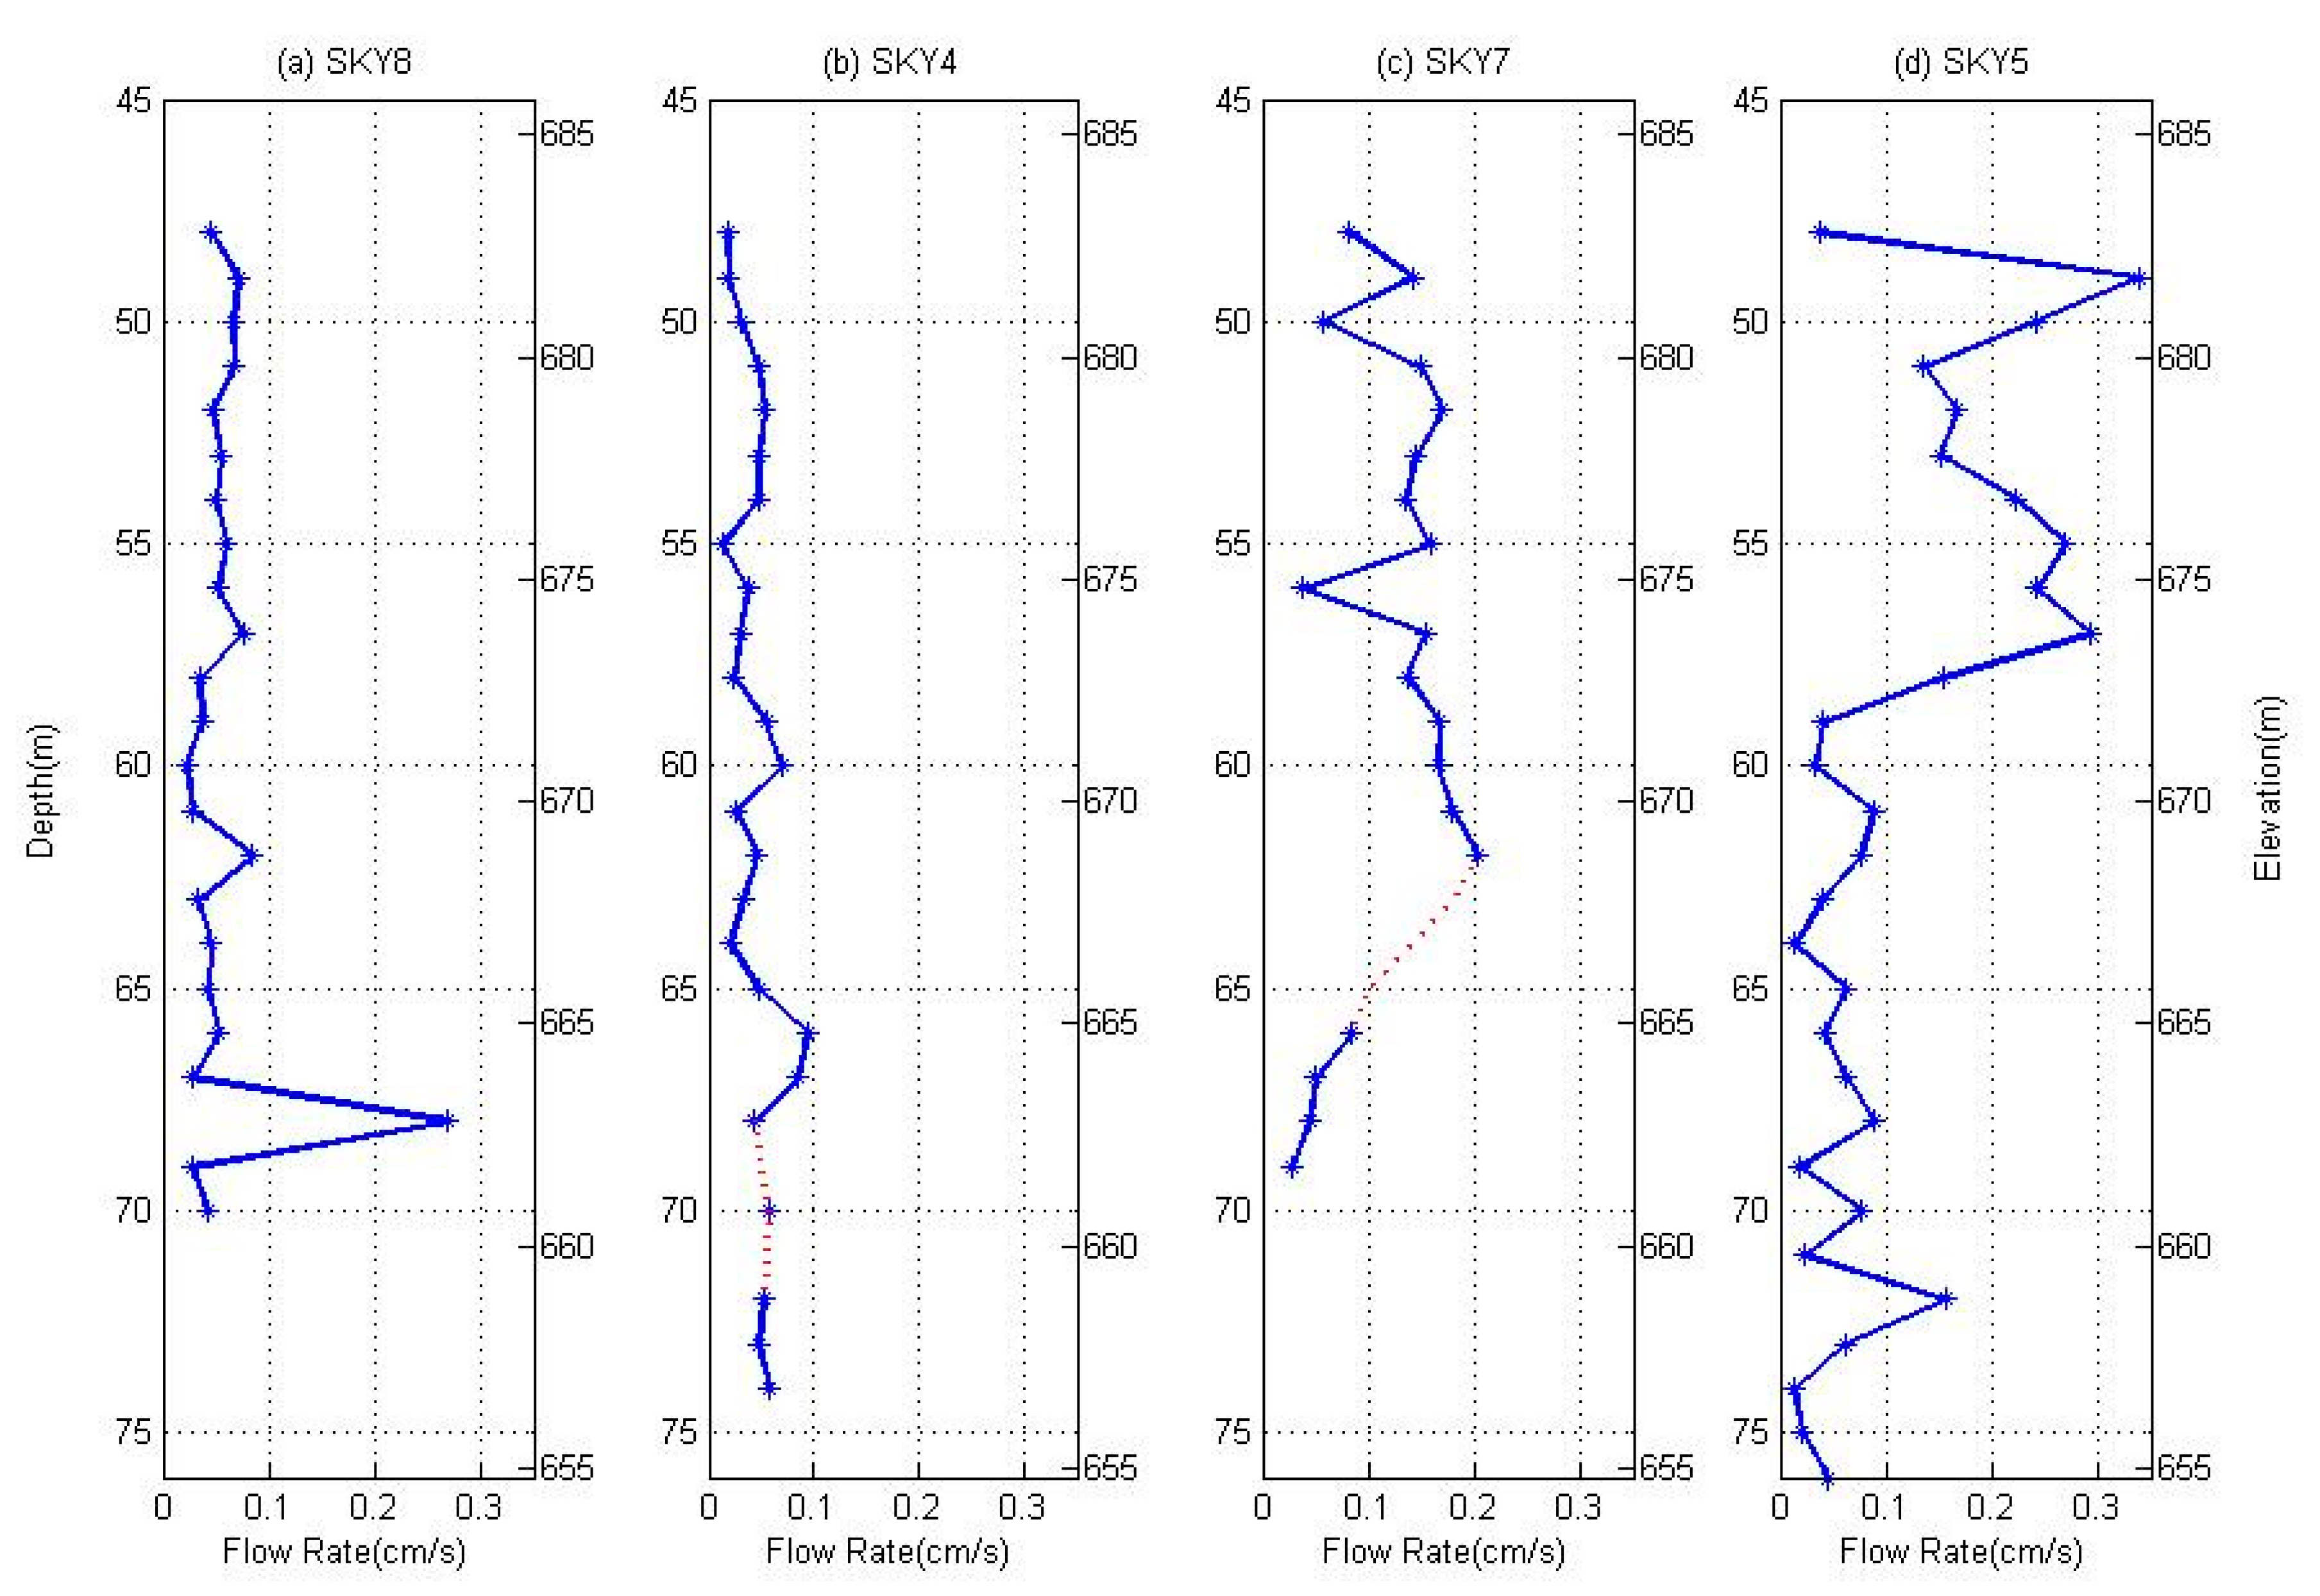
According to the design scheme, there are vertical structures physically between SYK8 and SYK4, but we find two clear horizontally banded low-velocity zones, “A” and “B”, from the cross-hole radar velocity tomography. Both of them are located in the water-saturated zone. It can be inferred that the horizontal water flow physically changes the vertical structure. The single-hole reflection measurement shows a direct wave loss at the “B” zone. We interpret the “B” zone as the water leakage path with possible large internal erosion, while the “A” zone is the potential leakage zone with possible internal erosion. There is a peak value at 662.8 m for SYK8, and a peak value at 664.8 m for SYK4 in the water flow measurement, as shown in Figure 8. The readings at 661.8 m and 659.8 m for SYK4 cannot be obtained because of turbulent flow, but the water flow actually exists. The water flow curves prove our interpretation of the borehole radar data.
As for SYK7 and SYK5, cross-hole radar measurement was not carried out because these two boreholes are too far away from each other. By interpreting the single-hole reflection data, we also conclude that there are possible leakage paths near the direct wave loss intervals, i.e., from 657.6 m to 667.6 m for SYK7 and from 655.4 m to 666.5 m for SYK5. Similarly, this interpretation can be proven by water flow measurement. There is a water flow peak at 668.8 m for SYK7 and at 658.8 m for SYK5. The readings at 667.8 m, 666.8 m, 665.8 m for SYK7 cannot be obtained due to the turbulent flow.
However, there are other intervals showing large water flow from the water flow measurement, such as 676 m–681 m for SYK7, and 673 m–682 m for SYK5. However, we do not find a direct wave loss in these intervals. We infer that there are probably no conducting minerals in the possible leakage paths. Therefore, the direct wave loss in the single-hole reflection measurement may reflect some of the water leakage, but not all of it.
It should be noted that the single-hole measurement based on direct wave loss can only reflect issues near the borehole; total dam inspection requires more boreholes. Cross-hole radar measurement is a more effective method and may provide the physical properties spatially.
We first introduced a combination method using borehole radar and water flow measurement for dam leakage inspection. Borehole radar provides high-resolution and deep measurements, which are very necessary for small-scale and deeply buried targets like water leakage paths, and water flow provides additional constraints. This work provided a diagnosis, and is very crucial for dam management and risk mitigation strategies at the site.
7. Conclusions
Dam safety is a matter of life globally, and inspection of high dams at high resolution is a challenging issue. The borehole tool naturally possesses these advantages, because it is able to approach close to the targets. This work is a pioneering one for high dam leakage inspection using borehole radar results, although the results may be case-dependent, and they require further investigation to clarify some aspects of generality. The interface between the water-saturated and dry zone can be found from the change in background values, the core wall thickness change point, and the asphalt/concrete core wall connection point can be determined from reflection data. Direct wave loss in the single-hole reflection profile and horizontal low-velocity banded zone in velocity tomography from cross-hole radar measurement show the possible leakage path, which is proven by water flow measurements. Borehole radar is truly a high-resolution tool that is suitable of great depths, making it feasible for high dam inspection.
Author Contributions
Software, X.W.; formal analysis, Q.L., H.L. and Y.W.; writing—review and editing, L.D.; supervision, S.L.
Funding
This research was funded in part by the National Key Research and Development Program of China (2016YFC0600505) and the Natural Science Foundation of China (Grant 4187413 & 41574109).
Conflicts of Interest
The authors declare no conflict of interest.
References
- Fan, Z.C.; Wang, J.J.; Mao, H.T. Studying leakage from left abutment of Xiaolangdi hydropower station using tracing method. J. Chem. Pharm. Res. 2014, 6, 2062–2068. [Google Scholar]
- Sjödahl, P.; Dahlin, T.; Johansson, S.; Loke, M.H. Resistivity monitoring for leakage and internal erosion detection at Hällby embankment dam. J. Appl. Geophys. 2008, 65, 155–164. [Google Scholar] [CrossRef] [Green Version]
- Gunn, D.A.; Chambers, J.E.; Uhlemann, S.; Wilkinson, P.B.; Meldrum, P.I.; Dijkstra, T.A.; Haslam, E.; Kirkham, M.; Wragg, J.; Holyoake, S.; et al. Moisture monitoring in clay embankments using electrical resistivity tomography. Constr. Build. Mater. 2015, 92, 82–94. [Google Scholar] [CrossRef] [Green Version]
- Lin, C.P.; Hung, Y.C.; Yu, Z.H.; Wu, P.L. Investigation of abnormal seepages in an earth dam (ERT). J. GeoEngineering 2013, 8, 61–70. [Google Scholar]
- Bièvre, G.; Oxarango, L.; Günther, T.; Goutaland, D. Improvement of 2D ERT measurements conducted along a small earth-filled dyke using 3D topographic data and 3D computation of geometric factors. J. Appl. Geophys. 2018, 153, 100–112. [Google Scholar] [CrossRef]
- Lee, B.; Oh, S. Modified electrical survey for effective leakage detection at concrete hydraulic facilities. J. Appl. Geophys. 2018, 149, 114–130. [Google Scholar] [CrossRef]
- Bolève, A.; Janod, F.; Revil, A.; Lafon, A.; Fry, J.J. Localization and quantification of leakages in dams using time-lapse self-potential measurements associated with salt tracer injection. J. Hydrol. 2011, 403, 242–252. [Google Scholar] [CrossRef]
- Li, H.; Ma, H.T. Application of ground penetrating radar in dam body detection. Procedia Eng. 2011, 26, 1820–1826. [Google Scholar]
- Xu, X.X.; Zeng, Q.S.; Li, D.; Wu, J.; Wu, X.G.; Shen, J.Y. GPR detection of several common subsurface voids inside dikes and dams. Eng. Geol. 2010, 111, 31–42. [Google Scholar] [CrossRef]
- Loperte, A.; Bavusi, M.; Cerverizzo, G.; Lapenna, V.; Soldovieri, F. Ground penetrating radar in dam monitoring: The test case of Acerenza (Southern Italy). Int. J. Geophys. 2011, 2011, 1–9. [Google Scholar] [CrossRef]
- Angelis, D.; Tsourlos, P.; Tsokas, G.; Vargemezis, G. Combined application of GPR and ERT for the assessment of a wall structure at the Heptapyrgion fortress (Thessaloniki, Greece). J. Appl. Geophys. 2018, 152, 208–220. [Google Scholar] [CrossRef]
- Al-Fares, W. Contribution of the geophysical methods in characterizing the water leakage in Afamia B dam, Syria. J. Appl. Geophys. 2011, 75, 464–471. [Google Scholar] [CrossRef]
- Zhao, M.J.; Wang, H.; Sun, X.; Zhang, Y. Comparison between the isotope tracking method and resistivity tomography of earth rock-fill dam seepage detection. Engineering 2011, 3, 389–399. [Google Scholar] [CrossRef]
- Dai, Q.W.; Lin, F.P.; Wang, X.P.; Feng, D.S.; Bayless, R.C. Detection of concrete dam leakage using an integrated geophysical technique based on flow-field fitting method. J. Appl. Geophys. 2017, 140, 168–176. [Google Scholar] [CrossRef]
- Shmela, S.; Shakshem, E.N. Seepage phenomenon for Wadi Megenin dam. Int. J. Environ. Monit. Anal. 2013, 1, 248–257. [Google Scholar] [CrossRef]
- Antoine, R.; Fauchard, C.; Fargier, Y.; Durand, E. Detection of leakage areas in an earth embankment from GPR measurements and permeability logging. Int. J. Geophys. 2015, 2015, 1–9. [Google Scholar] [CrossRef]
- Lin, C.H.; Lin, C.P.; Hung, Y.C.; Chung, C.C. Application of geophysical methods in a dam project: Life cycle perspective and Taiwan experience. J. Appl. Geophys. 2018, 158, 82–92. [Google Scholar] [CrossRef]
- Bièvre, G.; Lacroix, P.; Oxarango, L.; Goutaland, D. Integration of geotechnical and geophysical techniques for the characterization of a small earth-filled canal dyke and the localization of water leakage. J. Appl. Geophys. 2017, 139, 1–15. [Google Scholar] [CrossRef]
- Sentenac, P.; Benes, V.; Budinsky, V.; Keenan, H. Post flooding damage assessment of earth dams and historical reservoirs using non-invasive geophysical techniques. J. Appl. Geophys. 2017, 146, 138–148. [Google Scholar] [CrossRef]
- Wang, H.; Lin, C.P. Cause and countermeasures for the symmetric effect in borehole-to-surface electrical resistivity tomography. J. Appl. Geophys. 2018, 159, 248–259. [Google Scholar] [CrossRef]
- Butchibabu, B.; Sandeep, N.; Sivaram, Y.V.; Jha, P.C. Bridge pier foundation evaluation using cross-hole seismic tomographic imaging. J. Appl. Geophys. 2017, 144, 104–114. [Google Scholar] [CrossRef]
- Kimura, M.; Kanezaki, Y.; Saito, H.D. Development of a borehole radar system and its field experiments for the base of crosshole tomography. SEG Tech. Program Expand. Abstr. 1994, 13, 414–417. [Google Scholar]
- Liu, S.X.; Wang, X.D.; Fu, L.; Wei, B. Application of borehole radar for dam leakage detection. In Proceedings of the 17th International Conference on Ground Penetrating Radar (GPR), Rapperswil, Switzerland, 18–21 June 2018. [Google Scholar]
- Daniels, D.J. Ground Penetrating Radar, 2nd ed.; The Institution of Electrical Engineers: London, UK, 2004; pp. 475–499. [Google Scholar]
- Wang, F.; Liu, S.X.; Qu, X.X. Crosshole Radar Traveltime Tomographic Inversion using the Fast Marching Method and the Iteratively Linearized Scheme. J. Environ. Eng. Geophys. 2014, 19, 229–237. [Google Scholar] [CrossRef]
- Coppens, F. First arrival picking on common-offset trace collection trace collections for automatic estimation of static corrections. Geophys. Prospect. 1985, 33, 1212–1231. [Google Scholar] [CrossRef]
- Mousa, W.A.; Al-Shuhail, A.A.; Al-Lehyani, A. A new technique for first-arrival picking of refracted seismic data based on digital image segmentation. Geophysics 2011, 76, v79–v89. [Google Scholar] [CrossRef]
Figure 1.
(a) Location of the investigated water reservoir and its satellite photo. (b) Plain view marking the position of the boreholes along the dam as marked by a red box in (a).
Figure 1.
(a) Location of the investigated water reservoir and its satellite photo. (b) Plain view marking the position of the boreholes along the dam as marked by a red box in (a).

Figure 2.
(a) Cross section of the rock-filled dam under investigation. (b) The enlarged part of the core wall.
Figure 2.
(a) Cross section of the rock-filled dam under investigation. (b) The enlarged part of the core wall.

Figure 3.
A photo showing the field operation.

Figure 4.
Calculated first arrival time (a) and the background values (b).

Figure 5.
Single-hole reflection radar images for SYK8 (a), SYK4 (b), SYK7 (c), and SYK5 (d).

Figure 6.
Raw data of the cross-hole radar measurement (in part).

Figure 7.
Cross-hole radar measurement results. (a) Ray path diagram. (b) The velocity tomography. (c) The interpreted result.
Figure 7.
Cross-hole radar measurement results. (a) Ray path diagram. (b) The velocity tomography. (c) The interpreted result.

Figure 8.
Water flow chart for SYK8 (a), SYK4 (b), SYK7 (c) and SYK5 (d).

© 2019 by the authors. Licensee MDPI, Basel, Switzerland. This article is an open access article distributed under the terms and conditions of the Creative Commons Attribution (CC BY) license (http://creativecommons.org/licenses/by/4.0/).
Share and Cite
MDPI and ACS Style
Liu, S.; Wang, X.; Lu, Q.; Li, H.; Wang, Y.; Deng, L. Dam Leakage Detection by Borehole Radar: A Case-History Study. Remote Sens. 2019, 11, 969. https://doi.org/10.3390/rs11080969
AMA Style
Liu S, Wang X, Lu Q, Li H, Wang Y, Deng L. Dam Leakage Detection by Borehole Radar: A Case-History Study. Remote Sensing. 2019; 11(8):969. https://doi.org/10.3390/rs11080969
Chicago/Turabian StyleLiu, Sixin, Xudong Wang, Qi Lu, Honqing Li, Yuanxin Wang, and Li Deng. 2019. "Dam Leakage Detection by Borehole Radar: A Case-History Study" Remote Sensing 11, no. 8: 969. https://doi.org/10.3390/rs11080969
Note that from the first issue of 2016, this journal uses article numbers instead of page numbers. See further details here.