Examining the Multi-Seasonal Consistency of Individual Tree Segmentation on Deciduous Stands Using Digital Aerial Photogrammetry (DAP) and Unmanned Aerial Systems (UAS)


Abstract
:1. Introduction
2. Materials and Methods
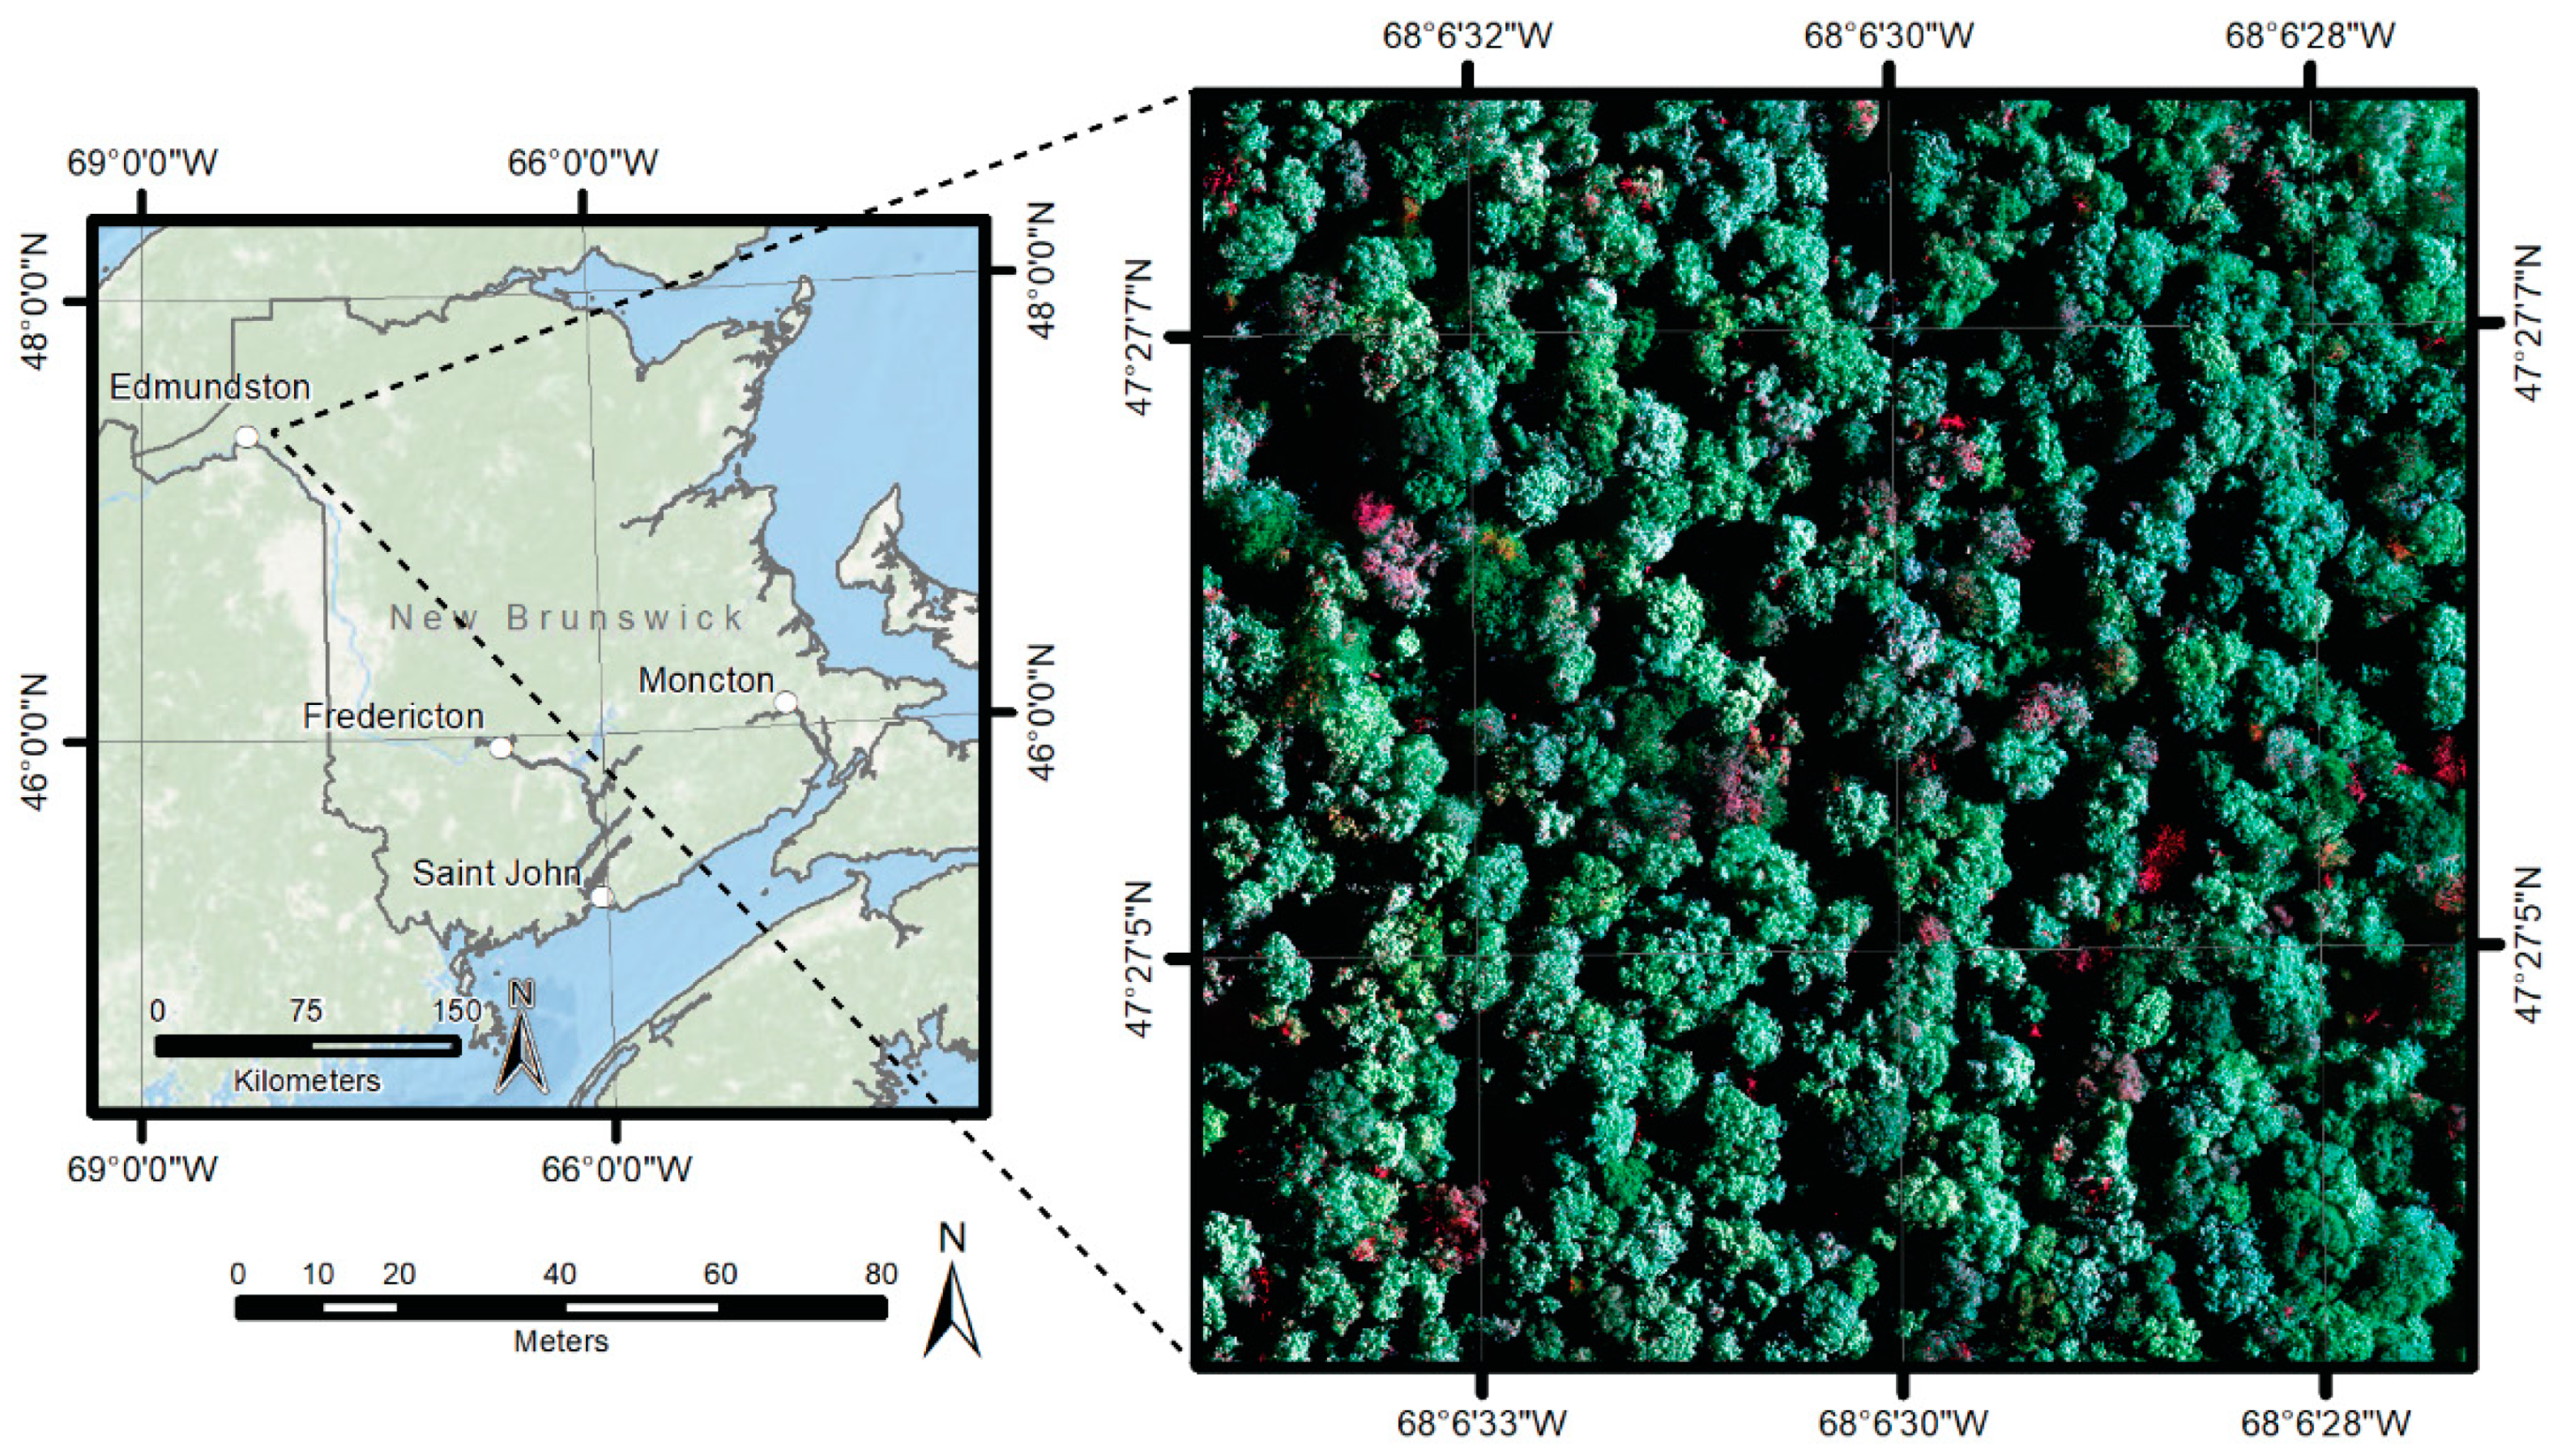
2.1. Study Area
2.2. Field Measurements
2.3. ALS Data
2.4. UAS-DAP Data
2.5. Processing and Analysis
2.5.1. Point Cloud Processing
2.5.2. ITCD
2.5.3. Tree Matching
3. Results
3.1. ITCD
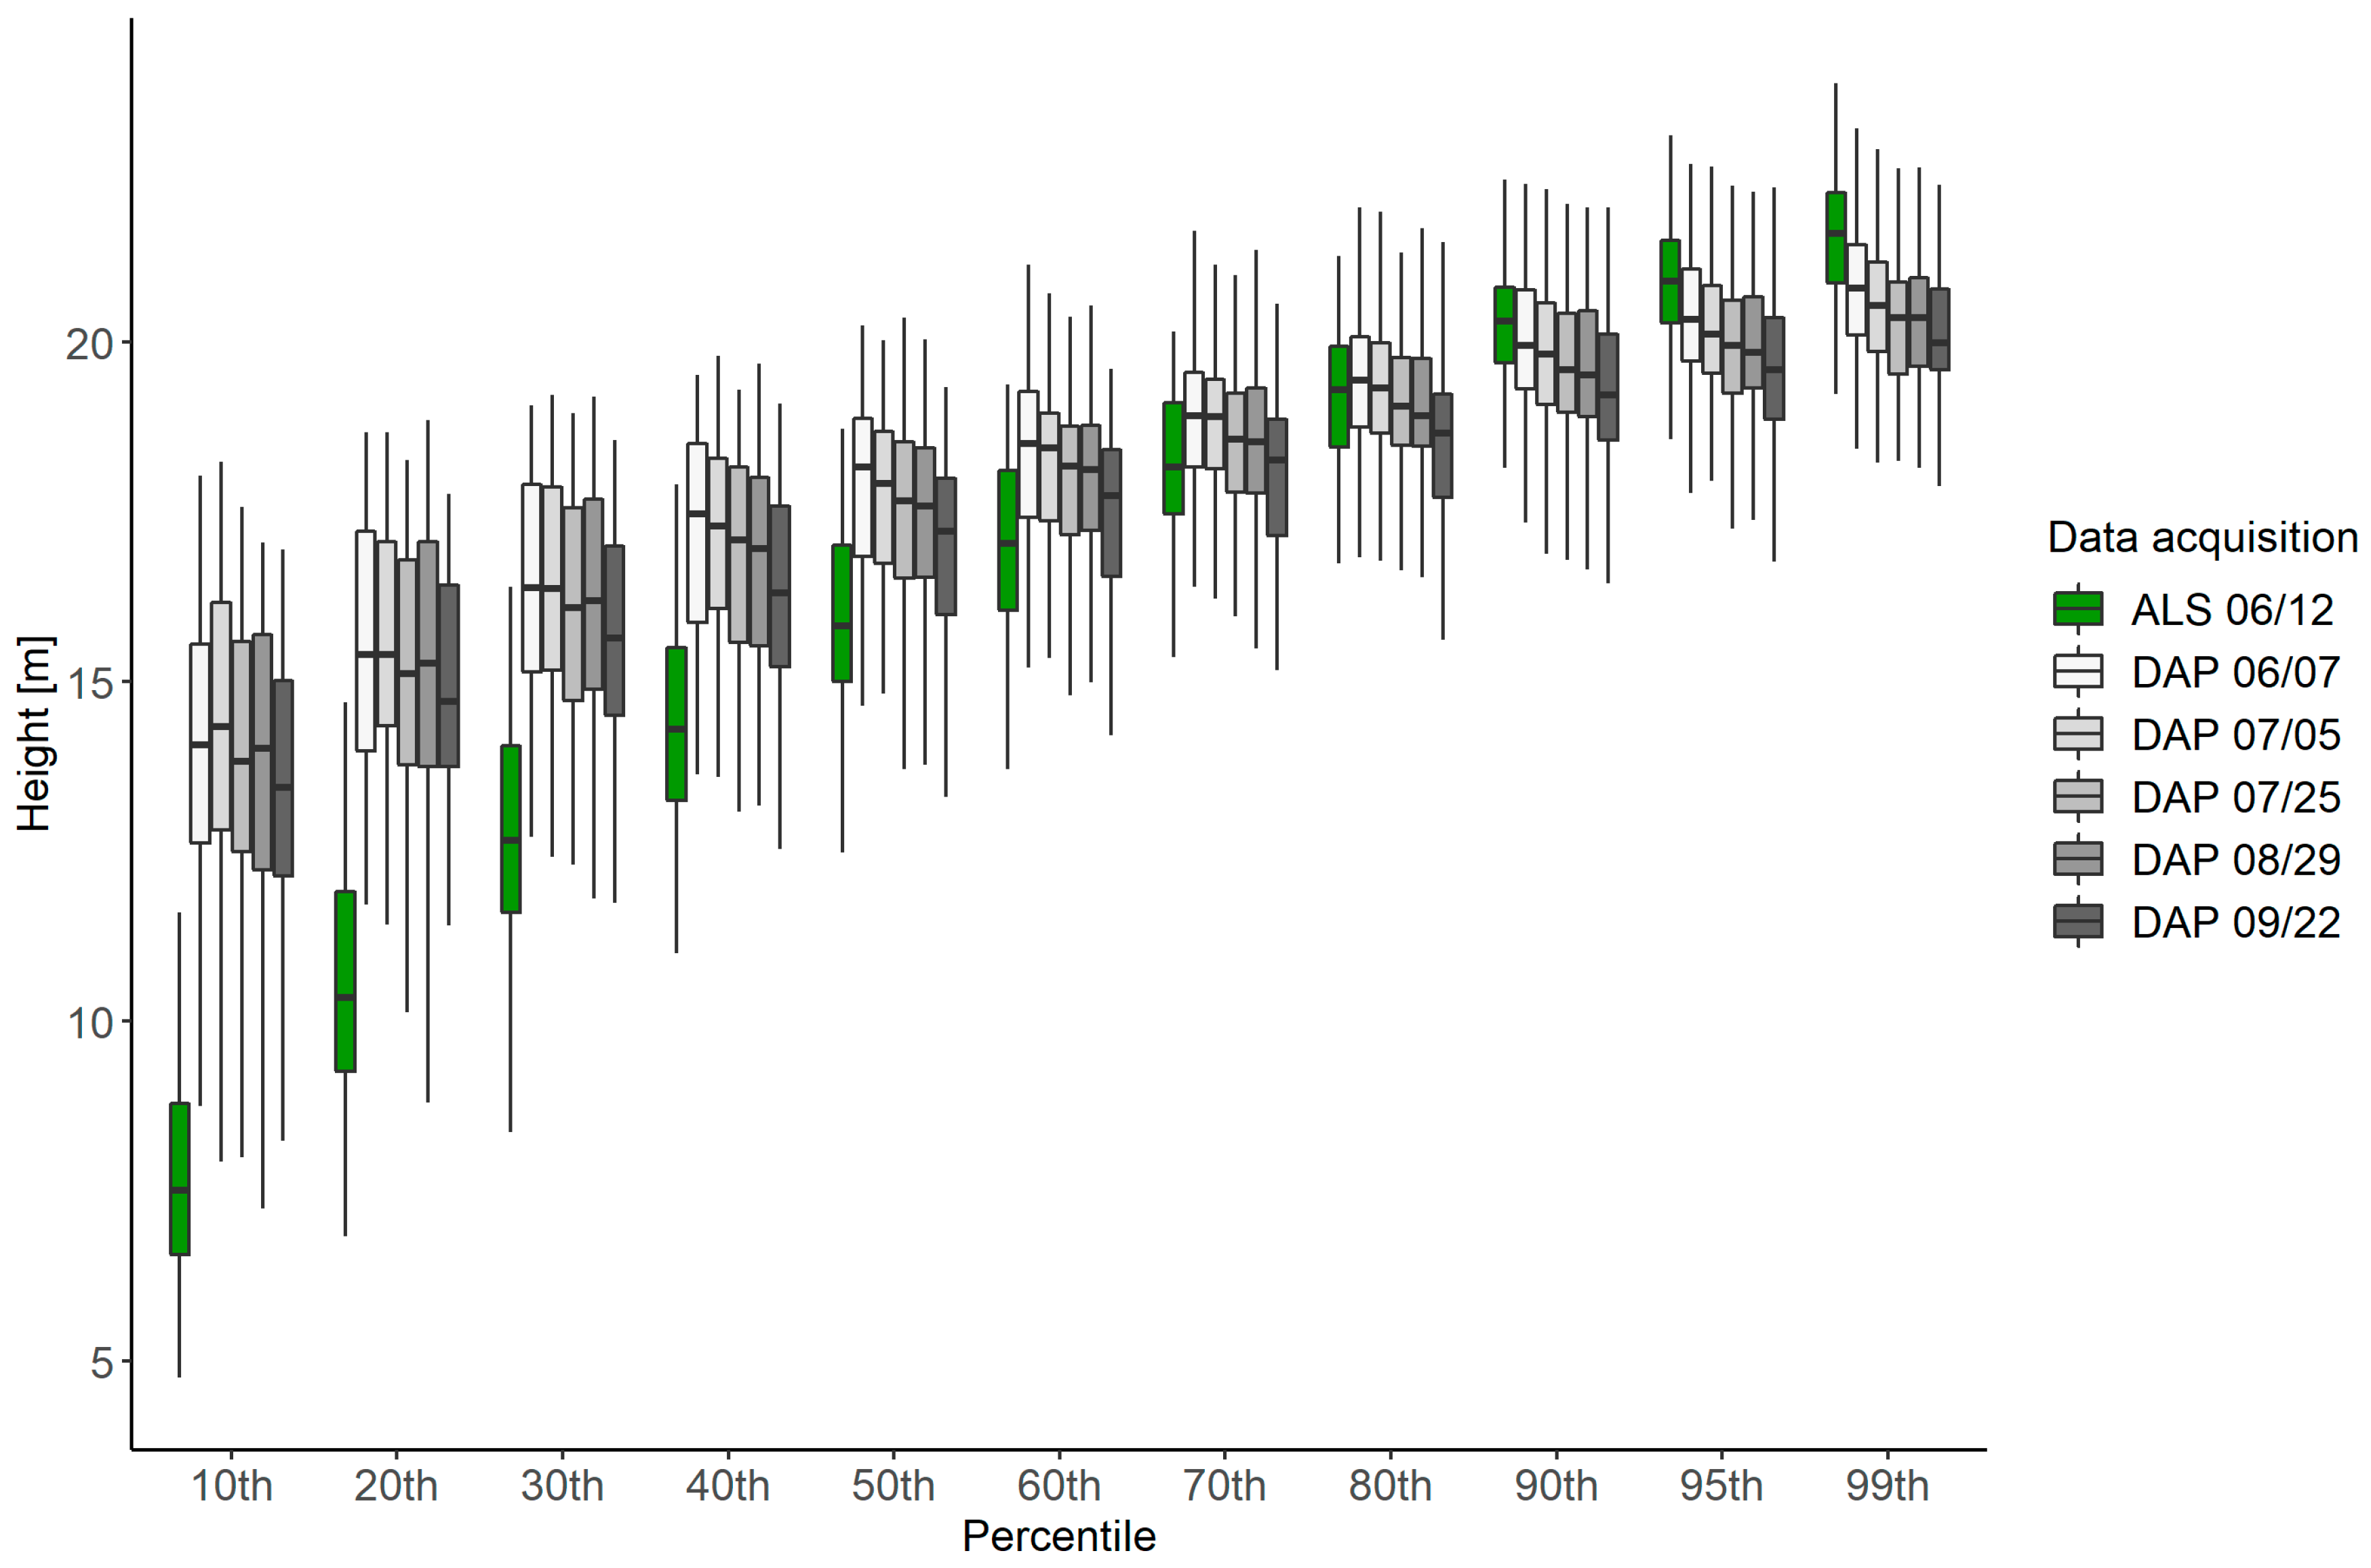
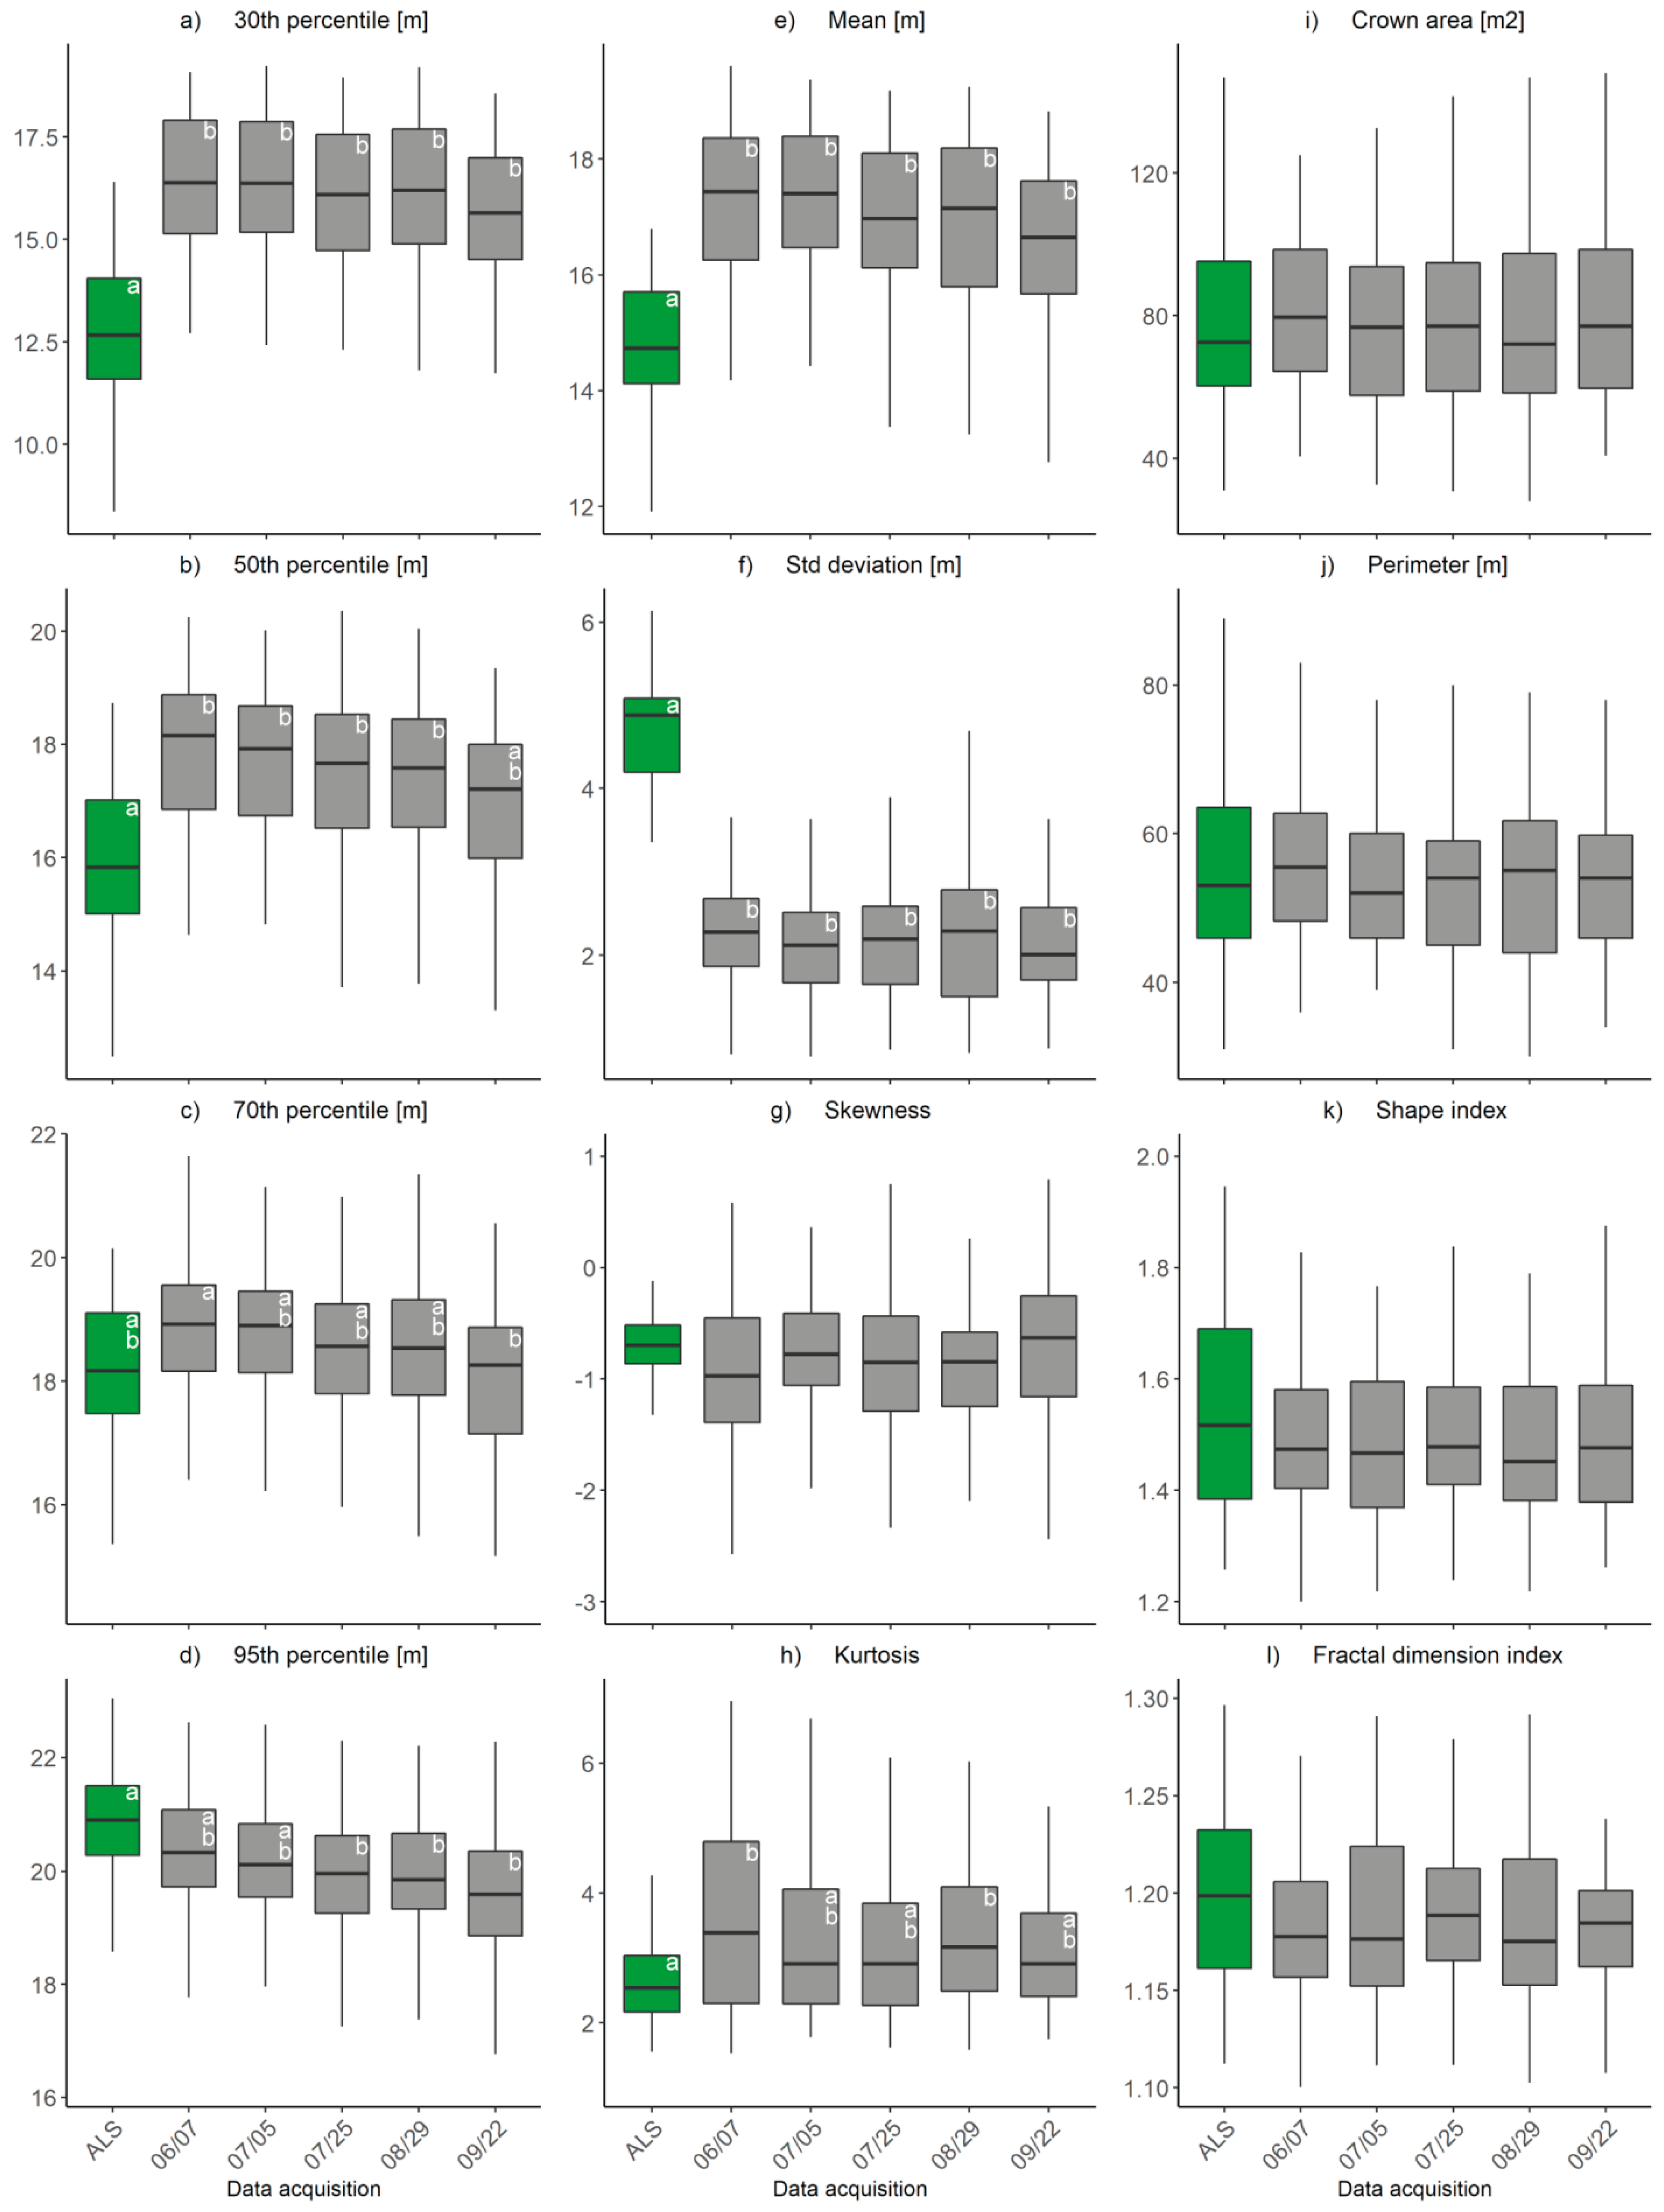
3.2. Time Series Analysis
4. Discussion
4.1. ITCD
4.2. Forest Inventory Attributes
4.3. Future Outlook
5. Conclusions
Author Contributions
Funding
Acknowledgments
Conflicts of Interest
Appendix A

| Segmented Data Acquisitions | ||||||
|---|---|---|---|---|---|---|
| Reference Data | ALS | June 7 | July 5 | July 25 | August 29 | September 22 |
| Field data | 79.2 | 72 | 59.2 | 61 | 71.8 | 72.3 |
| ALS | x | 66 | 65.3 | 54.5 | 68.6 | 77.1 |
| DAP June 7 | 63.2 | x | 77.1 | 71 | 68 | 75.5 |
| DAP July 5 | 50 | 71.6 | x | 69.7 | 59.8 | 71.7 |
| DAP July 25 | 54.4 | 76 | 70.1 | x | 78.4 | 68.2 |
| DAP August 29 | 69.2 | 60.6 | 58.3 | 58.3 | x | 63.7 |
| DAP September 22 | 71.4 | 68 | 71.4 | 72.1 | 68.7 | x |
| DAP Acquisitions | ||||||
|---|---|---|---|---|---|---|
| ALS | June 7 | July 5 | July 25 | August 29 | September 22 | |
| True positives | 95 | 84 | 77 | 84 | 88 | 88 |
| False positives | 11 | 12 | 19 | 23 | 14 | 15 |
| False negatives | 11 | 16 | 21 | 16 | 15 | 13 |
| Recall | 0.897 | 0.840 | 0.786 | 0.840 | 0.854 | 0.871 |
| Precision | 0.896 | 0.875 | 0.802 | 0.785 | 0.863 | 0.854 |
| Omission error (%) | 10.3 | 16 | 21.4 | 16 | 14.6 | 12.9 |
| Commission error (%) | 10.4 | 12.5 | 19.8 | 21.5 | 13.7 | 14.6 |
| Detection rate (%) | 89.6 | 84 | 78.6 | 84 | 85.4 | 87.1 |
| Accuracy index (%) | 79.2 | 72 | 59.2 | 61 | 71.8 | 72.3 |
References
- Bechtold, W.A.; Patterson, P.L. The Enhanced Forest Inventory and Analysis Program—National Sampling Design and Estimation Procedures; US Department of Agriculture Forest Service, Southern Research Station: Asheville, NC, USA, 2005; Volume SRS-80.
- Prandi, F.; Magliocchetti, D.; Poveda, A.; De Amicis, R.; Andreolli, M.; Devigili, F. New approach for forest inventory estimation and timber harvesting planning in mountain areas: The SLOPE project. ISPRS Int. Arch. Photogramm. Remote Sens. Spat. Inf. Sci. 2016, XLI-B3, 775–782. [Google Scholar] [CrossRef]
- Lee, H.; Slatton, K.C.; Roth, B.E.; Cropper, W.P., Jr. Adaptive clustering of airborne LiDAR data to segment individual tree crowns in managed pine forests. Int. J. Remote Sens. 2010, 31, 117–139. [Google Scholar] [CrossRef]
- Goodbody, T.R.H.; Coops, N.C.; Tompalski, P.; Crawford, P.; Day, K.J. Updating residual stem volume estimates using ALS- and UAV-acquired stereo-photogrammetric point clouds. Int. J. Remote Sens. 2016, 38, 2938–2953. [Google Scholar] [CrossRef] [Green Version]
- Tompalski, P.; Wężyk, P.; Weidenbach, M.; De Kok, R.; Hawryło, P. A comparison of LiDAR and image-derived canopy height models for individual tree crown segmentation with object based image analysis. South-Eastern Eur. J. Earth Obs. Geomat. 2014, 3, 21–24. [Google Scholar]
- Brosofske, K.D.; Froese, R.E.; Falkowski, M.J.; Banskota, A. A review of methods for mapping and prediction of inventory attributes for operational forest management. For. Sci. 2014, 60, 733–756. [Google Scholar] [CrossRef]
- Ene, L.; Næsset, E.; Gobakken, T. Single tree detection in heterogeneous boreal forests using airborne laser scanning and area-based stem number estimates. Int. J. Remote Sens. 2012, 33, 5171–5193. [Google Scholar] [CrossRef]
- Hyyppä, J.; Hyyppä, H.; Leckie, D.; Gougeon, F.; Yu, X.; Maltamo, M. Review of methods of small-footprint airborne laser scanning for extracting forest inventory data in boreal forests. Int. J. Remote Sens. 2008, 29, 1339–1366. [Google Scholar] [CrossRef]
- Zhen, Z.; Quackenbush, L.J.; Zhang, L. Trends in automatic individual tree crown detection and delineation-evolution of LiDAR data. Remote Sens. 2016, 8, 333. [Google Scholar] [CrossRef]
- Tompalski, P.; Coops, N.C.; White, J.C.; Wulder, M.A.; Yuill, A. Characterizing streams and riparian areas with airborne laser scanning data. Remote Sens. Environ. 2017, 192, 73–86. [Google Scholar] [CrossRef]
- Breidenbach, J.; Næsset, E.; Lien, V.; Gobakken, T.; Solberg, S. Prediction of species specific forest inventory attributes using a nonparametric semi-individual tree crown approach based on fused airborne laser scanning and multispectral data. Remote Sens. Environ. 2010, 114, 911–924. [Google Scholar] [CrossRef]
- Coops, N.C.; Wulder, M.A.; Culvenor, D.S.; St-Onge, B.A. Comparison of forest attributes extracted from fine spatial resolution multispectral and lidar data. Can. J. Remote Sens. 2004, 30, 855–866. [Google Scholar] [CrossRef]
- Koch, B.; Kattenborn, T.; Straub, C.; Jari, V. Forestry applications of airborne laser scanning: Concepts and case studies. In Managing Forest Ecosystems; Maltamo, M., Næsset, E., Vauhkonen, J., Eds.; Springer: Dordrecht, The Netherlands, 2014; Volume 27, pp. 89–112. ISBN 9789401786621. [Google Scholar]
- Näsi, R.; Honkavaara, E.; Lyytikäinen-Saarenmaa, P.; Blomqvist, M.; Litkey, P.; Hakala, T.; Viljanen, N.; Kantola, T.; Tanhuanpää, T.; Holopainen, M.; et al. Using UAV-based photogrammetry and hyperspectral imaging for mapping bark beetle damage at tree-level. Remote Sens. 2015, 7, 15467–15493. [Google Scholar] [CrossRef]
- Goodbody, T.R.H.; Coops, N.C.; Marshall, P.L.; Tompalski, P.; Crawford, P. Unmanned aerial systems for precision forest inventory purposes: A review and case study. For. Chron. 2017, 93, 71–81. [Google Scholar] [CrossRef] [Green Version]
- Nevalainen, O.; Honkavaara, E.; Tuominen, S.; Viljanen, N.; Hakala, T.; Yu, X.; Hyyppä, J.; Saari, H.; Pölönen, I.; Imai, N.; et al. Individual tree detection and classification with UAV-based photogrammetric point clouds and hyperspectral imaging. Remote Sens. 2017, 9, 185. [Google Scholar] [CrossRef]
- Mohan, M.; Silva, C.; Klauberg, C.; Jat, P.; Catts, G.; Cardil, A.; Hudak, A.; Dia, M. Individual tree detection from unmanned aerial vehicle (UAV) derived canopy height model in an open canopy mixed conifer forest. Forests 2017, 8, 340. [Google Scholar] [CrossRef]
- Panagiotidis, D.; Abdollahnejad, A.; Surový, P.; Chiteculo, V. Determining tree height and crown diameter from high-resolution UAV imagery. Int. J. Remote Sens. 2017, 38, 2392–2410. [Google Scholar] [CrossRef]
- Pirotti, F.; Kobal, M.; Roussel, J.R. A comparison of tree segmentation methods using very high density airborne laser scanner data. ISPRS Int. Arch. Photogramm. Remote Sens. Spat. Inf. Sci. 2017, XLII-2/W7, 285–290. [Google Scholar] [CrossRef]
- Soille, P. Morphological Image Analysis: Principles and Applications, 2nd ed.; Springer: Berlin, Germany, 2003; ISBN 3662050889. [Google Scholar]
- Meyer, F.; Beucher, S. Morphological segmentation. J. Vis. Commun. Image Represent. 1990, 1, 21–46. [Google Scholar] [CrossRef]
- Popescu, S.C.; Wynne, R.H. Seeing the trees in the forest. Photogramm. Eng. Remote Sens. 2004, 70, 589–604. [Google Scholar] [CrossRef]
- Chen, Q.; Baldocchi, D.; Gong, P.; Kelly, M. Isolating individual trees in a savanna woodland using small footprint LiDAR data. Photogramm. Eng. Remote Sens. 2006, 72, 923–932. [Google Scholar] [CrossRef]
- Zhen, Z.; Quackenbush, L.J.; Zhang, L. Impact of tree-oriented growth order in marker-controlled region growing for individual tree crown delineation using airborne laser scanner (ALS) data. Remote Sens. 2013, 6, 555–579. [Google Scholar] [CrossRef]
- Popescu, S.C.; Wynne, R.H.; Nelson, R.F. Estimating plot-level tree heights with lidar: Local filtering with a canopy-height based variable window size. Comput. Electron. Agric. 2002, 37, 71–95. [Google Scholar] [CrossRef]
- Vauhkonen, J.; Ene, L.; Gupta, S.; Heinzel, J.; Holmgren, J.; Pitkanen, J.; Solberg, S.; Wang, Y.; Weinacker, H.; Hauglin, K.M.; et al. Comparative testing of single-tree detection algorithms under different types of forest. Forestry 2012, 85, 27–40. [Google Scholar] [CrossRef]
- Hamraz, H.; Contreras, M.A.; Zhang, J. A robust approach for tree segmentation in deciduous forests using small-footprint airborne LiDAR data. Int. J. Appl. Earth Obs. Geoinf. 2016, 52, 532–541. [Google Scholar] [CrossRef] [Green Version]
- Koch, B.; Heyder, U.; Weinacker, H. Detection of individual tree crowns in airborne LiDAR data. Photogramm. Eng. Remote Sens. 2006, 72, 357–363. [Google Scholar] [CrossRef]
- Colomina, I.; Molina, P. Unmanned aerial systems for photogrammetry and remote sensing: A review. ISPRS J. Photogramm. Remote Sens. 2014, 92, 79–97. [Google Scholar] [CrossRef] [Green Version]
- Lim, Y.S.; La, P.H.; Park, J.S.; Lee, M.H.; Pyeon, M.W.; Kim, J.-I. Calculation of Tree Height and Canopy Crown from Drone Images Using Segmentation. J. Korean Soc. Surv. Geod. Photogramm. Cartogr. 2016, 33, 605–614. [Google Scholar] [CrossRef]
- Goodbody, T.R.H.; Coops, N.C.; Hermosilla, T.; Tompalski, P.; Pelletier, G. Vegetation Phenology Driving Error Variation in Digital Aerial Photogrammetrically Derived Terrain Models. Remote Sens. 2018, 10, 1554. [Google Scholar] [CrossRef]
- Zhang, J.; Hu, J.; Lian, J.; Fan, Z.; Ouyang, X.; Ye, W. Seeing the forest from drones: Testing the potential of lightweight drones as a tool for long-term forest monitoring. Biol. Conserv. 2016, 198, 60–69. [Google Scholar] [CrossRef]
- Peasgood, S.; Valentin, M. Drones: A Rising Market; Sophic Capital: Toronto, ON, Canada, 2015; Available online: http://sophiccapital.com/wp-content/uploads/2015/09/Download-Sophic-Capitals-Aerial-Drone-Report-Here.pdf (accessed on 10 December 2018).
- Mokroš, M.; Výbošťok, J.; Merganič, J.; Hollaus, M.; Barton, I.; Koreň, M.; Tomaštík, J.; Čerňava, J. Early stage forest windthrow estimation based on unmanned aircraft system imagery. Forests 2017, 8, 306. [Google Scholar] [CrossRef]
- McKenna, P.; Erskine, P.D.; Lechner, A.M.; Phinn, S. Measuring fire severity using UAV imagery in semi-arid central Queensland, Australia. Int. J. Remote Sens. 2017, 38, 4244–4264. [Google Scholar] [CrossRef]
- Guerra-Hernández, J.; González-Ferreiro, E.; Monleón, V.; Faias, S.; Tomé, M.; Díaz-Varela, R. Use of multi-temporal UAV-derived imagery for estimating individual tree growth in Pinus pinea stands. Forests 2017, 8, 300. [Google Scholar] [CrossRef]
- Vastaranta, M.; Wulder, M.A.; White, J.C.; Pekkarinen, A.; Tuominen, S.; Ginzler, C.; Kankare, V.; Holopainen, M.; Hyyppä, H. Airborne laser scanning and digital stereo imagery measures of forest structure: Comparative results and implications to forest mapping and inventory update. Can. J. Remote Sens. 2013, 39, 382–395. [Google Scholar] [CrossRef]
- Goodbody, T.R.H.; Coops, N.C.; White, J.C. Digital Aerial Photogrammetry for Updating Area-Based Forest Inventories: A Review of Opportunities, Issues, and Future Directions. Curr. For. Rep. 2019, 1–22. [Google Scholar]
- White, J.C.; Stepper, C.; Tompalski, P.; Coops, N.C.; Wulder, M.A. Comparing ALS and image-based point cloud metrics and modelled forest inventory attributes in a complex coastal forest environment. Forests 2015, 6, 3704–3732. [Google Scholar] [CrossRef]
- Dandois, J.P.; Ellis, E.C. High spatial resolution three-dimensional mapping of vegetation spectral dynamics using computer vision. Remote Sens. Environ. 2013, 136, 259–276. [Google Scholar] [CrossRef] [Green Version]
- Goodwin, N.; Coops, N.C.; Stone, C. Assessing plantation canopy condition from airborne imagery using spectral mixture analysis and fractional abundances. Int. J. Appl. Earth Obs. Geoinf. 2005, 7, 11–28. [Google Scholar] [CrossRef]
- Zarco-Tejada, P.J.; Diaz-Varela, R.; Angileri, V.; Loudjani, P. Tree height quantification using very high resolution imagery acquired from an unmanned aerial vehicle (UAV) and automatic 3D photo-reconstruction methods. Eur. J. Agron. 2014, 55, 89–99. [Google Scholar] [CrossRef] [Green Version]
- Dempewolf, J.; Nagol, J.; Hein, S.; Thiel, C. Measurement of Within-Season Tree Height Growth in a Mixed Forest Stand Using UAV Imagery. Forests 2017, 8, 231. [Google Scholar] [CrossRef]
- Zelazny, V.F. Our Landscape Heritage: The Story of Ecological Land Classification in New Brunswick; Government of New Brunswick: Fredericton, NB, Canada, 2007; ISBN 978-1-55396-203-8.
- Soucy, M. Protocole d’Installation, Marteloscope 2014 McCoy; Université de Moncton: Edmundston, NB, Canada, 2013; Available online: https://www.researchgate.net/publication/311742145_Protocole_d’installation_des_marteloscopes_Horseback (accessed on 10 December 2018).
- Pix4D. Parrot Sequoia+ Multispectral Camera. Available online: https://www.pix4d.com/product/sequoia/faq (accessed on 23 November 2018).
- Agisoft LLC. Agisoft PhotoScan Professional Edition 2018; Agisoft LLC: St. Petersburg, Russia, 2018; Available online: https://www.agisoft.com/pdf/photoscan-pro_1_4_en.pdf (accessed on 10 December 2018).
- Besl, P.J.; McKay, N.D. Method for registration of 3-D shapes. In Sensor Fusion IV: Control Paradigms and Data Structures; SPIE: Bellingham, WA, USA, 1992; Volume 1611, pp. 586–606. Available online: https://www.spiedigitallibrary.org/conference-proceedings-of-spie/1611/1/Method-for-registration-of-3-D-shapes/10.1117/12.57955.full?SSO=1 (accessed on 10 December 2018).
- Khosravipour, A.; Skidmore, A.K.; Isenburg, M.; Wang, T.; Hussin, Y.A. Generating pit-free canopy height models from airborne LiDAR. Photogramm. Eng. Remote Sens. 2014, 80, 863–872. [Google Scholar] [CrossRef]
- White, J.C.; Wulder, M.A.; Varhola, A.; Vastaranta, M.; Coops, N.C.; Cook, B.D.; Pitt, D.; Woods, M. A Best Practices Guide for Generating Forest Inventory Attributes from Airborne Laser Scanning Data Using an Area-Based Approach; Natural Resources Canada: Victoria, BC, Canada, 2013.
- Ruxton, G.D.; Beauchamp, G. Time for some a priori thinking about post hoc testing. Behav. Ecol. 2008, 19, 690–693. [Google Scholar] [CrossRef] [Green Version]
- Kruskal, W.H.; Wallis, W.A. Use of Ranks in One-Criterion Variance Analysis. J. Am. Stat. Assoc. 1952, 47, 583–621. [Google Scholar] [CrossRef]
- Dunn, O.J. Multiple Comparisons Using Rank Sums. Technometrics 1964, 6, 241–252. [Google Scholar] [CrossRef]
- Patton, D.R. A diversity index for quantifying habitat “edge”. Wildl. Soc. Bull. 1975, 3, 171–173. [Google Scholar]
- Mandelbrot, B.B. The Fractal and the Geometry of Nature; W. H. Freeman and Co.: New York, NY, USA, 1982; ISBN 978-0716711865. [Google Scholar]
- Pouliot, D.A.; King, D.J.; Bell, F.W.; Pitt, D.G. Automated tree crown detection and delineation in high-resolution digital camera imagery of coniferous forest regeneration. Remote Sens. Environ. 2002, 82, 322–334. [Google Scholar] [CrossRef]
- Li, W.; Guo, Q.; Jakubowski, M.K.; Kelly, M. A new method for segmenting individual trees from the LiDAR point cloud. Photogramm. Eng. Remote Sens. 2012, 78, 75–84. [Google Scholar] [CrossRef]
- Tomaštík, J.; Mokroš, M.; Saloň, Š.; Chudý, F.; Tunák, D. Accuracy of photogrammetric UAV-based point clouds under conditions of partially-open forest canopy. Forests 2017, 8, 151. [Google Scholar] [CrossRef]
- Li, X.; Strahler, A. Geometric-Optical Modeling of a Conifer Forest Canopy. IEEE Trans. Geosci. Remote Sens. 1985, GE-23, 705–721. [Google Scholar] [CrossRef]
- Holopainen, M.; Vastaranta, M.; Karjalainen, M.; Karila, K.; Kaasalainen, S.; Honkavaara, E.; Hyyppä, J. Forest inventory attribute estimation using airborne laser scanning, aerial stereo imagery, radargrammetry and interferometry—Finnish experiences of the 3D techniques. ISPRS Ann. Photogramm. Remote Sens. Spat. Inf. Sci. 2015, II-3/W4, 63–69. [Google Scholar] [CrossRef]
- Wang, Y.; Weinacker, H.; Koch, B. A Lidar point cloud based procedure for vertical canopy structure analysis and 3D single tree modelling in forest. Sensors 2008, 8, 3938–3951. [Google Scholar] [CrossRef]


| Field Characteristic | Data |
|---|---|
| Tree count | 106 |
| Species | Sugar maple (70%), yellow birch (14%), red maple (11%), balsam-fir (3%), and beech (2%). |
| Stem density (stems ha−1) | 118 |
| Height (m) | 10–29.8 (22) |
| DBH (cm) | 14–76 (36.3) |
| Crown size (m) | 5.2–18.2 (12.4) |
| Data Source | Acquisition Data | Season | Mean Flight Altitude (m) | Mean GSD (cm) | Mean Sun Angle (°) | Mean Point Density (pts m−2) |
|---|---|---|---|---|---|---|
| ALS | 2017-06-12 | Spring | - | - | - | 25.6 |
| DAP | 2017-06-07 | Spring | 88.5 | 8.11 | 66.5 | 47.3 |
| DAP | 2017-07-05 | Early-Summer | 89.7 | 8.22 | 65.2 | 36.5 |
| DAP | 2017-07-25 | Summer | 89.7 | 8.22 | 56.3 | 43.6 |
| DAP | 2017-08-29 | Summer | 87 | 7.98 | 75 | 46.8 |
| DAP | 2017-09-22 | Fall | 73 | 6.69 | 73.6 | 45.0 |
| Attribute | Data |
|---|---|
| Sensor name | Sequoia multispectral camera |
| Platform | eBee senseFly fixed-wing drone |
| Spectral bands | Green (530–570 nm), red (640–680 nm), red-edge (730–740 nm), near-infrared (770–810 nm) |
| Pixel size | 3.75 μm |
| Focal length | 3.98 mm |
| Resolution | 1280 × 960 px |
| Metric | Description |
|---|---|
| P10-P90 | 10th up to 90th (with steps of 10) percentile of point heights > 2 m within crown segment |
| P95 | 95th percentile of point heights > 2 m within crown segment |
| P99 | 99th percentile of point heights > 2 m within crown segment |
| Mean height | Average of point heights >2 m within crown segment |
| Standard deviation | Standard deviation of points > 2 m within crown segment |
| Skewness | Skewness of points >2 m within crown segment |
| Kurtosis | Kurtosis of points >2 m within crown segment |
| Crown area | Surface of the crown segment |
| Perimeter | Length of the crown segment’s outline |
| Shape index | Relation of the crown segment’s shape to a square shape of the same size [54] |
| Fractal dimension index | Relation of the segment’s shape to the Euclidean dimensions (point, line, plane, cube) [55] |
| DAP Acquisitions | |||||
|---|---|---|---|---|---|
| June 7 | July 5 | July 25 | August 29 | September 22 | |
| True positives | 81 | 81 | 81 | 86 | 92 |
| False positives | 15 | 15 | 26 | 16 | 11 |
| False negatives | 19 | 20 | 20 | 16 | 13 |
| Recall | 0.810 | 0.802 | 0.802 | 0.843 | 0.876 |
| Precision | 0.844 | 0.844 | 0.757 | 0.843 | 0.893 |
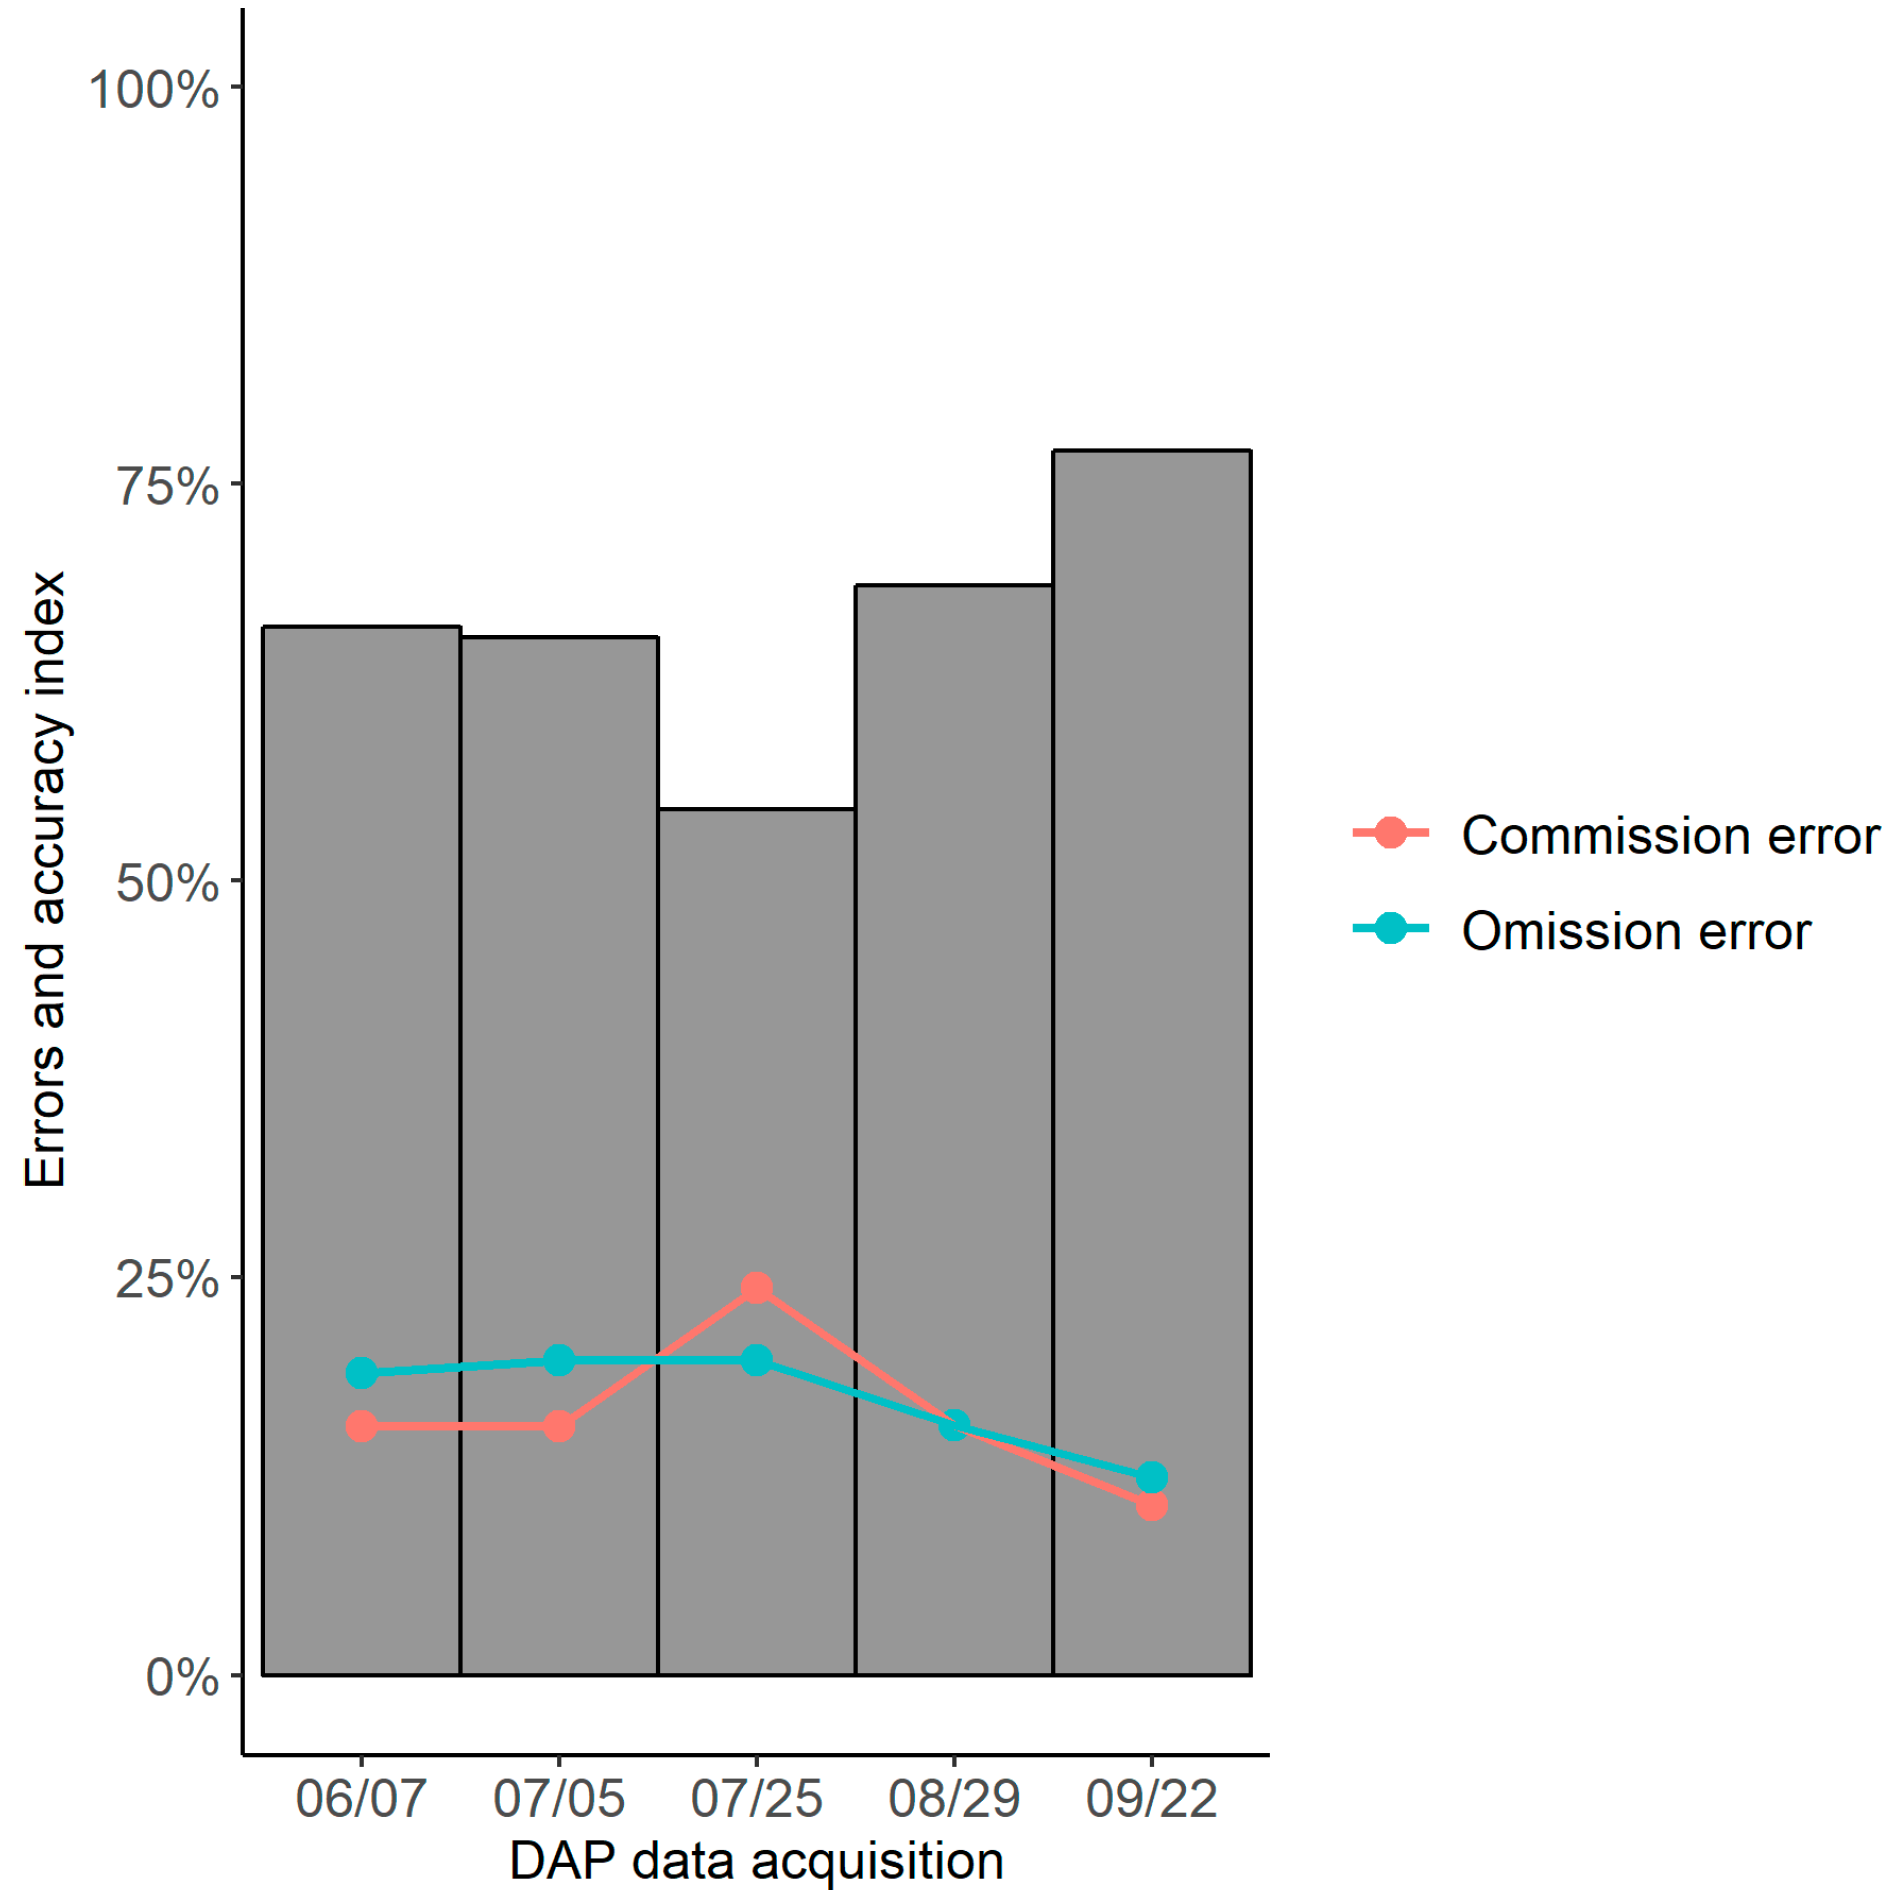
| Omission error (%) | 19 | 19.8 | 19.8 | 15.7 | 12.4 |
| Commission error (%) | 15.6 | 15.6 | 24.3 | 15.7 | 10.7 |
| Detection rate (%) | 81 | 80.2 | 80.2 | 84.3 | 89.3 |
| Accuracy index (%) | 66 | 65.3 | 54.5 | 68.6 | 77.1 |
| Dominant canopy cover (%) | 81.1 | 81.8 | 78.8 | 78.5 | 75.8 |
| Mean CHM height change (m) | - | −0.02 (−0.60–0.40) | +0.48 (0.02–1.15) | 0.00 (−0.33–0.25) | +0.14 (−0.17–0.41) |
© 2019 by the authors. Licensee MDPI, Basel, Switzerland. This article is an open access article distributed under the terms and conditions of the Creative Commons Attribution (CC BY) license (http://creativecommons.org/licenses/by/4.0/).
Share and Cite
Nuijten, R.J.G.; Coops, N.C.; Goodbody, T.R.H.; Pelletier, G. Examining the Multi-Seasonal Consistency of Individual Tree Segmentation on Deciduous Stands Using Digital Aerial Photogrammetry (DAP) and Unmanned Aerial Systems (UAS). Remote Sens. 2019, 11, 739. https://doi.org/10.3390/rs11070739
Nuijten RJG, Coops NC, Goodbody TRH, Pelletier G. Examining the Multi-Seasonal Consistency of Individual Tree Segmentation on Deciduous Stands Using Digital Aerial Photogrammetry (DAP) and Unmanned Aerial Systems (UAS). Remote Sensing. 2019; 11(7):739. https://doi.org/10.3390/rs11070739
Chicago/Turabian StyleNuijten, Rik J.G., Nicholas C. Coops, Tristan R.H. Goodbody, and Gaetan Pelletier. 2019. "Examining the Multi-Seasonal Consistency of Individual Tree Segmentation on Deciduous Stands Using Digital Aerial Photogrammetry (DAP) and Unmanned Aerial Systems (UAS)" Remote Sensing 11, no. 7: 739. https://doi.org/10.3390/rs11070739