Land Cover Changes and Their Driving Mechanisms in Central Asia from 2001 to 2017 Supported by Google Earth Engine


1
State Key Laboratory of Resources and Environmental Information System, Institute of Geographic Sciences and Natural Resources Research, Chinese Academy of Sciences, Beijing 100101, China
2
University of Chinese Academy of Sciences, Beijing 100049, China
*
Author to whom correspondence should be addressed.
Remote Sens. 2019, 11(5), 554; https://doi.org/10.3390/rs11050554
Submission received: 11 February 2019
/
Revised: 2 March 2019
/
Accepted: 3 March 2019
/
Published: 6 March 2019
Abstract
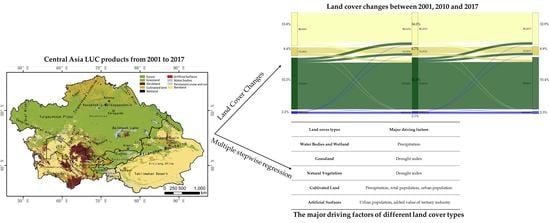
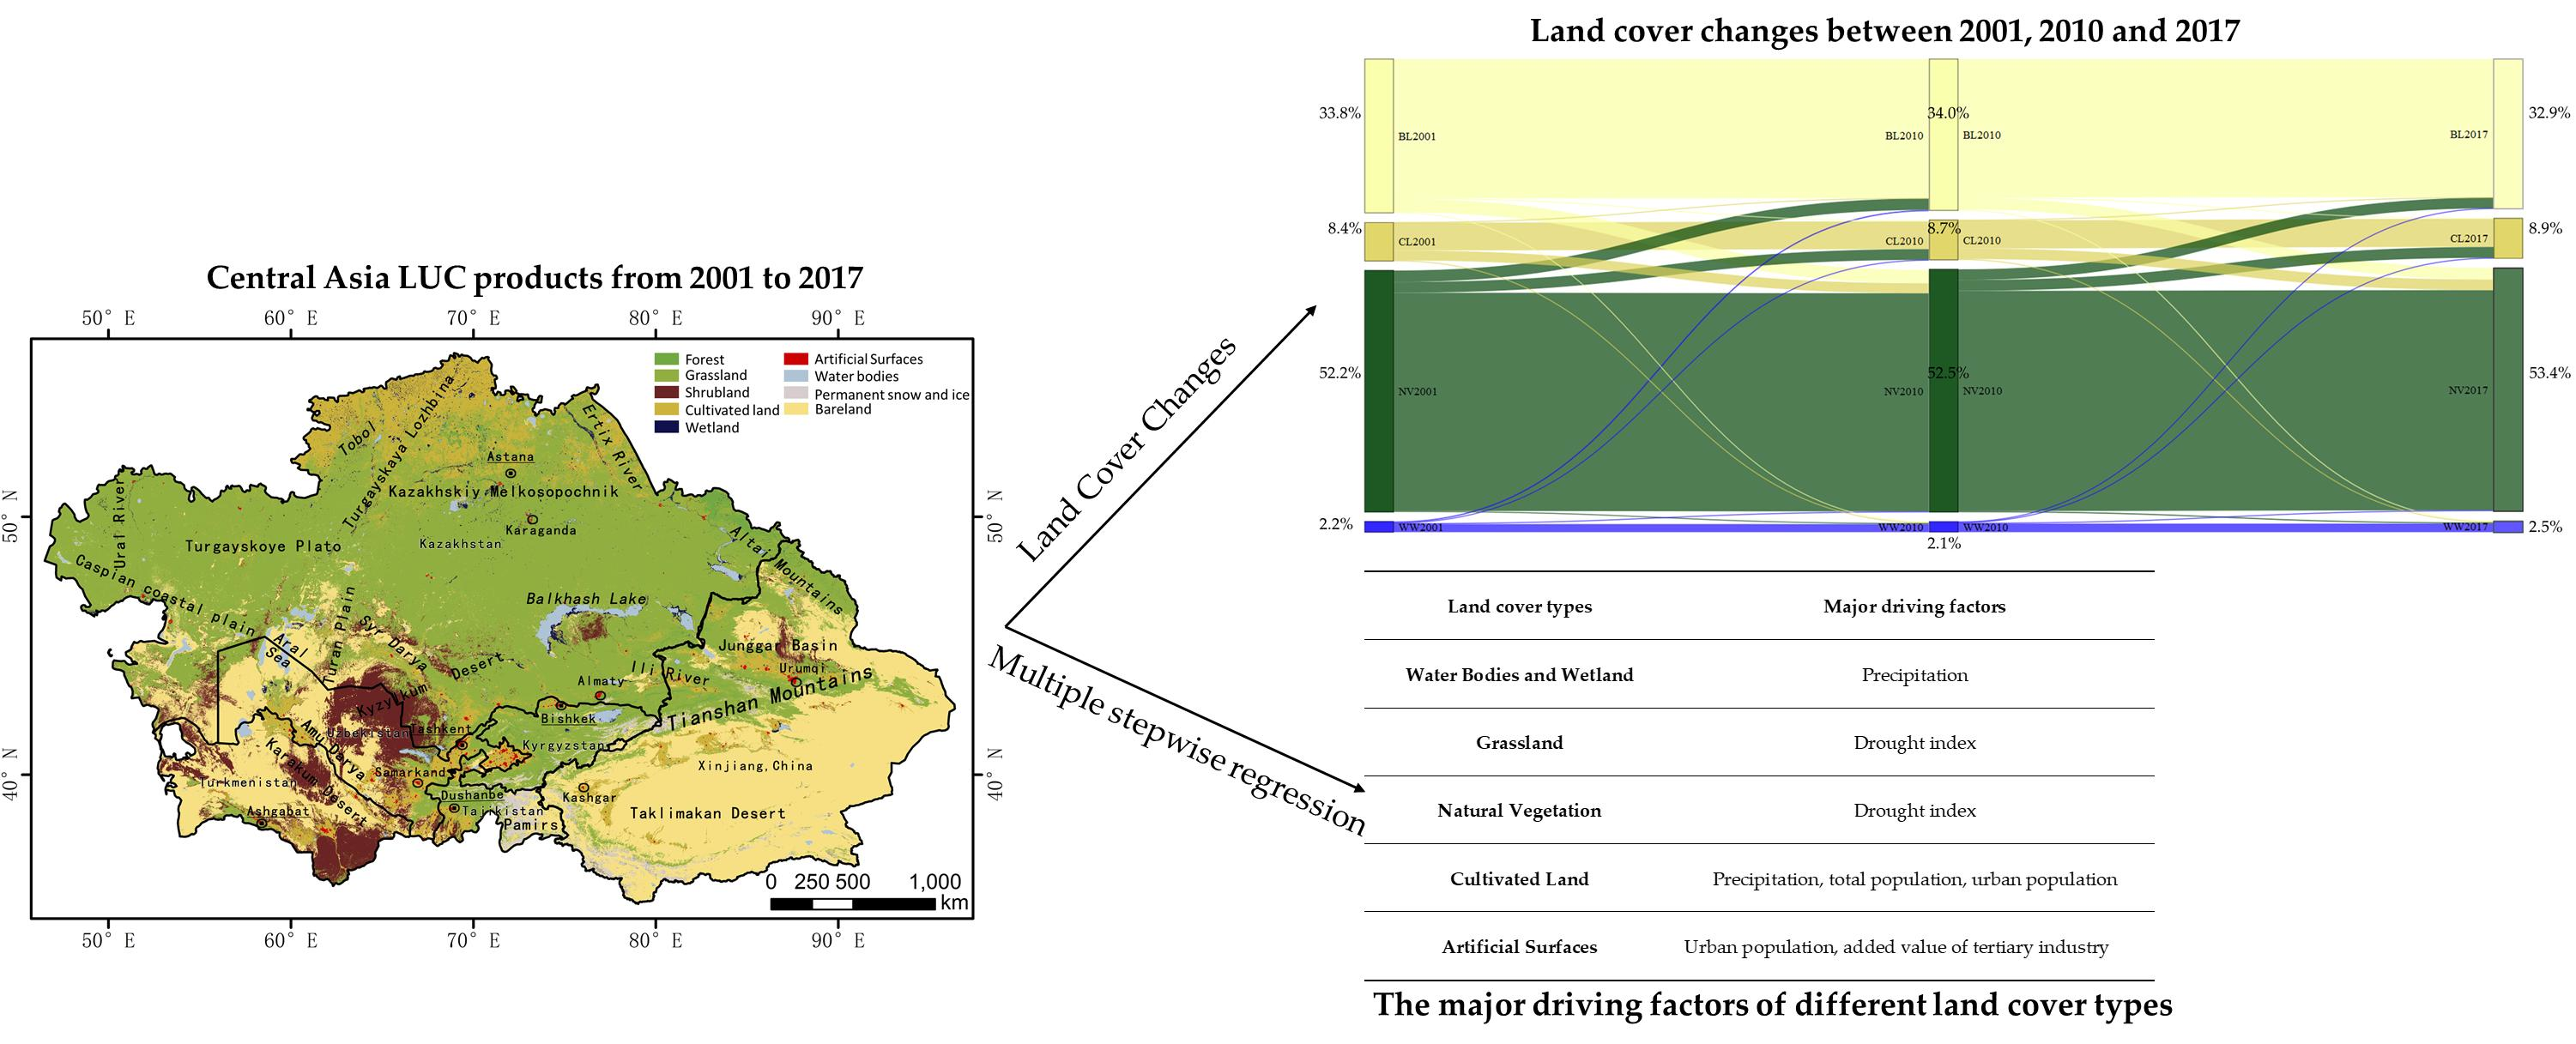
:Limited research has been published on land changes and their driving mechanisms in Central Asia, but this area is an important ecologically sensitive area. Supported by Google Earth Engine (GEE), this study used Landsat satellite imagery and selected the random forest algorithm to perform land classification and obtain the annual land cover datasets of Central Asia from 2001 to 2017. Based on the temporal datasets, the distributions and dynamic trends of land cover were summarized, and the key factors driving land changes were analyzed. The results show that (1) the obtained land datasets are reliable and highly accurate, with an overall accuracy of 0.90 ± 0.01. (2) Grassland and bareland are the two most prominent land cover types, with area proportions of 45.0% and 32.9% in 2017, respectively. Over the past 17 years, bareland has displayed an overall reduction, decreasing by 2.6% overall. Natural vegetation (grassland, forest, and shrubland), cultivated land, water bodies and wetlands have displayed increasing trends at different rates. (3) The amount of precipitation and degree of drought are the driving factors that affect natural vegetation. The changes in cultivated land are mainly affected by precipitation and anthropogenic drivers. The effects of increasing urban populations and expanding industrial development are the factors driving the expansion of urban regions. The advantages and uncertainties arising from the land mapping and change detection method and the complexity of the driving mechanisms are also discussed.
1. Introduction
The Xinjiang Uygur Autonomous Region of China, Kazakhstan, Kyrgyzstan, Tajikistan, Uzbekistan, and Turkmenistan, located in the heart of the Eurasian continent, is a typical arid and semiarid region with fragile environments that are sensitive to climate change and human activities. There are two basic elements for the assessment of sustainable development of regional natural ecosystems. One is to dynamically monitor the spatial pattern of land cover in Central Asia, and the other is to evaluate the driving mechanisms of climate and human activities in terms of land cover. Moreover, such tasks are important for exploring the responses of typical arid and semiarid regions to global climate change [1,2].
Several global land cover products based on remote sensing data have been released, such as the International Geosphere Biosphere Programme (IGBP) Data and Information System global land cover data set (DISCover) [3], the global land cover classification for the year 2000 (GLC2000) dataset [4], the Moderate Resolution Imaging Spectroradiometer (MODIS) land cover (MCD12) dataset [5], and the Global Land Cover Characteristics Data Base (GLCC) [6]. However, these products are based on satellite imagery; thus, the resolution and classification accuracy are not high (the most common spatial resolution is 1 km, and the nominal overall accuracy ranges from 60–80%) and cannot meet the needs of environmental monitoring, agricultural planning and ecological governance [7]. The spatial resolution of GlobeLand30 is 30 m, and the overall accuracy obtained by third-party evaluations exceeds 80% [8]. However, the production of the GlobeLand30 product still relies on manual intervention, making it difficult to update and conduct land studies at an annual scale. Currently, land mapping research requires high spatial resolution imagery, improved classification and change detection algorithms, and powerful platforms [9].
There are many automatic land classification algorithms, such as minimum distance classification (MDC), maximum likelihood classification (MLC), classification and regression trees (CART), random forest (RF), support vector machine (SVM), back propagation (BP) neural network, multiscale segmentation, and object-oriented classification methods [10,11]. Akar et al. [12] compared the classification accuracy of RF, SVM, and MLC in the Trabzon region of Turkey based on multispectral imagery. Similarly, many relevant researchers have used the different classification algorithms described above to conduct research in different research areas. Because the given model parameters and environments in different study areas differ, it is difficult to determine which classification algorithm is the most common and broadly applicable. Therefore, for this vast region of Central Asia, it is more practical for us to use the same classification algorithm for the entire region. Among these algorithms, the RF method, formed by a combination of many decision tree models, is widely used [12,13,14]. In the past, based on the computing power and storage, only a limited number of multispectral bands could be used as inputs in RF models. Few studies have used the full range of satellite band data, and many other environmental factors and human activity characteristics closely related to land cover, such as the normalized difference vegetable index (NDVI), the normalized difference water index (NDWI), digital elevation model (DEM), slope, rainfall, temperature, humidity, drought index, and nighttime light data, are rarely introduced into RF models. Thus, the advantages of RF methods for multidimensional feature data have not been fully exploited. In addition, most traditional research was conducted to obtain training sample attributes through visual interpretation. At the national and intercontinental scales, such deployment methods may not be reasonable, and the entire process requires extensive time and labor. The Google Earth Engine (GEE) has provided a platform that provides basic calculation functions for raster and vector data and can be used by developers with APIs based on JavaScript and Python [15,16]. The GEE does not need require remote sensing image archives to be downloaded. Its high computational power offers land mapping approaches for national-, intercontinental-, and even global-scale levels [17,18,19,20].
Land cover changes are influenced by both natural and social factors [21,22,23,24]. Natural factors have controlling effects at long-term scales. For example, the climate type controls the vegetation type, and changes in precipitation greatly affect the growth and state of vegetation. Social factors have important impacts on short-term scales. For example, the development of urban economies and increases in the urban population will cause the expansion of urban areas. Supported by MODIS data from 2000–2014, Zou et al. [25] found that the change in precipitation was the main cause of the changes in the quality of natural ecosystems in Central Asia. Based on Landsat TM/ETM+ images, spatial and temporal changes in city regions in Central Asia were analyzed. The results indicated that the levels of urbanization and economic development are the most important factors affecting the changes in urban land areas [26]. In addition, based on MODIS time series data from Central Asia in 2001 and 2009, Klein et al. [27] applied the C5.0 algorithm to analyze waterbody and forest losses associated with human activities and vegetation changes caused by seasonal precipitation. Previous studies have shown that in typical arid and semiarid regions of Central Asia, climate change and economic and social changes have significant impacts on land cover change and ecosystem services [28,29]. However, due to the lack of high-accuracy, updated land cover data and powerful data processing platforms, studies with high spatial resolutions (e.g., 10–100 m) and of current scenarios (after the 2010s) have not yet been conducted. Additionally, comparative analyses of the temporal and spatial evolutionary feature of land systems and the corresponding driving mechanisms in Central Asia are lacking.
In this article, we selected Central Asia as the research area and Landsat imagery as the basic data source. Supported by GEE, we expanded the RF algorithm and technical method, and mapped the land cover of Central Asia each year from 2001 to 2017. Using spatial analysis and multiple stepwise regression analysis methods, we investigated the drivers governing the temporal and spatial changes over the past 17 years. We focused on three issues:
- (1)
- How can land cover mapping across national scales be completed quickly and accurately?
- (2)
- What has the land cover change trend in Central Asia been over the past 17 years?
- (3)
- How do climate change and human activities affect land cover?
2. Materials and Methods
2.1. Study Area
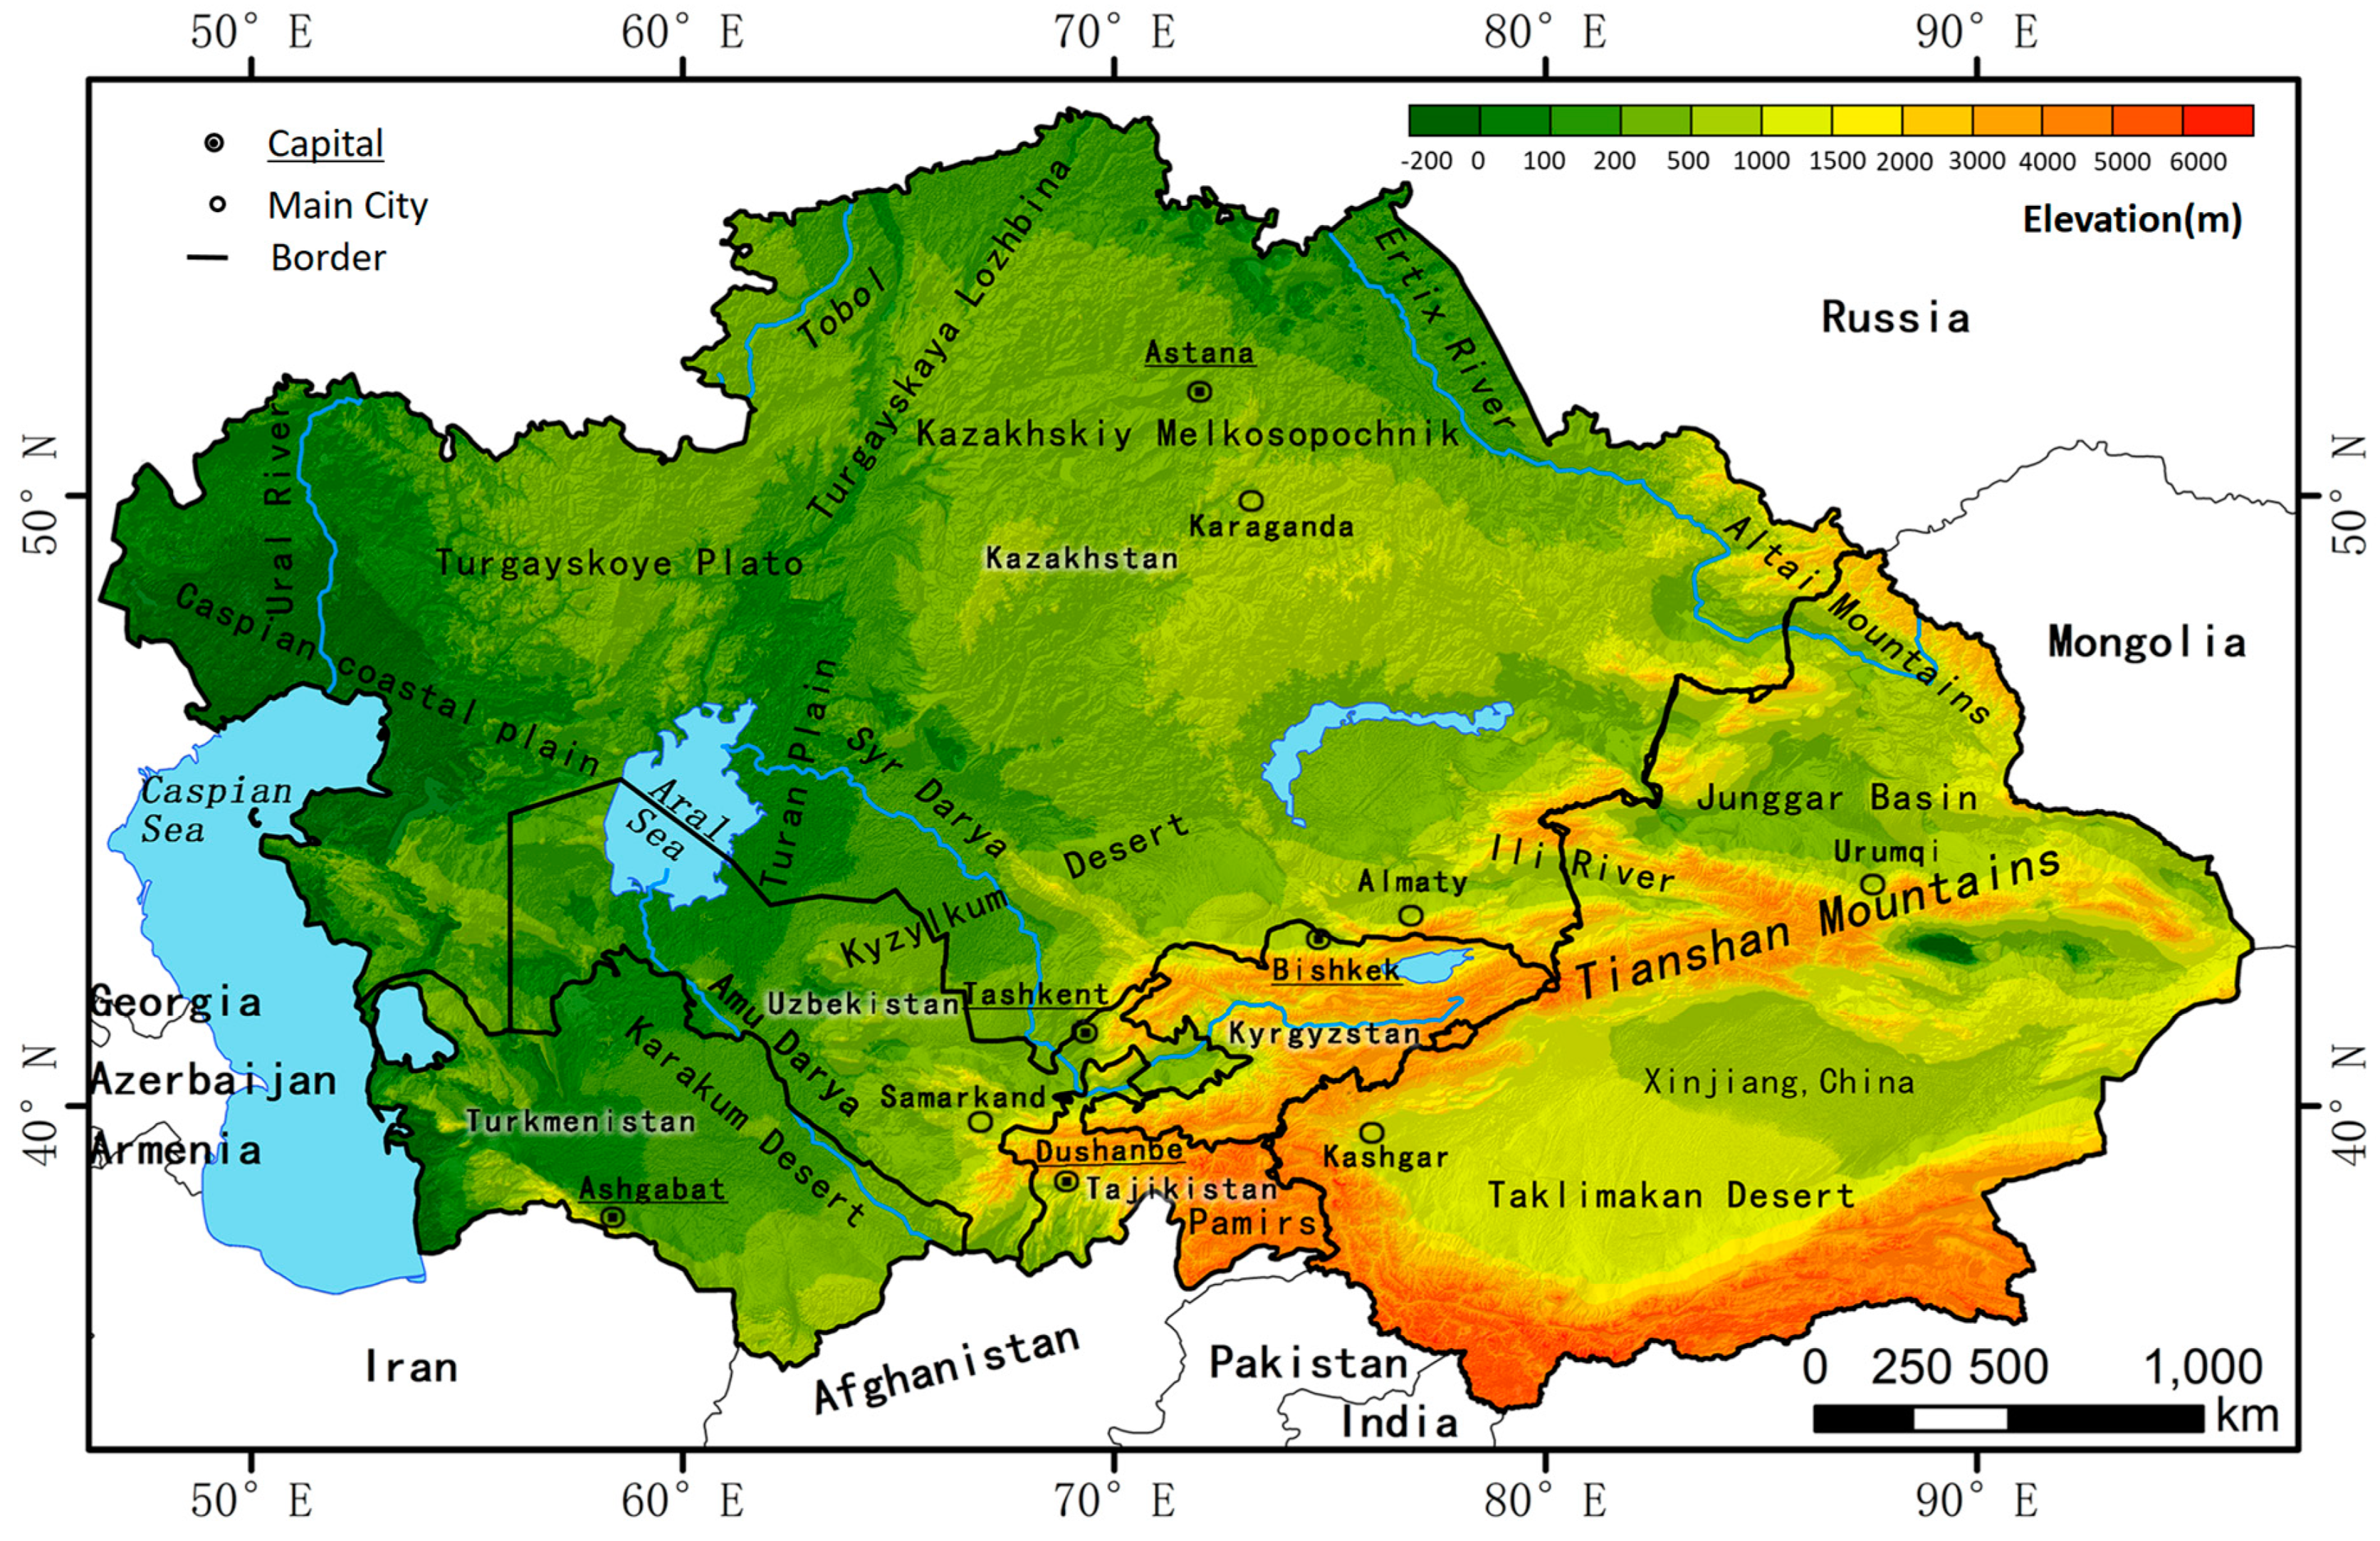
The Xinjiang region of China, Kazakhstan, Kyrgyzstan, Tajikistan, Turkmenistan, and Uzbekistan is located in Central Asia (46–96°E, 35–56°N). The total land area of this region is approximately 5.61 × 10⁶ km2. The study area is bordered by Russia to the north; Pakistan, Iran, and Afghanistan to the south; and the Caspian Sea to the west. The east is bordered by Mongolia and Gansu, Qinghai, and Tibet in China (Figure 1). The study area has a typical continental arid and semiarid climate.
2.2. Materials
Different datasets were collected and used in this research (Table 1). The land cover mapping was mainly derived from the top-of-atmosphere (TOA) reflectance data from Landsat 5/7/8 images and NDVI and NDWI products from 2001 to 2017. In addition, Shuttle Radar Topography Mission version 3 (SRTM3), Defense Meteorological Satellite Program-Operation Linescan System (DMSP/OLS) and National Polar-Orbiting Partnership Visible Infrared Imaging Radiometer Suite (NPP/VIIRS) night lighting products were used as supporting information. These auxiliary products were introduced to improve the classification accuracy of terrestrial vegetation coverage, water bodies, alpine glaciers and human settlements [30,31].
To support the construction of a training dataset with high reliability, this study built on several land cover products, including MODIS land cover products (MCD12Q1) [5], global land cover data (GlobCover 2009) [32], the Global Forest Change dataset (GFCD) [33], Global Food Security Support Analysis data(GFSSAD) [34], and global surface coverage data from 2010 (GlobeLand30-2010) [8].
To analyze the impact of climate change on regional land cover, this study used three indicators from 2001 to 2017: the annual precipitation, annual average temperature, and drought index. These long-term meteorological data were derived from the PERSIANN-CDR [35], GLDAS-2.1 [36] and TerraClimate [37] datasets. Among them, the drought index is expressed by the annual average Palmer Drought Severity Index (PDSI) from TerraClimate.
To analyze the effect of human activities on regional land cover, the study also collected annual regional economic and social development data. The statistics for Xinjiang, China, were downloaded from the National Bureau of Statistics of the People’s Republic of China (http://www.stats.gov.cn/), and the statistics for the other five countries were obtained from the World Bank website (https://data.worldbank.org.cn/). To facilitate the comparison among countries and regions, the monetary units were converted into US dollars based on the 2010 exchange rate.
2.3. Methods
2.3.1. Technical Process
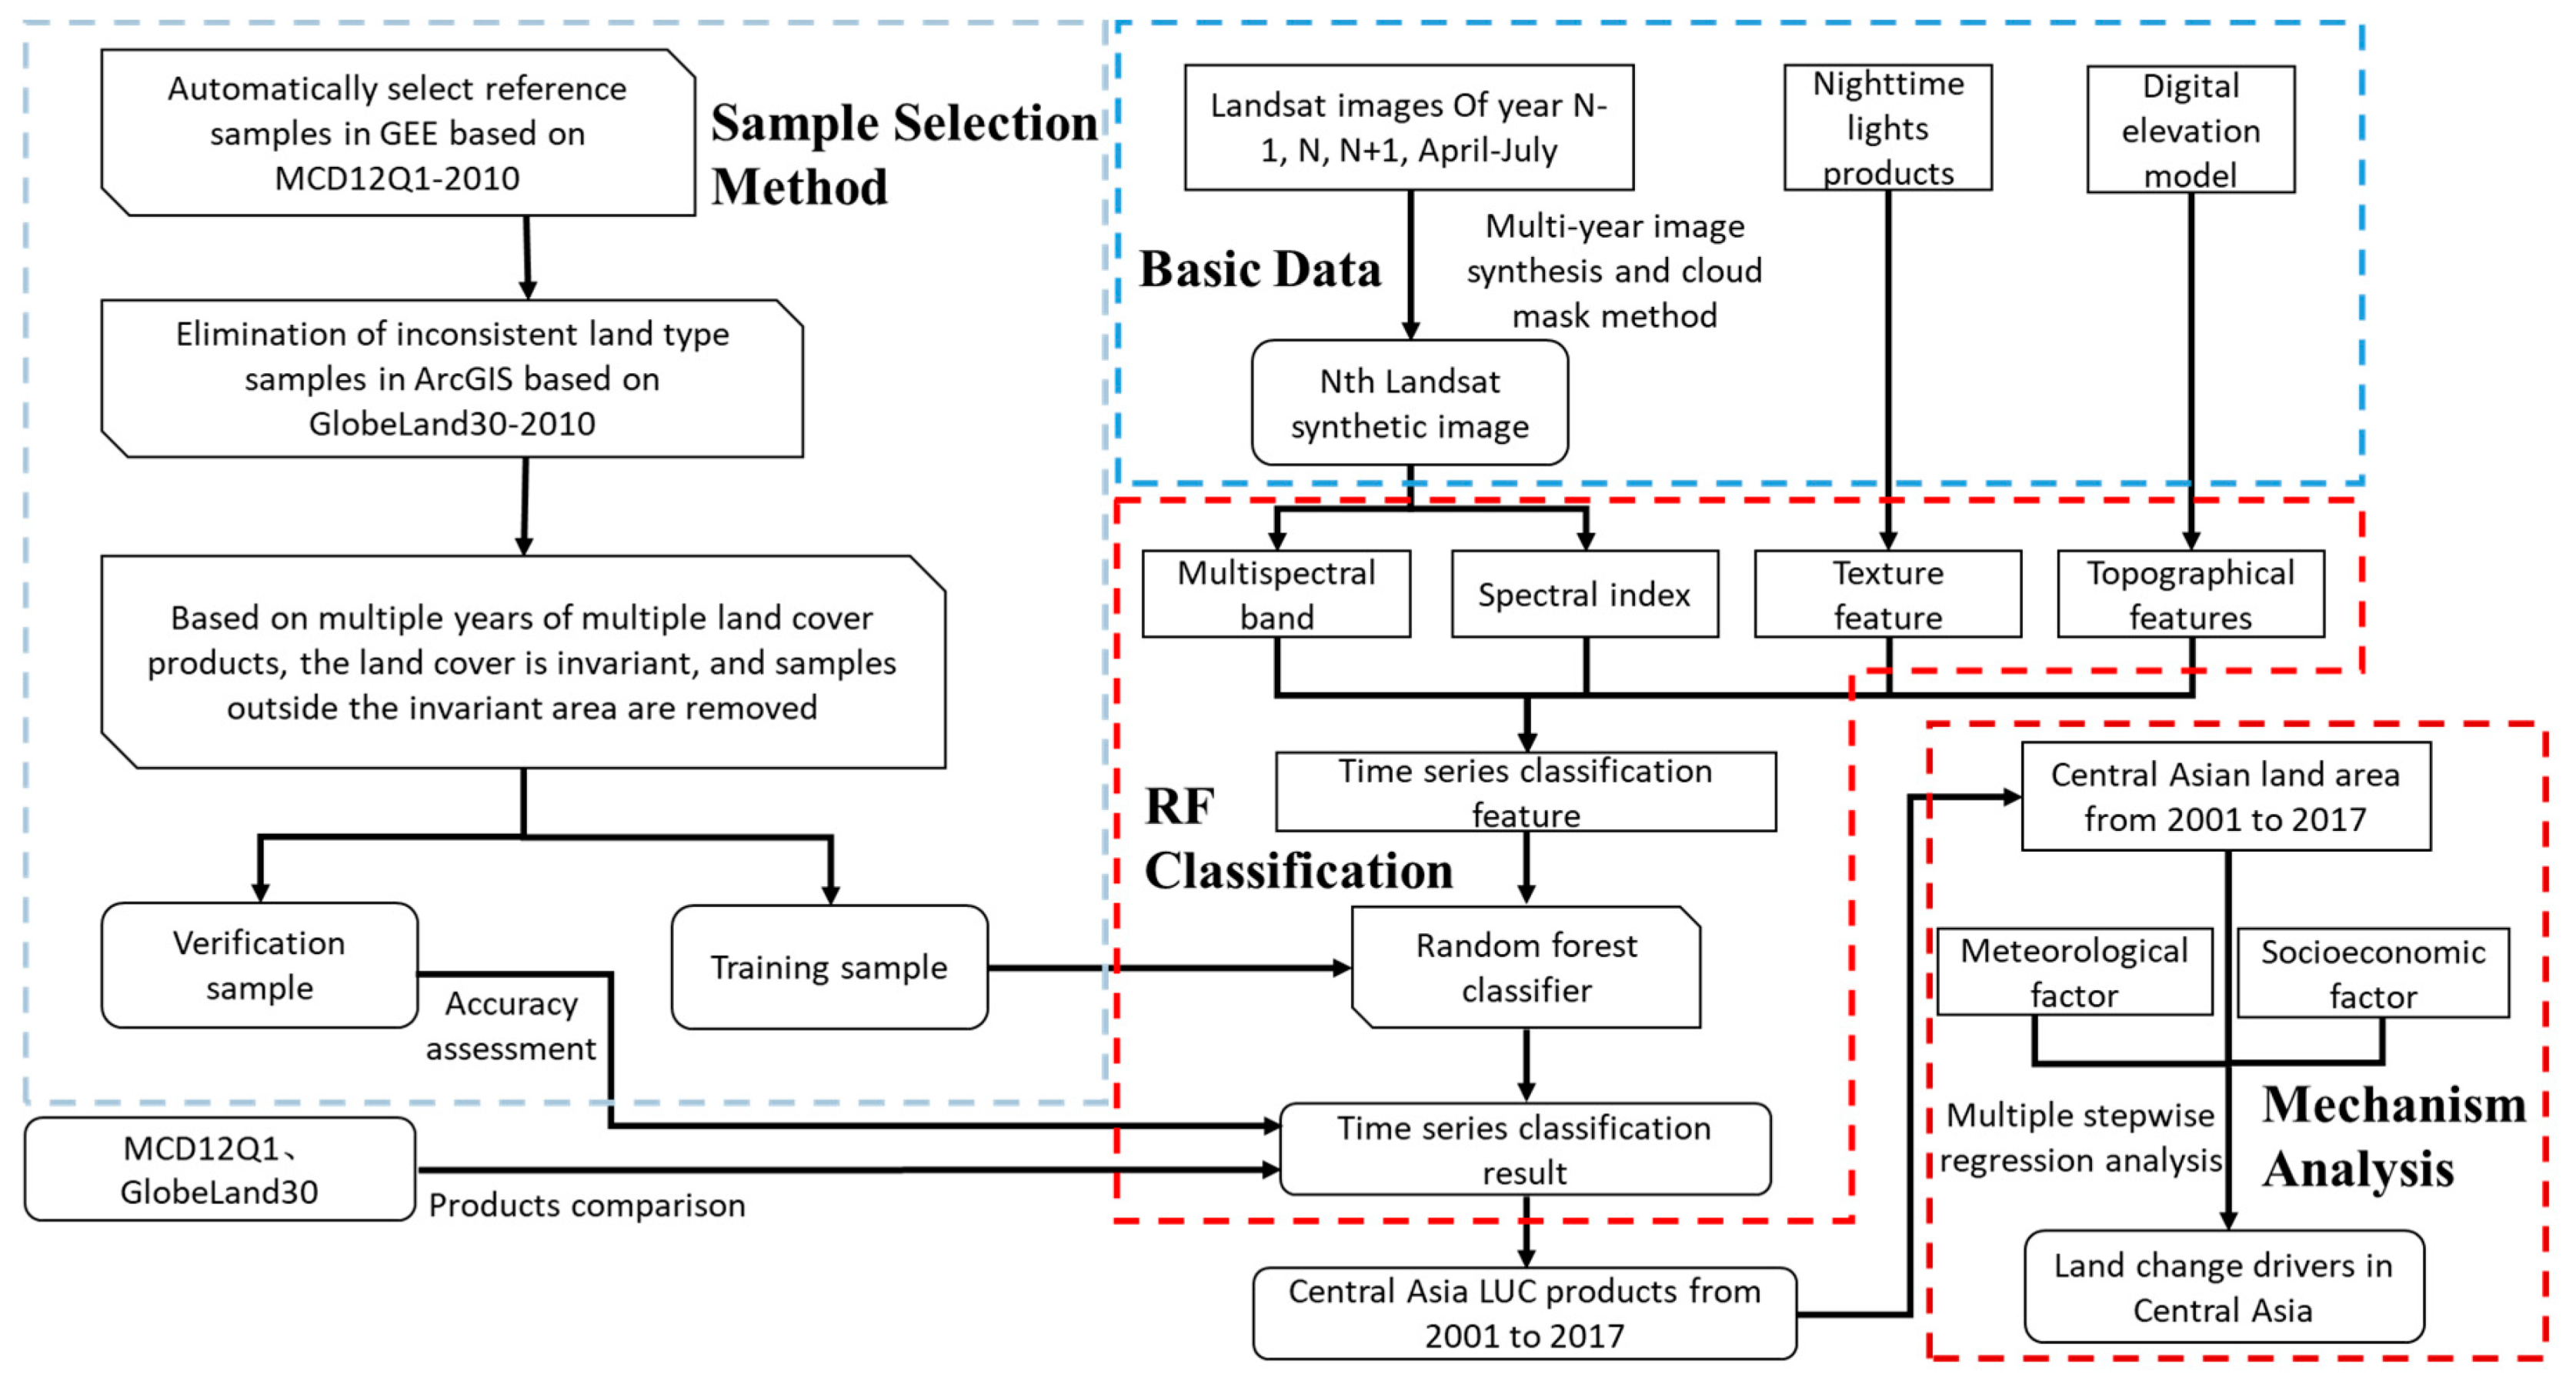
The technical process can be divided into 4 steps.
- With the support of the GEE, the multiyear image synthesis and cloud mask methods were applied to obtain the TOA composite data without cloud or shadow coverage each year from 2001 to 2017.
- With the support of multisource land cover products, training and verification samples were carefully deployed according to the “complete consistency” and “temporal stability” principles. Then, the land cover attributes were extracted for samples.
- The RF model training was applied based on Landsat satellite images and auxiliary data. The annual mapping of land cover in Central Asia was performed by applying the training rules.
- Based on analyses of climate change and economic and social development factors, the mechanisms of land cover change in the area were explored with multiple stepwise regression modeling.
The overall technical process is shown in Figure 2.
2.3.2. Satellite Imagery
The image synthesis and cloud mask methods were applied to generate cloud-free composite images for each year in the growing season [38]. The specific method is as follows. First, to eliminate image quality issues caused by the cloudy high mountains in the southern part of the study area and the cloudy and rainy hilly areas in the north, we used the TOA reflectance data from the summer (April–July) in each given year and the previous and subsequent years to replace and supplement the low-quality pixels, thus producing the best-available-pixel image composites. Then, the ee.Algorithms.Landsat.simpleCloudScore function was applied to obtain the cloud distribution probability score (0–100) for the images, and the image.updateMask function was adopted to remove cloudy regions with a score greater than 40. A median ee.Reducer function was then applied to the collection of images with unmasked pixels to “reduce” the image collection to a single output image representing the median of the images [20]. Finally, after the above steps, we obtained the 2001–2017 cloudless and shadowless TOA composite image dataset.
2.3.3. Training Point Selection
Supervised classification usually requires a certain number of training samples and verification samples. Typically, traditional research uses manual visual interpretation to obtain points. For a region with a large area and large geographical diversity, such a method presents considerable practical difficulties. This study proposes a new method to achieve highly credible sample points. The specific steps are as follows.
- Based on GlobeLand30, all land cover products, e.g., MCD12Q1, GlobCover2009, the GFCD, and the GFSSAD, were reclassified, and the land cover type in Central Asia was divided into 9 classes [39] (see Supplementary Material Tables S1 and S2).
- GlobeLand30 (2010), MCD12Q1 (2001–2013, 13 years), GlobCover2009, the GFCD (2000), and the GFSSAD (2000) were overlaid, and pixels with completely consistent land cover types that had not changed from 2001 to 2017 were selected. MCD12Q1, GlobCover2009, and GFSSAD were reduced to 30-m resolutions in the GEE using the reduceResolution function. GEE performs nearest neighbor resampling by default.
- Among the selected pixels, the training sample points and verification sample points were randomly selected, and the number of points was slightly adjusted according to the area ratios of the different land cover types.
Finally, we obtained 5016 reference sample points. The samples were generally distributed uniformly and randomly throughout the study area, but for some land types with relatively small and patchy areas (such as artificial surfaces, water bodies and wetlands), a relatively dense distribution occurred. In addition, we randomly selected 10% of the reference sample points, and we assessed the land cover classes through a visual interpretation of the high-resolution imagery available from Google Earth. Finally, we found that the classification accuracy of the selected sample points was 95.8% (see Supplementary Material Table S3). The sample library we obtained can be used for classification training and verification.
2.3.4. Land Mapping and Validation
When a sample is entered into the RF model, each decision tree performs a separate assessment to determine the category that the sample should belong to, and the category that is most frequently selected is ultimately considered the sample category. The RF method can effectively reduce the uncertainty of a particular algorithm and improve the accuracy of discriminant classification. The information dimension of RF processing is larger and more complex than that of other classification algorithms.
In this study, the data input into the RF model included the full range of Landsat bands (bands B1-B7 for Landsat 5/7 and B1-B7, B10, and B11 for Landsat 8), NDVI, NDWI, SRTM products, DMSP/OLS, and NPP/VIIRS. Among them, the NDVI and NDWI were calculated using the bands of each image before synthesis, and a median ee.Reducer function which was introduced in Section 2.3.2 was then performed to obtain the NDVI and NDWI bands. During the study, we found that the classification accuracy of the full-band combination was the highest when comparing different band combinations. Additionally, we found that the SRTM products improved the overall accuracy by 3–5% and nighttime data significantly improved the classification accuracy of artificial surfaces by 10–20%. The number of decision trees was set to 500 using 80% of all samples, i.e., 4012 samples were used to train the RF model.
For the output, we performed an accuracy assessment based on reference samples and a consistency assessment based on multisource land cover products. The sample-based accuracy evaluation was based on previously randomly distributed verification samples, and a series of accuracy indices for each year was obtained by constructing a confusion matrix. By referring to the original satellite image and applying the multisource land cover product comparison method, the ability of different land products to identify the typical land types was assessed. The degree of consistency among land cover types was calculated for each pixel [39].
2.3.5. Multiple Stepwise Regression
The multiple stepwise regression analysis method was used to identify key factors, and the contributions of these factors were determined by repeated iterative regression analysis and significance testing after the driving factors were determined. The method ensures that the resulting factors are both important and noncollinear. We used the annual area of land cover as the dependent variable and conducted multiple stepwise regression analysis with the annual socioeconomic factors and climatic factors as independent variables. The multiple regression model is as follows:
where represent correlation coefficients and β is a constant term.
In this study, the year-to-year response of the annual areas of the three types of land (water bodies and wetlands, natural vegetation, and grasslands) to all three environmental explanatory variables (annual average temperature, average precipitation and annual average PDSI) was assessed by multiple linear regression analysis. Similarly, the year-to-year response of the annual area of artificial surfaces to socioeconomic factors (gross domestic product (GDP), added value of secondary industry (IAV2), added value of tertiary industry (IAV3), total population (TP), urban population (UP), and urbanization rate (UR)) was assessed. The year-to-year response of the annual area of cultivated land to socioeconomic factors (TP and rural population (RP)) and all three environmental explanatory variables (annual average temperature, average precipitation and annual average PDSI) was assessed.
In order to understand the driving mechanism inside different regions, we separately analyzed the driving mechanism of five different regions, including the southern and northern regions of the study area, the five Central Asian countries, Xinjiang, China, and the entire study area. Based on the annual area of land cover of these five regions as the dependent variable, the impact factors corresponding to the land cover types described above were used as independent variables to carry out multiple stepwise linear regression analysis. After removing the factors that were not significantly related, the main factors driving changes in land cover of each region were obtained.
3. Results
3.1. Quality Assessment
The overall accuracy of the land cover dataset for Central Asia from 2001–2017 was 0.90 ± 0.01, and the kappa coefficient was 0.87 ± 0.01. Further analysis showed that (Table 2) forests, water bodies, permanent snow and ice, grassland and bareland exhibited higher classification accuracy than other land cover types, and the user’s accuracy (UA) and producer’s accuracy (PA) values were above 0.90. The accuracy was low for shrubland and artificial surfaces, with a UA of 0.63 ± 0.09 and PA of 0.77 ± 0.07. Moreover, cultivated land displayed intermediate accuracy values, with a UA of 0.83 ± 0.03 and a PA of 0.85 ± 0.03. There were many cases in which shrubland was incorrectly classified as grassland, bareland and cultivated land and in which artificial surfaces were incorrectly classified as cultivated land and grassland.
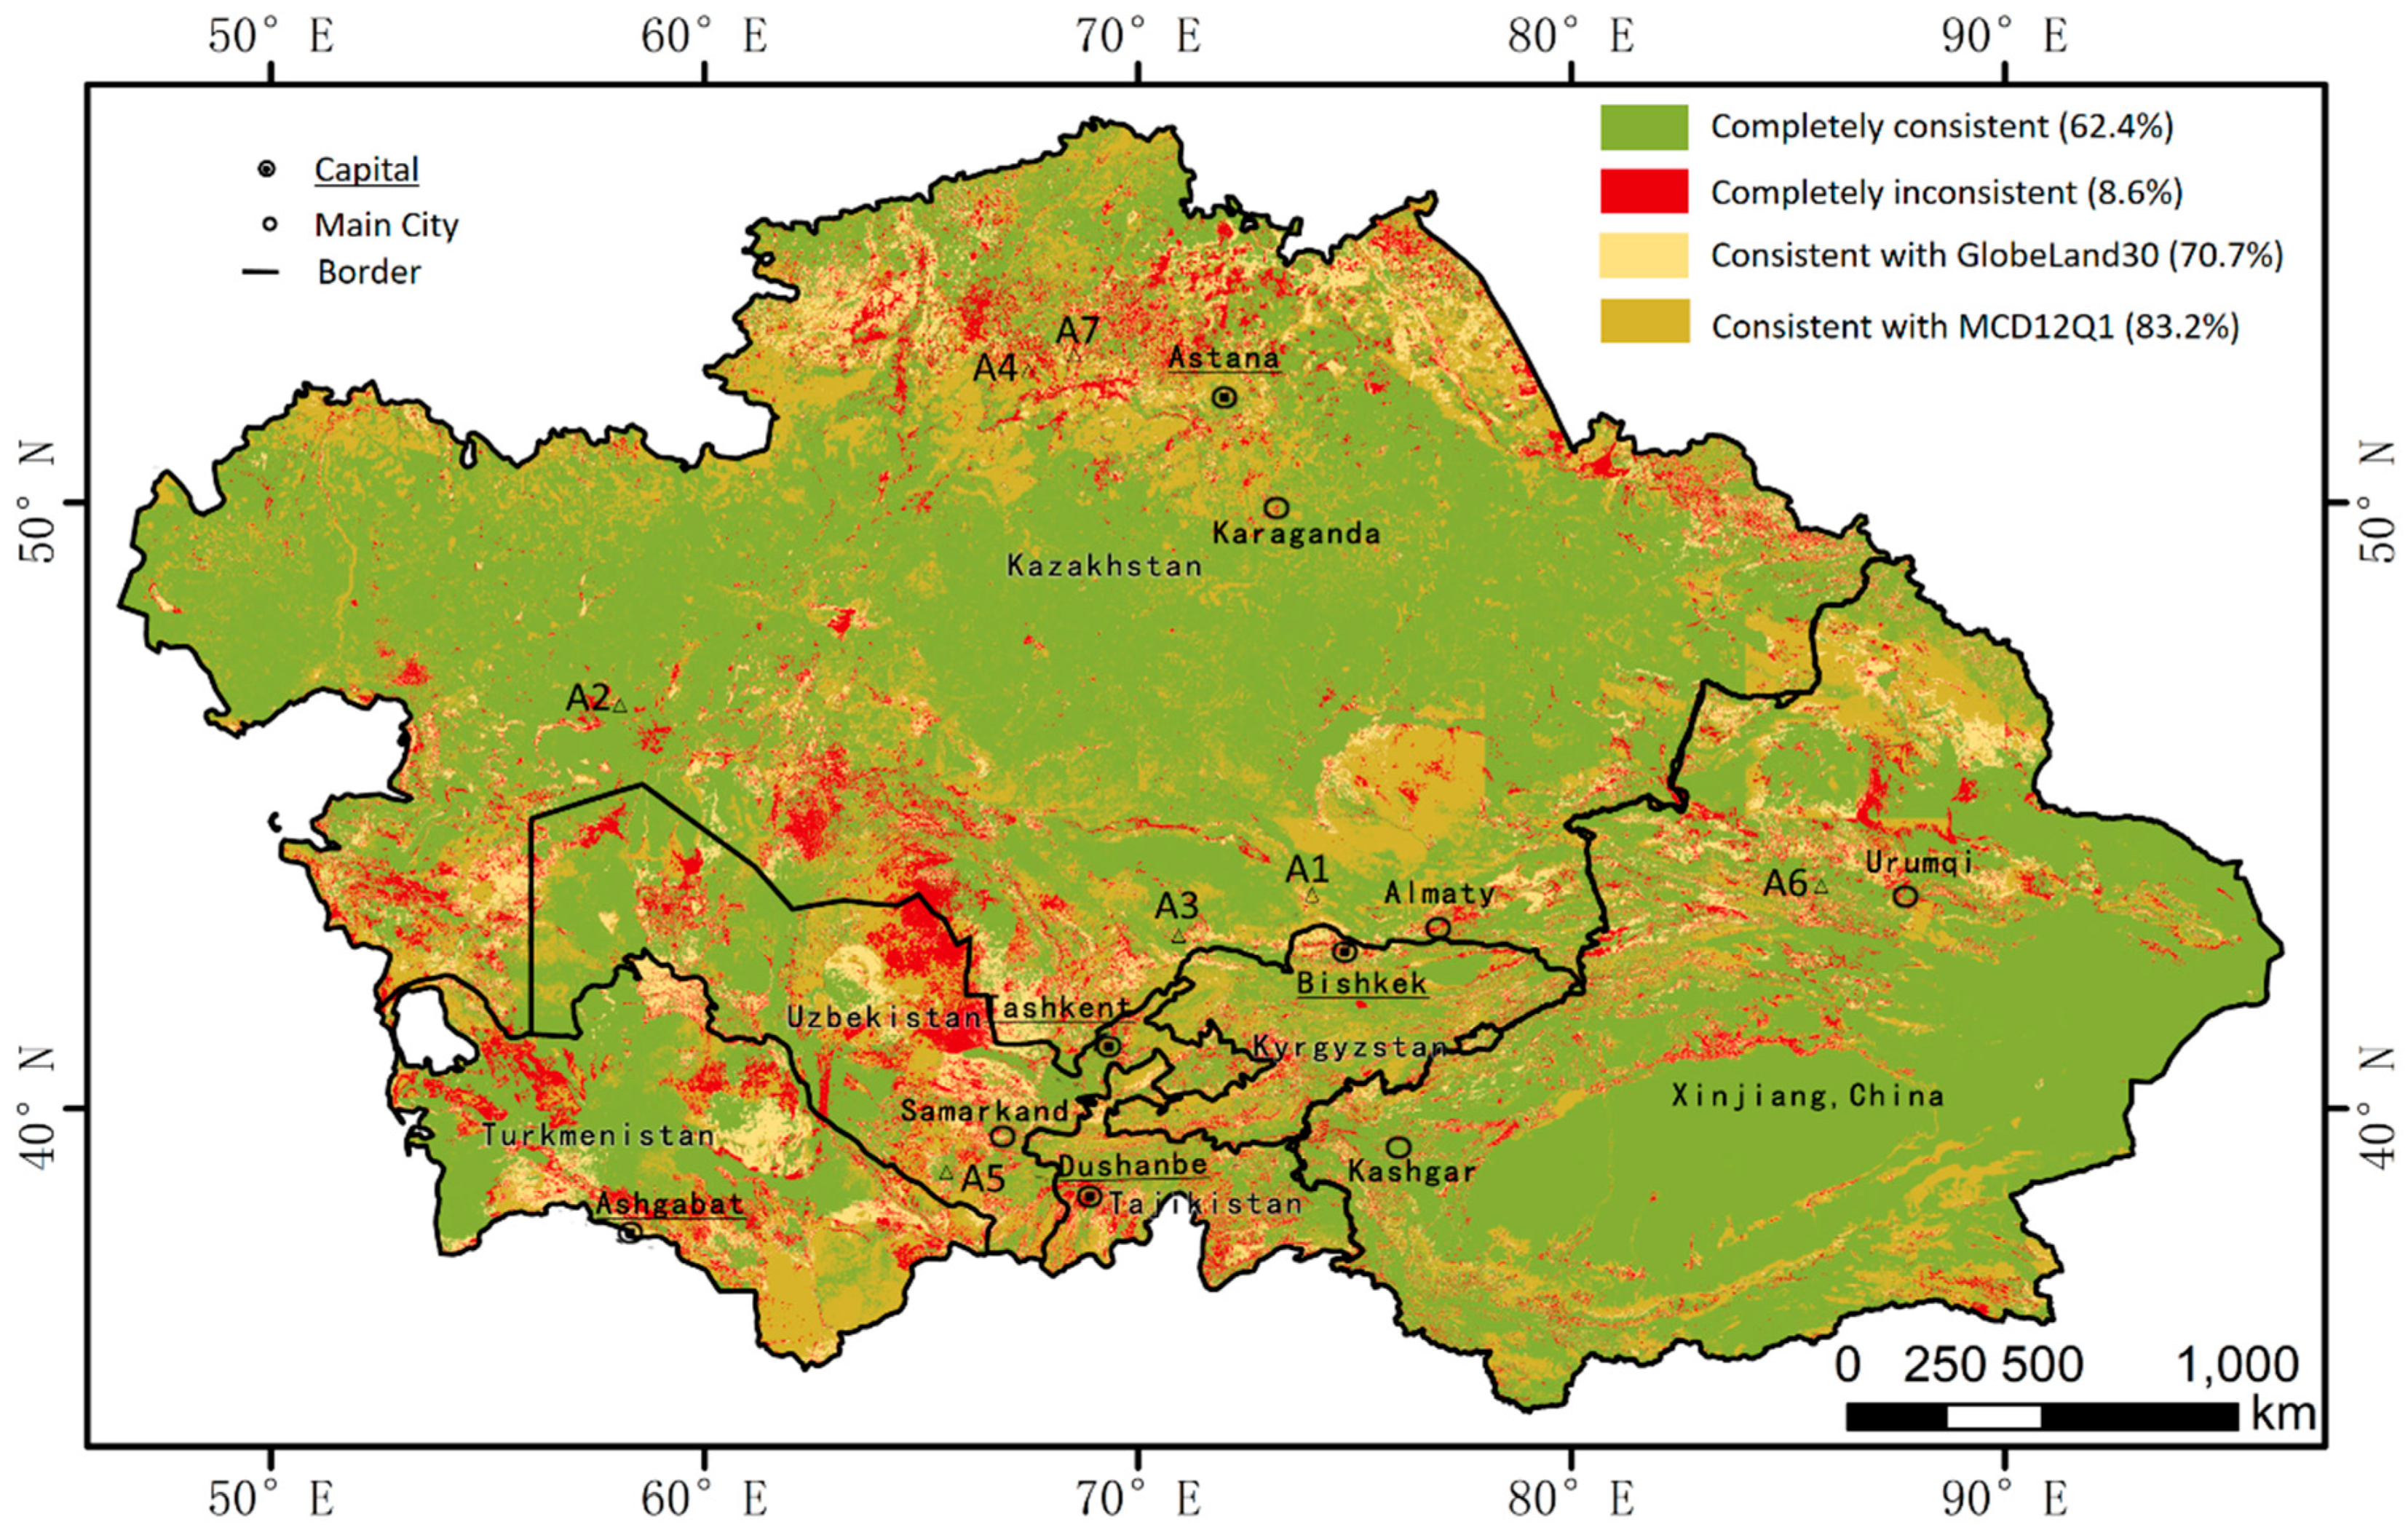
The overall distribution patterns of land cover from the products obtained in this study in 2010, GlobeLand30_2010 and MCD12Q1 products in 2010 were generally consistent. However, because the basic imagery source of this research was Landsat images with a 30 m resolution, the results of this study were finer and smoother than the results of MCD12Q1. In the present study, 83.2% of the pixels in the 2010 product were consistent with MCD12Q1, and 70.7% of the pixels were consistent with GlobeLand30. From a spatial perspective (Figure 3), in the central and southeastern portions of the study area (mainly grassland and bareland), the three products were highly consistent (all three products have the same pixel attribute definition); the points in these regions comprised 62.4% of the total number of points. The consistency was poorest in the northern hilly region, the eastern and southern Altai Mountains, the Tianshan Mountains, and the southwestern region (the three products defined completely different pixel attributes), and fortunately, the number of pixels with the lowest consistency was very small, accounting for only 8.6% of all points.
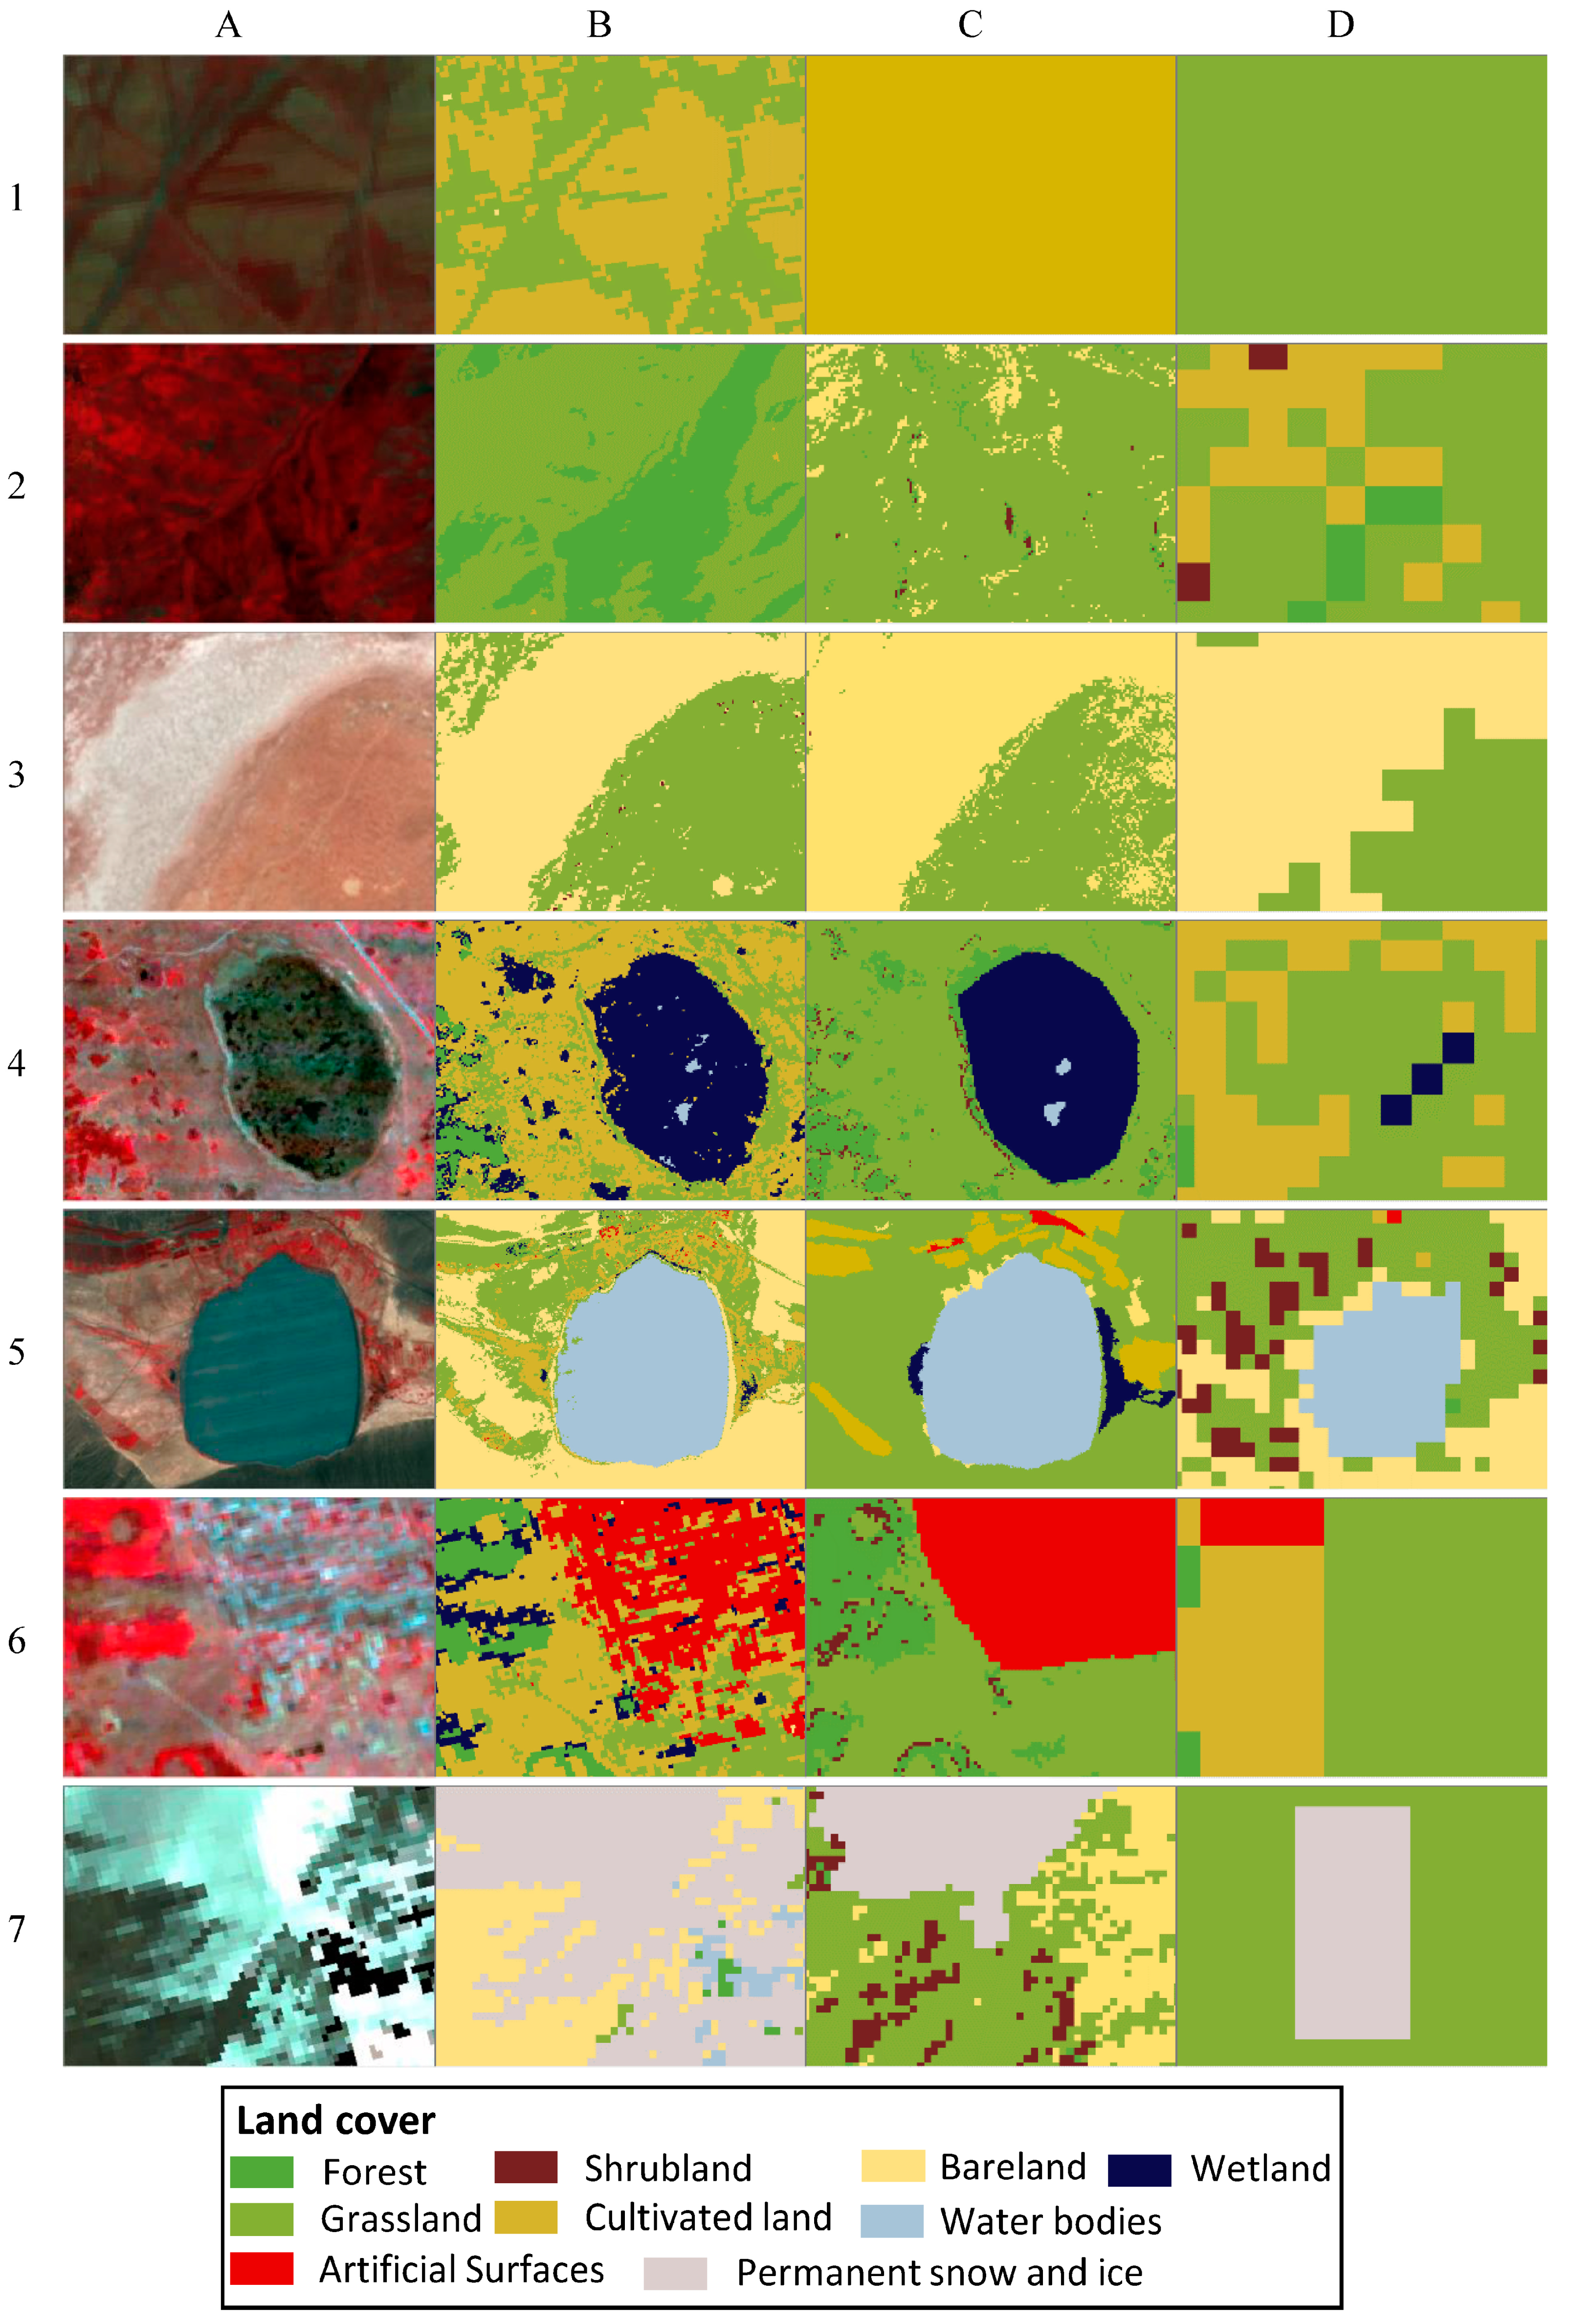
Based on the Landsat annual TOA composite data, the product obtained in this study and the GlobeLand30 and MCD12Q1 products (A, B, C, and D), we selected 7 typical land types (from 1 to 7, cultivated land, forests, grassland, bareland, wetland, water bodies, artificial surfaces, and permanent snow and ice) (Figure 3) to conduct an intuitive comparison (Figure 4). In general, the land cover products obtained in this paper (Figure 4, series B) largely reflected the true land type in the satellite image (Figure 4, series A). The land cover classification quality was better than that of the MODIS product (Figure 4, series D) and roughly equivalent to that of the GlobeLand30 product (Figure 4, series C) but superior to the GlobeLand30 product in land transition areas.
3.2. Spatial Distribution of Land Cover
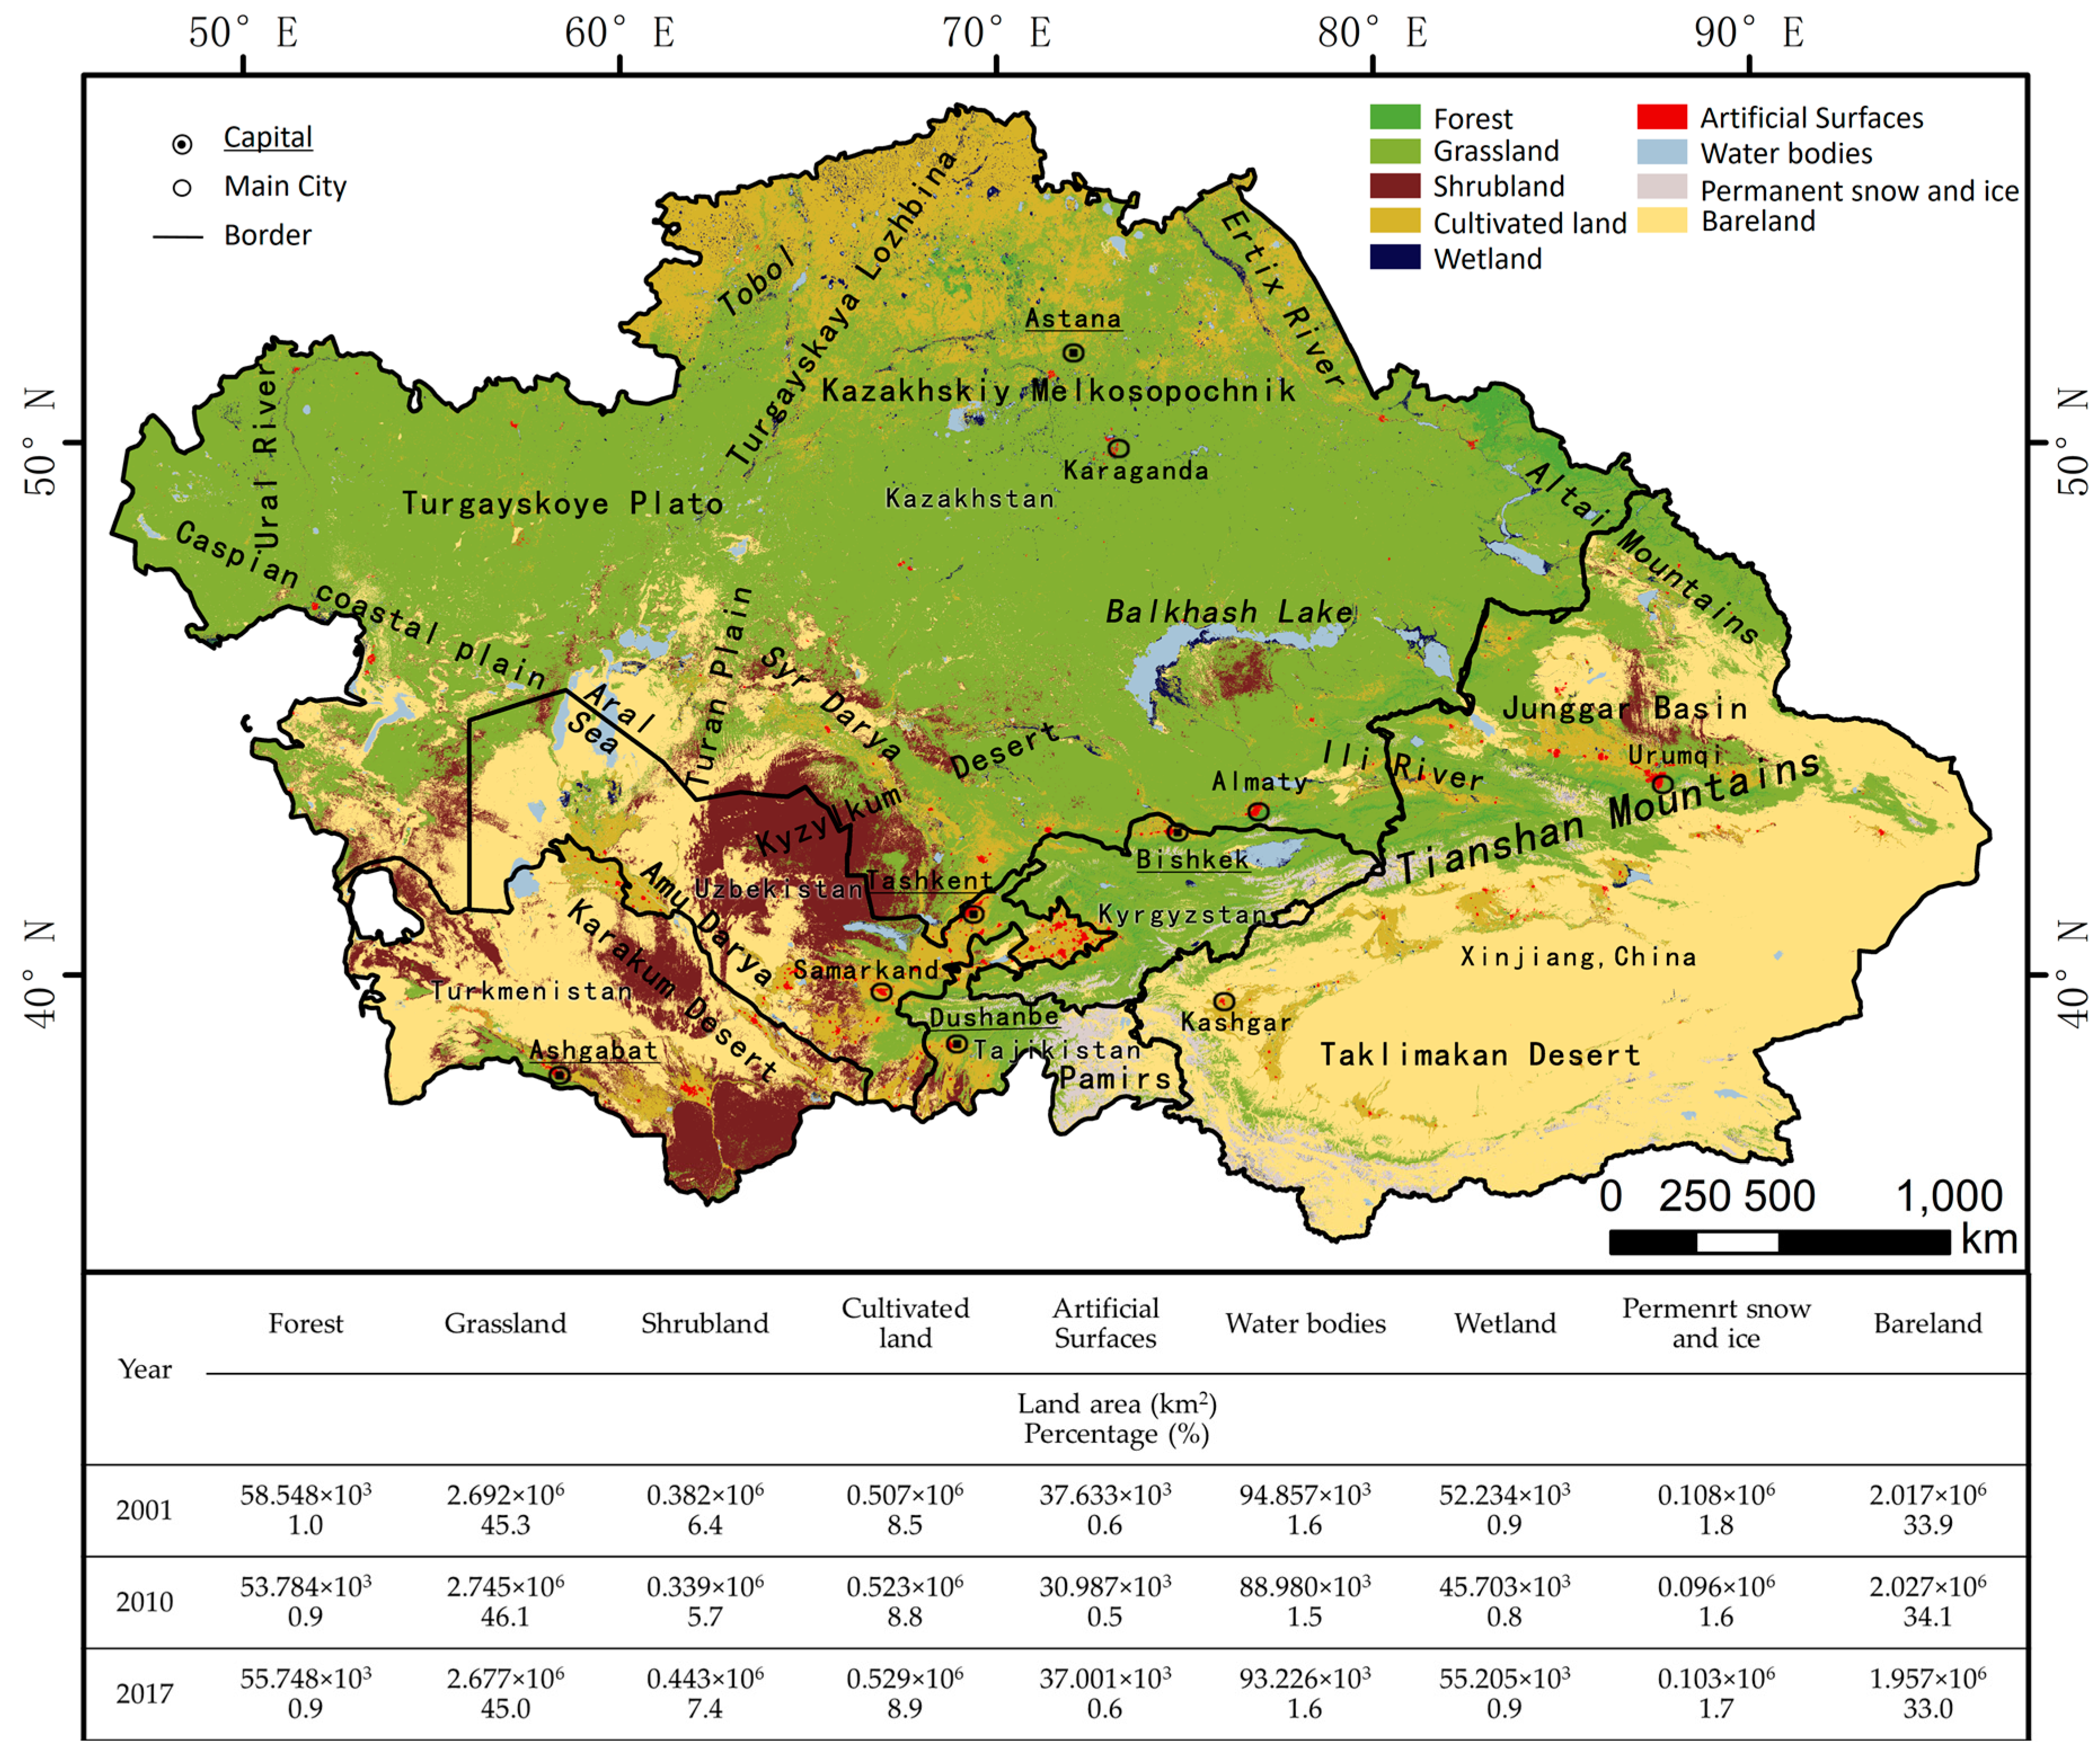
In 2017, grassland and bareland were the main land cover types in Central Asia, and the combined area of these two regions accounted for more than 77.9% of the total area (Figure 5). Grassland had the widest distribution, with an area of 2.677 × 10⁶ km2, accounting for 45.0% of the total area; bareland was also widely distributed, with an area of 1.957 × 10⁶ km2, accounting for 32.9% of the total area. The next most common land types were cultivated land, shrubland, permanent snow and ice, water bodies, wetlands and forests, and the areas and percentages of these land types were 0.529 × 10⁶ km2 (8.9%), 0.443 × 10⁶ km2 (7.4%), 0.103 × 10⁶ km2 (1.7%), 93.2 × 10³ km2 (1.6%), 55.2 × 10³ km2 (0.9%) and 55.7 × 10³ km2 (0.9%), respectively. The land area of artificial surfaces was the smallest, with a value of only 37.0 × 10³ km2, accounting for 0.6% of the total area.
Grassland was mainly distributed in the central and northern Kazakh plains. Bareland was generally observed in deserts and sandy areas, which were mainly distributed in the eastern and southern parts of the study area, specifically in the southern Karakum Desert, Kyzylkum Desert and the Taklimakan Desert in the east. Cultivated land was mainly distributed in the north and east, and shrubland was mainly distributed in the central and southwestern parts of the study area. Water bodies and wetlands, such as lakes and rivers, were mainly distributed in the central inflow area (Balkhash Lake) and the western area (Caspian Sea and Aral Sea) of the study region. Permanent snow and ice were mainly distributed in the southern Pamirs, the Altai Mountains in the northeast, and the Tianshan Mountains and the Kunlun Mountains on the northern edge of the Qinghai-Tibet Plateau. Forests were distributed below the alpine snow line. Artificial surfaces were scattered throughout the study area; notably, Kazakhstan had the largest artificial surface area, accounting for 34.1% of the artificial surface area of the entire study region.
From the perspective of countries or regions, most areas in Kazakhstan were grassland and cultivated land. Grassland accounted for 72.5% of the national land area, and cultivated land accounted for 11.0% of the land area. Uzbekistan mainly consisted of bareland and shrubland, which accounted for 37.6% and 27.3% of the total national land area, respectively. In addition, there was a large number of inland rivers in Uzbekistan, accounting for 2.8% of the land area of the country. Turkmenistan mainly consisted of bareland and shrubland. Eighty percent of the territory was occupied by the Karakum Desert, and bareland and shrubland accounted for 52.9% and 33.1% of the national land area, respectively. Kyrgyzstan mainly consisted of grassland and bareland, which accounted for 71.7% and 7.1% of the land area of the country, respectively. There were more mountains and snow in Kyrgyzstan than in the other countries, as these land cover types accounted for 8.6% of the national land area. The land cover types in Tajikistan and Kyrgyzstan were similar, with grassland, bareland and permanent snow and ice accounting for 36.1%, 22.6% and 21.9% of the national land area, respectively. Xinjiang, China, was dominated by bareland and grassland, with the largest desert, i.e., the Taklimakan Desert, in Central Asia. Bareland and grassland accounted for 69.5% and 19.8% of the total area in Xinjiang, respectively.
3.3. Spatial-Temporal Changes in Land Cover
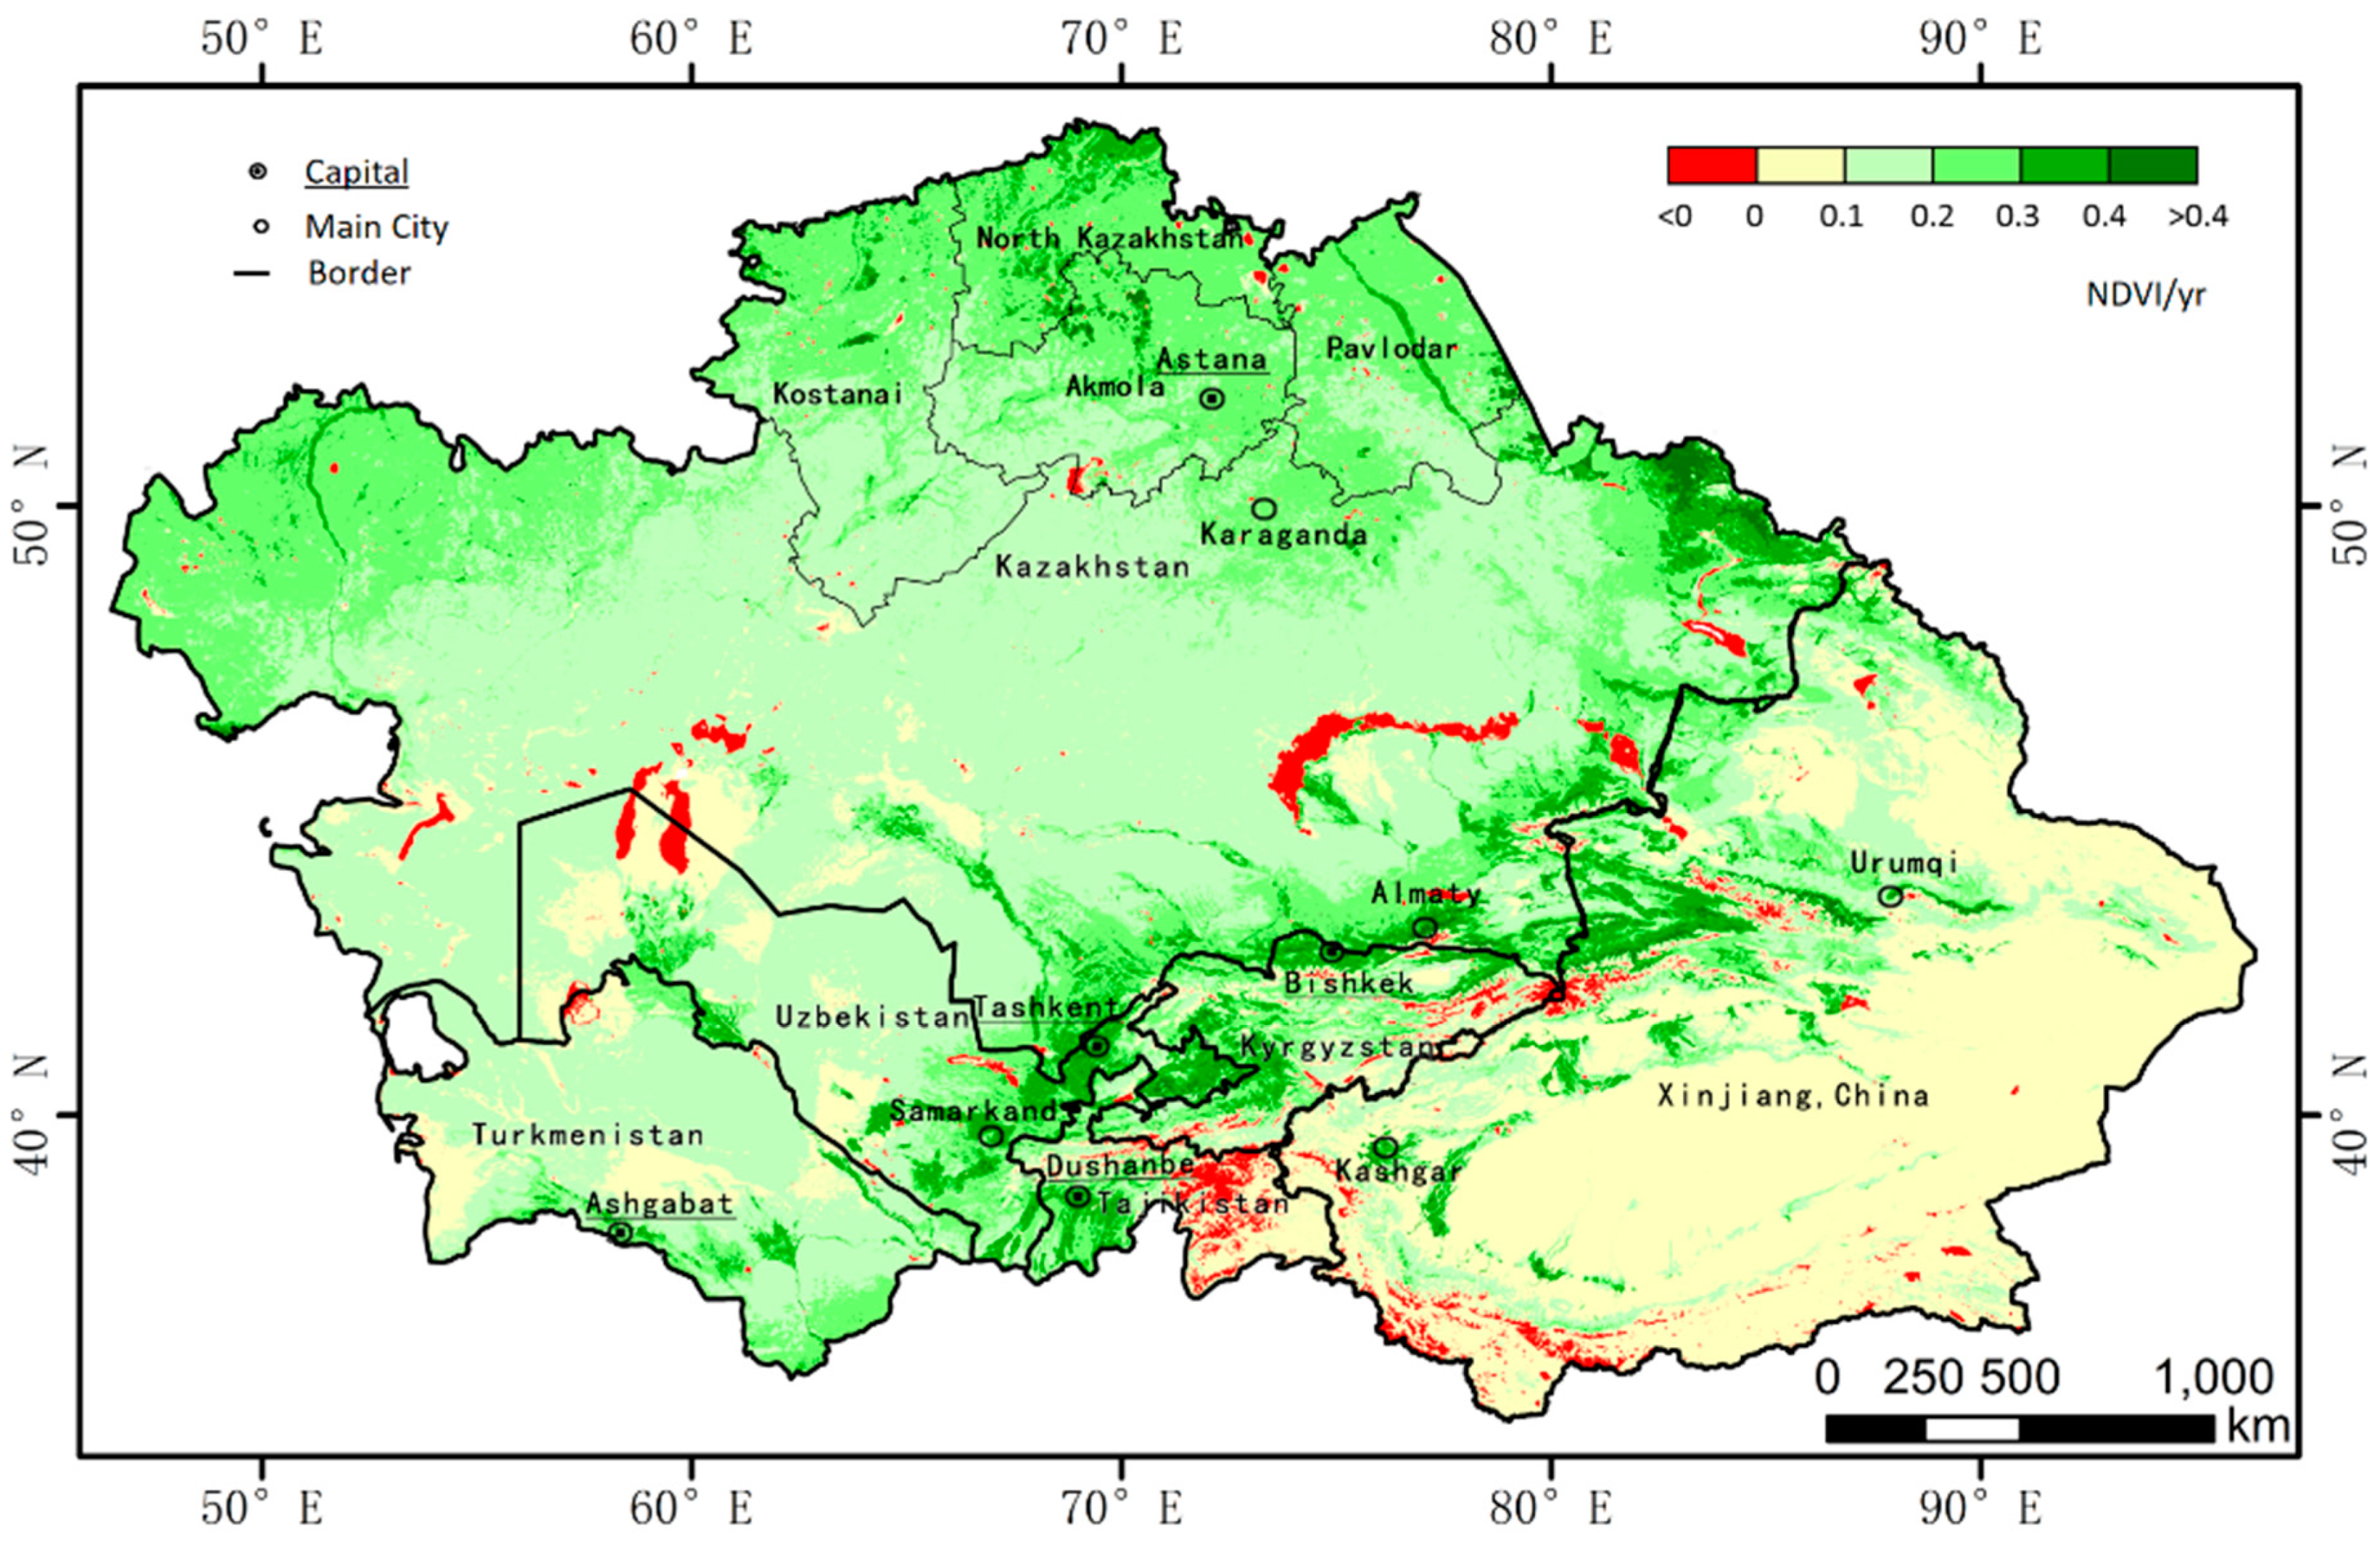
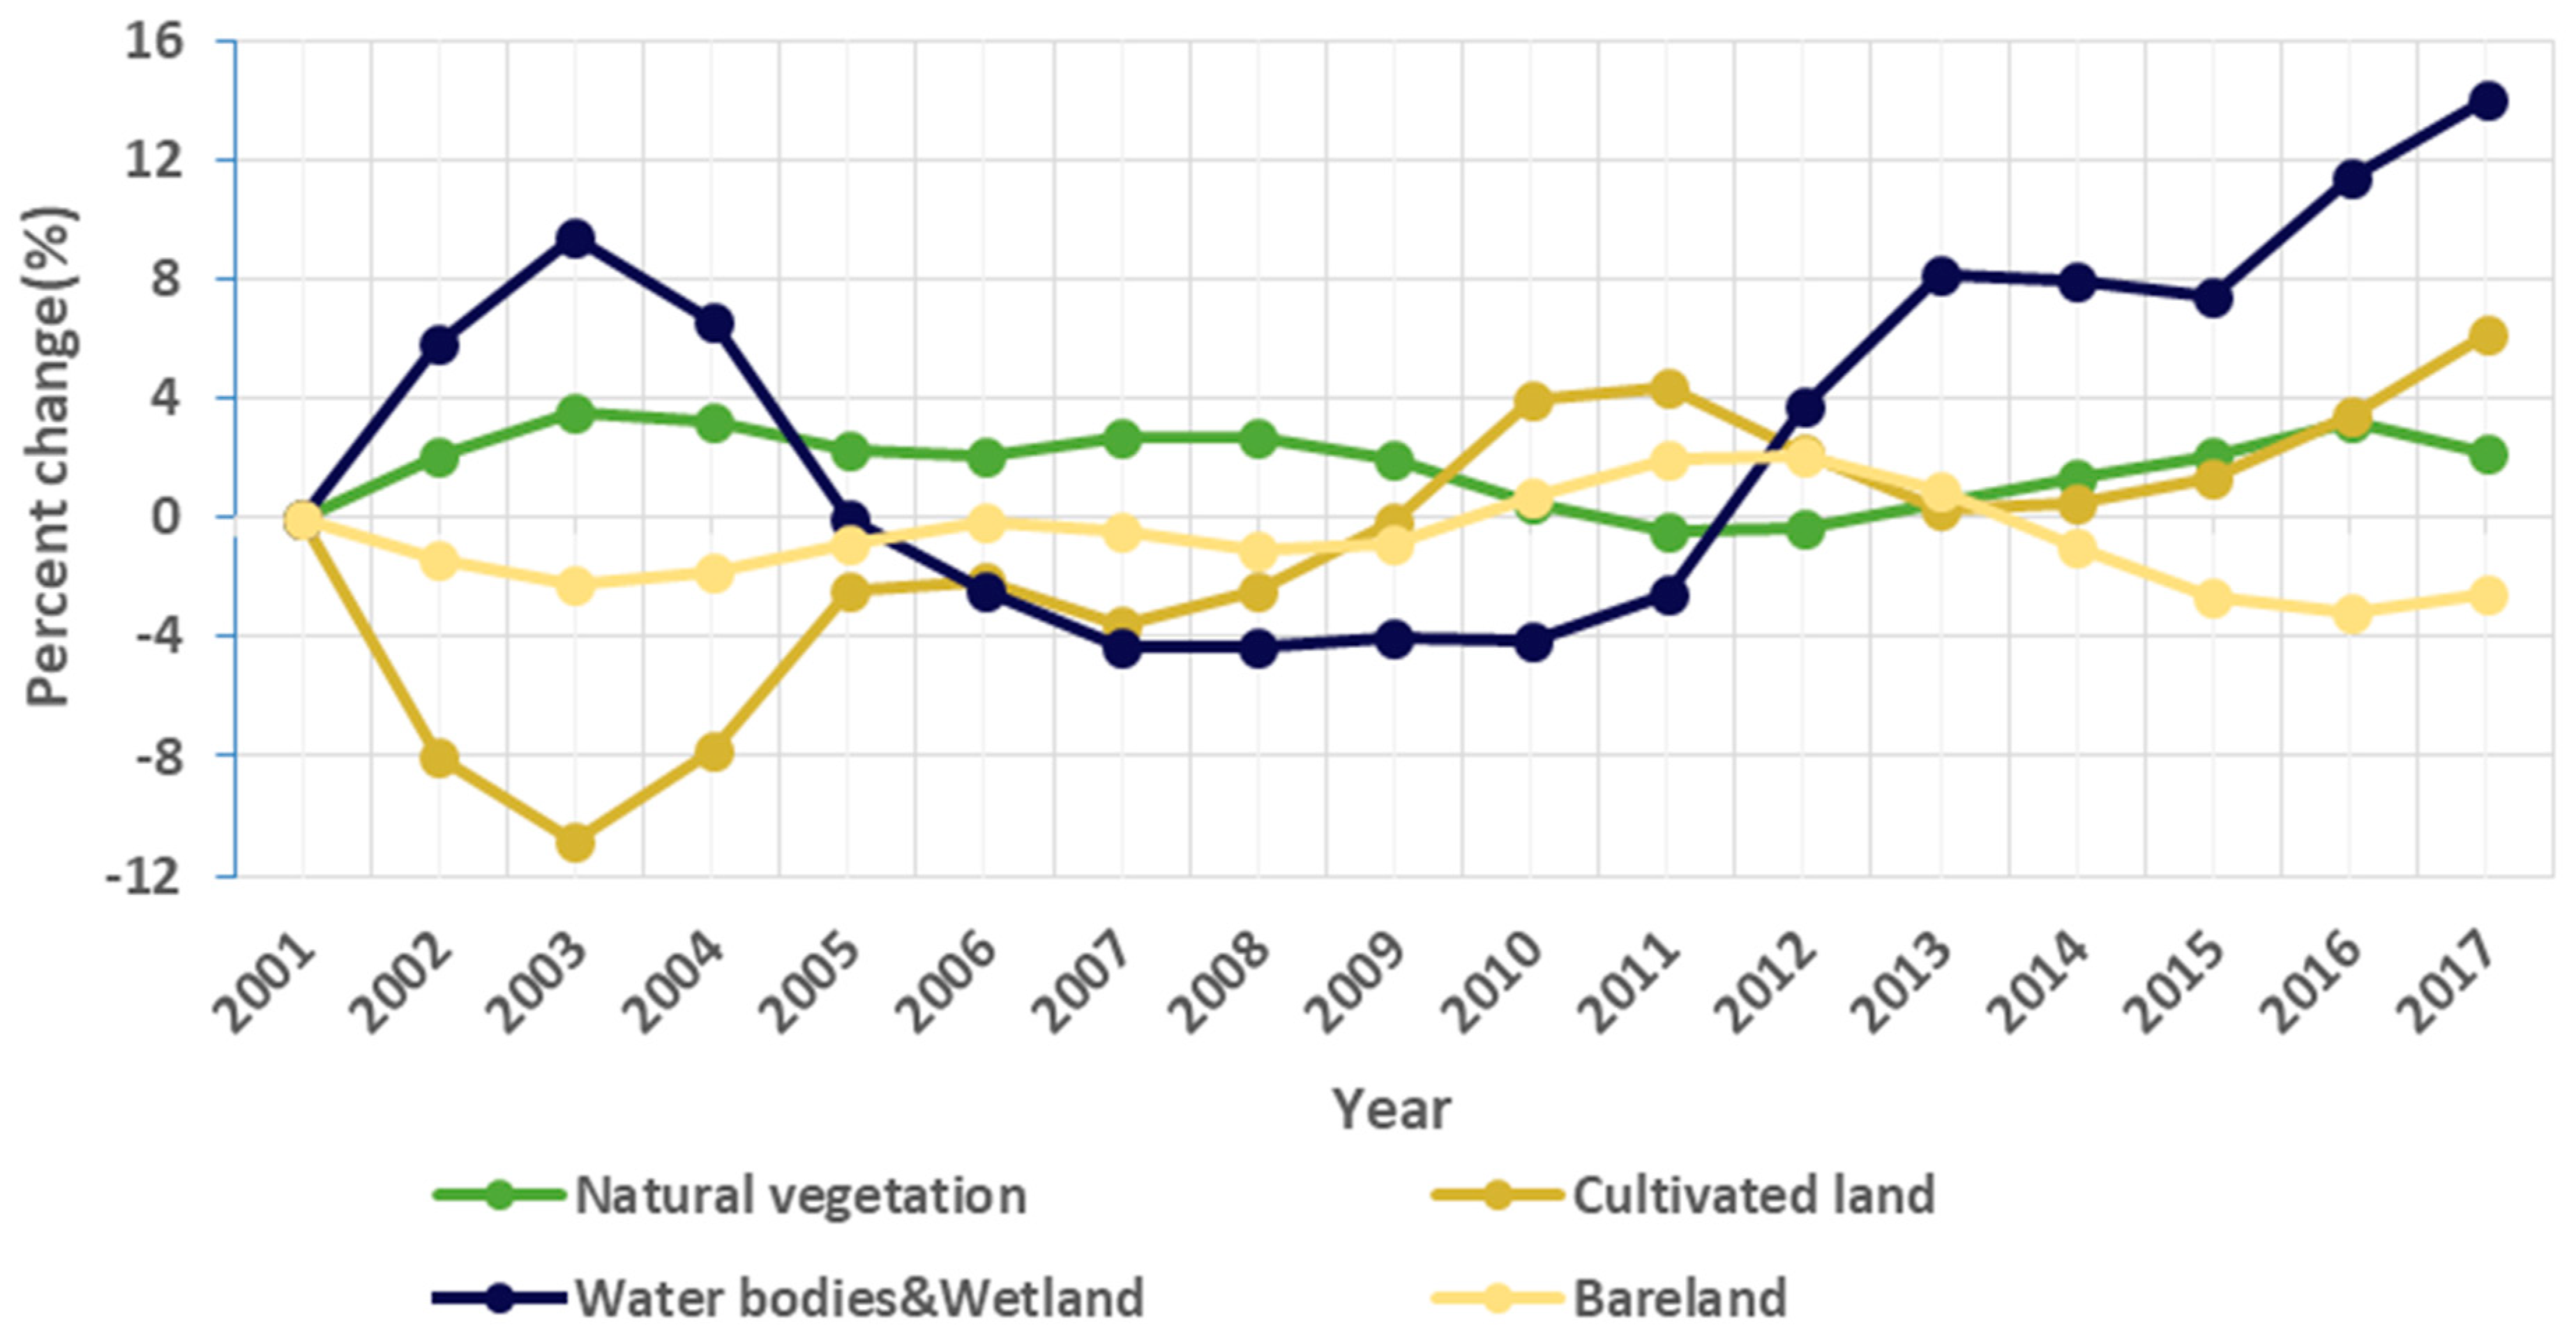
During the period from 2001–2017, as indicated by the changes in the NDVI (Figure 6), the regional greenness improved significantly. Especially in the mountainous areas of northern Kazakhstan, the Altai Mountains and the Tianshan Mountains, the vegetation index values of terrestrial ecosystems displayed a significant upward trend. From the perspective of land cover type conversion, the study area generally exhibited a decrease in bareland and increases in natural vegetation, cultivated land, water bodies and wetlands. The bareland area decreased by 2.6%, and the water body and wetland areas increased by 14.0%, the cultivated land area increased by 6.1%, and the natural vegetation area increased by 2.2% (Figure 7).
As shown by the year-by-year change in area (Figure 7), the change in natural vegetation was relatively stable. Except for the area reductions in 2011 and 2012, the area increased relative to that in 2001, and the growth rate fluctuated between 0 and 4%. Notably, 2003 and 2016 were two peak growth points, reaching 3.6% and 3.2%, respectively.
The change in cultivated land fluctuated greatly. Compared with the area in 2001, the area decreased the most in 2003, with a change of 10.8%. Then, the area gradually increased until 2011. After a decrease between 2011 and 2013, the area began to increase again. In 2017, the area increased the most, reaching 6.1%.
The fluctuations in water bodies and wetland were also considerable. Compared with the area in 2001, there were two peak growth points in 2003 and 2017, reaching 9.4% and 14.0%, respectively. The growth rate from 2006 to 2011 was relatively stable.
Compared with 2001 and contrary to the trend of natural vegetation, bareland area decreased during 2001–2003, 2006–2008, and 2012–2017, while increasing during the other periods. The growth rate fluctuated between −4% and 4%, and maximum decreases were observed in 2003 and 2016, reaching −2.3% and −3.2%, respectively.
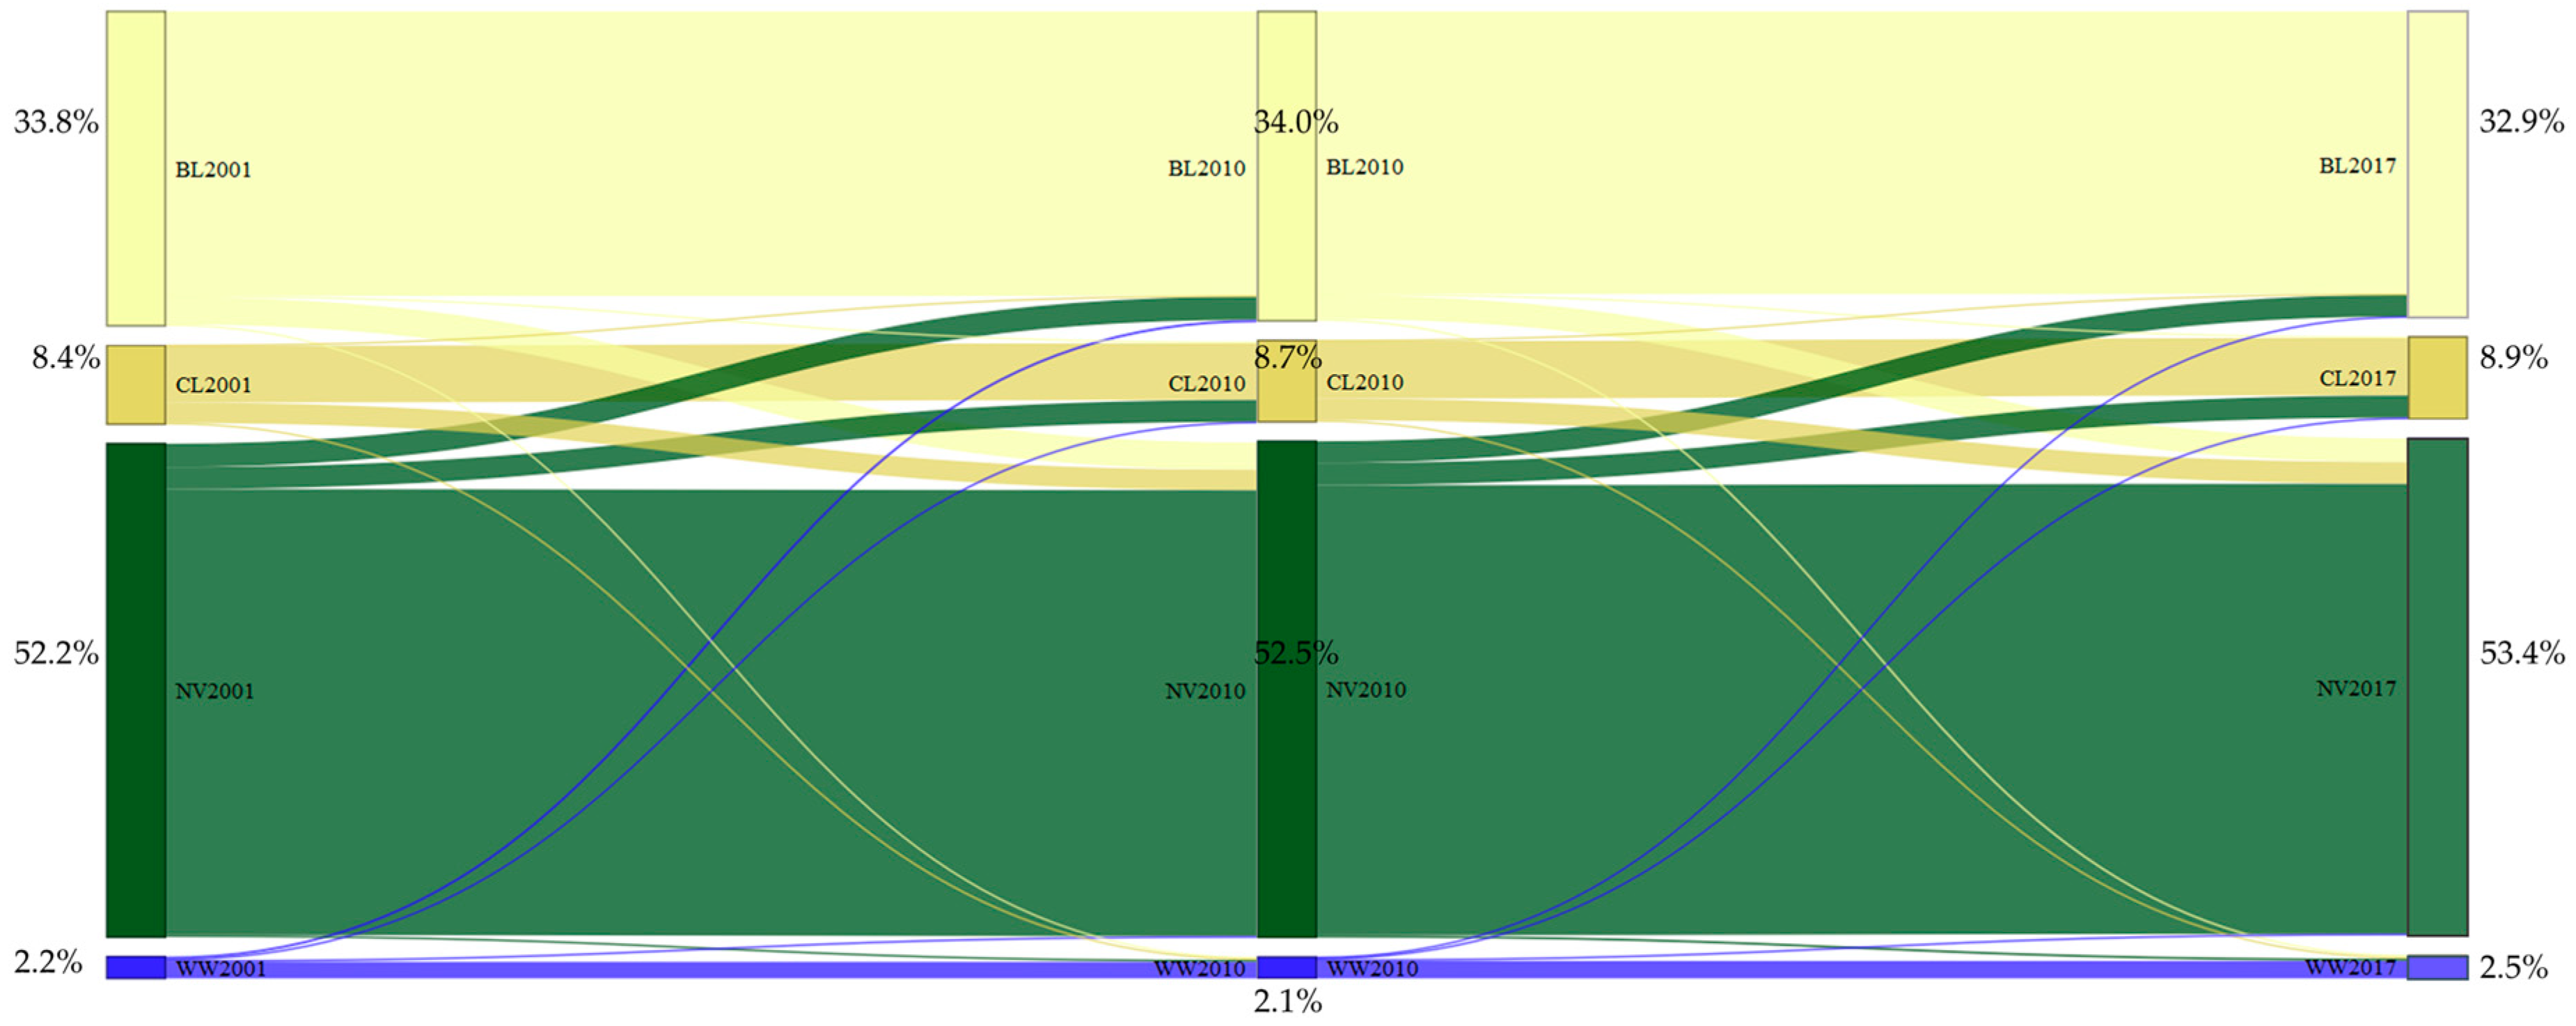
From the perspective of land use change, Figure 8 shows the land use change between 2001, 2010 and 2017. For natural vegetation, during the period of 2001–2010, 4.4% (136.741 × 10³ km2) of natural vegetation was converted into cultivated land, 0.4% (12.431 × 10³ km2) of natural vegetation was converted into water bodies or wetland, and 4.7% (146.064 × 10³ km2) of natural vegetation degraded to bareland. During the period from 2010–2017, 4.5% (140.540 × 10³ km2) of natural vegetation was converted into cultivated land, 0.4% (12.924 × 10³ km2) of natural vegetation was converted into water bodies or wetland, and 4.4% (137.417 × 10³ km2) of natural vegetation degraded to bareland.
For cultivated land, during the period of 2001–2010, 25.8% (128.570 × 10³ km2) of cultivated land was converted into natural vegetation, 1.6% (7.973 × 10³ km2) of cultivated land was converted into water bodies or wetland, and 0.6% (2.990 × 10³ km2) of cultivated land transformed into bareland. From 2010–2017, 26.5% (137.245 × 10³ km2) of cultivated land was converted into natural vegetation, 1.9% (9.840 × 10³ km2) of cultivated land was converted into water or wetland, and 0.9% (4.661 × 10³ km2) of cultivated land lost fertility and became bareland.
For water bodies and wetland, during the period from 2001–2010, 6.5% (8.462 × 10³ km2) of water bodies and wetland were converted into natural vegetation, 5.3% (6.900 × 10³ km2) of water bodies and wetland were cultivated, and 11.3% (14.710 × 10³ km2) of water bodies and wetland dried up and became bareland. During the period of 2010–2017, 6.5% (8.109 × 10³ km2) of water bodies and wetland were converted into natural vegetation, 6.8% (8.483 × 10³ km2) of water bodies and wetland were cultivated, and 4.0% (4.990 × 10³ km2) of water bodies and wetland were transformed into bareland.
Additionally, from 2001–2010, 8.6% (172.709 × 10³ km2) of bareland grew natural vegetation, only 0.4% (8.032 × 10³ km2) of bareland was reclaimed as cultivated land, and 0.4% (8.032 × 10³ km2) of bareland was converted into water bodies or wetland. During the period of 2010–2017, 7.6% (153.703 × 10³ km2) of bareland grew natural vegetation, only 0.3% (6.067 × 10³ km2) of bareland was reclaimed as cultivated land, and 0.6% (12.134 × 10³ km2) of bareland was converted into water bodies or wetland.
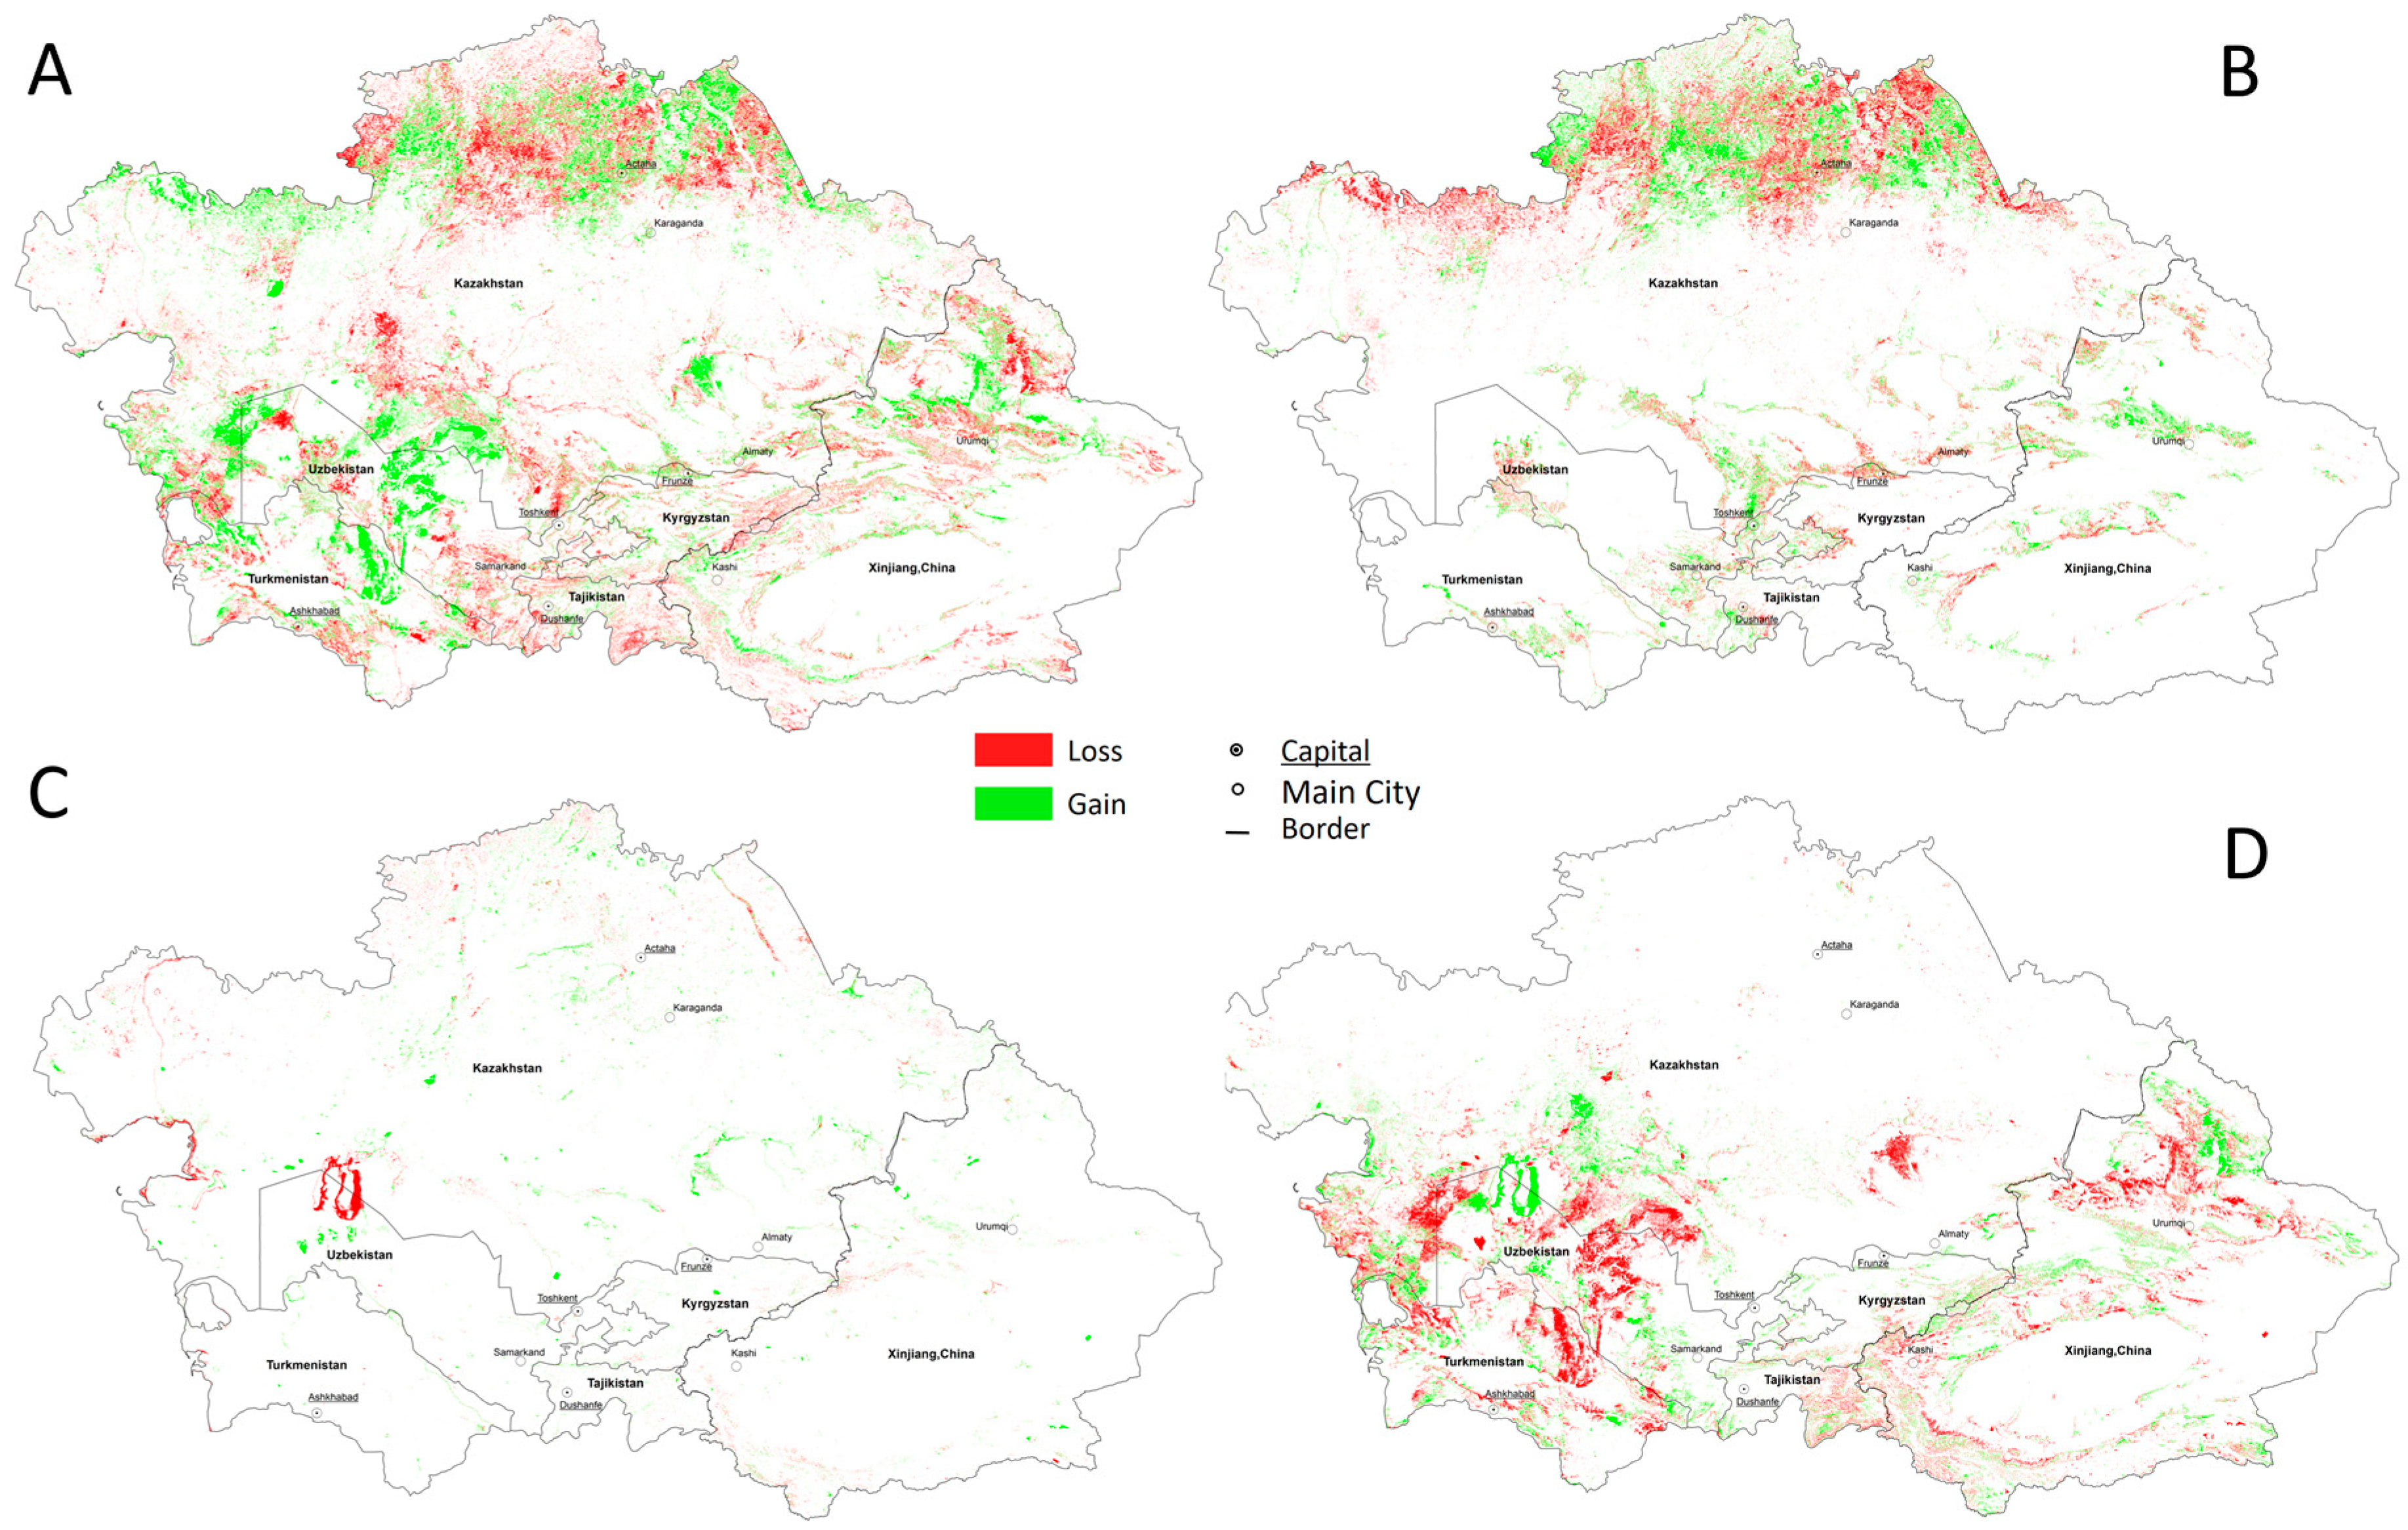
From the perspective of the transfer of land types, natural vegetation generally expanded over time (increase of 67.683 × 10³ km2, +2.2%) (Figure 9A). The area of natural vegetation loss was 0.501 × 10⁶ km2 and was mainly distributed in the northern and central regions of the study site, including in Turgayskaya Lozhbina, Kazakhskiy Melkosopochnik and the northern part of the Turan Plain. The area of natural vegetation gain was 0.569 × 10⁶ km2 and was mainly distributed in Turgayskoye Plato, Turgayskaya Lozhbina, the northern part of Kazakhskiy Melkosopochnik, the northeastern part of the Junggar Basin, the southern part of the Caspian coastal plain, the Kyzylkum Desert and the Karakum Desert. From a regional perspective, not all natural vegetation expanded; in the northern part of Kazakhstan (as shown in Figure 6: Akmola, North Kazakhstan, Pavlodar, Kostanai, etc.), the natural vegetation area decreased (−4.8%).
The area of cultivated land expanded (increase of 30.584 × 10³ km2, +6.1%) (Figure 9B). The areal loss of cultivated land reached 0.288 × 10⁶ km2 and was mainly distributed in the northern and central parts of the study area, especially in the Ural River Basin of Kazakhstan, Turgayskoye Plato, Turgayskaya Lozhbina, the Ertix River Basin, and the surrounding region of Astana. There were obvious land reclamation phenomena, and the increase in cultivated land area reached 0.319 × 10⁶ km2 in the same period. These increases were mainly distributed in the northern part of the study region, especially between Kazakhskiy Melkosopochnik and Turgayskaya Lozhbina and in the northeastern part of Kazakhskiy Melkosopochnik and the southern part of the Junggar Basin. The expansion of cultivated land in Central Asia also exhibited regional differences: the cultivated land in Xinjiang, China, experienced rapid expansion, with an 18.6% increase in area. However, the rates of cultivated land expansion in the northern regions of Kazakhstan, southern Kazakhstan and southern Central Asia were significantly reduced, and the cultivated land in these regions expanded by 0.2% to 7.1%.
Water bodies and wetlands, such as rivers and lakes, displayed an expansion trend (increase of 18.251 × 10³ km2, +14.0%) (Figure 9C). The area of water body and wetland loss was 48.610 × 10³ km2, which mainly occurred in the Caspian Sea, the Aral Sea, the northern Ural River Basin, and the southern part of the Irtysh River Basin. This loss was characterized by the shrinking of the Caspian Sea waters and the extensive atrophy of the Aral Sea; in addition, the Ural River and Irtysh River partially dried up. The areal increase in water bodies and wetlands reached 66.861 × 10³ km2 and was mainly distributed in the northern part of the Irtysh River Basin, the western part of the Turan Plain, the Ili River Basin and the western part of the Caspian Sea Plain. Regionally, Xinjiang, China, had the largest water body and wetland expansion rate (+60.2%), followed by northern Kazakhstan (+18.8%). Conversely, southern Kazakhstan and southern Central Asia exhibited the lowest expansion rates (+8.2%).
The bareland area displayed a decreasing trend (decrease of 0.052 × 10⁶ km2, −2.6%), indicating that the ecological environment in the region has improved (Figure 9D). The area of bareland loss was 0.356 × 10⁶ km2 and was mainly distributed in the desert areas of the southwest and east, especially in the southern part of the Caspian coastal plain, the Kyzylkum Desert, the Karakum Desert, and the southern Balkhash Lake. The related land gain was 0.304 × 10⁶ km2, and these areas were mainly distributed around the Aral Sea, the northern part of the Tulan Plain, the northern foothills of the Tianshan Mountains in China, and the eastern part of the Junggar Basin. In the subregions of the study area (Xinjiang, China, northern Kazakhstan, southern Kazakhstan, and four other countries in Central Asia), the area of bareland exhibited a decreasing trend.
3.4. Mechanisms of Land Cover Change
In response to changes in the regional climate (Figure 10) and the areas of different land cover types, a multiple stepwise regression analysis method was applied to summarize how changes in the climate and human economic and social activities impacted the land changes in the region (Table 3).
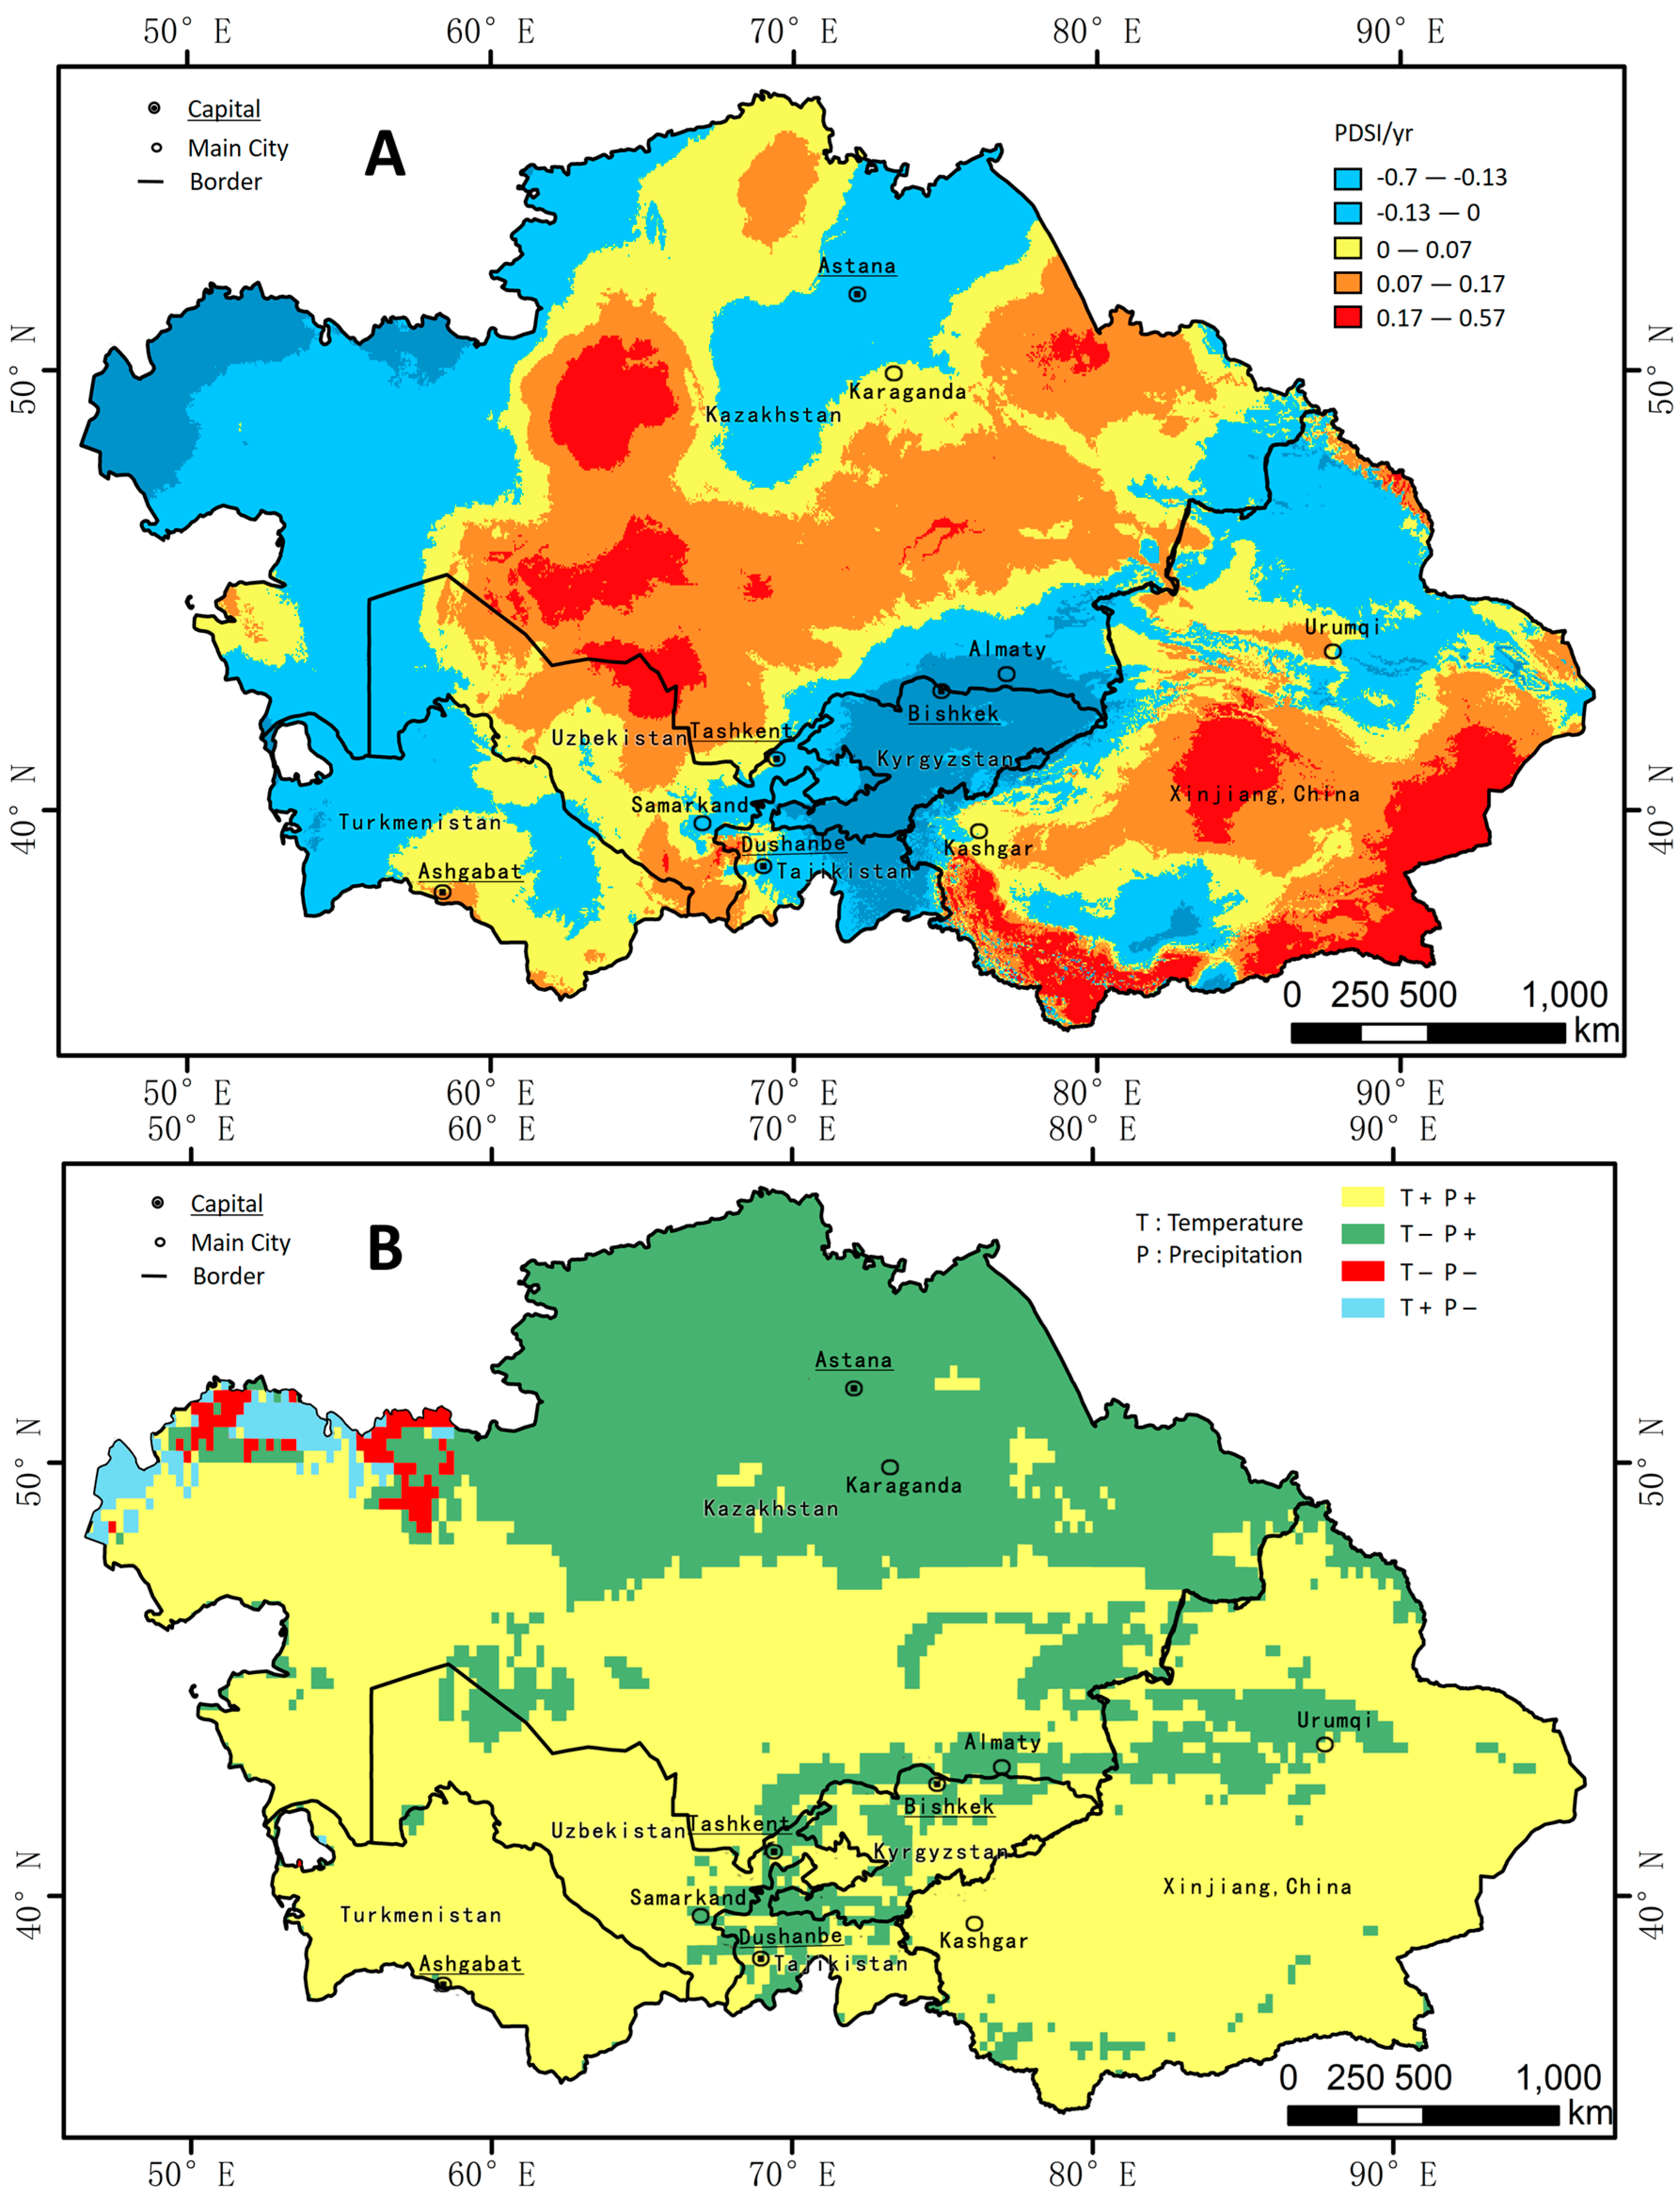
Table 3 indicates that the key factors driving the changes in water bodies, wetlands, grasslands and natural vegetation were changes in precipitation and the drought index, while temperature variations had no significant effect on these land types. Over the past 17 years, due to significant increases in precipitation, the areas of water bodies and wetlands in the five Central Asian countries (especially the areas surrounding the Aral Sea and Balkhash Lake) increased significantly. Additionally, with the decrease in the drought index, the areas of grassland in the southern part of Central Asia and natural vegetation in Xinjiang, China, significantly increased.
The main factors driving the changes in cultivated land were precipitation, the total population, and the urban population. With the increase in rainfall, the area of cultivated land (especially paddy land) in the southern part of Central Asia significantly increased. However, with the capital of Kazakhstan moving from Almaty to Astana in 1998, the regional population significantly increased in the northern region of Central Asia. The cultivated land that was previously abandoned in the 1990s was reopened, and the area of cultivated land rapidly increased. In Xinjiang, China, the increase in the area of cultivated land was closely related to the continuous increases in annual precipitation and the urban population.
The main factors driving changes in artificial surfaces were the urban population and regional economic development. In the five Central Asian countries, as the urban population increased, cities expanded into the suburbs, and the area of construction land continued to expand. Generally, changes in the area of artificial surfaces in Central Asia were related to the development of tertiary industry.
4. Discussion
4.1. Advantages
The accuracy evaluation of the research results shows that the GEE platform and the proposed method for constructing a training sample library based on authoritative land cover products can be quickly and accurately used for land cover mapping at cross-national and continental scales.
First, the greatest support provided by GEE is that there is no need to manually retrieve or download a large number of satellite images, which greatly reduces the time required to prepare the basic data. In fact, according to the spatial coverage and temporal scale of this research, the present study included the retrieval of 56,440 scenes of Landsat images, and the final preprocessed dataset that encompassed 17 years of satellite images reached 20 GB. Without the support of GEE, this process would have taken at least six months from image retrieval to download and preprocessing. However, with the support of GEE, the above work was completed in approximately 110 s. It is believed that the GEE platform will be a powerful support tool for future research. In addition, a Google Drive with 1 TB of storage was locally enabled. The data generated online in GEE can be downloaded at 1 megabit per second to the local device through Google Drive at any time.
Second, this study proposes a method for determining training/validation samples and building a sample library based on the consistency of multisource land cover products, achieving the goal of not requiring ground investigation and visual interpretation and yielding high speed and accuracy. In addition, the multisource land cover product consistency analysis and visual comparison provided an important basis for quality and reliability assessments of LUC products. Finally, traditional national land cover mapping research, such as the China National Land Cover Dataset (CNLCD) [2], requires a lot of manpower and resources. According to relevant studies, in China, a country with a vast and complex geographical environment, it can take more than 20 people one year to visually interpret remote sensing images and conduct land cover research in China. For a region with a simple land cover type, such as Central Asia, it may take half a year for visual interpretation. For traditional machine interpretation, it is also impossible to quickly complete land cover classification at the scale of Central Asia. Since the emergence of the GEE platform and through relevant work, we found that within one day, we could complete the land cover classification of the entire Central Asia region.
4.2. Uncertainties
The methods utilized in this study also have some limitations. First, this study introduced the RF method to map the land cover each year from 2001 to 2017 and analyze the dynamics of the classification results. The land change detection method was a post-classification comparison method. First, the land classification interpretation was performed on the remote sensing images of the two phases, and land change analysis was then performed according to the obtained classification map [40]. We called this approach “hard” classification here. This “hard” classification approach is relatively independent because it is based on year-by-year classification, which may simplify the nature of land cover and thus neglect the continuity of land cover change. A dynamic analysis based on the results obtained by this “hard” classification method may yield irregular and alternating changes at the pixel scale, thus reducing the credibility of the land cover change trends. For example, cultivated land needs to maintain fertility, and in some years, farming may be halted to achieve this goal. Because “hard” classification is performed for the current year, such areas will be assessed as bareland or other land types. Second, because shrubland is a transitional land type from grassland to bareland, the spectral and phenological characteristics of shrubland, grassland, and bareland are highly similar, leading to low accuracy for shrubland mapping. In addition, due to the scattered spatial distribution of artificial surfaces, the nighttime light data caused a light spillover effect, which led to low accuracy.
The solution to the above problems may be to conduct a “soft” classification, such as Landsat time series change detection algorithms based on trajectory fitting methods, which can obtain land cover change information by comparing the differences between the interannual or growth curves of various change detection indicators. Some researchers have carried out time trajectory fitting on the classification probability values that can be output in the RF model, and obtained the land cover change information by analyzing the time trajectory of the classification probability. For example, Dara et al. [41] applied the RF classification algorithm to Landsat pixels to obtain the classification probability of cultivated land and then used the LandTrendr time series segmentation algorithm to perform land classification probability time series segmentation based on the obtained segmentation data to explore the rapid and progressive changes in cultivated land. The results showed that it is feasible to use the temporal trajectory of the cultivated land classification probability to characterize the changes in cultivated land. Second, during the RF model training and classification process, monthly scale statistical characteristics (e.g., the average values, variation ranges, and peaks) of ecological parameters (e.g., the NDVI and net primary productivity (NPP)) could be introduced, and a downscaling method for the nighttime light data may need to be considered. These approaches will help the RF model to further distinguish among shrubland, grassland, and bareland and between artificial surfaces and other types of natural cover.
There is also uncertainty regarding the classification accuracy. First, after manual visual interpretation, we found that the classification error of sample plots was approximately 5%, and the uncertainty in training samples and verification samples may result in a relatively high classification accuracy. Similarly, for the classification system, because the land cover in Central Asia is not complicated, simple primary classification may yield a higher classification accuracy, but for the secondary classification, the classification accuracy of the method may be low, especially in complex regions. Finally, because the reference sample in this study period is based on a land area that remained unchanged for many years, when the verification was performed, the accuracy of the stable classes was extremely high and included in the assessment, and the overall accuracy was correspondingly high.
4.3. Complexity
This paper applies a multiple stepwise regression method to identify the mechanisms of land cover changes. Changes from natural vegetation (including water bodies and wetlands) to cultivated land and artificial surfaces were affected by climate change, and water conditions are the primary factors controlling the state of natural vegetation in Central Asia. With the increases in the intensity of land development and land utilization by humans, changes in land cover are gradually driven by the population and industrial development. The conclusions are consistent with the relevant conclusions of other scholars. Zhang et al. [42] found that southern Kazakhstan was an area susceptible to drought and desertification and persistent drought was a major factor in grassland degradation and desertification in Central Asia. This was consistent with the conclusion that the grassland in the southern part of the study area (the grassland was mainly distributed in southern Kazakhstan) was mainly affected by the drought. Zou et al. [25] and Klein et al. [27] found that changes in precipitation were the main cause of changes in the quality of natural ecosystems in Central Asia. Additionally, Klein et al. [27] and Kasimu et al. [26] found that the levels of urbanization and economic development are the most important factors affecting the changes in urban land in Central Asia. However, the above studies of the relevant driving mechanisms were based on simple one-dimensional linear regression methods or qualitative analysis. The method applied in this paper is more quantitative and more detailed than the methods used in previous studies.
However, the methods used in this paper still have many shortcomings. First, the multiple stepwise regression method is not ideal for a driving mechanism analysis based on strict causality. This method is only a correlation-based analysis method that relies on the prior determination of driving factors, after which the key elements and their contribution rates are determined by repeated regression analyses and significance tests. The accuracy and completeness of the selected driving elements greatly affect the conclusions of the driving mechanism analysis. Second, there are obvious differences in the development paths, development environments, and land policies within the study area, especially among Xinjiang, China, and the five other countries. The current study does not consider these elements. In addition, in the multisource stepwise regression, changes in meteorological elements are implemented by spatial interpolation methods in each pixel, and the measurements of economic and social factors are obtained via the area averaging of the spatial grid. Especially in regions where Central Asia is sparsely populated and economically heterogeneous with complex and volatile land changes, the area averaging method cannot fully represent the socioeconomic conditions a certain region. This mismatch leads to uncertainty in the analysis results regarding the drive mechanism. Therefore, the use of multiple stepwise regression provides a complex analysis approach for this region of Central Asia but also leads to unsatisfactory driving factor identification and a low correlation coefficient (R2). In future research, especially in small-scale regional studies, the traditional social and economic statistics data with relational format should be transferred to the spatial data (vector or grid format) by the method introduced by Hu at el. [43].
5. Conclusions
This study focused on the status and trends of land cover in Central Asia since the beginning 21st century. The research was based on long-term Landsat satellite imagery and other auxiliary data supported by the GEE platform. Based on the construction of a sample dataset and RF model, we generated interannual updated land cover products. The method used in this paper provides an important reference for land mapping research in other similar regions. This mapping method for analyzing land changes in large-scale regions, when combined with an in-depth understanding of the socioeconomic factors and natural factors that drive land change, can be used to inform policy and decision making. Additionally, the results obtained with this method can help people understand the context of global climate change and economic globalization. Central Asia, as an ecologically fragile and sensitive region, serves as an important reference for achieving sustainable development and mitigating ecological degradation.
Supplementary Materials
Available online at https://www.mdpi.com/2072-4292/11/5/554/s1 include: (1) Relationships of land cover types in different land classification system; (2) scripts for training point selection; (3) scripts for image pre-processing, classification, and accuracy assessment; (4) download link of reference sample points; (5) download link of land cover dataset; and (6) the accuracy of each land cover type and overall accuracy of reference sample points.
Author Contributions
Y.H. (Yunfeng Hu) designed and supervised the research. Y.H. (Yang Hu) performed the experiments and preliminarily analyzed the results. All of the authors drafted and revised the paper.
Funding
Strategic Priority Research Program of Chinese Academy of Sciences, Grant Numbers XDA20010202 and XDA19040301; National Key Research and Development Plan Program in China, Grant Numbers 2016YFC0503701 and 2016YFB0501502; and Key Project of the High Resolution Earth Observation System in China, Grant Number 00-Y30B14-9001-14/16.
Conflicts of Interest
The authors declare no conflicts of interest.
References
- Batunacun; Nendel, C.; Hu, Y.F.; Lakes, T. Land-use change and land degradation on the Mongolian Plateau from 1975 to 2015-A case study from Xilingol, China. Land Degrad. Dev. 2018, 29, 1595–1606. [Google Scholar] [CrossRef]
- Ning, J.; Liu, J.; Kuang, W.; Xu, X.; Zhang, S.; Yan, C.; Li, R.; Wu, S.; Hu, Y.; Du, G.; et al. Spatiotemporal patterns and characteristics of land-use change in China during 2010–2015. J. Geogr. Sci. 2018, 28, 547–562. [Google Scholar] [CrossRef]
- Loveland, T.R.; Reed, B.C.; Brown, J.F.; Ohlen, D.O.; Zhu, Z.; Yang, L.W.M.J.; Merchant, J.W. Development of a global land cover characteristics database and IGBP DISCover from 1 km AVHRR data. Int. J. Remote Sens. 2000, 21, 1303–1330. [Google Scholar] [CrossRef]
- Bartholome, E.; Belward, A.S. GLC2000: A new approach to global land cover mapping from Earth observation data. Int. J. Remote Sens. 2005, 26, 1959–1977. [Google Scholar] [CrossRef]
- Friedl, M.A.; Sulla-Menashe, D.; Tan, B.; Schneider, A.; Ramankutty, N.; Sibley, A.; Huang, X. MODIS Collection 5 global land cover: Algorithm refinements and characterization of new datasets. Remote Sens. Environ. 2010, 114, 168–182. [Google Scholar] [CrossRef]
- Iwao, K.; Nishida, K.; Kinoshita, T.; Yamagata, Y. Validating land cover maps with Degree Confluence Project information. Geophys. Res. Lett. 2006, 33, 265–288. [Google Scholar] [CrossRef]
- Gong, P.; Yu, L.; Hu, L.; Li, X.; Li, C.; Zhang, H.; Zheng, Y.; Wang, J.; Zhao, Y. Towards a common validation sample set for global land-cover mapping. Int. J. Remote Sens. 2014, 35, 4795–4814. [Google Scholar]
- Chen, J.; Jin, C.; Liao, A.; Xing, C.; Chen, L.; Chen, X.; Shu, P.; Gang, H.; Zhang, H.; Chaoying, H.E. Concepts and Key Techniques for 30 m Global Land Cover Mapping. Acta Geod. Cartogr. Sin. 2014, 43, 551–557. [Google Scholar]
- Midekisa, A.; Holl, F.; Savory, D.J.; Andradepacheco, R.; Gething, P.W.; Bennett, A.; Sturrock, H. Mapping land cover change over continental Africa using Landsat and Google Earth Engine cloud computing. PLoS ONE 2017, 12, e0184926. [Google Scholar] [CrossRef] [PubMed]
- Gomez, C.; White, J.C.; Wulder, M.A. Optical remotely sensed time series data for land cover classification: A review. ISPRS J. Photogramm. Remote Sens. 2016, 116, 55–72. [Google Scholar] [CrossRef]
- Hu, Y.; Dong, Y.; Batunacun. An automatic approach for land-change detection and land updates based on integrated NDVI timing analysis and the CVAPS method with GEE support. ISPRS J. Photogramm. Remote Sens. 2018, 146, 347–359. [Google Scholar] [CrossRef]
- Akar, Ö.; Güngör, O. Classification of Multispectral Images Using Random Forest Algorithm. J. Geod. Geoinf. 2013, 1, 105–112. [Google Scholar] [CrossRef]
- Breiman, L. Random Forests. Mach. Learn. 2001, 45, 5–32. [Google Scholar] [CrossRef]
- Immitzer, M.; Atzberger, C.; Koukal, T. Tree Species Classification with Random Forest Using Very High Spatial Resolution 8-Band WorldView-2 Satellite Data. Remote Sens. 2012, 4, 2661–2693. [Google Scholar] [CrossRef]
- Nyland, K.E.; Gunn, G.E.; Shiklomanov, N.I.; Engstrom, R.N.; Streletskiy, D.A. Land Cover Change in the Lower Yenisei River Using Dense Stacking of Landsat Imagery in Google Earth Engine. Remote Sens. 2018, 10, 1226. [Google Scholar] [CrossRef]
- Markert, K.; Schmidt, C.; Griffin, R.; Flores, A.; Poortinga, A.; Saah, D.; Muench, R.; Clinton, N.; Chishtie, F.; Kityuttachai, K.; et al. Historical and Operational Monitoring of Surface Sediments in the Lower Mekong Basin Using Landsat and Google Earth Engine Cloud Computing. Remote Sens. 2018, 10, 909. [Google Scholar] [CrossRef]
- Dong, J.; Xiao, X.; Menarguez, M.A.; Zhang, G.; Qin, Y.; Thau, D.; Biradar, C.; Berrien Moore, I. Mapping paddy rice planting area in northeastern Asia with Landsat 8 images, phenology-based algorithm and Google Earth Engine. Remote Sens. Environ. 2016, 185, 142–154. [Google Scholar] [CrossRef] [PubMed]
- Goldblatt, R.; You, W.; Hanson, G.; Khandelwal, A. Detecting the Boundaries of Urban Areas in India: A Dataset for Pixel-Based Image Classification in Google Earth Engine. Remote Sens. 2016, 8, 634. [Google Scholar] [CrossRef]
- Gorelick, N.; Hancher, M.; Dixon, M.; Ilyushchenko, S.; Thau, D.; Moore, R. Google Earth Engine: Planetary-scale geospatial analysis for everyone. Remote Sens. Environ. 2017, 202, 18–27. [Google Scholar] [CrossRef]
- De Alban, J.D.T.; Connette, G.M.; Oswald, P.; Webb, E.L. Combined Landsat and L-Band SAR Data Improves Land Cover Classification and Change Detection in Dynamic Tropical Landscapes. Remote Sens. 2018, 10, 306. [Google Scholar] [CrossRef]
- Puigdefabregas, J. Ecological impacts of global change on drylands and their implications for desertification. Land Degrad. Dev. 1998, 9, 393–406. [Google Scholar] [CrossRef]
- Yang, G. Land Use and Land Cover Change and Regional Economic Development: The Revelation of the Change in Cropland Area in the Yangtze River Deltaduring the Past 50 Years. Acta Geogr. Sin. 2004, 59, 41–46. [Google Scholar]
- Ambinakudige, S.; Choi, J. Global coffee market influence on land-use and land-cover change in the Western Ghats of India. Land Degrad. Dev. 2009, 20, 327–335. [Google Scholar] [CrossRef]
- Hu, Y.; Nacun, B. An Analysis of Land-Use Change and Grassland Degradation from a Policy Perspective in Inner Mongolia, China, 1990–2015. Sustainability 2018, 10, 4048. [Google Scholar] [CrossRef]
- Zou, J.; Ding, J.; Yang, S. Spatial and temporal variation analysis of ecosystem water use efficiency in Central Asia and Xinjiang in recent 15 years. Geogr. Res. 2017, 36, 1742–1754. [Google Scholar]
- Kasimu, A.; Tang, B.; Maimaitiming, A. Study on spatio-temporal dynamics of urban expansion in five central Asian cities based on remote sensing data. Hum. Geogr. 2012, 4, 83–87. [Google Scholar]
- Klein, I.; Gessner, U.; Kuenzer, C. Regional land cover mapping and change detection in Central Asia using MODIS time-series. Appl. Geogr. 2012, 35, 219–234. [Google Scholar] [CrossRef]
- Conrad, C.; Dech, S.W.; Hafeez, M.; Lamers, J.; Martius, C.; Strunz, G.J.I.; Systems, D. Mapping and assessing water use in a Central Asian irrigation system by utilizing MODIS remote sensing products. Irrig. Drain. Syst. 2007, 21, 197–218. [Google Scholar] [CrossRef]
- Dietz, A.; Conrad, C.; Kuenzer, C.; Gesell, G.; Dech, S. Identifying Changing Snow Cover Characteristics in Central Asia between 1986 and 2014 from Remote Sensing Data. Remote Sens. 2014, 6, 12752–12775. [Google Scholar] [CrossRef]
- Bai, J.; Chen, X.; Li, J.; Yang, L. Changes of inland lake area in arid Central Asia during 1975–2007: A remote-sensing analysis. J. Lake Sci. 2011, 23, 80–88. [Google Scholar]
- Li, D.; Zhao, X.; Li, X. Remote sensing of human beings—A perspective from nighttime light. Acta Geod. Cartogr. Sin. 2016, 19, 69–79. [Google Scholar] [CrossRef]
- Defourny, P.; Schouten, L.; Bartalev, S.; Bontemps, S.; Cacetta, P.; Wit, A.J.W.D.; Bella, C.D.; Gérard, B.; Giri, C.; Gond, V. Accuracy assessment of a 300 m global land cover map: The GlobCover experience. New Libr. World 2009, 112, 236–247. [Google Scholar]
- Hansen, M.C.; Potapov, P.V.; Moore, R.; Hancher, M.; Turubanova, S.A.; Tyukavina, A.; Thau, D.; Stehman, S.V.; Goetz, S.J.; Loveland, T.R.; et al. High-resolution global maps of 21st-century forest cover change. Science 2013, 342, 850–853. [Google Scholar] [CrossRef] [PubMed]
- Xiong, J.; Thenkabail, P.S.; Gumma, M.K.; Teluguntla, P.; Poehnelt, J.; Congalton, R.G.; Yadav, K.; Thau, D. Automated cropland mapping of continental Africa using Google Earth Engine cloud computing. ISPRS J. Photogramm. Remote Sens. 2017, 126, 225–244. [Google Scholar] [CrossRef]
- Ashouri, H.; Hsu, K.L.; Sorooshian, S.; Braithwaite, D.K.; Knapp, K.R.; Cecil, L.D.; Nelson, B.R.; Prat, O.P. PERSIANN-CDR: Daily Precipitation Climate Data Record from Multisatellite Observations for Hydrological and Climate Studies. Bull. Am. Meteorol. Soc. 2014, 96, 197–210. [Google Scholar] [CrossRef]
- Rodell, M.; Houser, P.R.; Jambor, U.; Gottschalck, J.; Mitchell, K.; Meng, C.-J.; Arsenault, K.; Cosgrove, B.; Radakovich, J.; Bosilovich, M.; et al. The global land data assimilation system. Bull. Am. Meteorol. Soc. 2004, 85, 381–394. [Google Scholar] [CrossRef]
- Abatzoglou, J.T.; Dobrowski, S.Z.; Parks, S.A.; Hegewisch, K.C. TerraClimate, a high-resolution global dataset of monthly climate and climatic water balance from 1958–2015. Sci. Data 2018, 5, 170191. [Google Scholar] [CrossRef] [PubMed]
- Huang, H.; Chen, Y.; Clinton, N.; Wang, J.; Wang, X.; Liu, C.; Gong, P.; Yang, J.; Bai, Y.; Zheng, Y.; et al. Mapping major land cover dynamics in Beijing using all Landsat images in Google Earth Engine. Remote Sens. Environ. 2017, 202, 166–176. [Google Scholar] [CrossRef]
- Hu, Y.; Zhang, Q.; Dai, Z.; Huang, M.; Yan, H. Agreement analysis of multi-sensor satellite remote sensing derived land cover products in the Europe Continent. Geogr. Res. 2015, 34, 1839–1852. [Google Scholar]
- Hsin, T.Y.; Douglas, S.; John, W. Comparison of Object-Based Image Analysis Approaches to Mapping New Buildings in Accra, Ghana Using Multi-Temporal QuickBird Satellite Imagery. Int. J. Remote Sens. 2011, 3, 2707–2726. [Google Scholar]
- Dara, A.; Baumann, M.; Kuemmerle, T.; Pflugmacher, D.; Rabe, A.; Griffiths, P.; Hölzel, N.; Kamp, J.; Freitag, M.; Hostert, P. Mapping the timing of cropland abandonment and recultivation in northern Kazakhstan using annual Landsat time series. Remote Sens. Environ. 2018, 213, 49–60. [Google Scholar] [CrossRef]
- Zhang, G.; Biradar, C.M.; Xiao, X.; Dong, J.; Zhou, Y.; Qin, Y.; Zhang, Y.; Liu, F.; Ding, M.; Thomas, R.J. Exacerbated grassland degradation and desertification in Central Asia during 2000–2014. Ecol. Appl. 2018, 28, 442–456. [Google Scholar] [CrossRef] [PubMed]
- Hu, Y.; Wang, Q.; Liu, Y.; Li, J.; Ren, W. Index System and Transferring Methods to Build the National Society and Economy Grid Database. J. Geo-Inf. Sci. 2011, 13, 573–578. [Google Scholar] [CrossRef]
Figure 1.
Study area showing relatively flat regions in the northwestern part of Central Asia and high elevations in the southeast mountainous regions.
Figure 1.
Study area showing relatively flat regions in the northwestern part of Central Asia and high elevations in the southeast mountainous regions.

Figure 2.
Flowchart of land cover mapping and mechanism analysis. Land cover mapping includes sample selection, basic data and RF classification. Note that LUC represents land use/cover.
Figure 2.
Flowchart of land cover mapping and mechanism analysis. Land cover mapping includes sample selection, basic data and RF classification. Note that LUC represents land use/cover.
Figure 3.
Spatial distribution and consistency analysis of land cover from the products obtained in this study in 2010 and the GlobeLand30_2010 and MCD12Q1 products in 2010. A1-7 represents the 7 comparison areas in Figure 4.
Figure 3.
Spatial distribution and consistency analysis of land cover from the products obtained in this study in 2010 and the GlobeLand30_2010 and MCD12Q1 products in 2010. A1-7 represents the 7 comparison areas in Figure 4.

Figure 4.
Comparison of different land cover products in 2010. (A) Landsat annual median TOA false color composition in 2010 (RGB: B4, B3, B2), (B) this product, (C) GlobeLand30, and (D) MCD12Q1 product. Comparison of cultivated land, forests, grassland, bareland, wetland, water bodies, artificial surfaces, permanent snow and ice from 1 to 7.

Figure 5.
Land cover classification in 2017, with computed area (km² and %) for land cover classes 2001, 2010 and 2017.
Figure 5.
Land cover classification in 2017, with computed area (km² and %) for land cover classes 2001, 2010 and 2017.

Figure 6.
The NDVI trend in Central Asia from 2001 to 2017. NDVI/yr indicates the slope of the change in the annual average NDVI.
Figure 6.
The NDVI trend in Central Asia from 2001 to 2017. NDVI/yr indicates the slope of the change in the annual average NDVI.

Figure 7.
Rate of land area change for various land cover types in the study area from 2001 to 2017. The rates indicate the rate of change of area in a certain year relative to 2001.
Figure 7.
Rate of land area change for various land cover types in the study area from 2001 to 2017. The rates indicate the rate of change of area in a certain year relative to 2001.

Figure 8.
Sankey plot showing changes from one land use land cover class to another between 2001, 2010 and 2017. The numbers beside boxes indicate the percentage of the area of the land cover type based on the total study area. BL: Bareland, CL: Cropland, NV: Natural vegetable, WW: Water bodies&Wetland.

Figure 9.
Spatial distribution of land cover change between 2001 and 2017. (A) Vegetation, (B) cropland, (C) water bodies and wetland, and (D) bareland. Loss indicates that the land cover type is transferred to other land cover types. Gain indicates other land cover types transitioned to the given land cover type.

Figure 10.
Spatial pattern of climate change in Central Asia from 2001 to 2017. (A) Change in the PDSI, PDSI/yr indicates the slope of the change in the annual average PDSI. (B) Temperature-precipitation change zoning map. +/− indicates that the slope of the change in the annual average temperature or annual precipitation is greater or less than 0.


Table 1.
Datasets Used in this Research. Note that Year(s) represents the temporal range of the datasets used; * represents data available online (https://earthengine.google.com).
Table 1.
Datasets Used in this Research. Note that Year(s) represents the temporal range of the datasets used; * represents data available online (https://earthengine.google.com).
| Data | Data Sources | Year(s) | Spatial Resolution | Temporal Resolution |
|---|---|---|---|---|
| Landsat * | http://landsat.usgs.gov/ | 2001–2017 | 30 m | 16 days |
| SRTM3 * | http://www2.jpl.nasa.gov/srtm/ | 2000 | 30 m | — |
| DMSP/OLS * | https://ngdc.noaa.gov/eog/dmsp/ | 2001–2013 | 30 arc seconds | 1 year |
| NPP/VIIRS * | https://ngdc.noaa.gov/eog/viirs/ | 2012–2017 | 15 arc seconds | 1 month |
| MCD12Q1.051 * | https://lpdaac.usgs.gov/dataset_discovery/modis/modis_products_table/mcd12q1 | 2001–2013 | 500 m | 1 year |
| GlobCover * | http://dup.esrin.esa.int/page_globcover.php | 2009 | 300 m | — |
| GFCD * | http://earthenginepartners.appspot.com/science-2013-global-forest | 2000 | 30 m | — |
| GFSSAD * | http://geography.wr.usgs.gov/science/croplands/ | 2000 | 1000 m | — |
| GlobeLand30 | http://www.globeland30.com | 2010 | 30 m | — |
| PERSIANN-CDR * | https://data.nodc.noaa.gov/cgi-bin/ | 2001–2017 | 0.25 arc degrees | 1 day |
| TerraClimate * | http://www.climatologylab.org/terraclimate.html | 2001–2017 | 2.5 arc minutes | 1 month |
| GLDAS-2.1 * | http://ldas.gsfc.nasa.gov/gldas/ | 2001–2017 | 0.25 arc degrees | 3 h |
Table 2.
User’s accuracies (UA), producer’s accuracies (PA) and overall accuracy of Land cover classification from 2001 to 2017.
Table 2.
User’s accuracies (UA), producer’s accuracies (PA) and overall accuracy of Land cover classification from 2001 to 2017.
| Land Cover | Classification Accuracy | |
|---|---|---|
| UA | PA | |
| Forest | 0.95 ± 0.03 | 0.95 ± 0.03 |
| Grassland | 0.92 ± 0.02 | 0.90 ± 0.02 |
| Shrubland | 0.63 ± 0.09 | 0.77 ± 0.07 |
| Cultivated land | 0.83 ± 0.03 | 0.85 ± 0.03 |
| Artificial surfaces | 0.63 ± 0.09 | 0.77 ± 0.06 |
| Water bodies | 0.97 ± 0.03 | 0.96 ± 0.02 |
| Wetland | 0.80 ± 0.09 | 0.80 ± 0.08 |
| Permanent snow and ice | 0.96 ± 0.03 | 0.95 ± 0.03 |
| Bareland | 0.97 ± 0.01 | 0.94 ± 0.02 |
| Overall accuracy | 0.90 ± 0.01 | |
Table 3.
Relationships between land cover and driving factors in different zones.
| Water Bodies and Wetland (km2) | Grassland (km2) | Natural Vegetation (km2) | Cultivated Land (km2) | Artificial Surfaces (km2) | |
|---|---|---|---|---|---|
| Southern region (T+, P+) | — | — | — | ||
| Northern region (T-, P+) | — | — | — | — | |
| Five Central Asian countries | — | — | — | ||
| Xinjiang, China | — | — | — | ||
| Study area | — | — | — |
Note 1: WW: Annual water bodies and wetland area, G: Annual grassland area, NV: Annual natural vegetation area, CL: Annual cultivated land area, AS: Annual artificial surfaces area, T: temperature (°C), P: precipitation (mm), D: drought index (PDSI), GDP: gross domestic product (USD 10,000), IAV2: added value of secondary industry (USD 10,000), IAV3: added value of tertiary industry (USD 10,000), TP: total population (10,000 people), UP: urban population (10,000 people). Note 2: * indicates a test with p = 0.05, and ** indicates a test with p = 0.01. Note 3: Southern region indicates the region of (T+, P+) shown in Figure 10. The northern region indicates the region of (T-, P+) shown in Figure 10.
© 2019 by the authors. Licensee MDPI, Basel, Switzerland. This article is an open access article distributed under the terms and conditions of the Creative Commons Attribution (CC BY) license (http://creativecommons.org/licenses/by/4.0/).
Share and Cite
MDPI and ACS Style
Hu, Y.; Hu, Y. Land Cover Changes and Their Driving Mechanisms in Central Asia from 2001 to 2017 Supported by Google Earth Engine. Remote Sens. 2019, 11, 554. https://doi.org/10.3390/rs11050554
AMA Style
Hu Y, Hu Y. Land Cover Changes and Their Driving Mechanisms in Central Asia from 2001 to 2017 Supported by Google Earth Engine. Remote Sensing. 2019; 11(5):554. https://doi.org/10.3390/rs11050554
Chicago/Turabian StyleHu, Yunfeng, and Yang Hu. 2019. "Land Cover Changes and Their Driving Mechanisms in Central Asia from 2001 to 2017 Supported by Google Earth Engine" Remote Sensing 11, no. 5: 554. https://doi.org/10.3390/rs11050554
Note that from the first issue of 2016, this journal uses article numbers instead of page numbers. See further details here.