Assessing Harvested Sites in a Forested Boreal Mountain Catchment through Global Forest Watch


Division for Forestry and Forest Resources, The Norwegian Institute of Bioeconomy Research, NIBIO, Postbox 115, 1431 Ås, Norway
*
Author to whom correspondence should be addressed.
Remote Sens. 2019, 11(5), 543; https://doi.org/10.3390/rs11050543
Submission received: 21 January 2019
/
Revised: 21 February 2019
/
Accepted: 2 March 2019
/
Published: 6 March 2019
(This article belongs to the Section Forest Remote Sensing)
Abstract
:Global Forest Watch (GFW) provides a global map of annual forest cover loss (FCL) produced from Landsat imagery, offering a potentially powerful tool for monitoring changes in forest cover. In managed forests, FCL primarily provides information on commercial harvesting. A semi-autonomous method for providing data on the location and attributes of harvested sites at a landscape level was developed which could significantly improve the basis for catchment management, including risk mitigation. FCL in combination with aerial images was used for detecting and characterising harvested sites in a 1607 km2 mountainous boreal forest catchment in south-central Norway. Firstly, the forest cover loss map was enhanced (FCLE) by removing small isolated forest cover loss patches that had a high probability of representing commission errors. The FCLE map was then used to locate and assess sites representing annual harvesting activity over a 17-year period. Despite an overall accuracy of >98%, a kappa of 0.66 suggested only a moderate quality for detecting harvested sites. While errors of commission were negligible, errors of omission were more considerable and at least partially attributed to the presence of residual seed trees on the site after harvesting. The systematic analysis of harvested sites against aerial images showed a detection rate of 94%, but the area of the individual harvested site was underestimated by 29% on average. None of the site attributes tested, including slope, area, altitude, or site shape index, had any effect on the accuracy of the area estimate. The annual harvest estimate was 0.6% (standard error 12%) of the productive forest area. On average, 96% of the harvest was carried out on flat to moderately steep terrain (<40% slope), 3% on steep terrain (40% to 60% slope), and 1% on very steep terrain (>60% slope). The mean area of FCLE within each slope category was 1.7 ha, 0.9 ha, and 0.5 ha, respectively. The mean FCLE area increased from 1.0 ha to 3.2 ha on flat to moderate terrain over the studied period, while the frequency of harvesting increased from 249 to 495 sites per year. On the steep terrain, 35% of the harvesting was done with cable yarding, and 62% with harvester-forwarder systems. On the very steep terrain (>60% slope), 88% of the area was harvested using cable yarding technology while harvesters and forwarders were used on 12% of the area. Overall, FCL proved to be a useful dataset for the purpose of assessing harvesting activity under the given conditions.
1. Introduction
Mountain catchments play an increasingly important role in the provision of ecosystems services, of which supporting functions such as physical protection against avalanches [1], rock-falls and land- and debris slides [2] are perhaps some of the most obvious. Regulation of water flow during spring thaw [3] and extreme precipitation events [4], as well as the supply of clean drinking water make up some of the better known provisional services [5]. Cultural services are also prevalent in mountain catchments, manifested through hiking, mountain biking, fishing and hunting [6,7] as are provisioning services such as the supply of timber and wood products [8]. The continued support or enhancement of these services from mountain catchments in an era of climate change, together with perceived negative developments in size, location and extent of timber-harvesting operations, requires a management approach that is flexible and responsive to status change and risk. Adaptive ecosystem management is likewise dependent on the provision of data for assessing the current status, status change, and likely consequences of any transitional process [9].
The provision of timber necessitates harvesting activity and the need for temporary and permanent infrastructure in extracting and transporting the timber to conversion facilities [10]. Mountain catchments are naturally characterised by steep terrain, thus the combination of harvesting system, harvesting site attributes and infrastructure imply an increased predisposition to natural hazards [11]. Research addressing these issues has typically focused on quantifying the effect or predicting the risk of negative externalities resulting from such operations. As examples of this, [12] applied multi-criteria decision analysis taking regard of landslide and erosion risk in finding feasible harvesting zones, while [13,14] put forward models for predicting the risk of shallow landslides resulting from existing or planned road networks. Much of the work related to assessing negative externalities from logging operations has been done at a watershed scale [15,16,17,18]. However, using ground-based timber extraction machinery (forwarders, skidders) on sites with steep side slopes often requires the construction of sporadic temporary skid trails, either bladed [19] or excavated [20], and more site-specific methods for estimating or quantifying soil disturbance and the effectiveness of closing temporary skid trails are needed [21]. Turbidity and sedimentation issues resulting from forest machines crossing streams also need to be identified at a higher spatial resolution [22]. However, depending on forest ownership structure, reliable and timely spatial information on the location and attributes of harvested sites can be difficult to access, while this information would be essential for an effective adaptive ecosystem management programme.
Easy access to reliable information on cut sites in mountain catchments could be used in improving land administration, including reducing the risk of natural hazards through the monitoring of harvested sites and their associated infrastructure for a period after harvesting. As an indicator of calamities (windfall, fire), reliable spatial data could be used in identifying and facilitating studies on the adaptive capacity or resilience of forests during the initial recovery process [23]. From a forest planning point of view, it might be useful to have an accurate record of harvesting activity including any distinct spatial or temporal patterns or trends over time with regards to cut size, shape, slope, and location in the catchment. Global Forest Watch (GFW) [24] may be a promising data source for this type of forestry activity monitoring.
GFW is a web-based service reporting annual worldwide forest cover loss (FCL) and gain from 2001 to the present [24]. The service was built with the aim of providing accountability and transparency in the mitigation of emissions arising from deforestation and forest degradation. The approach is to map global forest cover loss, where forest is defined as areas with at least 25% canopy cover with trees higher than 5 m. FCL includes all forms of forest cover loss, meaning that commercial forest harvesting is also represented, even though it implies the restitution of forest cover in the short term. The FCL map is a result of classification of wall-to-wall Landsat images using Google Earth Engine. The training data sources used include Quickbird imagery, Landsat-derived layers of tree cover, and Moderate Resolution Imaging Spectroradiometer (MODIS)-derived layer of tree cover percentage [24]. See for example [25] and [26] for some discussions on the accuracy and usage of FCL. In this text, the term FCL will be used when referring to the GFW map product, reporting forest cover loss. As part of this study, an enhanced map was produced based on FCL, and the acronym FCLE will be used to refer to this map.
While FCLE may be useful for detecting harvested sites, it does not contain information on the harvest system used. Aerial images were, therefore, analysed in order to obtain this information.
Objectives
The objectives of this study were to:
- -
- Assess the accuracy of the FCL and FCLE against visual evidence of forest cover loss in aerial images, using a forested catchment representing varying terrain conditions as a case area.
- -
- Estimate annual harvest in proportion to the productive forest area.
- -
- Identify possible trends in terms of increasing harvested site size and any changes in levels of activity in different slope categories, based on FCLE.
- -
- Assess the appropriateness of timber extraction technologies being used in different slope categories, based on the assumption that cable extraction is most suited to the steepest slopes and the use of excavator-assisted forwarding, which implies digging temporary extraction trails on steep slopes, is minimised overall.
2. Materials and Methods
2.1. Case Study Area
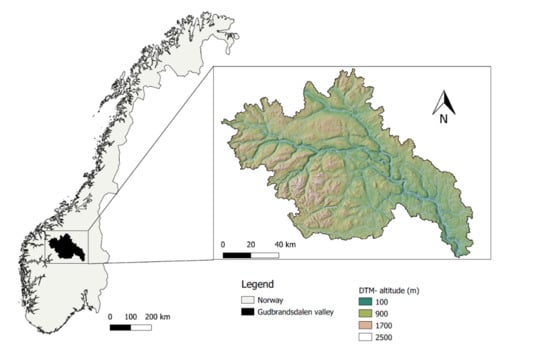
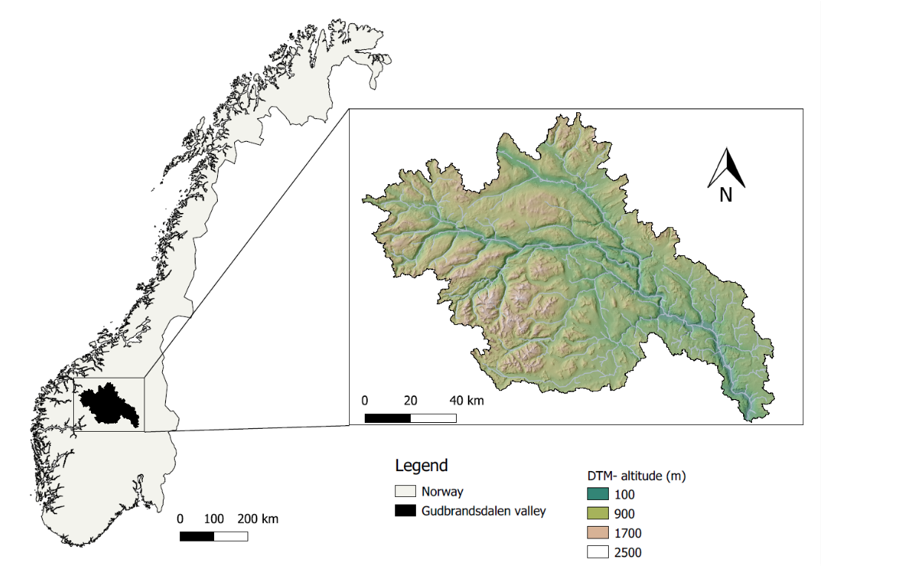
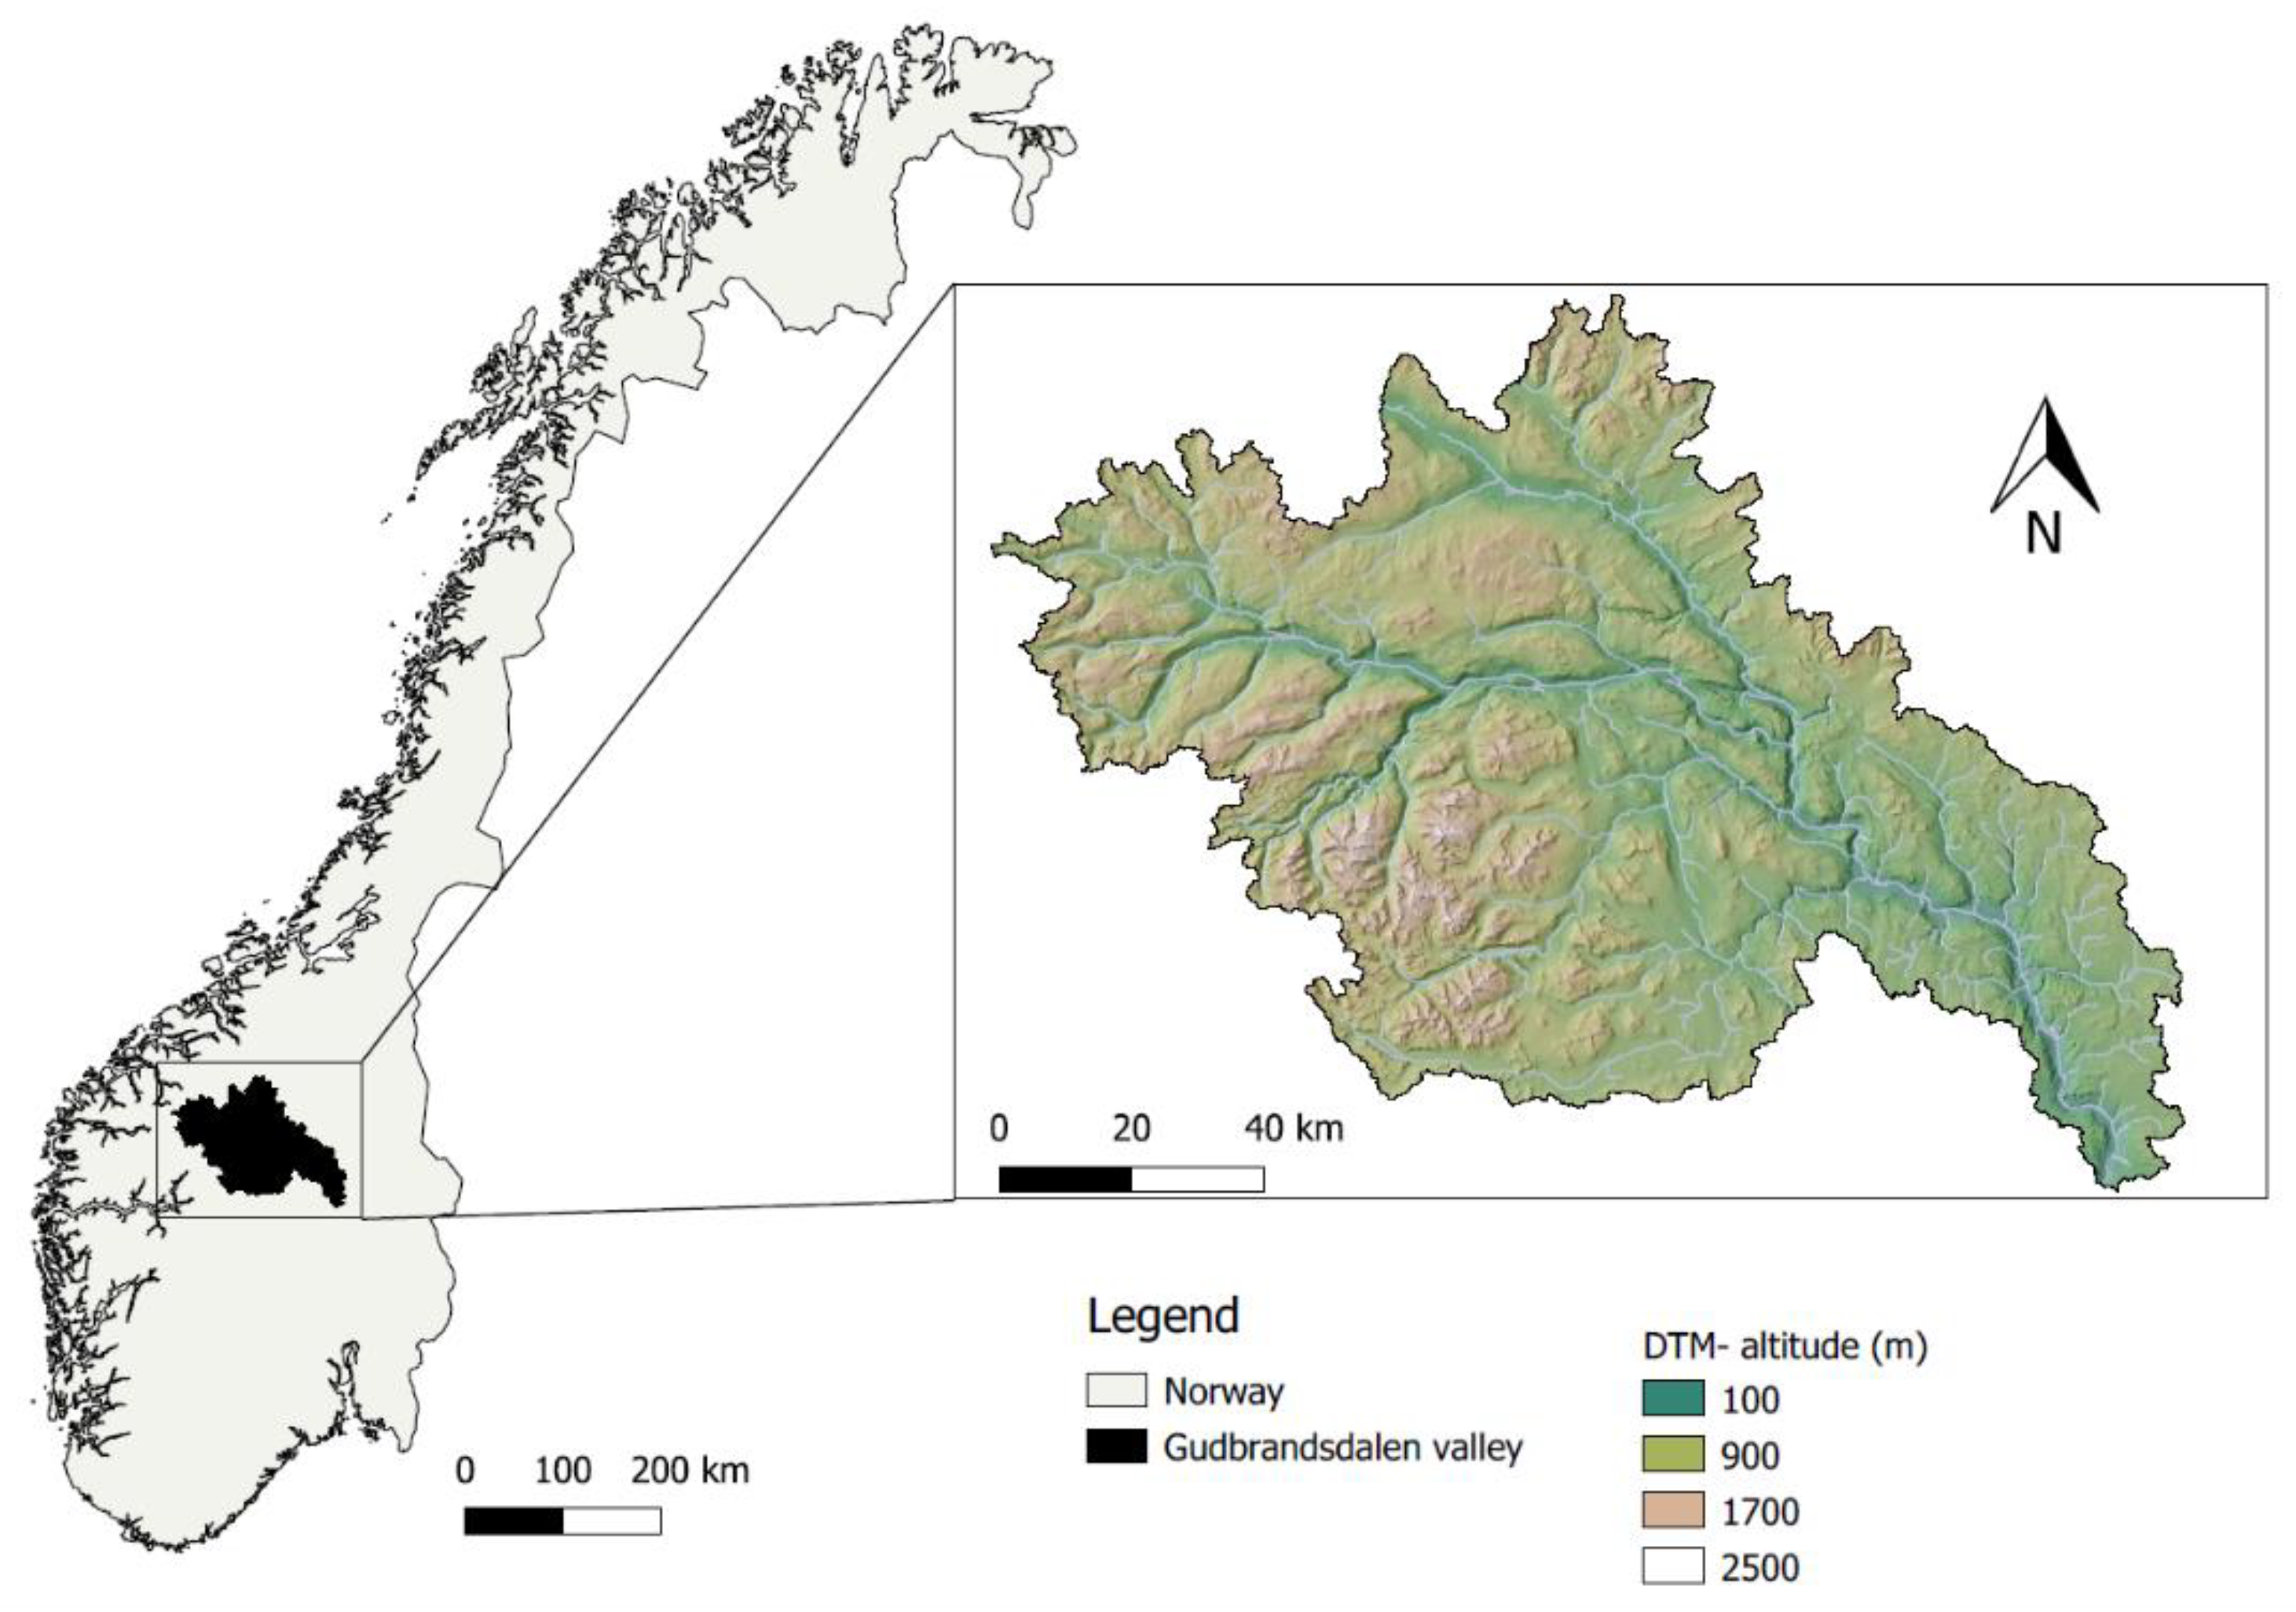
The Gudbrandsdalen catchment in the county of Oppland extends roughly 120 km upstream in a north-westerly direction from the city of Lillehammer in south-central Norway to a high altitude watershed delineated by the Scandinavian mountains (Figure 1). The catchment covers some 11594 km2, of which 1607 km2 are registered as productive forest [27]. The valley floors constitute sparse settlement, infrastructure, agriculture and meandering plains, while the valley sides are typically afforested, and transition to areas of exposed bedrock, sheer cliffs or tundra vegetation as they emerge above the tree line. Absolute altitudes of the valley floor vary from 130 m a.s.l. at the outlet to the Mjøsa lake, to 700 m at the town of Dombås, while the catchment is delineated by ridges around 1500 m a.s.l and peaks close to 2000 m a.s.l. Despite low annual precipitation (300 mm on the valley floor in upper reaches to 700 mm a−1 in lower reaches), the catchment experiences severe intermittent flooding and consequently natural hazard events of varying magnitudes. In two exceptional years of the past decade, 2011 and 2013, flooding and a high occurrence of landslides led to widespread damage to infrastructure and settlements in the valley [28]. Given the high forest cover on the valley sides, attention has been given to the potential for reducing the risk of untoward effects of forest management, especially harvesting operations and the construction of forest roads, on national infrastructure.
2.1.1. Harvesting Methods Used and Anticipated Activity Levels
Gudbrandsdalen valley has been an important source of Norwegian timber historically. Timber harvesting in this region occurs throughout the year, with the majority of the volume (>95%) being harvested mechanically with harvesters and forwarders. While patch cutting was once more commonplace, efficiency demands on expensive machines working with relatively small trees required clearcutting of larger areas [29]. When operating in steep conditions, access to the same ground-based machines can be provided through excavating temporary extraction trails [20], a practice which is environmentally contentious, but provides a safe and physically undemanding work place. Alternatively timber on steep slopes can be harvested through motor-manual felling and extraction using a tower or excavator based cable-yarder [30], which has little to no impact on the soil, but is labour-intensive and expensive.
2.1.2. Terrain
A 10 m resolution digital terrain model (DTM) was sourced from the national provider [31] and used as the basis for all topographic analyses. The Upslope tool from SAGA v2.3.0 (System for Automated Geoscientific Analyses) was used to determine the catchment area feeding to a point placed upstream of the Mjøsa lake in the lowest part of the valley (575,251 m E, 6,781,973 m N, UTM32), using QGIS software [32].
2.2. Productive Forest Area Masking
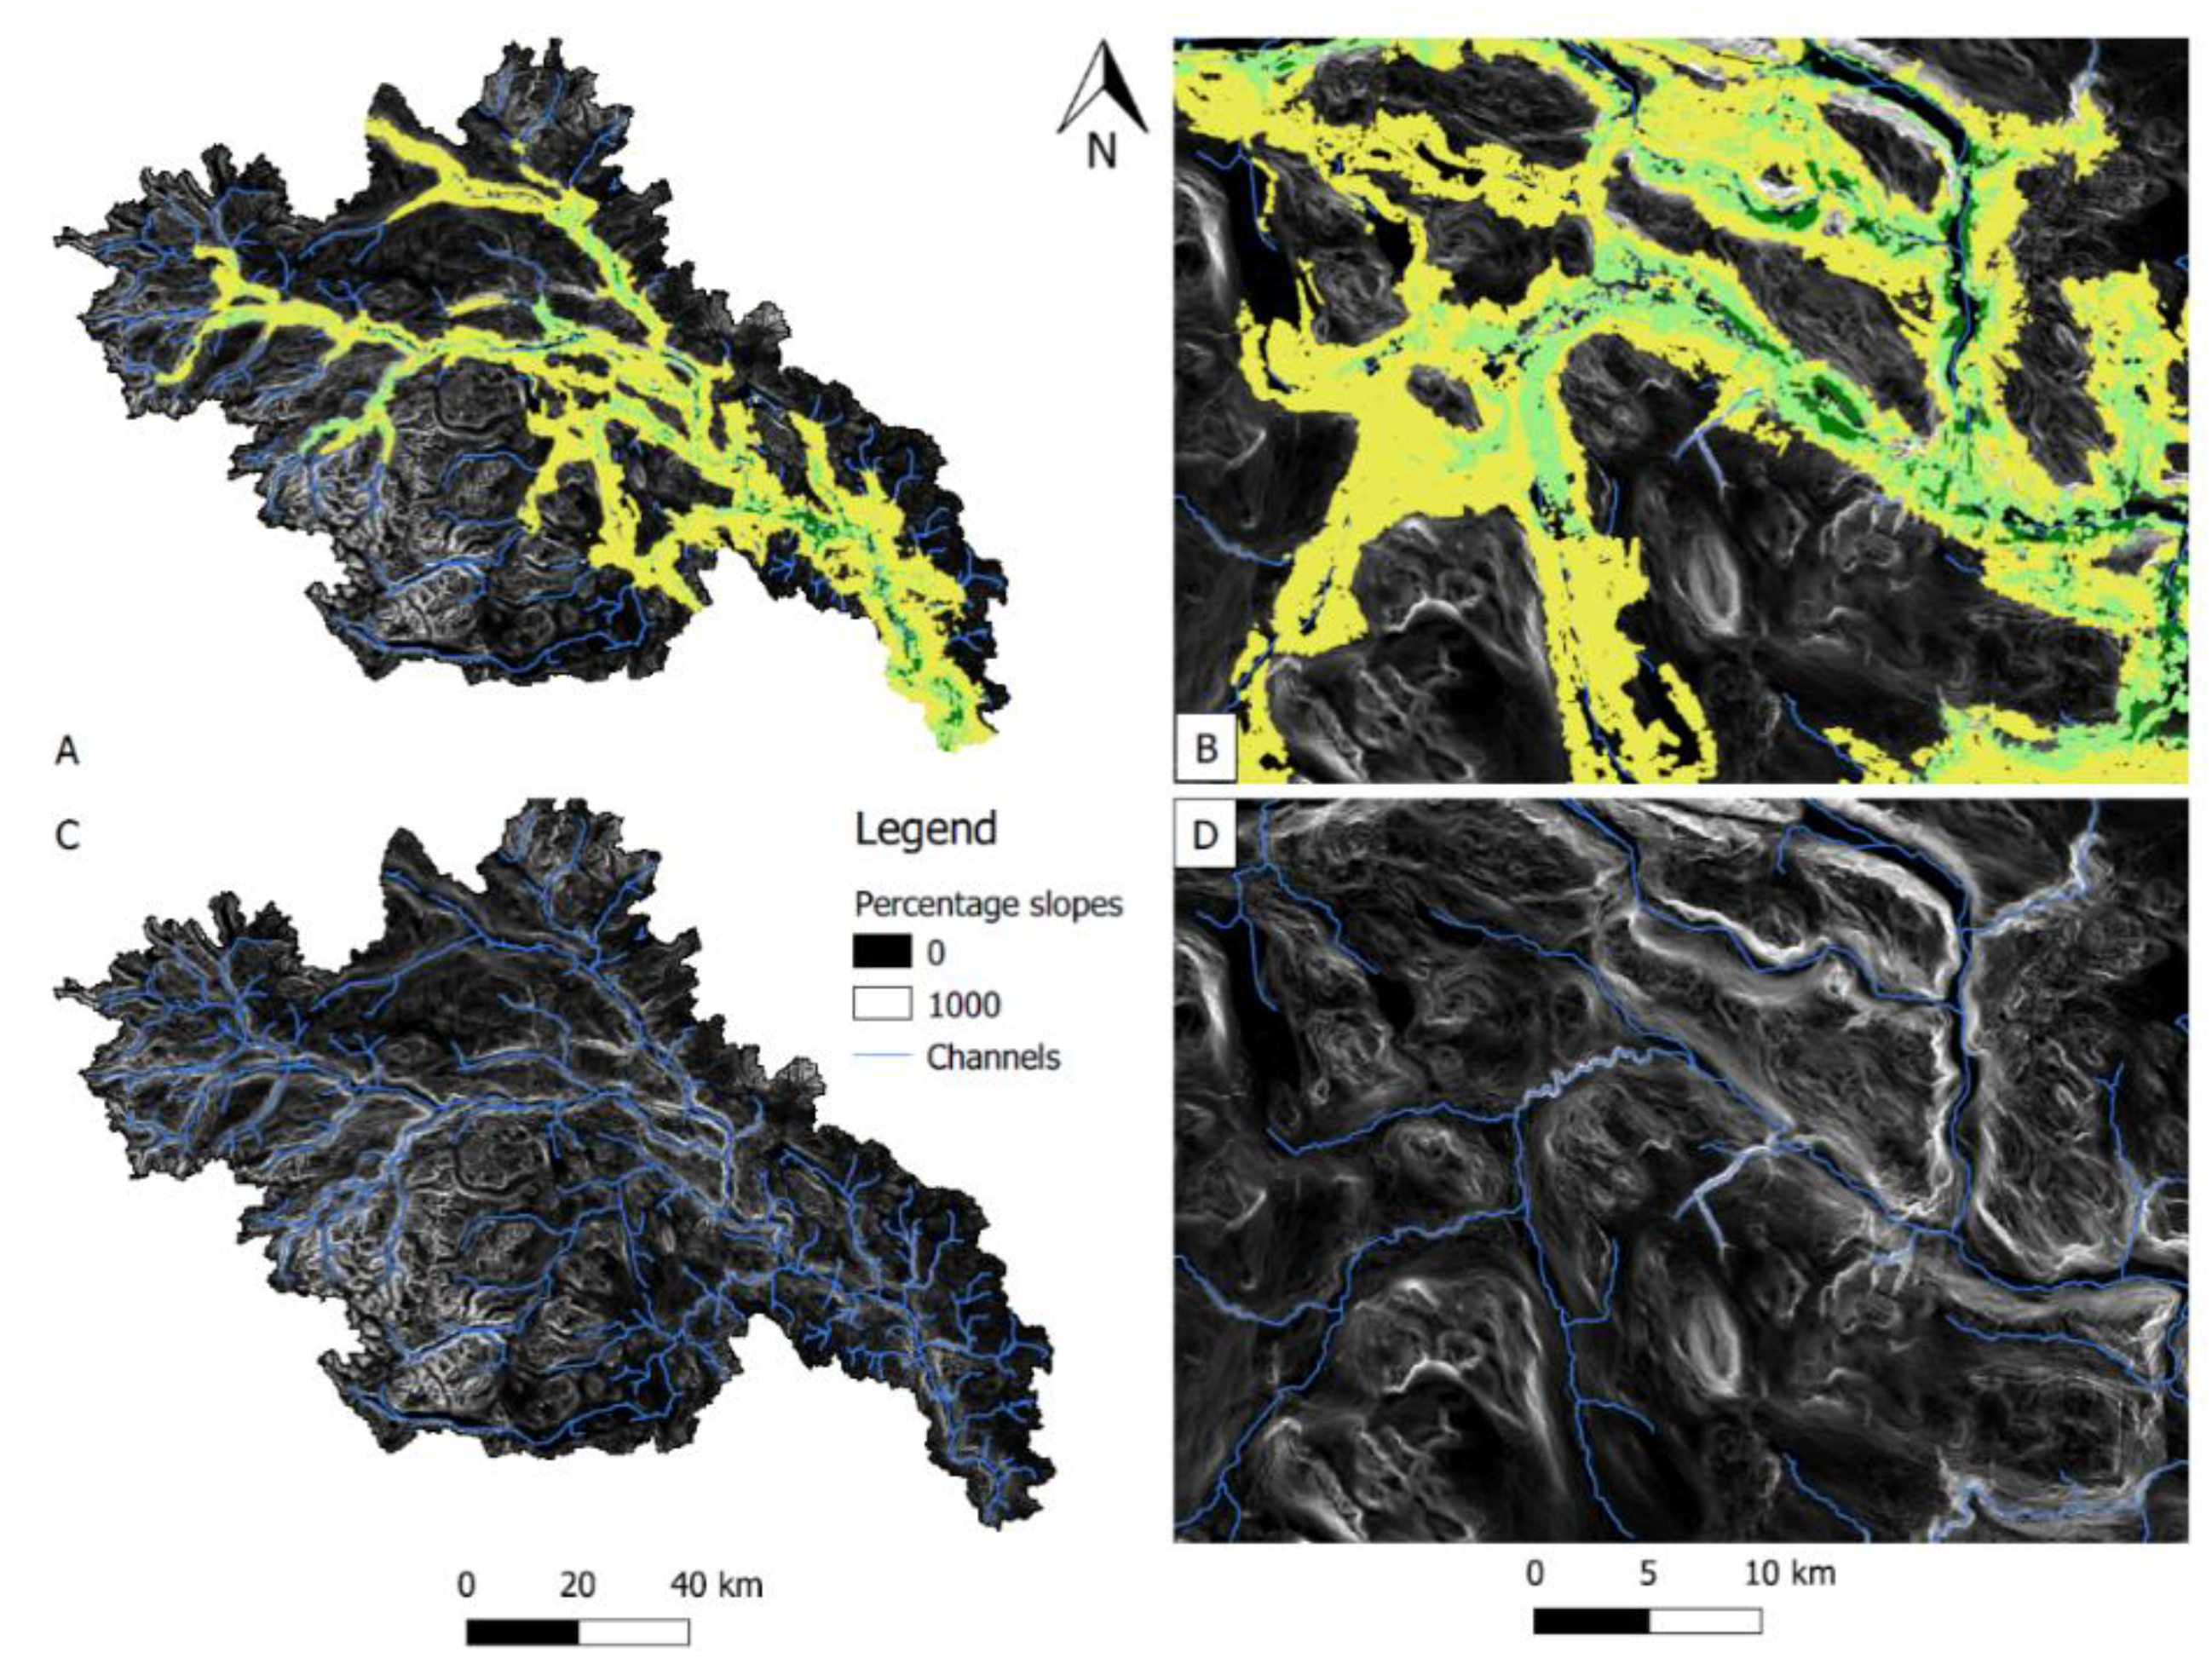
In order to restrict the analysis to commercial harvesting, 1607 km2 (13.8% of the total catchment area) representing the productive forest (>1 m3 ha−1 a−1) were analysed, extracted on the basis of a national forest site index classification [27]. This is a vector map of the forest areas of Norway with a scale of 1:5000. The forest areas are classified into three classes of mean annual increment (high: more than 5 m3 ha−1 a−1, medium: between 3 and 5 m3 ha−1 a−1, and low productivity: between 1 and 3 m3 ha−1 a−1), with a clear link between productivity and topography (Figure 2).
2.3. Global Forest Watch (GFW) Data and Orthophoto Acquisition
The FCL version 1.5 dataset was downloaded [24] and converted to a vector format. The resolution of each pixel at the latitude of the case study was 20.97 m. The vectorisation of FCL was done by merging all adjacent pixels with same date (year) of forest loss. Then, the accuracy of the FCL map was assessed based on FCL area, commissions (false positives), omissions (false negatives) and geometry error.
Multi-temporal aerial images from the Norwegian Mapping Authorities web service [33] were used in making this assessment as they provided detailed images (resolution 0.25 m) taken at varying time intervals in different parts of the catchment.
2.4. Methodological Workflow
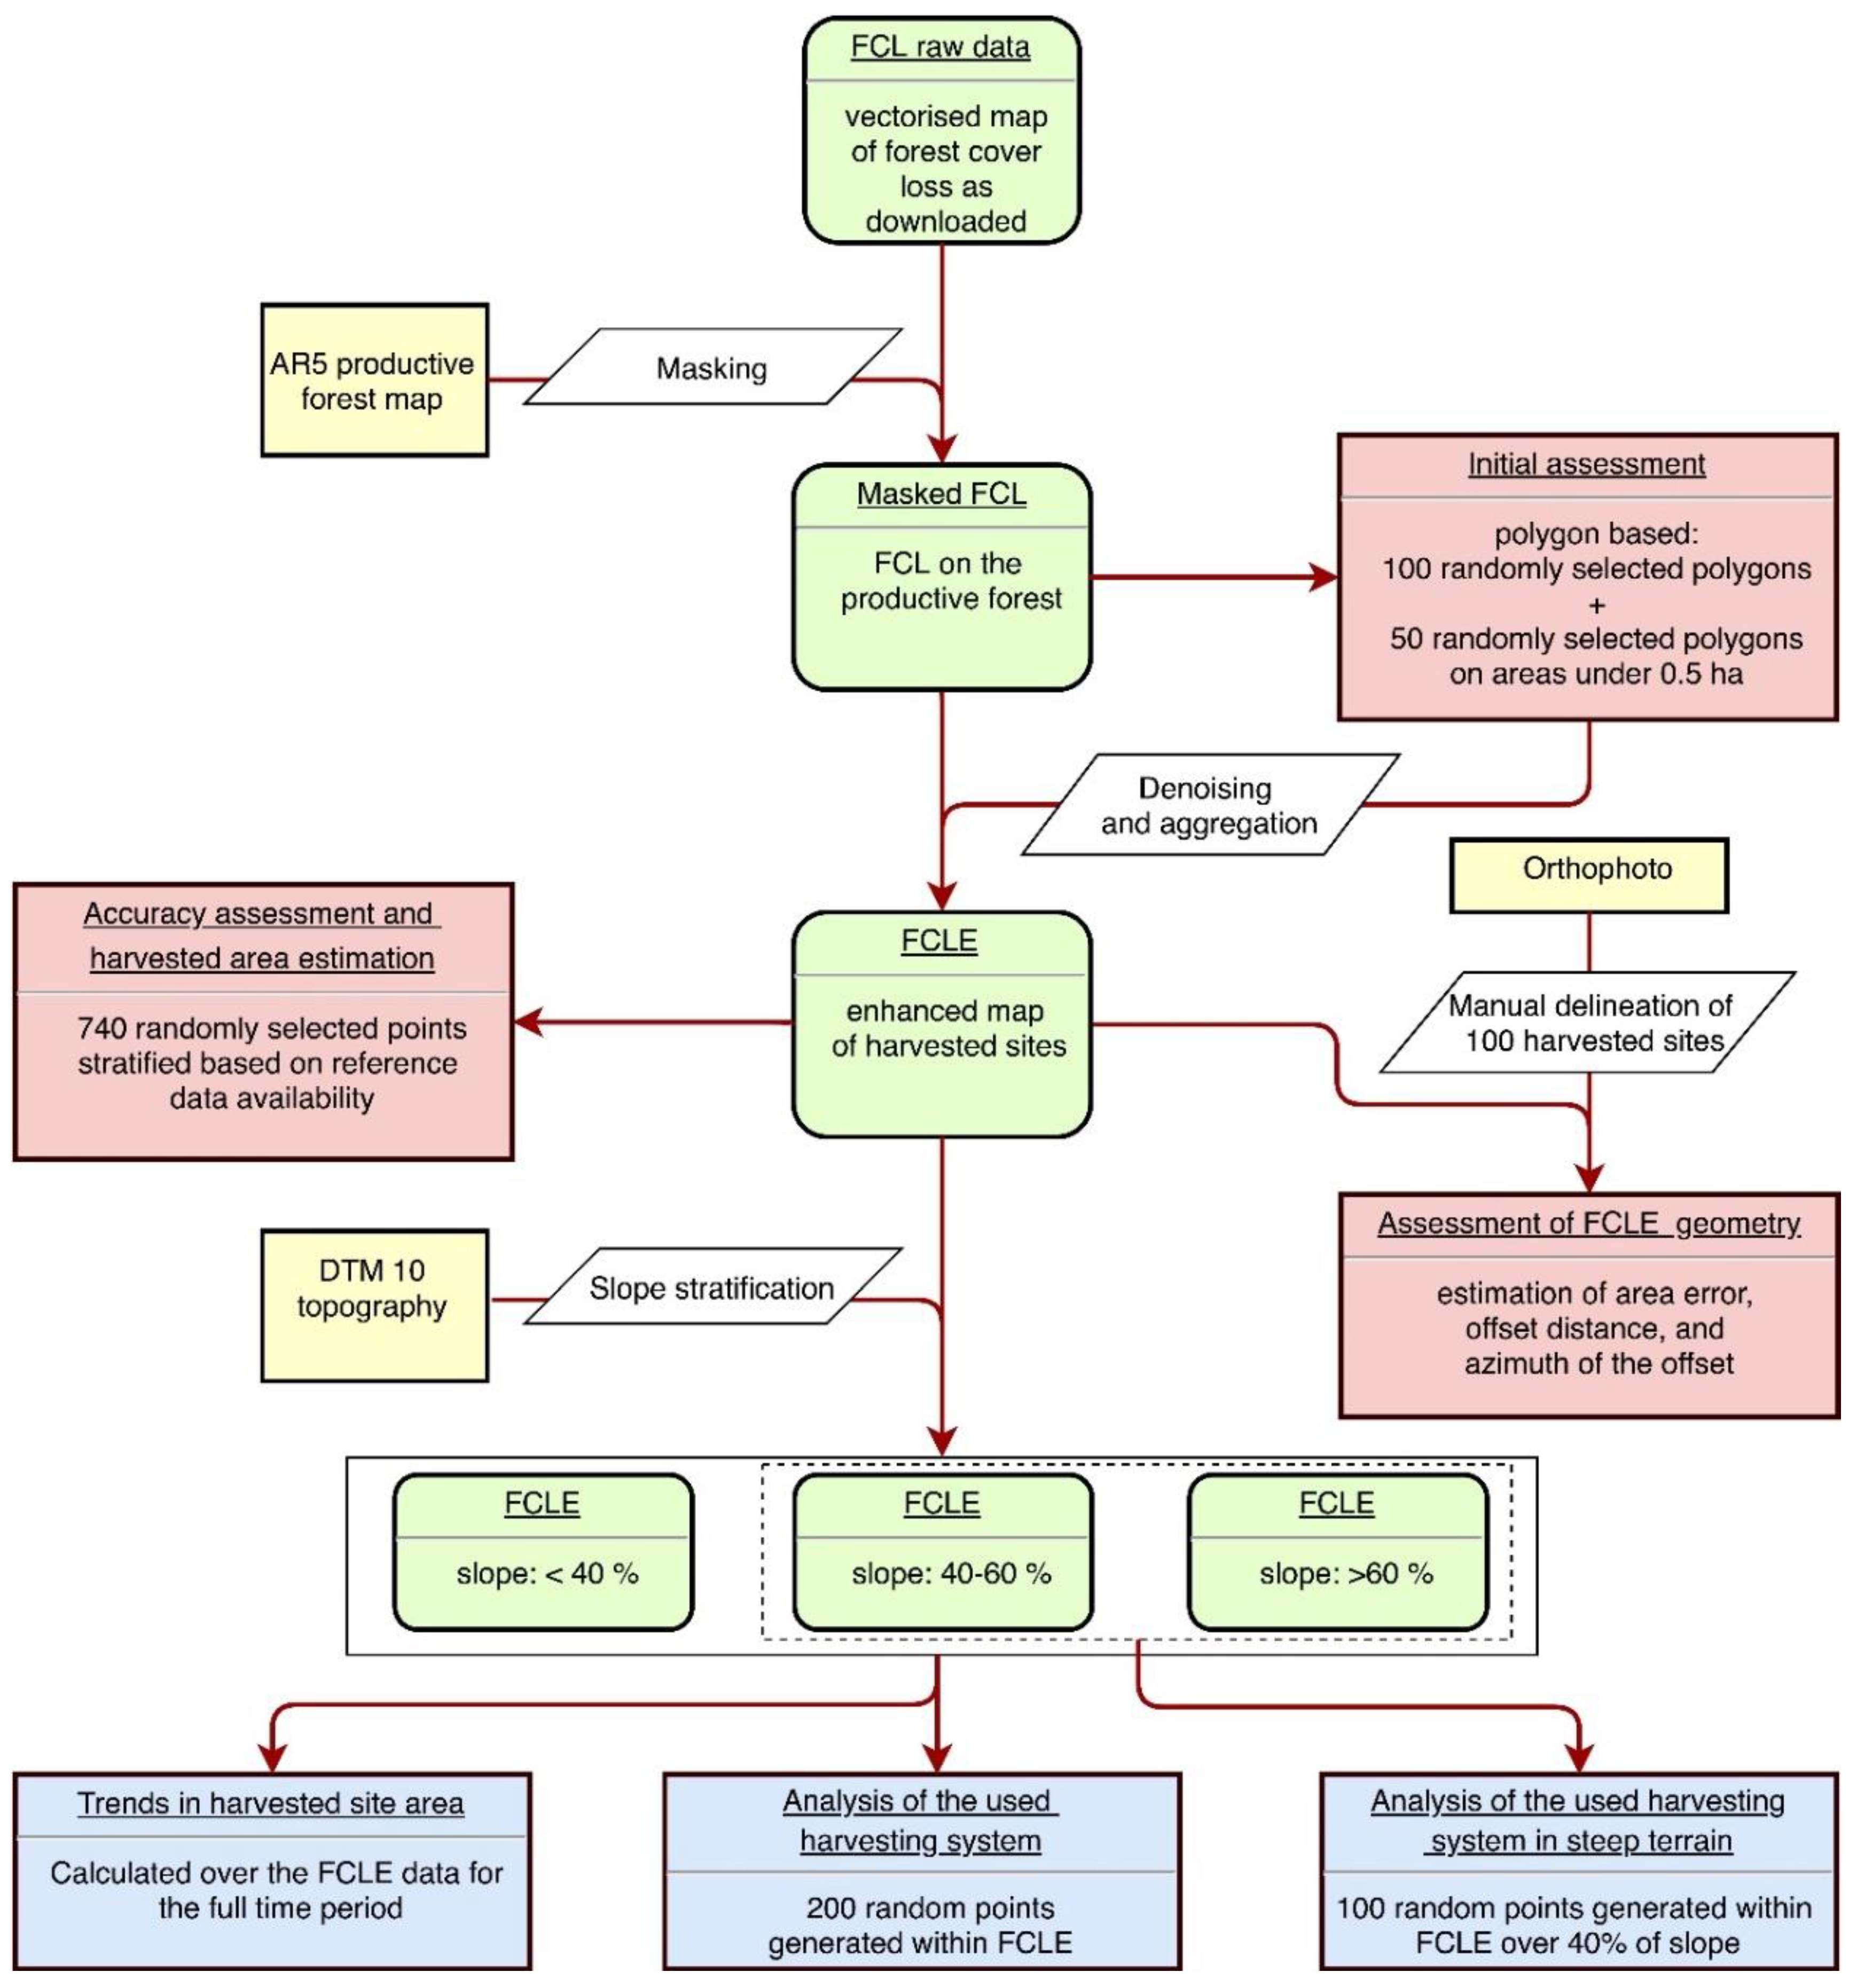
The workflow comprised the development of the forest cover loss enhanced map (FCLE), its assessment, and its application in analysing harvesting systems and trends (Figure 3).
2.4.1. Enhancing the Forest Cover Loss (FCL) Map
Initial Assessment
Commission errors (areas reported in the FCL map that still showed dense forest cover in an orthophoto) were assessed a priori in order to confirm the hypothesis that small FCL polygons were causing small random errors. One hundred FCL polygons were selected by generating 100 random points in the bounds of the polygons masked FCL data set. Each of these polygons was visually assessed against the orthophoto and it was determined whether the polygon represented a harvested site or not.
Six cases out of the 100 selected polygons were commission errors. Five of those polygons were smaller than 0.5 ha. Therefore, a second selection of 50 polygons was similarly generated over the set of polygons under 0.5 ha in order to intensify the assessment in this subset. In this subset, 17 polygons (34% of the polygons) were commission errors, contributing to salt and pepper noise. Of the remaining 33 cases, 31 were adjacent to larger forest cover loss areas, and due to differences in the year of registration, they were vectorised as different features. The preliminary results showed a need for merging small polygons to larger polygons in close vicinity (aggregation) and eliminating small isolated polygons (thresholding).
Denoising and Aggregation
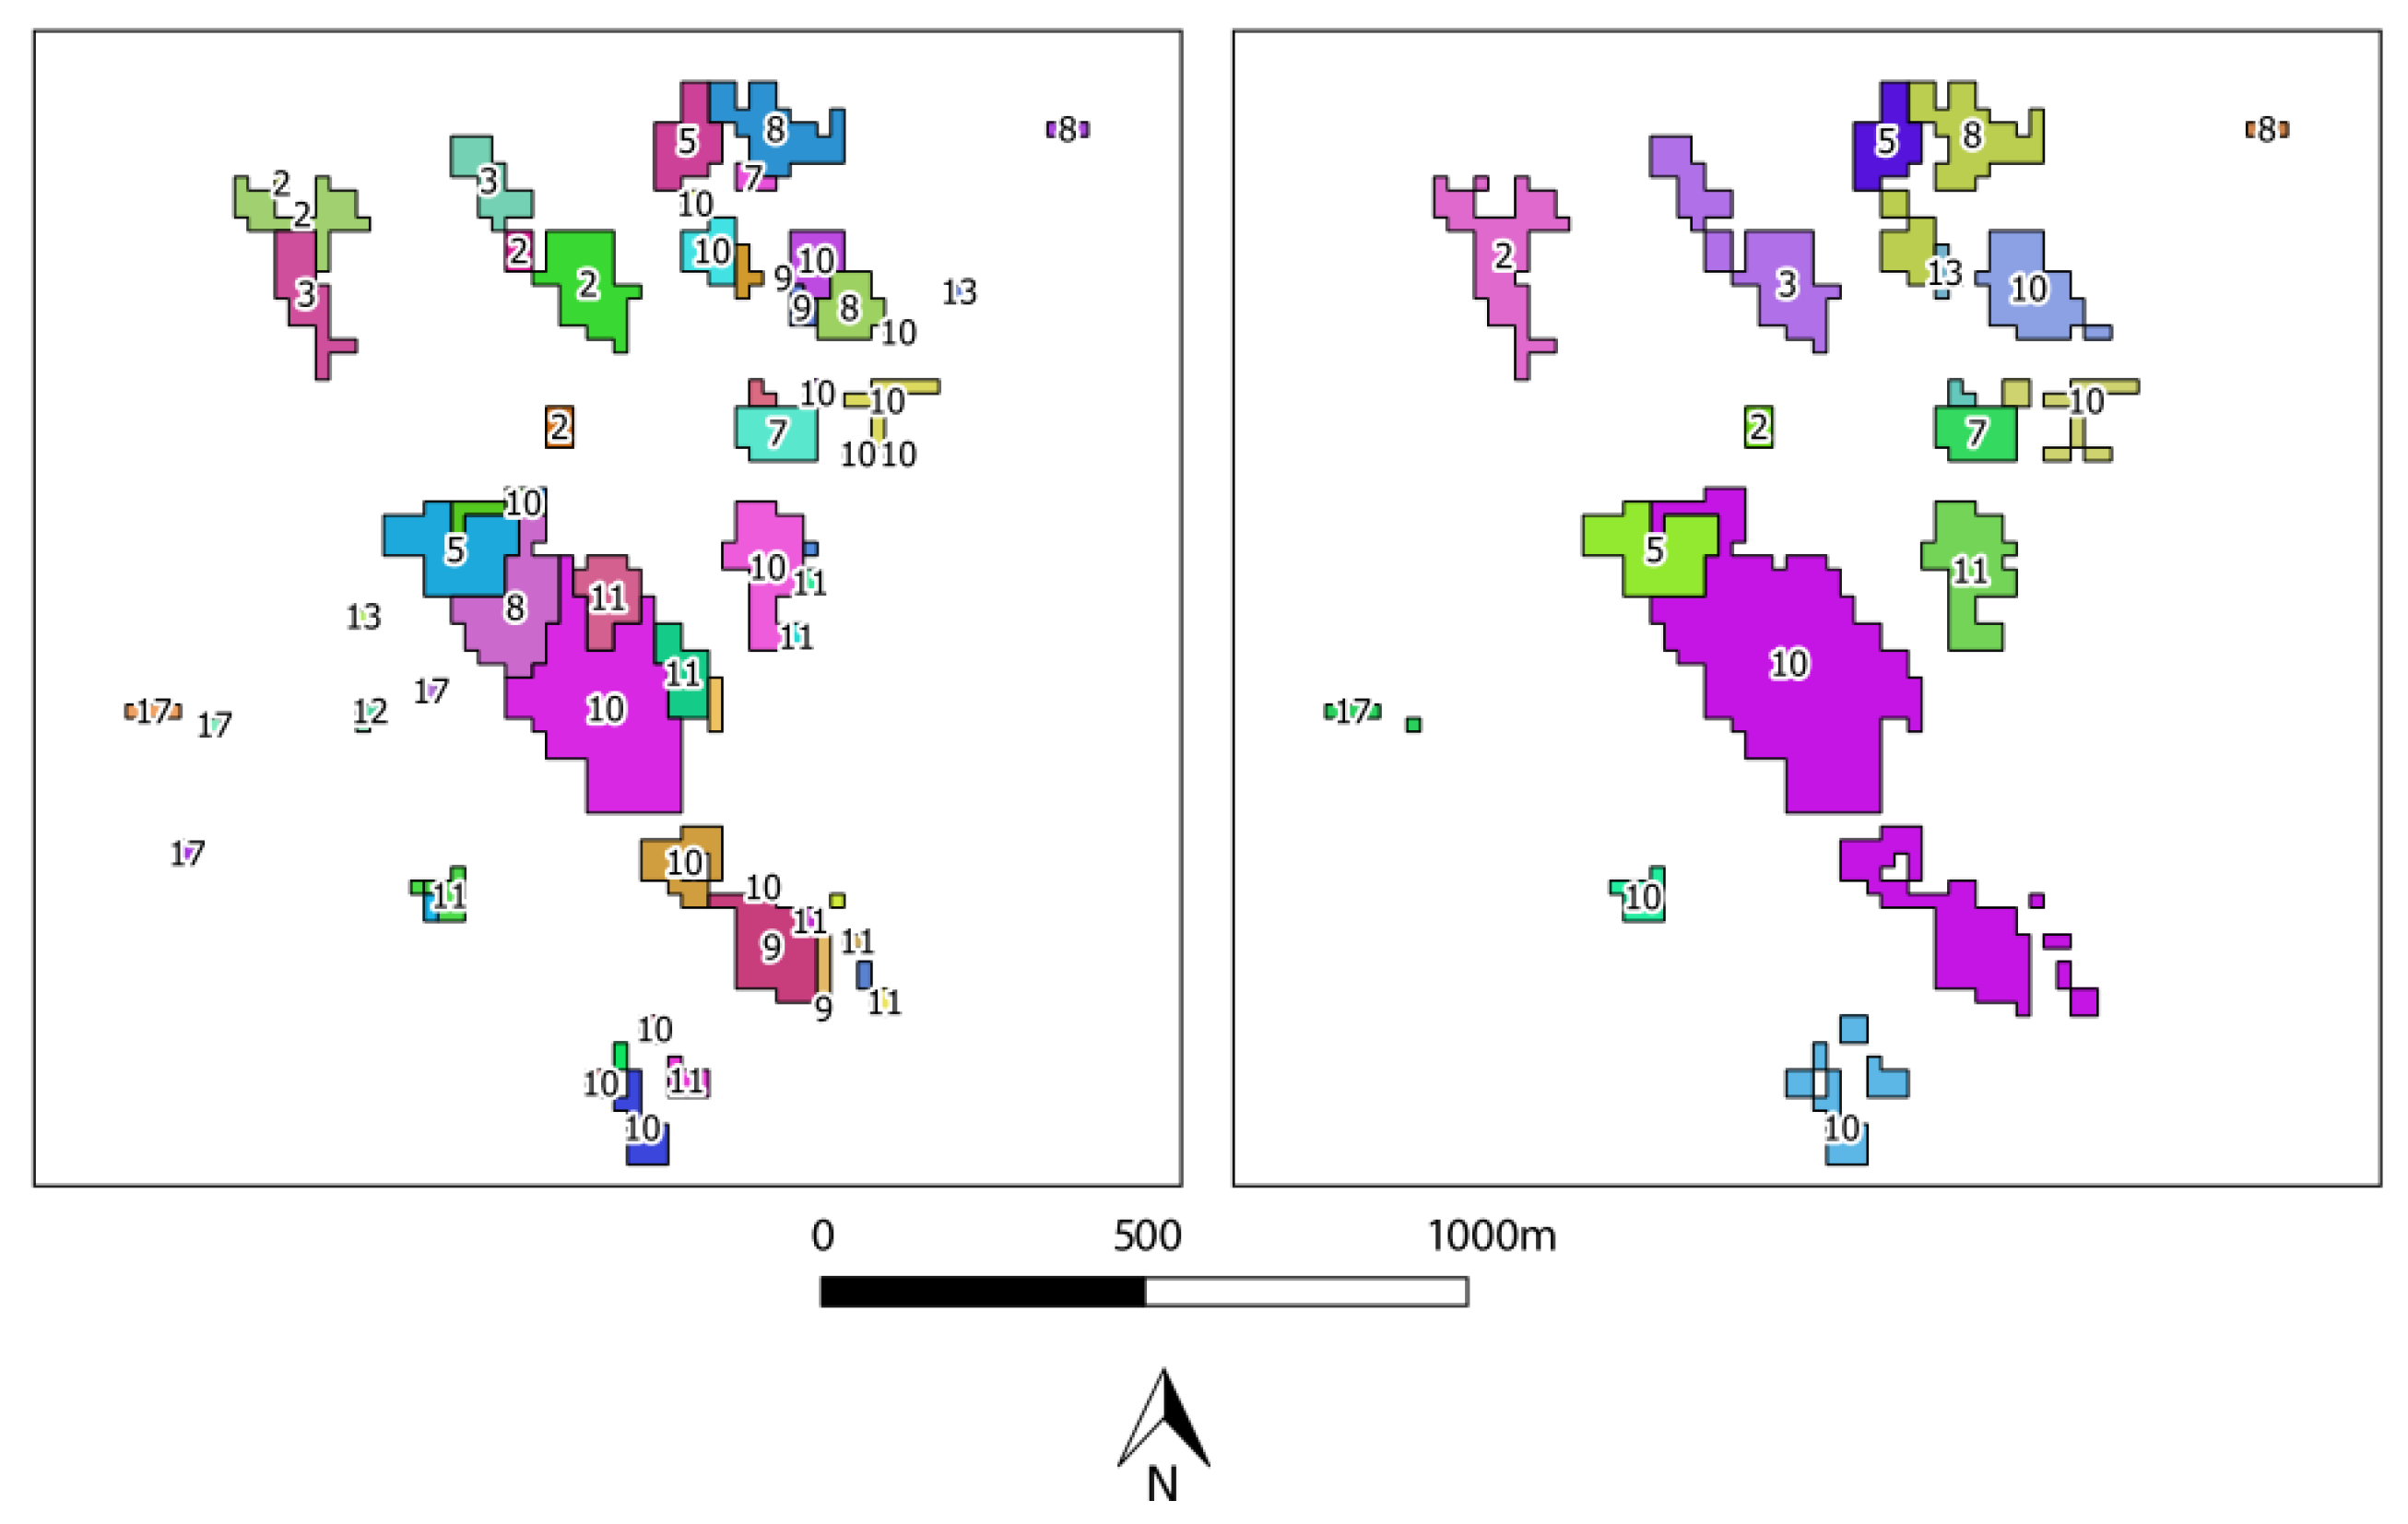
A Python QGIS (PyQGIS) script was developed to aggregate disjointed small polygons into contiguous harvested site representations (Figure 4). This process consisted of three iterations, where all neighbouring features within 50 m Euclidean distance were aggregated to the largest neighbour, if their forest loss date was within two years of that of the larger polygon. After this aggregation, polygons representing fragmented forest cover loss areas smaller than 0.1 ha were removed. This value represents a practical threshold given that in Norway there are almost no commercially harvested areas below this spatial scale, while it showed the highest probability of commission errors in the initial analysis. This resulted in a total of 3220 polygons (269.1 ha) smaller than 0.1 ha being eliminated. Overall, the aggregation resulted in a reduction from 20,250 polygons (10,012.4 ha) into 6093 harvesting site representations (9743.3 ha, Figure 5). The resulting map from the aggregation into contiguous harvesting site representations and elimination of small, fragmented polygons was termed the forest cover loss enhanced map (FCLE). Omission and geometry errors were assessed on this map.
2.4.2. Accuracy Assessment and Area Estimation
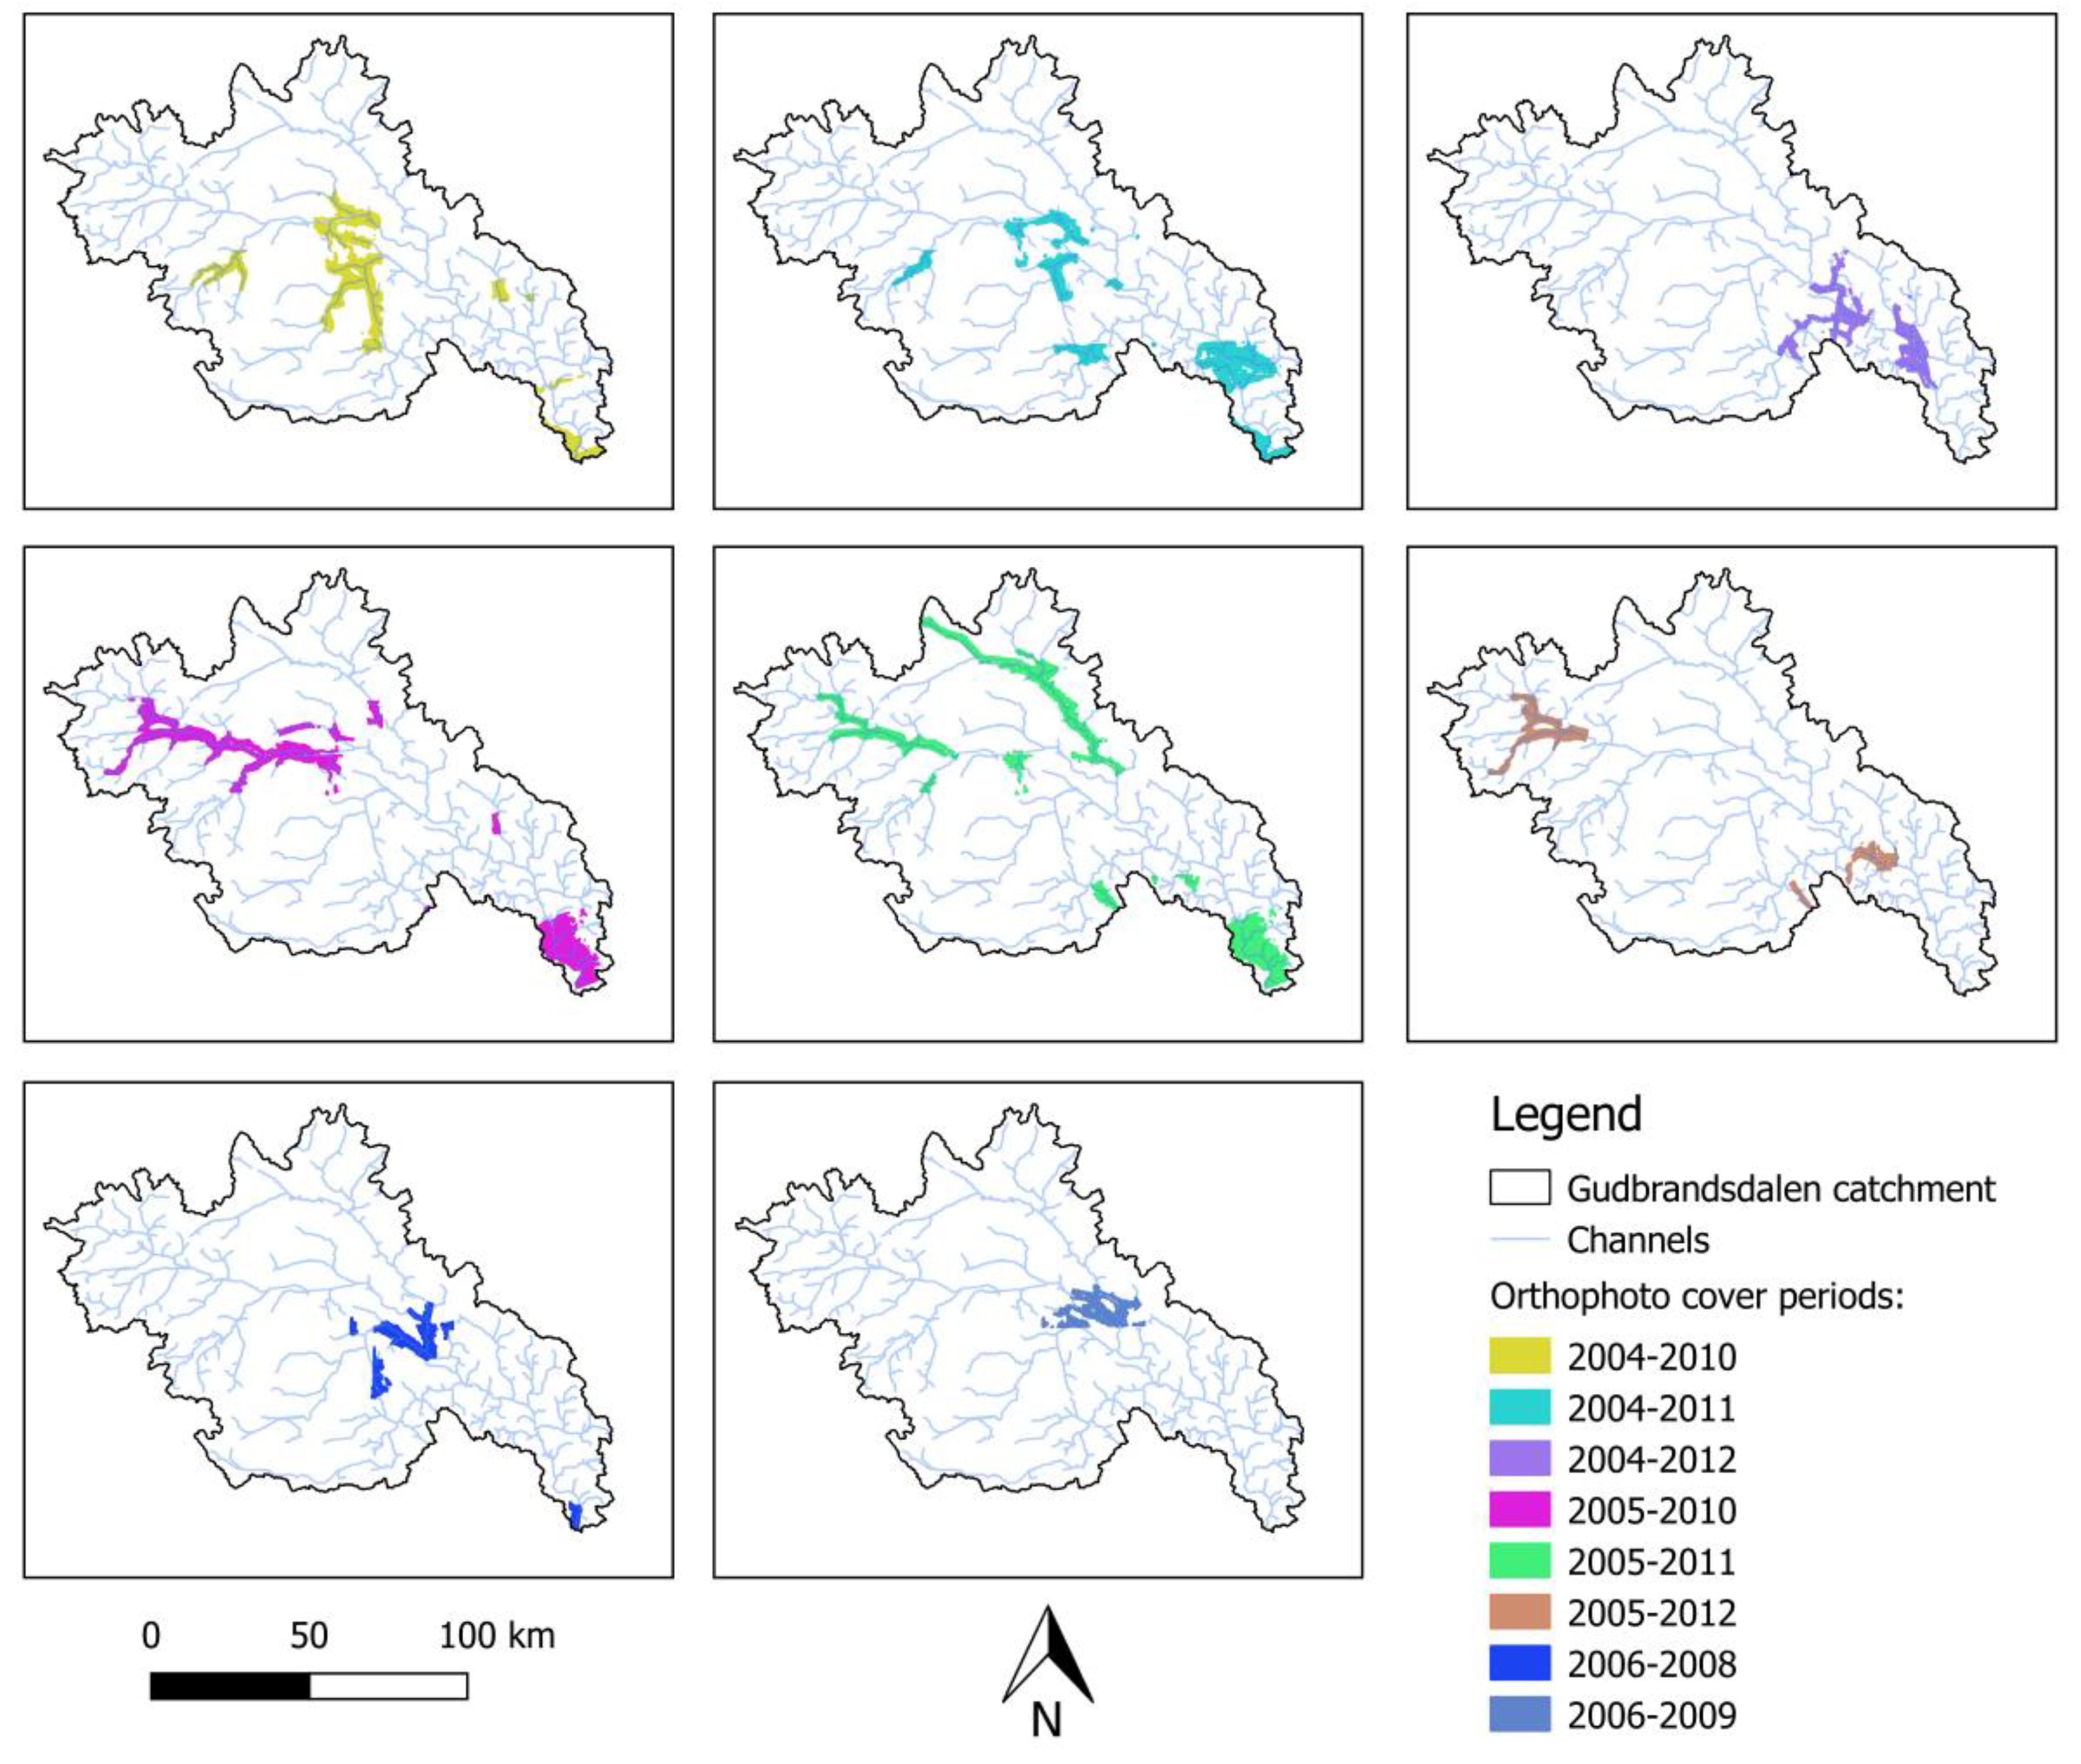
The accuracy of the FCLE map was assessed against the available aerial imagery. The forest area in the Gudbrandsdalen valley was stratified based on the aerial imagery cover on the productive forest. Full aerial image coverage existed along the valley at varying intervals since 1963, but there were no total cover campaigns flown in the period studied, year 2000 to 2017. Therefore, eight strata of differing spatial extent were created (Figure 6). A total of 737 random points were located over the eight strata (‘2004–2010’, ‘2004–2011’, ‘2004–2012’, ‘2005–2010’, ‘2005–2011’, ‘2005–2012’, ‘2006–2008’, and ‘2006–2009’). As an example, stratum ‘2004–2010’ means that aerial images from summer 2004 (time one) and 2010 (time two) were available as reference data. The canopy cover loss within a 441 m2 square (a hypothetical FCLE pixel) centred on each reference point was estimated from the aerial images of time one and time two. A change that resulted in a canopy cover of less than 25% was the threshold to define a forest cover loss in the reference data. Statistics describing the accuracy of the FCLE map (omission and commission errors, kappa) were derived from the resulting confusion matrix.
The proportion of the area harvested was estimated using post-stratification [34]. This was done for the strata that cover the timeframe from the beginning of 2005 to the middle of 2011 (6.5 years) as one group i.e., the strata ‘2006–2008’, and ‘2006–2009’ were not included in the post-stratification. The selected reference data for post-stratification cover approximately 90% of the productive forest.
2.4.3. Assessment of Forest Cover Loss Enhanced (FCLE) Geometry
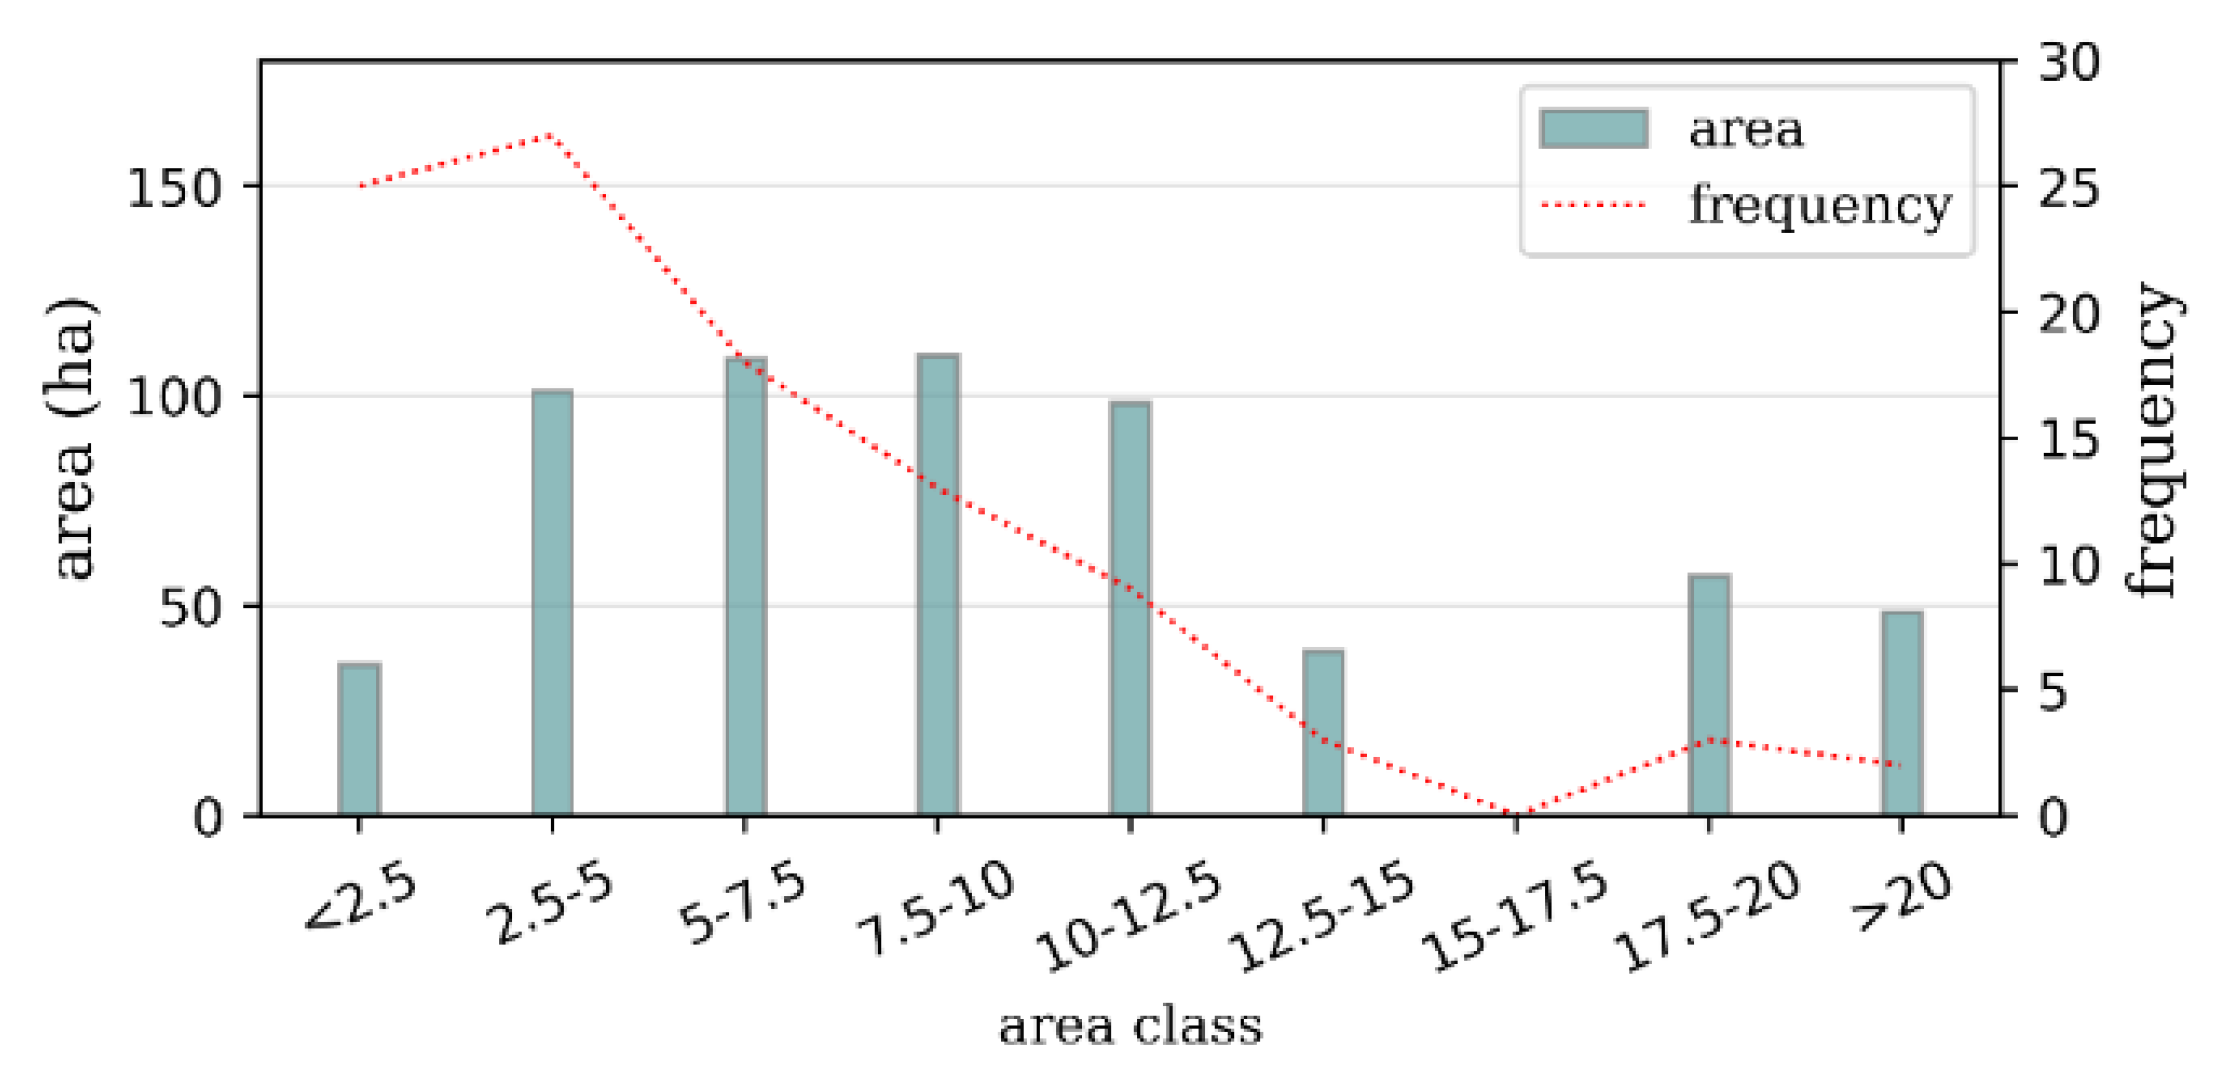
One hundred contiguous harvested sites were selected from the aerial images and manually delineated in order to compare them with the harvested site representation from the FCLE map. Contiguous harvested areas can include more than one forest management unit. The area distribution of the delineated sites is shown in Figure 7. From this data set, two assessments were conducted: omission errors and geometries.
Omission errors occur when a manually delineated harvested site is not represented in the FCLE dataset. The geometry of the FCLE mapped representations, and the manually delineated harvested sites were compared for the not omitted stands. For each manually delineated harvested site, mean and maximum slopes, mean and maximum altitude, stand shape (isoperimetric quotient, Formula (1)), area, and coordinates of their centroid were calculated. From the equivalent harvested site representations on the FCLE data, area and coordinates of their centroids were recorded, in order to compare their geometries (area and centroid coordinates).
Three multiple linear regressions were constructed from the same independent variables, with distance between centroids, azimuth between centroids, and percentage of area error (Formulas (2) and (3)) as response variables. Additionally, summary statistics (root mean square error [RMSE], and average) were calculated for the area error and percentage of area error.
where Yk is the response variable (Y1 distance between centroids, Y2 azimuth of the offset, and Y3 percentage area error). βi is the coefficient of the variable and the error of the model. meanSlope, maxSlope, meanAlt, Isoper and Area, refers to the mean percentage slope, maximum percentage slope, mean altimetry, isoperimetric quotient and area of the manually delineated polygon. An assessment was also made on whether the area error showed trends over time.
2.4.4. Analysis of Harvesting Operations
Trends in the total areas harvested and the size of individual harvested sites were analysed over time, and the harvesting system used in each slope category was assessed using the full FCLE map.
Analysis of the Harvesting Systems Used
Two hundred random points were generated in the bounds of the FCLE map to assess the harvesting system used. The QGIS function Random points in layer bounds was used for this selection. Each harvest site was visually interpreted based on aerial imagery. The harvesting activities were classified based on visual evidence of the technology used: obvious wheel tracks from wheeled machines (harvester and forwarder), wheeled machines and signs of temporary skid trail construction with excavators, and finally cable yarding (evidence of cable corridor impact on the ground). This required scrolling through a time series of aerial images to find the one best representing conditions after the harvesting date.
Analysis of the Harvesting Systems Used in Steep Terrain
An additional 100 points within FCLE polygons were generated in areas with slope over 40% in order to assess the trends of harvesting activity on steep terrain only. A stratification of the data was conducted a priori into two strata of mean slope intervals (40–60%, and steeper than 60% slope). These stratification bounds were determined by local practices, where sites of up to 60% slope are sometimes harvested with ground-based machines assisted by an excavator. Sites over 50% can be harvested by ground based or cable-based systems (tower yarders), while sites >60% slope would be expected, for safety and environmental reasons, to be harvested by cable yarders only. On the basis of the relevant aerial images, the harvesting system used was identified and recorded.
3. Results
3.1. Accuracy Assessment and Area Estimation of FCL and FCLE
3.1.1. Accuracy Assessment on pixel level and Area Estimation
Based on the 737 reference observations, a confusion matrix was created for the FCL and FCLE maps. The confusion matrices and accuracy metrics (Table 1) for both maps were exactly the same. This is not surprising as only very small polygons were removed from the FCL map to create the FCLE map and, by chance, no reference observation was located in any of the removed polygons. Despite overall accuracies of more than 98%, the quality of the maps can be described as moderate as can be seen from a kappa coefficient of 0.6. While errors of commission in the harvest area are below 1%, errors of omission were close to 48%.
Of 19 reference points where forest cover loss was observed, nine represented errors of omission (Table 1). Out of the nine cases, six were harvests with remaining seed trees (with a canopy cover <30%), one was a small clearcut <0.5 ha with very few remaining trees, and two were detected by FCLE, but the change was registered one year later than the time frame of the reference images. The harvested sites with remaining trees of the six omitted reference observations were partly detected by FCLE and the distance between the reference observation and the closest FCLE polygon boundary ranged between 9 and 150 m with an average of 42 m. The use of seed trees is a common harvesting practise in pine stands that facilitates natural regeneration but it does not in general cause omission errors in FCLE as a close look at Figure 8B reveals.
Only one commission error was observed. In this case, the reference observation was located within a small group of trees that was remaining after a harvest, which was correctly identified by FCLE. The tree group was big enough to result in more than 25% canopy cover in a hypothetical pixel around the reference point.
Reference data covering the time period from the beginning of 2005 to the middle 2011 cover ca. 90% of the total productive forest area of the catchment and were used to calculate the post-stratified harvest proportion. The post-stratified harvest proportion was 3.7% with a standard error of 0.5 percentage points or 12.7%. The average annual harvest proportion was, thus, 0.6%.
Three reference points were located on tractor roads that were built or extended in the studied period and were not detected by FCL and FCLE. Because the accuracy of detecting harvests was in the focus of this study, these three reference points were omitted from the accuracy assessment above. A confusion matrix including these three observations is given in Table 2, where the accuracy assessment of forest cover loss in general is presented.
3.1.2. Assessment of FCLE Geometry
Six of the 100 manually delineated harvested sites were not at all visible in the FCLE map. The same was true for the FCL map, except for one case. This case was a harvested site of 0.42 ha represented on FCL by a polygon smaller than 0.1 ha, and therefore was eliminated when enhancing the map. Five cases were on harvested sites with areas under 2.5 ha, and 1 case was in the category between 2.5 and 5 ha. The weighted area representation of these omissions was 3.9%.
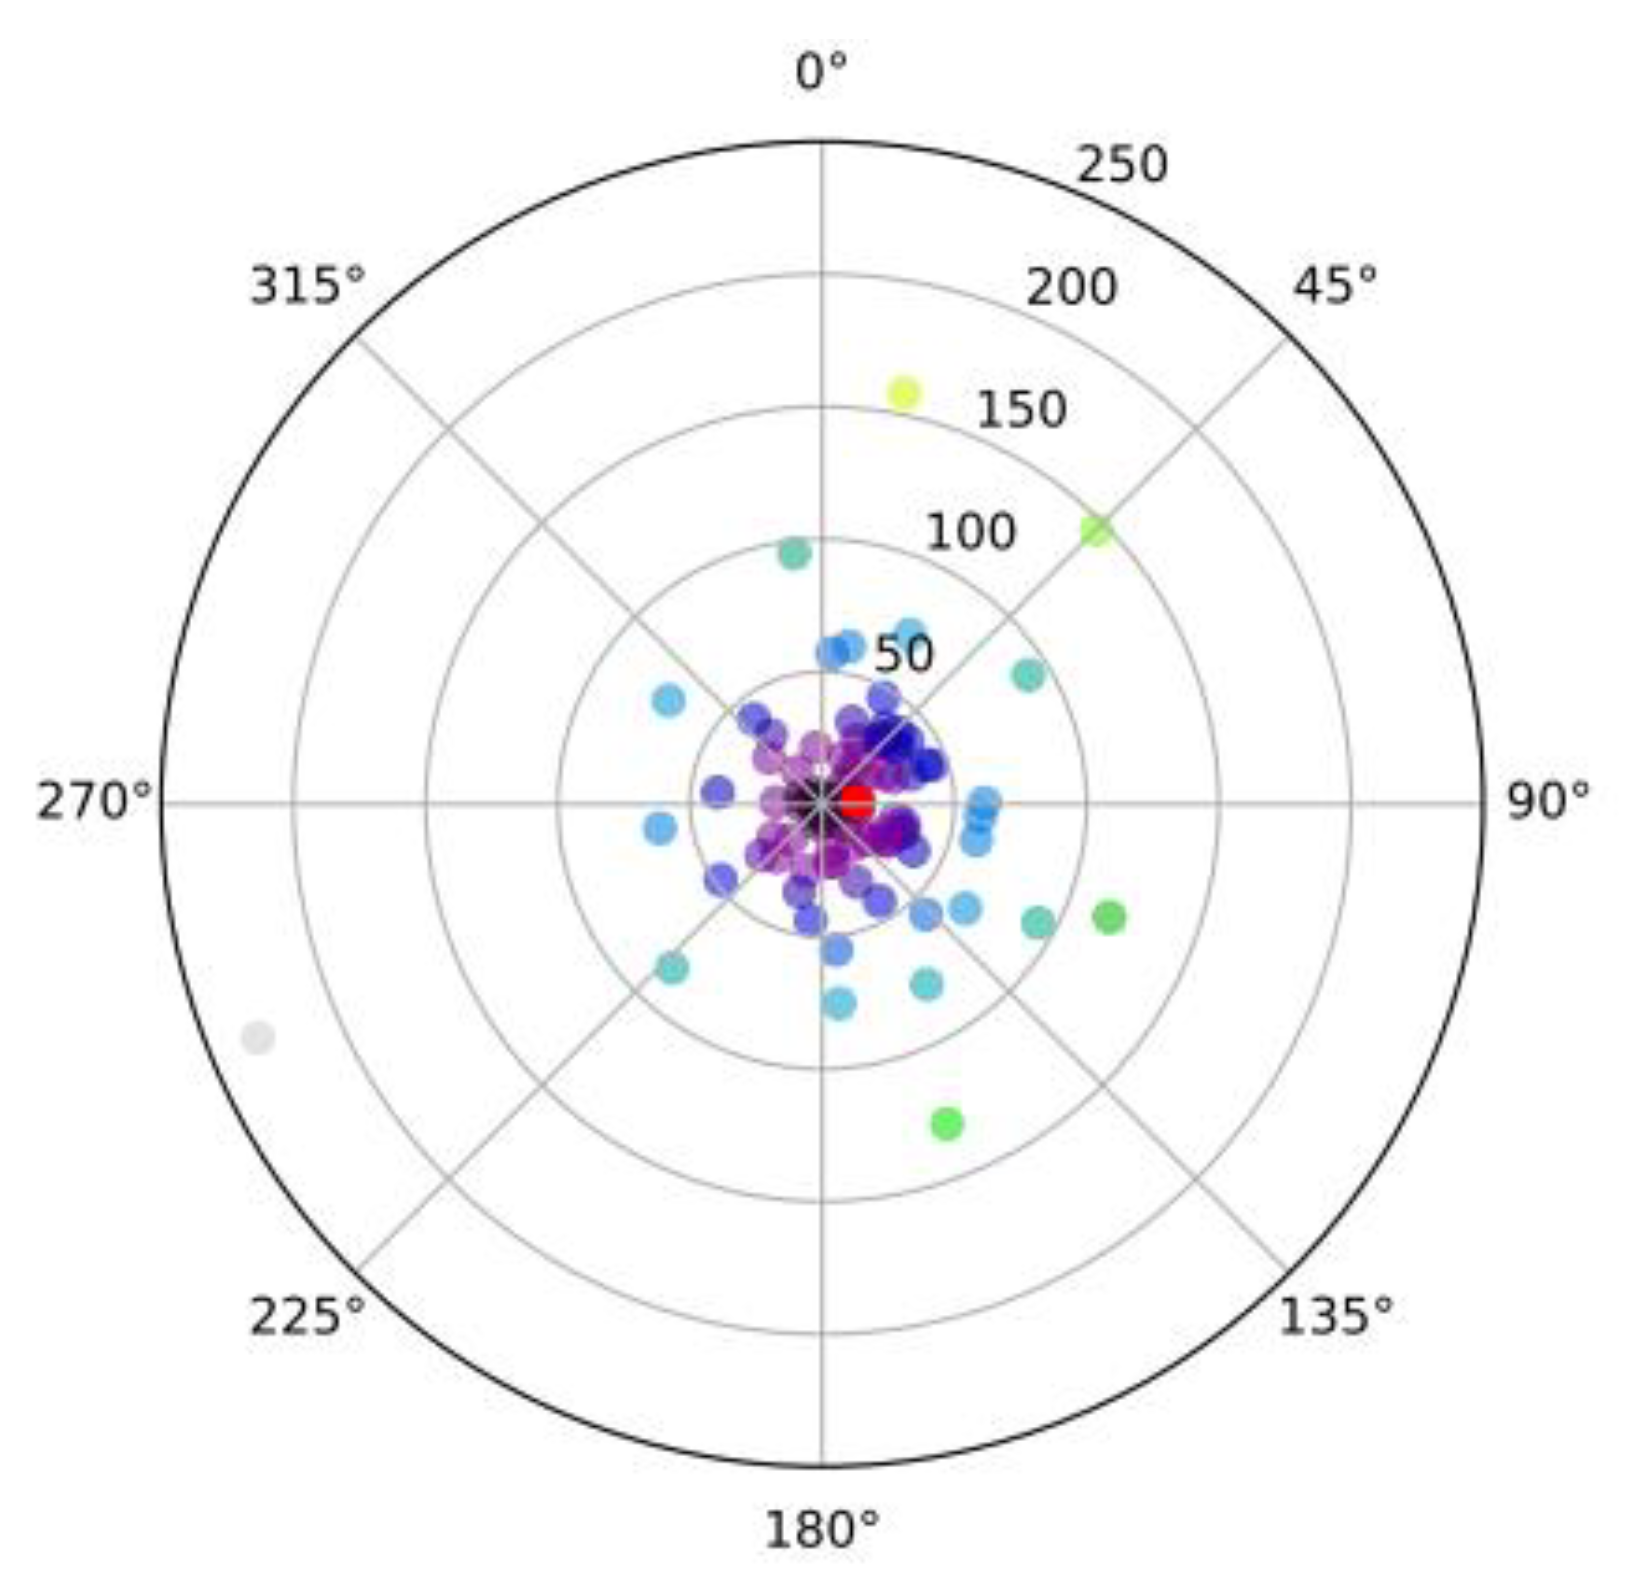
Table 3 summarises the difference between the 94 manually delineated harvesting sites that were available in the FCLE map. The size of the harvested site representations were on average underestimated by 29% compared with the manually delineated polygon size. The RMSE of the FCLE area was 3.4 ha, while the average size of the manually delineated harvested sites was 6.0 ha. The FCLE showed a net offset of 13.04 m to the east (86.6°), however there does not appear to be any systematic offset (Figure 9). The total area of the manually delineated harvested sites and of FCLE was 598 and 415 ha, respectively.
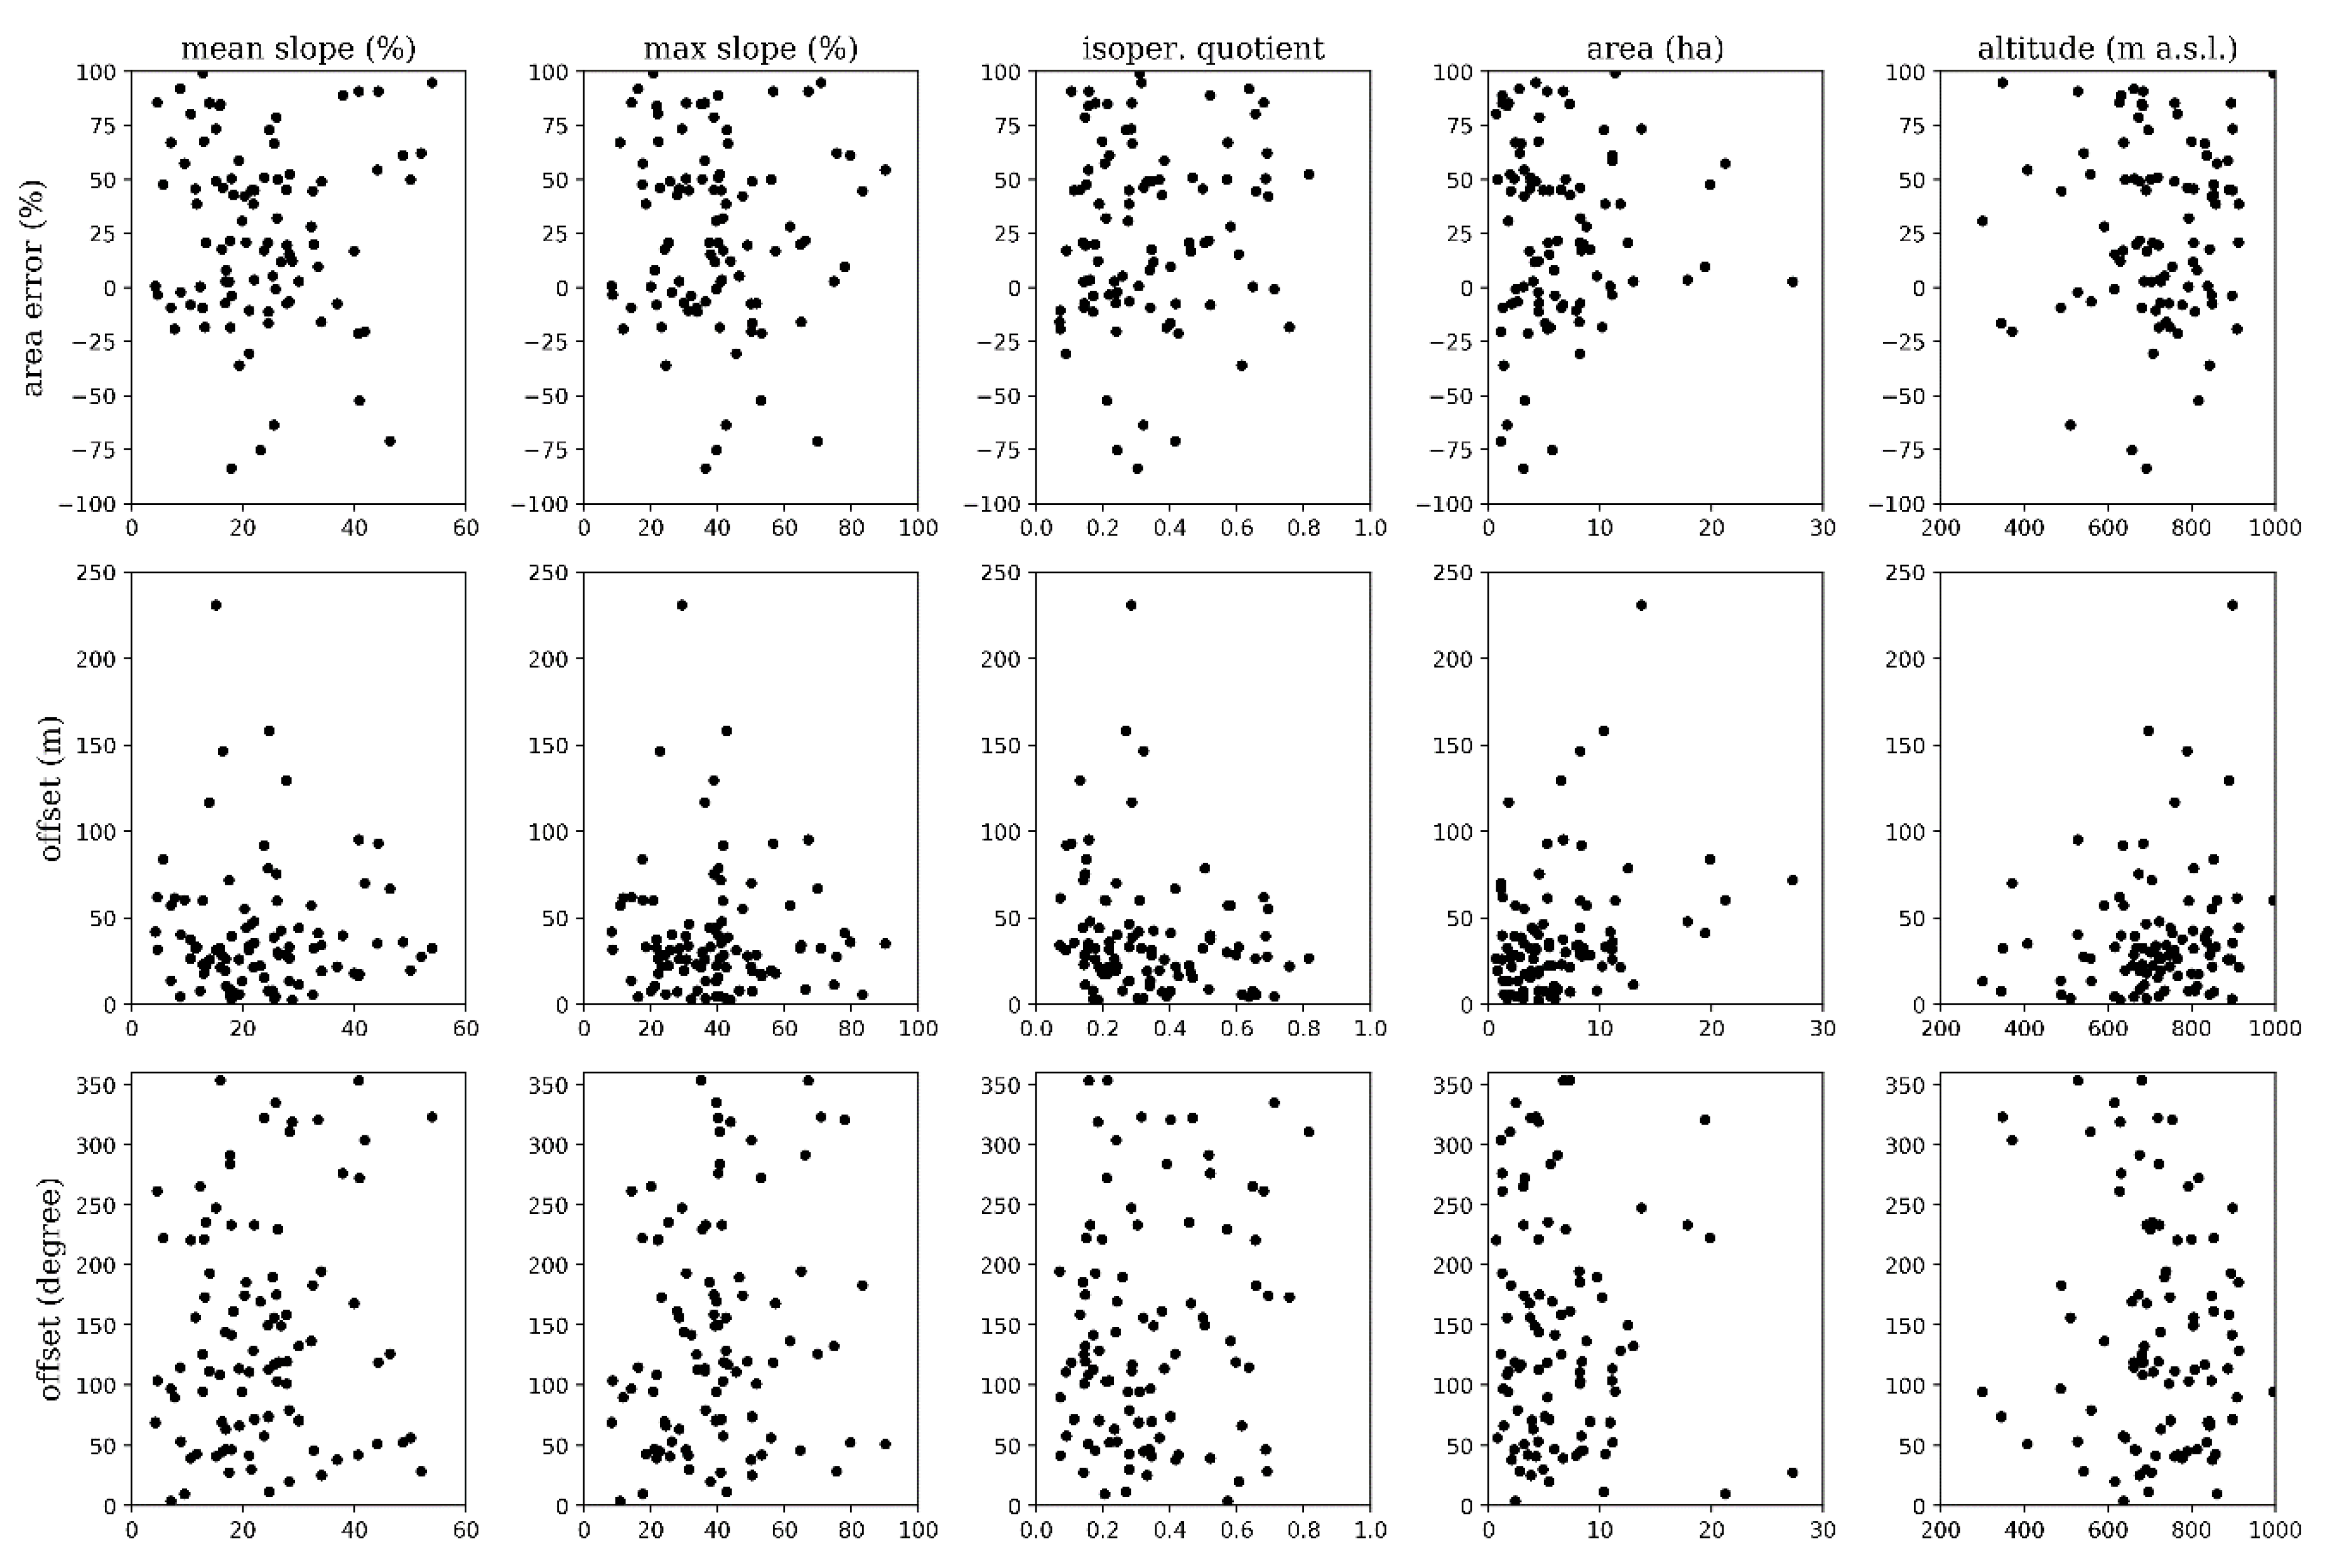
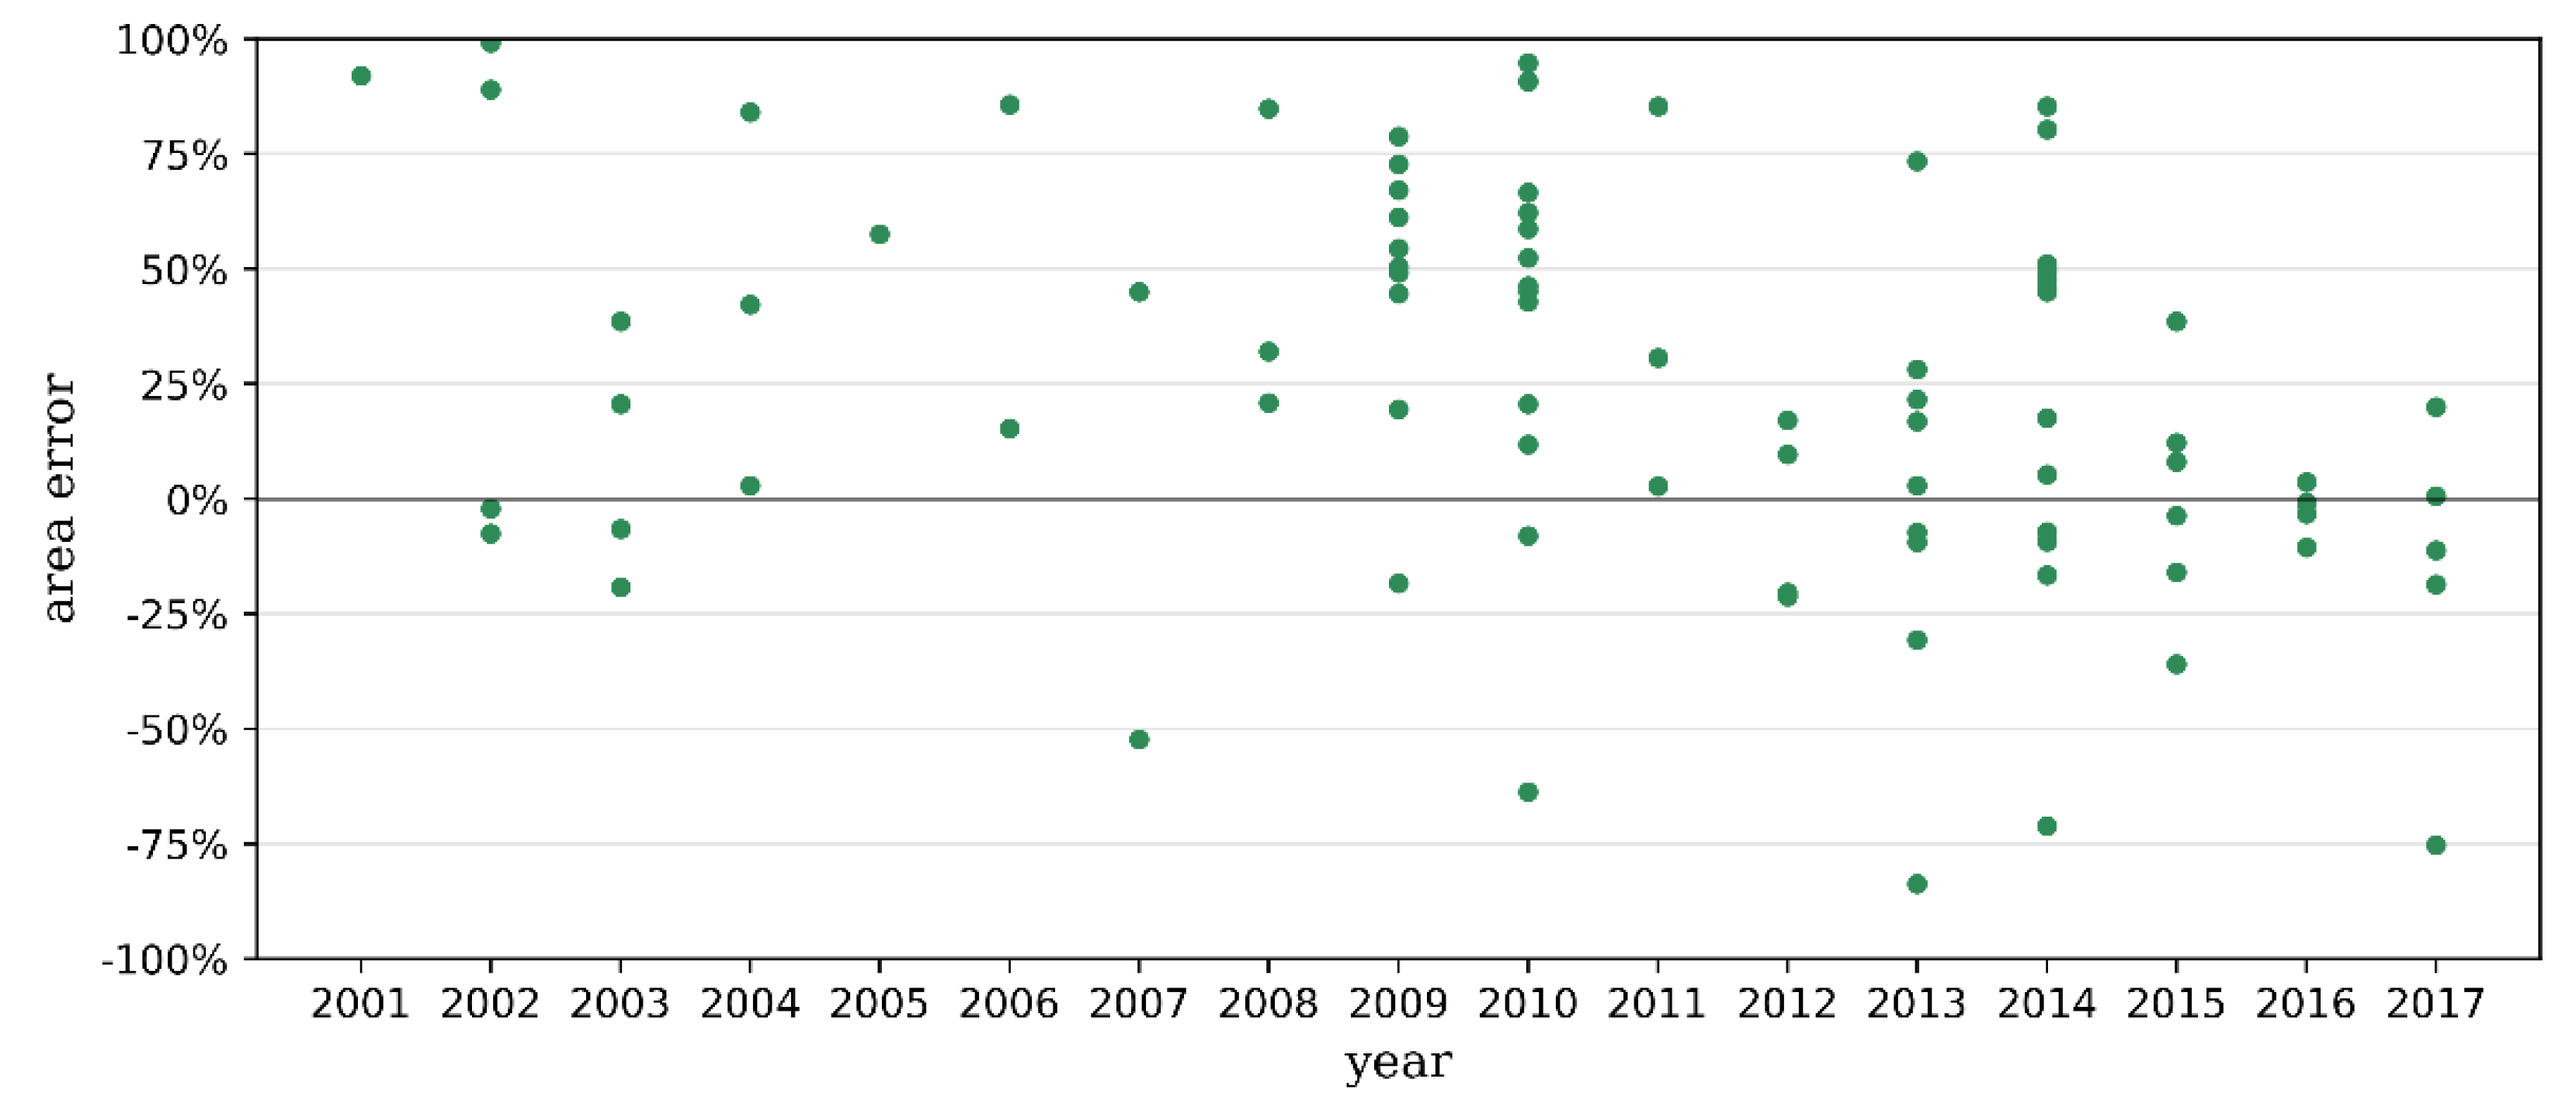
Regarding the spatial prediction accuracy, the regressions reported a coefficient of determination (R2) of 0.134, 0.148, and 0.110 when predicting percentage area error, distance of the spatial offset between centroids, and azimuth of the offset, respectively. Scatter plots of the independent variables (mean slope, maximum slope, aspect, isoperimetric quotient, area, and altitude) and dependent variables (percentage area error, offset distance, and azimuth of the offset) are shown in Figure 10. From the three assessed variables, only the interaction between mean altitude and mean slope showed significance to predict percentage error in area. However, the R2 drops to under 0.1 when excluding the non-significant variables from the model in the step-wise regression. The net resultant vector showed the centroid offset azimuth to be slightly east orientated, but without any systematic trend (Figure 9). While a slight improvement in area error was visible over time, the area error remained highly variable (Figure 11). Because no clear trend based on site variables was detectable, FCLE was used in further analysis of harvest systems without any modifications.
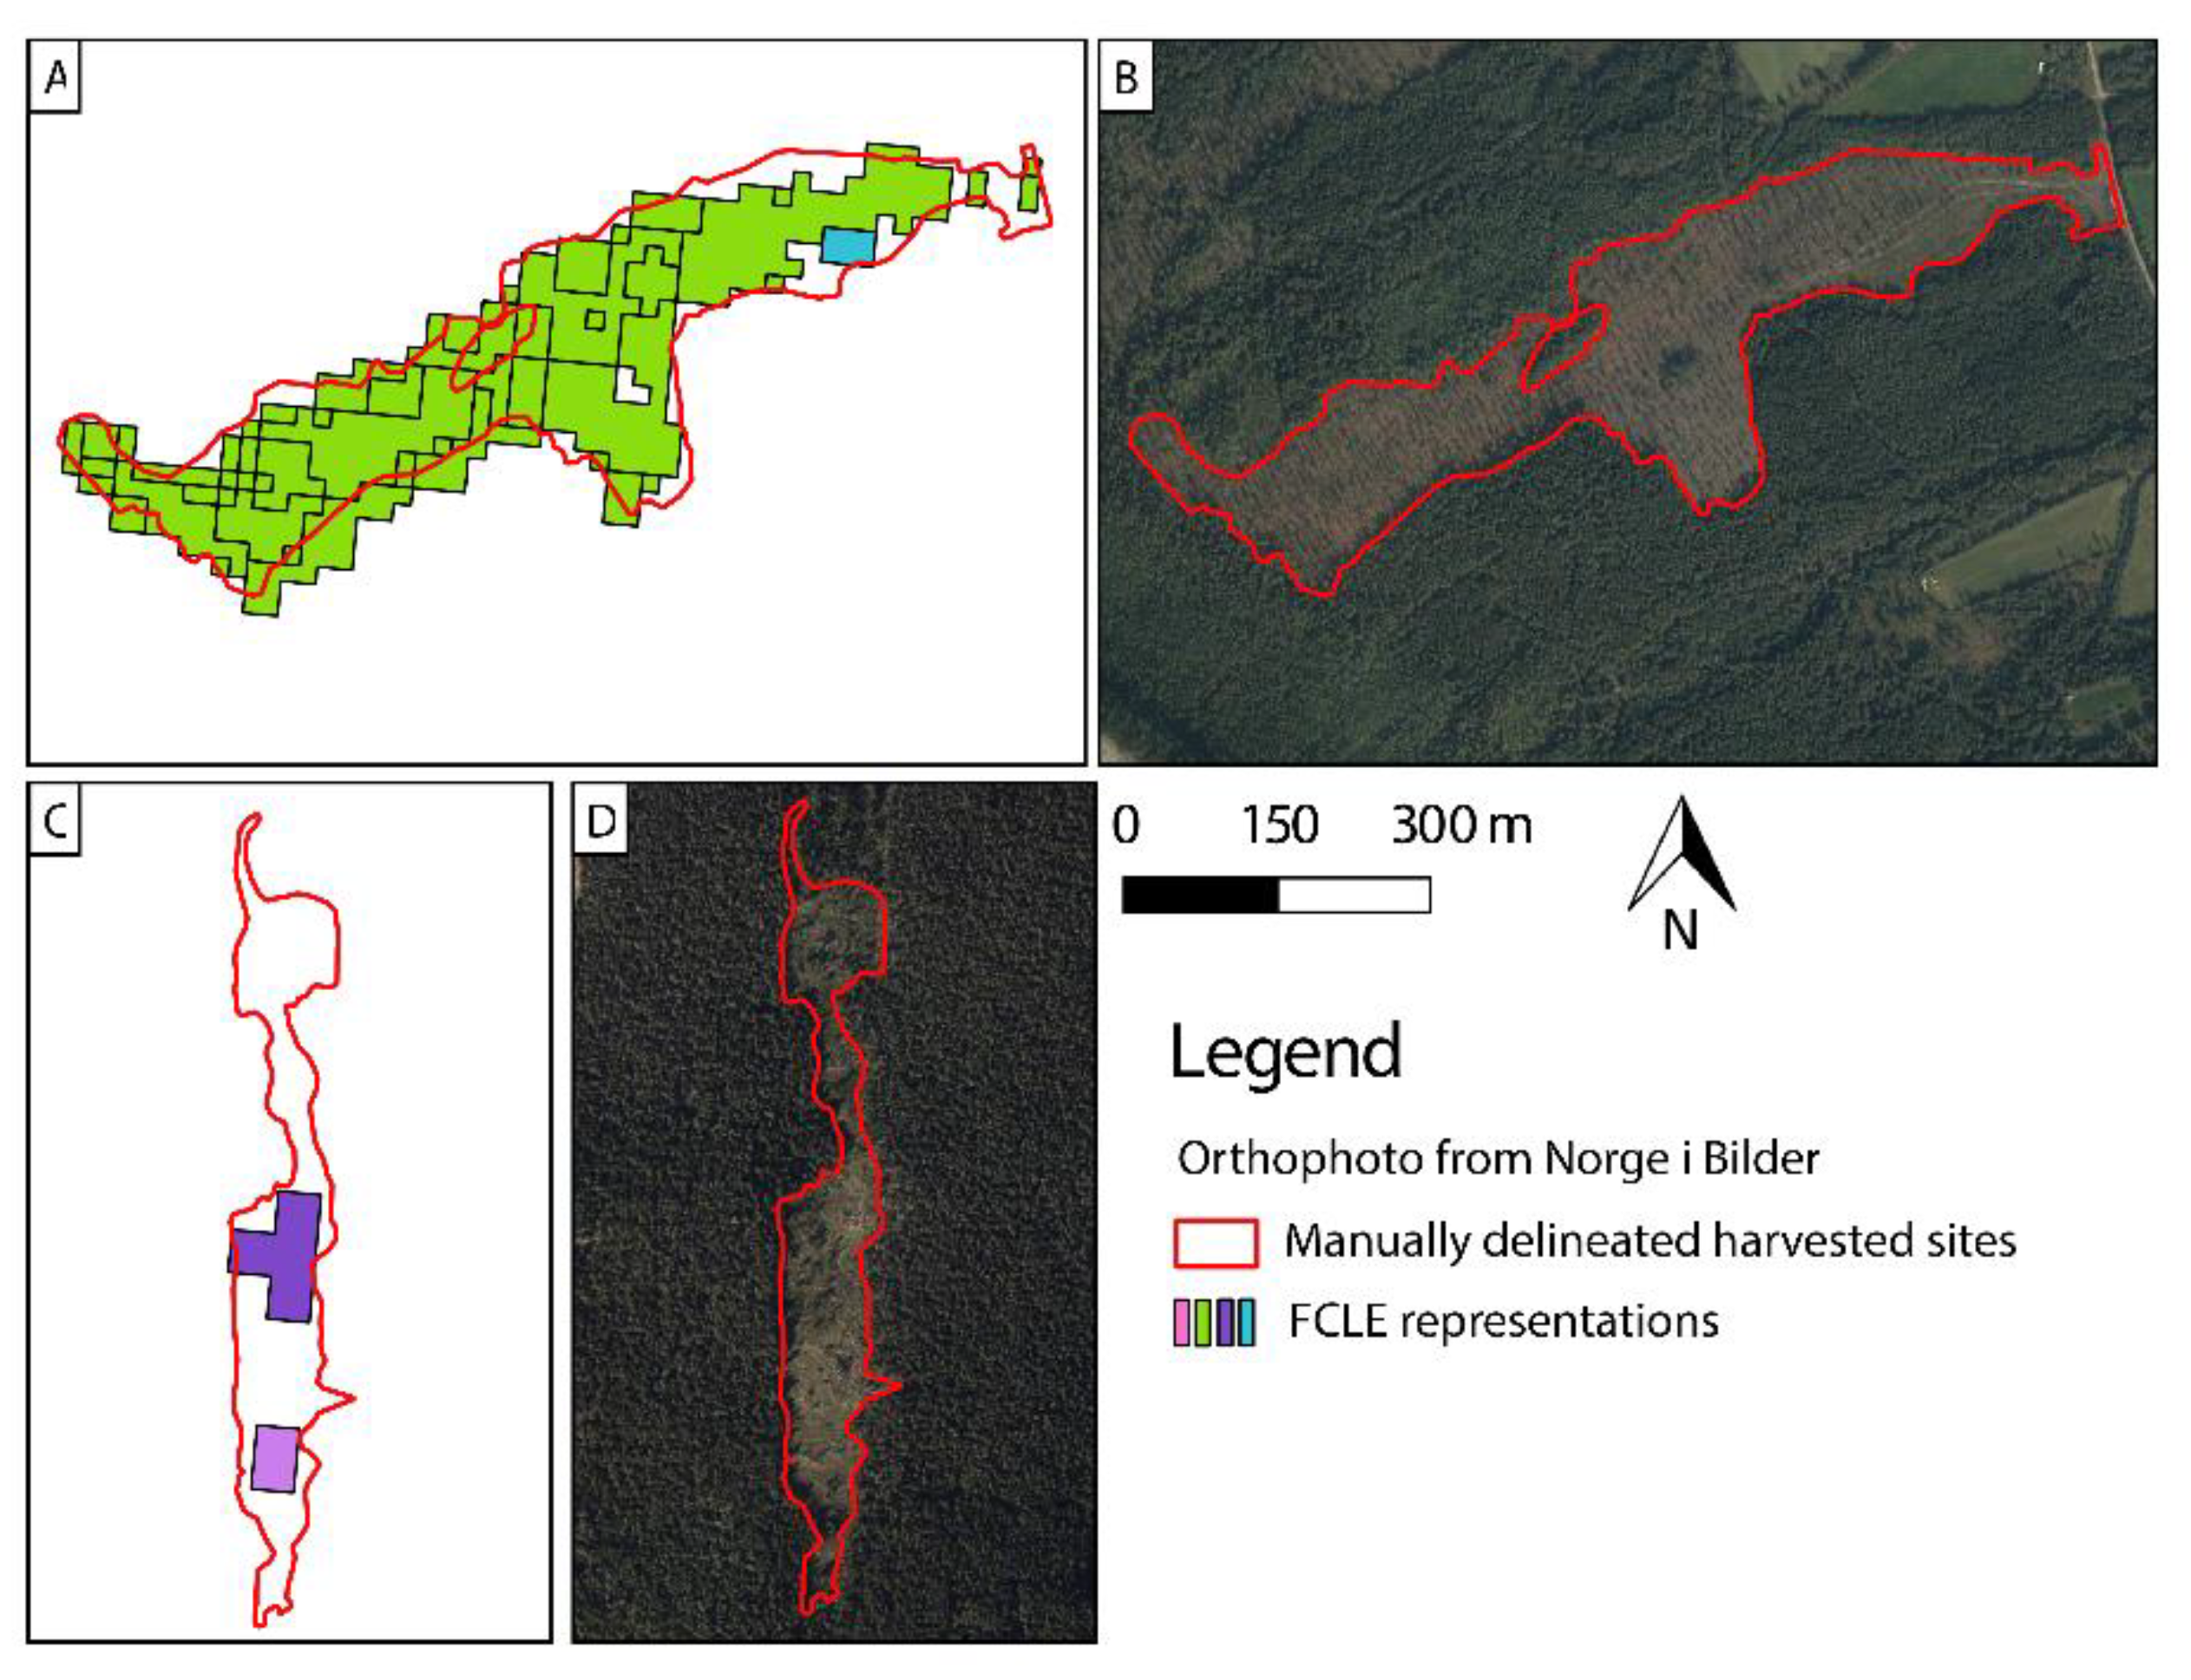
The errors in the harvested site representations in the FCLE map are highly variable (RMSE: 39.7%). Figure 8 shows two examples of the comparison of the mapped FCLE and manually delineated harvested sites. Example Figure 8A,B shows accurate predictions by FCLE while example Figure 8C,D shows an underestimation of 70% of the area. Figure 8A,C show the manually delineated harvested sites and the FCLE map, maintaining the internal boundaries of the original polygons (Figure 8A,D). Figure 8C,D show a single harvesting site that is interpreted as 2 different areas on the FCLE map. Such errors have an effect when calculating average harvesting site size over the whole catchment.
3.2. Analysis of Harvesting Operations
3.2.1. Trends in Harvested Areas
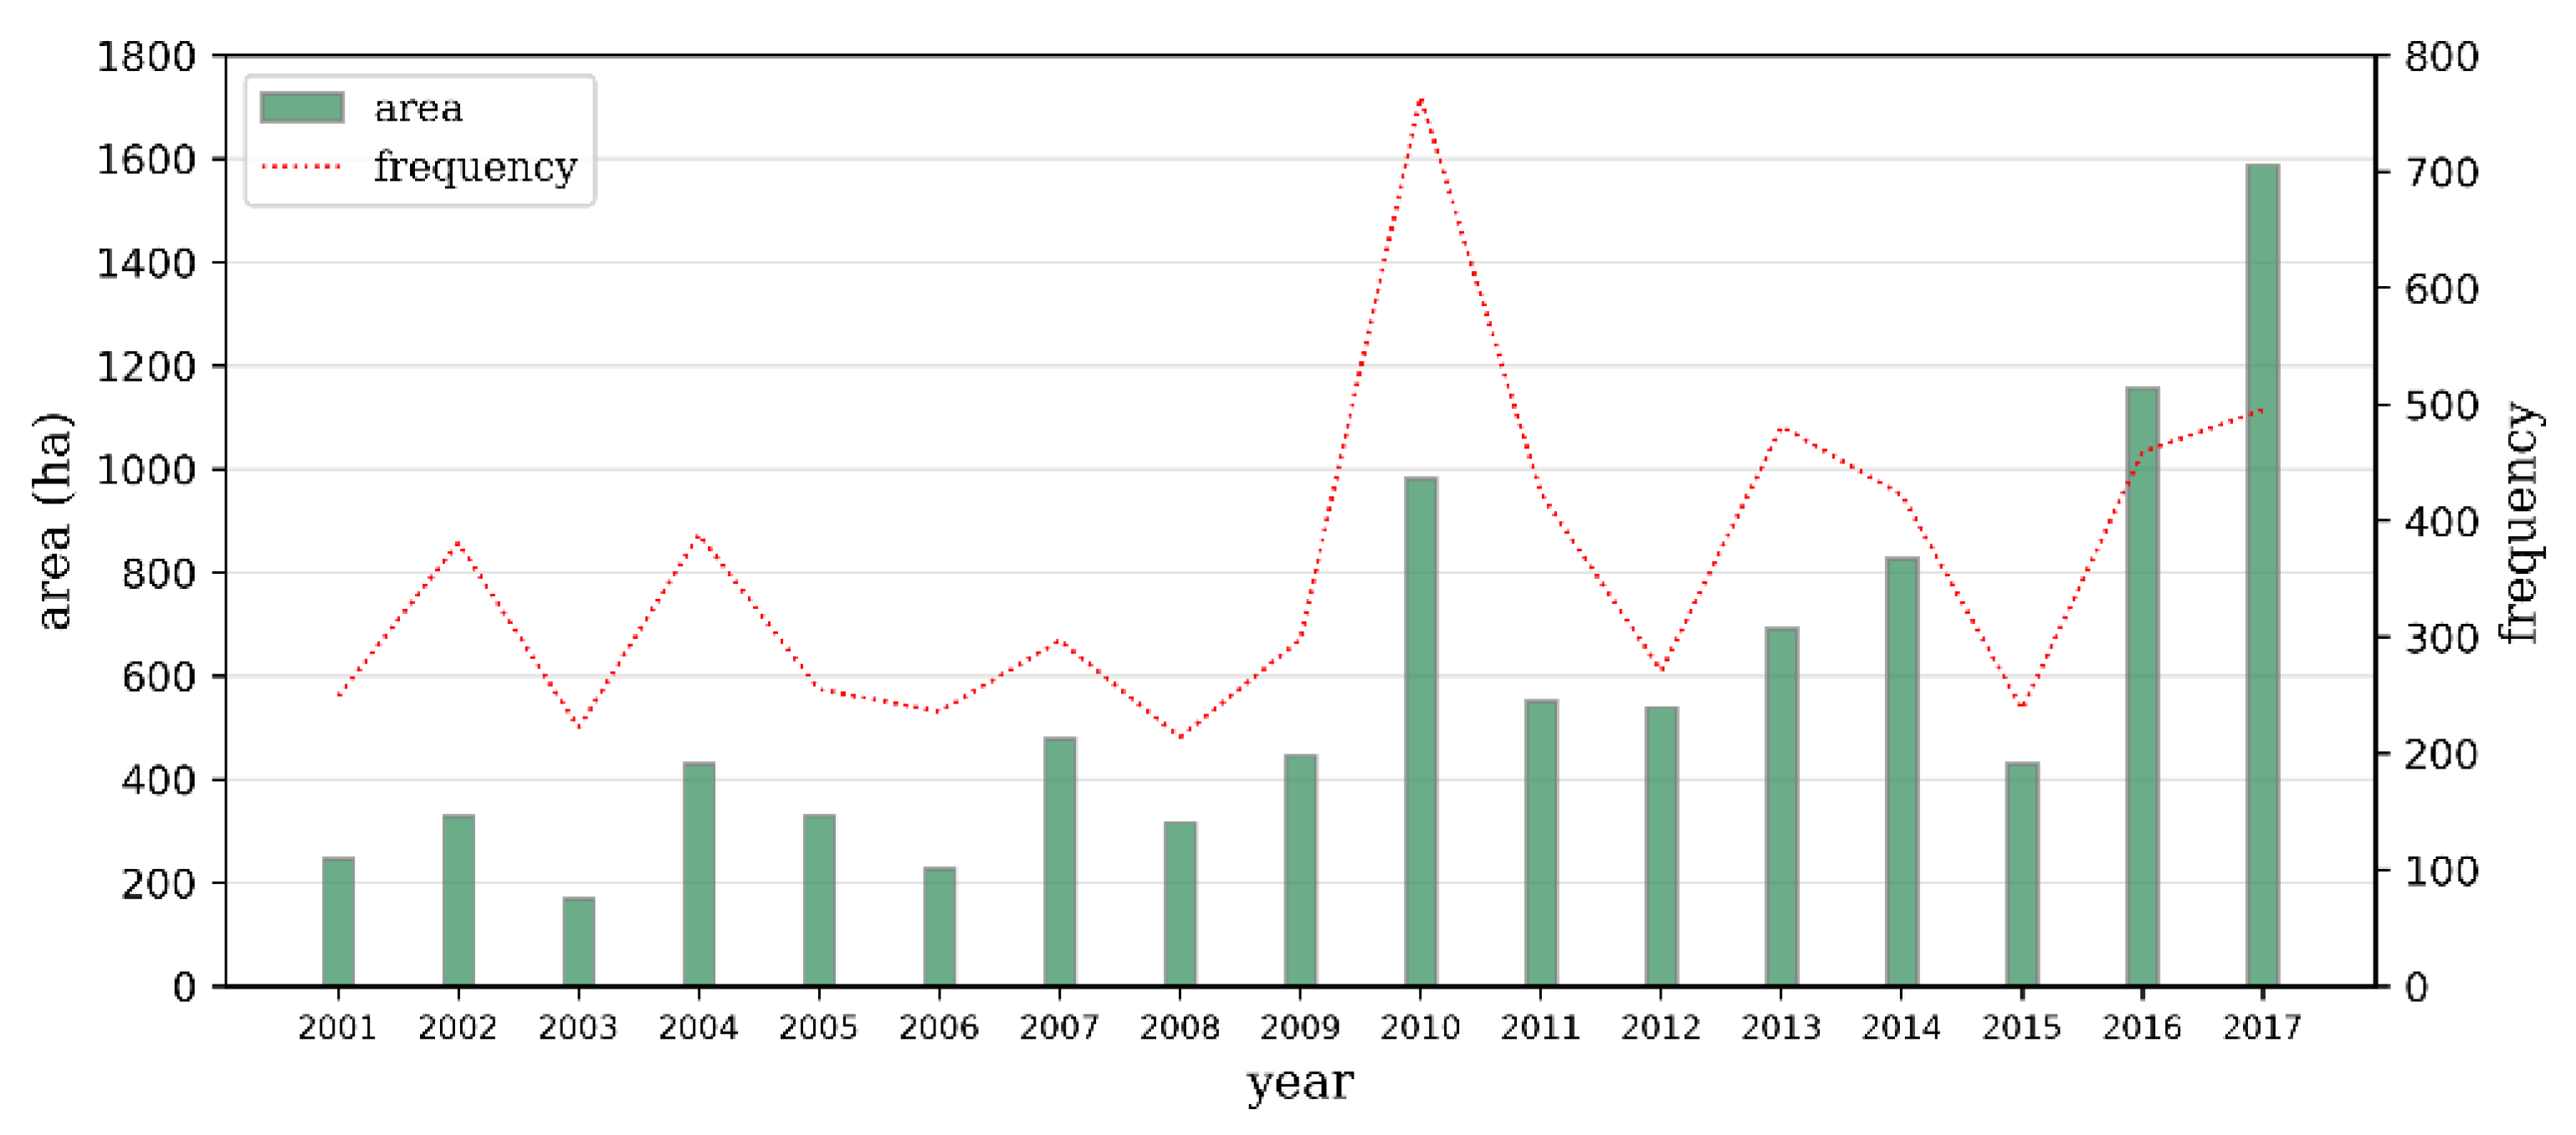
The results showed that the annual area mapped in FCLE as harvested in the Gudbrandsdalen catchment has increased over time from 246 ha (249 harvesting sites) in 2001 to 1588 ha (495 harvesting sites) in 2017 (Figure 12). Ninety-six percent (9353.6 ha) of the harvests registered by FCLE corresponded to stands with a mean slope under 40% with only 3% (292 ha) on steep slopes (40–60%), and 1% (97 ha) in very steep terrain (more than 60% slope). The equivalent total area representation of productive forests in the catchment is 133,705 ha (83%, flat to moderately steep terrain), 18,855 ha (12%, steep terrain), and 8164 ha (5%, very steep terrain).
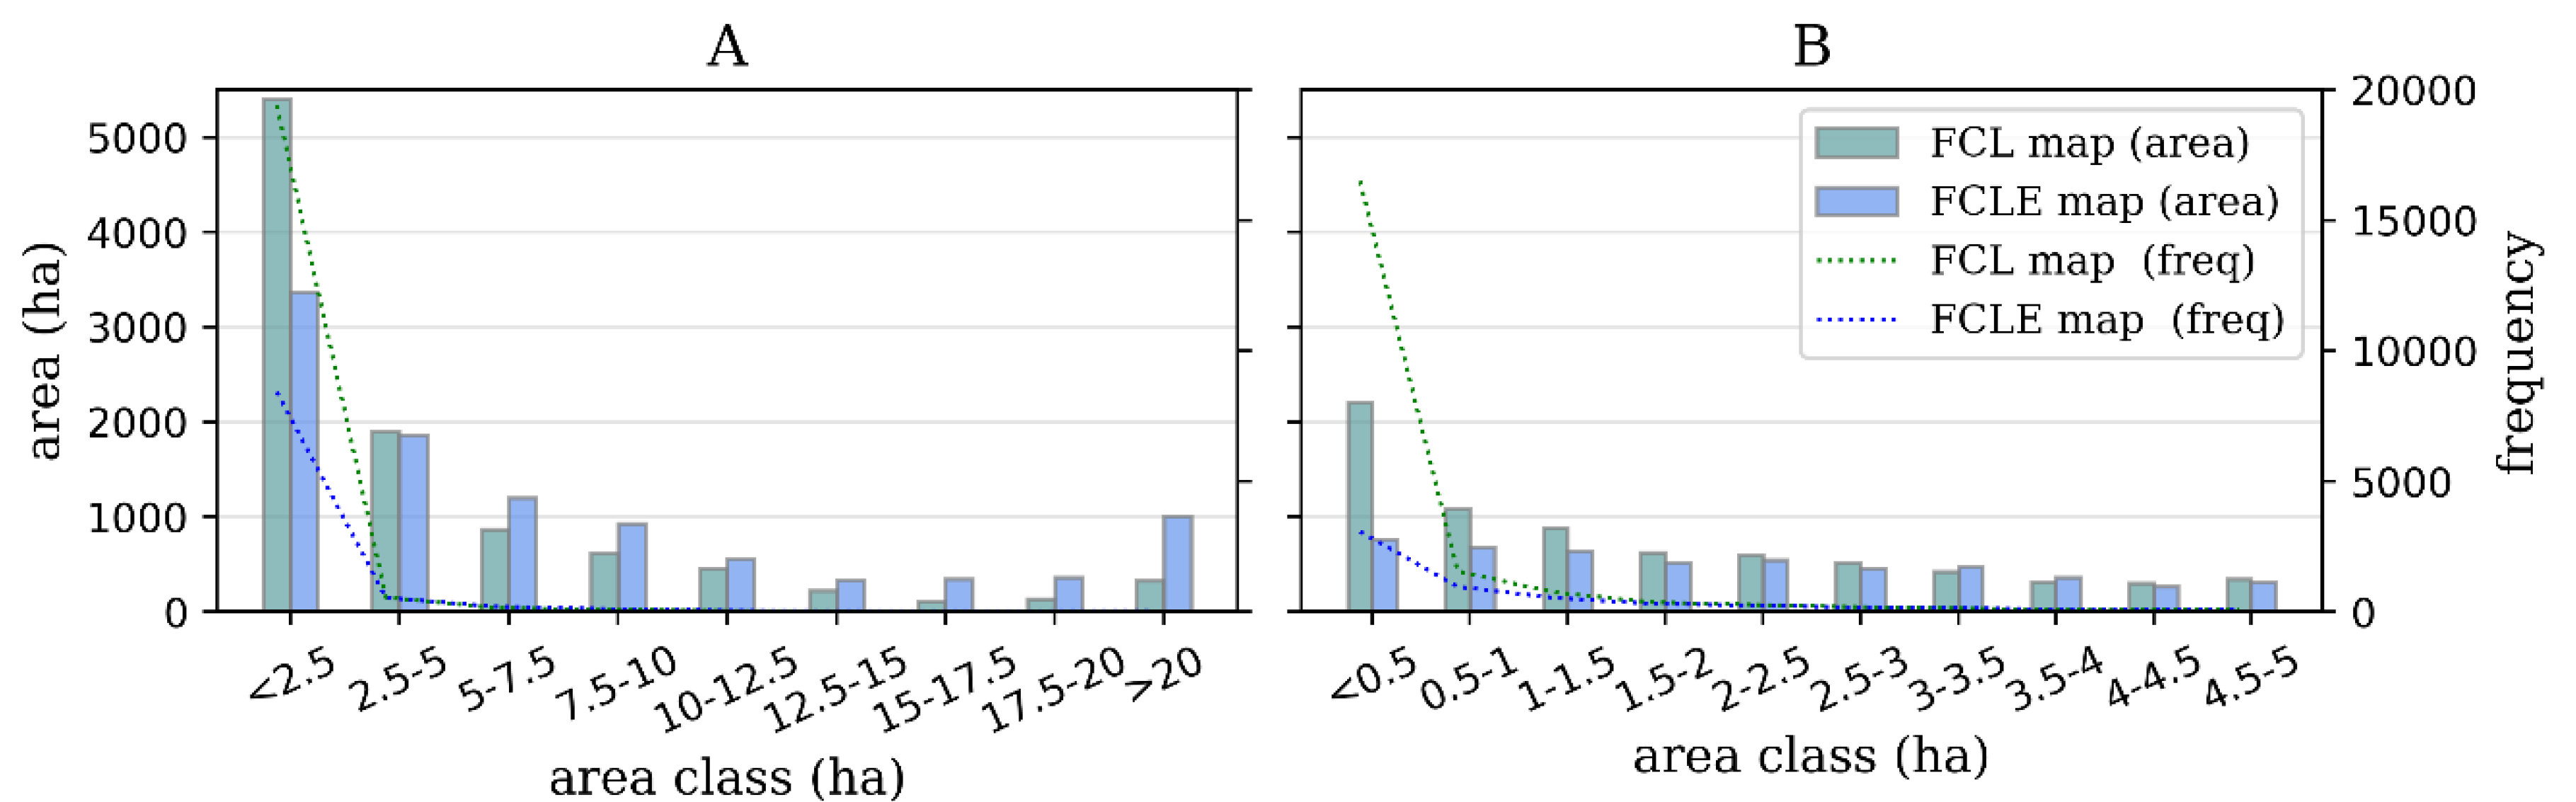
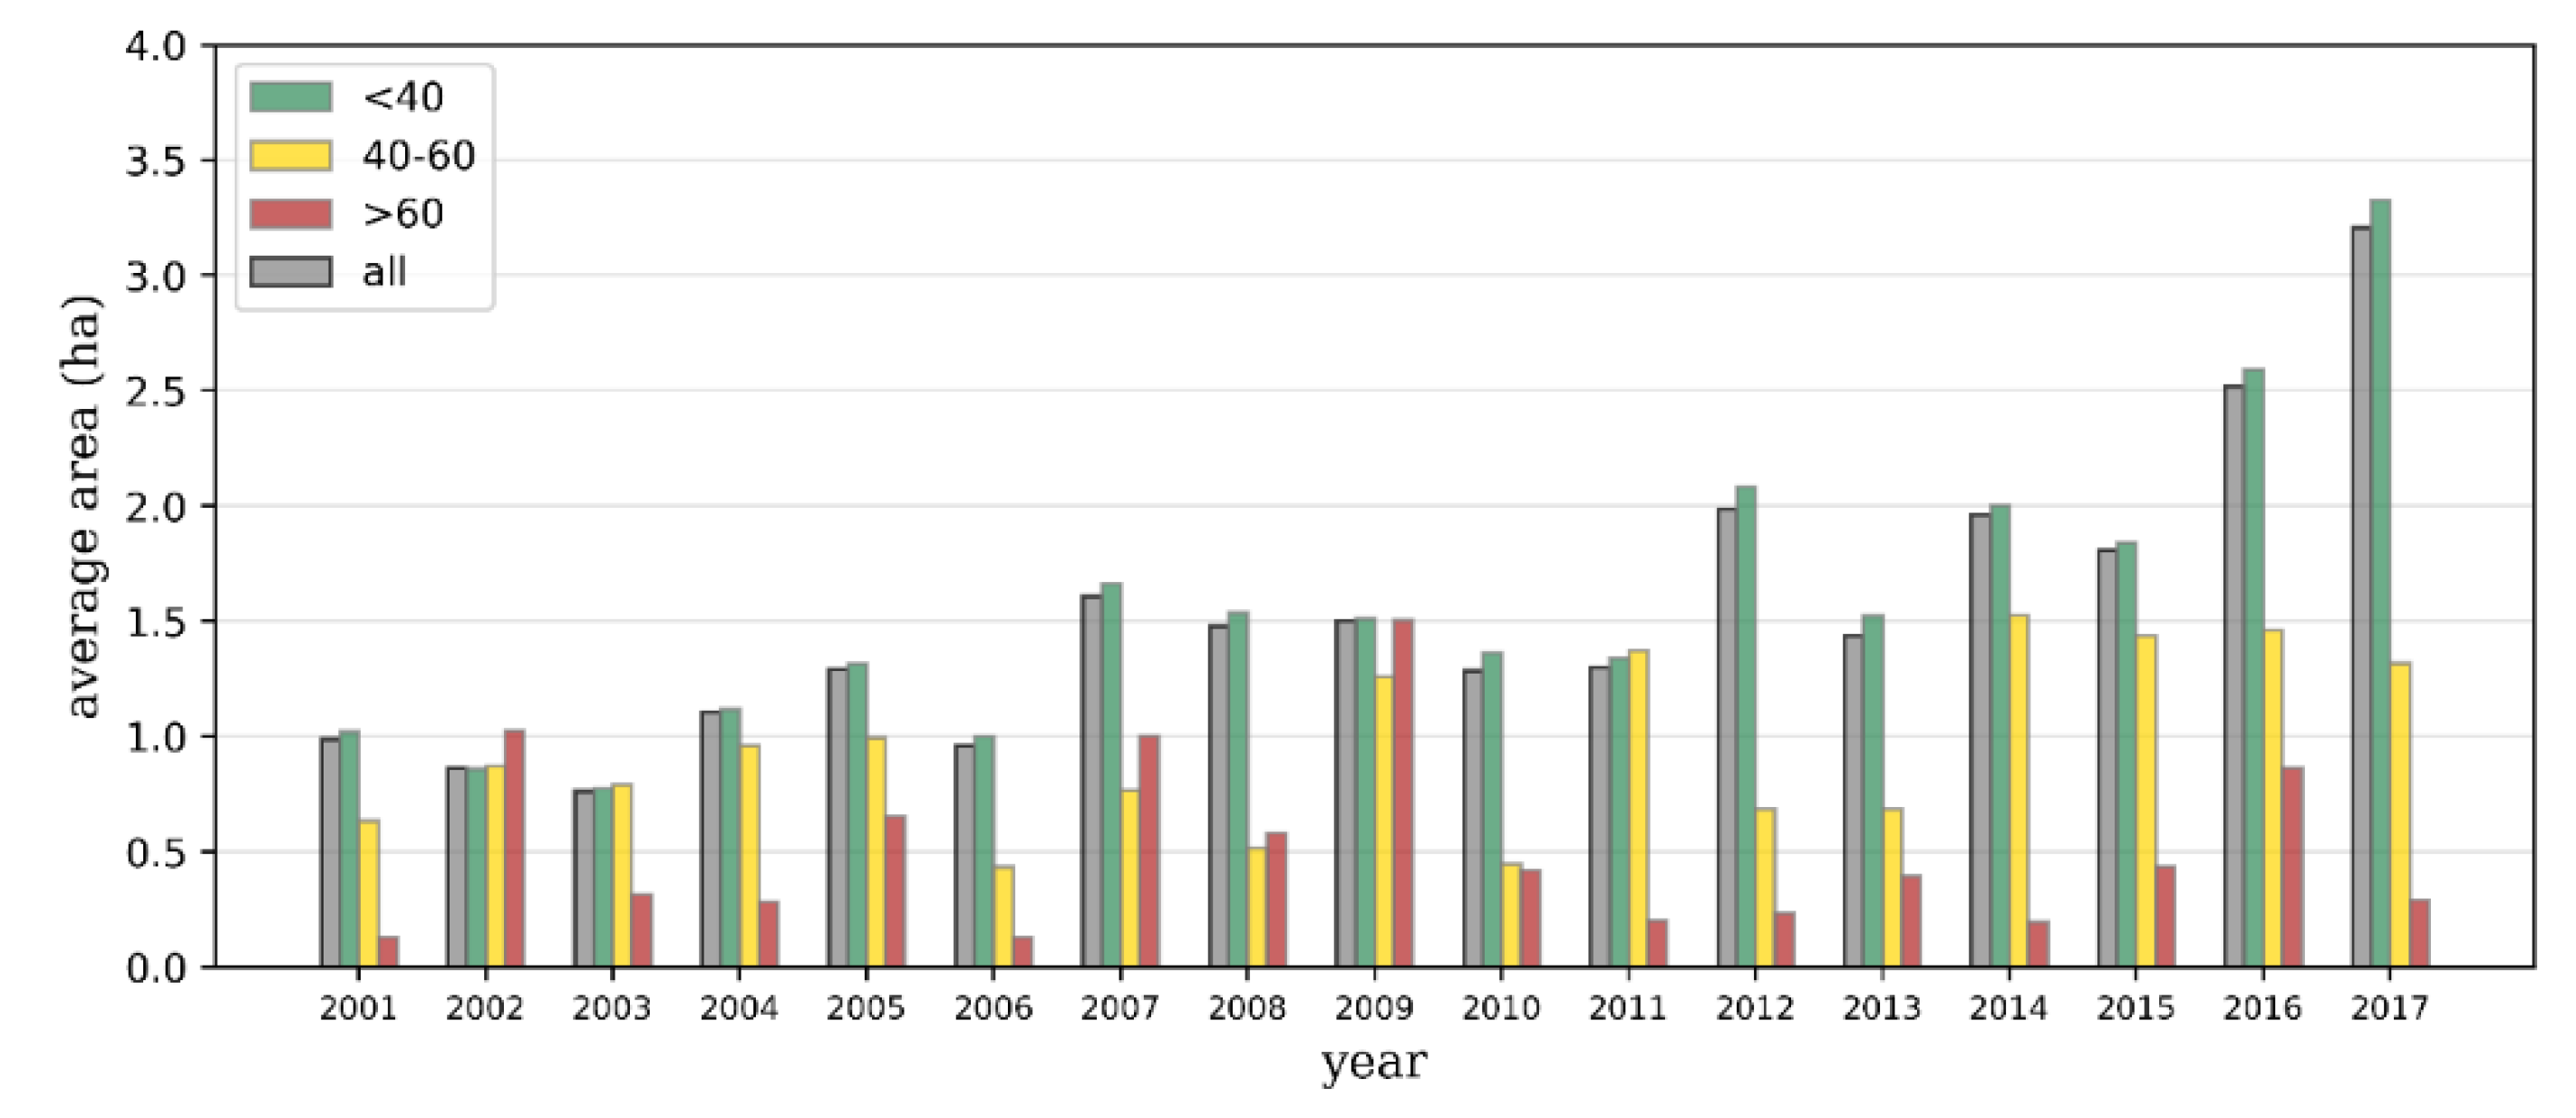
The average area of individual harvested sites registered by FCLE has also increased over the whole period analysed. In the case of flat to moderately steep slopes (<40% slope) harvested site area increased from 1.0 ha in 2001 to more than 3.2 ha in 2017 (Figure 13). Even though the mean harvested site area hardly exceeded 3 ha, the frequency distribution of harvested site areas in Figure 5 shows that 48% of the total harvested area (458 harvested sites) comprised sites over 5 ha, and 27% (151 contiguous harvested sites) over 10 ha.
A slight trend of an increment in average harvested site area registered by FCLE from 0.6 ha in 2001 to more than 1.5 ha in the period 2014–2017 is visible for the terrain with moderate to steep slope (40–60%). In very steep terrain (>60% slope) the largest average size of a harvested site was observed in 2009, with 1.5 ha, but no clear trends of increase in average harvesting site can be derived for this slope class (Figure 13).
3.2.2. Analysis of the Harvesting Systems Used
Out of the 200 random points where the harvesting system was assessed, 23 represented commission error. Twenty of them were generated over areas FCLE harvested site representations under 0.5 ha. Therefore, the reported results refer to the remaining 177 FCLE points. In total, 96% of the FCLE area was harvested with harvesters and forwarders, while 2% was carried out using cable yarding technologies. It was not possible to define the harvesting system used on the remaining 2% of the sites.
3.2.3. Analysis of the Harvesting Systems Used in Steep Terrain
Out of the 100 random points, where the harvesting system in steep terrain was assessed, 11 represented commission error. Nine of them were generated over FCLE harvested site representations under 0.5 ha. Therefore the analysis was completed on the remaining 89 cases. Eighty-one samples were related to the category 40%–60% slope, and eight to the category more than 60% slope.
Thirty-five percent of the area within terrain slope class 40%–60% was harvested using cable yarding in at least part of the stand. On 27% of the area, cable yarding alone was used, while on 8 percent points, excavators had also been used on the same site. Sixty-two percent of the harvesting in 40%–60% slopes was done using harvesters and forwarders alone, of which 44 percentage points did not show any evidence of having constructed temporary skid trails with excavators, while 18 percentage points did include trail construction work to some degree. On the rest of the area (3%) it was not possible to clearly determine the harvesting system from the reference data.
On 88% of the cut area for the slope class, over 60% cable yarding was used for timber extraction, while timber from the remaining 12% was extracted by forwarder, without any construction of temporary extraction trails being evident.
4. Discussion
4.1. Accuracy Assessment
The freely available FCL map was enhanced through denoising and aggregation, in order to gain a better representation of the harvested sites. The area resource maps of productive forest cover in Norway were used in order to limit expected error of FCL over more sparse or low-canopy cover areas [26], and enable a more accurate assessment of commercial harvesting trends.
Our pixel-level accuracy analysis based on reference points showed only marginal commission errors but considerable omission errors of 47%. A further polygon-based analysis revealed that the large omission error mostly resulted from an underestimation of the area of individual harvested sites (on average 29% underestimation). Only approximately 4% of the harvested sites were omitted, and the omission was related to relatively small sites. One reason for the discrepancy between the accuracy figures based on reference points and delineated polygons may be that only relatively large and obvious harvested sites are delineated when searching for them on aerial images. Those changes are well reflected by FCL. However, when analysing reference points the interpreter looks very carefully for changes also on very high zoom levels. In this way also smaller forest cover losses and harvested sites with seed trees become visible, and that may not be well reflected in the FCL data. It should be noted though that seed trees do not in all cases cause omission errors. Although terrain influences on the accuracy due to sensor geometry is not to be expected, the possibility of more common shadow on steep terrain could have indirectly resulted in less accurate results. This effect was, however, not found which may be related to the good radiometric properties of the sensor.
Only few reports on the accuracy of FCL have so far been published and their results vary depending on the scale studied. Hansen et al. [24] used reference data analysed over 1.44 ha blocks and report 12% and 6% commission and omission errors of FCL in the boreal zone. They used Landsat, MODIS and, where available, very high resolution imagery from Google Earth as a reference. Because the accuracy assessment of [24] is based on an aggregated map scale, primarily the relatively large forest cover loss areas were available in their reference data which may explain the much smaller omission error compared to our study. This tendency was also observed in our study when assessing the omission error based on stands delineated using aerial images. In an analogy, small forest cover losses are missing when collecting reference data over 1.44 ha blocks, which may explain the much bigger commission error compared to our study. To summarize, the accuracy assessment of [24] is not comparable to our study due to a different design, scale, and reference data used. Tyukavina et al. [35] conducted a more intensive assessment of the omission error of FCL, including 3000 single pixels (30 m) located on the 1-pixel buffer area of the already mapped forest loss. Their analysis was concentrated on those buffers, since omission errors (due to forest cover loss) occur mainly at the boundaries of mapped forest loss [35,36]. While [35,36] focused only on pantropical forest, they found that GFW underestimated forest cover loss by 24% which is a similar tendency as we found under boreal conditions.
It is important to note that in the present study FCL was enhanced without the need for any additional remotely sensed data, thus our methods may be replicable for any other area around the globe. On the other hand, further enhancement of the FCL may be achieved by integrating additional multi-temporal remotely sensed data such as Sentinel-2 time series data. This would allow to increase the possible number of cloud-free images and thus the chances of detecting annual changes. Furthermore, given the finer level of detail (i.e., 10 m resolution), Sentinel-2 data could also enable a more accurate detection of the harvest boundaries, thus possibly reducing underestimation of the area. Despite these advantages, Sentinel-2 data have only been available since June 2015 and therefore only the more recent changes can be enhanced by the adoption of such data. Although airborne laser scanning (ALS) is the most accurate technique for assessing the canopy structure, due to the low temporal resolution over large areas, it is currently not an alternative to optical satellites.
4.2. Analysis of Harvesting Operations
The average size of individual FCLE polygons on flat to moderately steep terrain (<40% slope) have increased over time and there was no indication of the trend tapering off toward the end of the studied period (Figure 10). The PyQGIS scripts used in this study aggregated only individual FCL polygons within a radius of 50 m. The mean size of the FCLE polygons slightly exceeded 3 ha at the end of the period, while a large proportion of the harvested area (27%) consisted of sites exceeding 5 ha in extent. Furthermore, these size analyses are based on the FCLE map, which was shown to underestimate individual harvesting site areas by 29% on average, implying an adjusted mean harvested site area of approximately 4 ha at the end of the period. This increase in size likely results from efforts to rationalize operations by minimizing machine relocation costs through incentivizing contracts with larger aggregate volumes and aligns with the general perception of harvesting operations in the study area. The harvesting or avoidance of adjacent stands is a long recognised management option having opposing environmental and economic outcomes [37].
In the moderately steep to steep terrain (40%–60% mean slope), 35% of the FCLE area was harvested using cable yarding technologies. However, 8% of these sites had already been partially harvested with ground based machines supported by excavators at some point. This practice reduces the overall feasibility of using cable yarding technologies [38], and the information provided by FCLE could be beneficial in highlighting the extent and location of such sites in formulating future contracts. Furthermore, in many European countries, 40% slopes generally represent an environmental threshold beyond which only cable yarding based extraction is recommended [39], while in the present case, 62% of the sites in this slope category were partially or fully harvested with ground based machines. The tendency to use mechanised harvesting systems on steep slopes is due to the safer work environment, the lower physical workload, improved machine utilisation for contractors living in such areas, lower overall harvesting costs, and the difficulties associated with retaining cable yarding expertise [40]. This results in the limited existing cable yarding capacity being prioritised to the most demanding sites. Thirty percent of these sites showed some indication of extraction trail construction, something which again justifies the need for spatial data available for monitoring developments for some years after harvesting [21,41].
In very steep terrain (>60% slope), 88% of the FCLE areas were harvested using cable yarder-based extraction. The remaining 12% of the very steep terrain had been harvested by harvester and forwarder, although in all cases, this was without any apparent excavation of the soil. Generally, this slope category could be considered beyond the limit for wheeled machinery, both for safety and environmental reasons, and the FCLE combined with terrain information provided a good basis for quantifying the extent of its use. In addition to providing statistics on harvesting systems used, the FCLE data could be used in providing a basis for assessing alternative technologies in an area, e.g., the feasibility of investing in newer traction winch technologies which allow machines to traverse steep slopes with minimum wheel-slip and without the need for constructing trails [42].
There was no noticeable increase in FCLE polygon area in both moderate to steep, and very steep slope classes, despite harvests in the flatter terrain having tripled in size during the period studied. This could be due to the fact that in steep terrain, there is a tendency to limit cable corridor length due to the high installation costs and increased workload in rigging [43,44], while for ground-based systems, the relatively low forest road density coupled with steep slopes, restricts the economic extraction distance of the forwarder, thus limiting cut size [45] .
The total area harvested in the catchment increased by a factor of 6.4 over 17 years, a considerable short-term development for an area with a longstanding forest industry. While the annual cut sums to roughly 0.6% of the productive forest area, the areas harvested by slope category are disproportionate to the available resource. Only 4% of the annual cut came from forests exceeding 40% slope, despite these areas making up 17% of the total resource. In contrast, 96% of the cut was carried out on slopes under 40%, where 83% of the resource is located. In the longer term, a considerably higher proportion of the wood harvested in this catchment will come from steep slope harvesting. Semi-autonomous spatial data sources like FCL will, therefore, likely play an increasingly important role in contributing to a sustainable catchment management.
5. Conclusions
Global Forest Watch FCL data provided a spatial and temporal indicator of forest cover loss. Nonetheless, an estimation of local omission, commission and geometry errors may be necessary before its use. When used in conjunction with multi-temporal aerial imagery, the enhanced map (FCLE) provided a detailed basis for assessing developments in harvesting activities, including the harvesting technologies applied. Overlaying the FCLE map with a digital terrain model allowed for a classification of harvest activities to slope class and position in the landscape.
The processing and provision of basic FCL maps currently includes a lag-time of roughly 1 year and can therefore not be used in a shorter-term management context. Nevertheless, land and infrastructure administrators in mountainous areas may benefit considerably from having access to data records showing the location, slope and extent of timber-harvesting activities within the catchment areas they manage, also in the medium and longer term.
Author Contributions
Conceptualization, B.T. and R.A.; methodology, F.R., S.P. and J.B.; software, F.R.; validation, F.R. and J.B.; formal analysis, F.R. and J.B.; investigation, F.R. and J.B.; data curation, F.R.; writing—original draft preparation, F.R. and BT; writing—review and editing, F.R., S.P., J.B. and B.T.; project administration, B.T.; funding acquisition, B.T. and R.A.
Funding
This research was funded by the Norwegian Research Council’s Strategic Institute Programme project ‘Reducing climate impacts on society through appropriate forestry measures (REDCLIM)’ and (ERA-GAS) grant number 276398 (INVENT).
Acknowledgments
Three anonymous reviewers gave constructive comments that helped improving the manuscript. The authors wish to acknowledge the assistance of graduate student Erik Armand Iversen for contributing to the data collection.
Conflicts of Interest
The authors declare no conflict of interest.
References
- McClung, D.M. Characteristics of terrain, snow supply and forest cover for avalanche initiation caused by logging. Ann. Glaciol. 2017, 32, 223–229. [Google Scholar] [CrossRef]
- Metternicht, G.; Hurni, L.; Gogu, R. Remote sensing of landslides: An analysis of the potential contribution to geo-spatial systems for hazard assessment in mountainous environments. Remote Sens. Environ. 2005, 98, 284–303. [Google Scholar] [CrossRef]
- Grünewald, T.; Schirmer, M.; Mott, R.; Lehning, M. Spatial and temporal variability of snow depth and SWE in a small mountain catchment. Cryosphere 2010, 4, 215–225. [Google Scholar] [CrossRef]
- Dyrrdal, A.V.; Stordal, F.; Lussana, C. Evaluation of summer precipitation from EURO-CORDEX fine-scale RCM simulations over Norway. Int. J. Climatol. 2018, 38, 1661–1677. [Google Scholar] [CrossRef]
- Lindner, M.; Fitzgerald, J.B.; Zimmermann, N.E.; Reyer, C.; Delzon, S.; van der Maaten, E.; Schelhaas, M.-J.; Lasch, P.; Eggers, J.; van der Maaten-Theunissen, M.; et al. Climate change and European forests: What do we know, what are the uncertainties, and what are the implications for forest management? J. Environ. Manag. 2014, 146, 69–83. [Google Scholar] [CrossRef] [PubMed]
- Laband, D.N. The neglected stepchildren of forest-based ecosystem services: Cultural, spiritual, and aesthetic values. For. Policy Econ. 2013, 35, 39–44. [Google Scholar] [CrossRef]
- Gundersen, V.S.; Frivold, L.H. Public preferences for forest structures: A review of quantitative surveys from Finland, Norway and Sweden. Urban For. Urban Green. 2008, 7, 241–258. [Google Scholar] [CrossRef]
- Schröter, M.; Barton, D.N.; Remme, R.P.; Hein, L. Accounting for capacity and flow of ecosystem services: A conceptual model and a case study for Telemark, Norway. Ecol. Indic. 2014, 36, 539–551. [Google Scholar] [CrossRef]
- Heinimann, H.R. A concept in adaptive ecosystem management—An engineering perspective. For. Policy Econ. 2010, 259, 848–856. [Google Scholar] [CrossRef]
- Heinimann, H.R. Forest operations under mountainous conditions. In Forests in Sustainable Mountain Development: A State of Knowledge Report for 2000; Task Force on Forests in Sustainable Mountain Development: New York, NY, USA, 2000; pp. 224–230. [Google Scholar]
- Putz, F.E.; Sist, P.; Fredericksen, T.; Dykstra, D. Reduced-impact logging: Challenges and opportunities. For. Policy Econ. 2008, 256, 1427–1433. [Google Scholar] [CrossRef]
- Ezzati, S.; Najafi, A.; Bettinger, P. Finding feasible harvest zones in mountainous areas using integrated spatial multi-criteria decision analysis. Land Use Policy 2016, 59, 478–491. [Google Scholar] [CrossRef]
- Saito, M.; Goshima, M.; Aruga, K.; Matsue, K.; Shuin, Y.; Tasaka, T. Study of automatic forest road design model considering shallow landslides with LiDAR data of Funyu Experimental Forest. Croat. J. For. Eng. 2013, 34, 1–15. [Google Scholar]
- Penna, D.; Borga, M.; Aronica, G.T.; Brigandì, G.; Tarolli, P. Predictive power of a shallow landslide model in a high resolution landscape: Dissecting the effects of forest roads. Hydrol. Earth Syst. Sci. Discuss. 2013, 10, 9761–9798. [Google Scholar] [CrossRef]
- Lynch, J.A.; Corbett, E.S.; Mussallem, K. Best management practices for controlling nonpoint-source pollution on forested watersheds. J. Soil Water Conserv. 1985, 40, 164–167. [Google Scholar]
- Clinton, B.D. Stream water responses to timber harvest: Riparian buffer width effectiveness. For. Policy Econ. 2011, 261, 979–988. [Google Scholar] [CrossRef]
- Webb, A.A.; Dragovich, D.; Jamshidi, R. Temporary increases in suspended sediment yields following selective eucalypt forest harvesting. For. Policy Econ. 2012, 283, 96–105. [Google Scholar] [CrossRef]
- Swanson, F.J.; Dyrness, C.T. Impact of clear-cutting and road construction on soil erosion by landslides in the western Cascade Range, Oregon. Geology 1975, 3, 393–396. [Google Scholar] [CrossRef]
- Conrad, I.V.J.L.; Ford, W.S.; Groover, M.C.; Bolding, M.C.; Aust, W.M. Virginia Tech Forest Road and Bladed Skid Trail Cost Estimation Method. South. J. Appl. For. 2012, 36, 26–32. [Google Scholar] [CrossRef]
- Lileng, J. Harvester and Forwarder in steep terrain. In Proceedings of the 3rd Forest Engineering Conference—Sustainable Forest Operations, Mont-Tremblant, QC, Canada, 1–4 October 2007. [Google Scholar]
- Pierzchała, M.; Talbot, B.; Astrup, R. Estimating Soil Displacement from Timber Extraction Trails in Steep Terrain: Application of an Unmanned Aircraft for 3D Modelling. Forests 2014, 5, 1212–1223. [Google Scholar] [CrossRef] [Green Version]
- Wang, J.; Edwards, P.J.; Wood, F. Turbidity and suspended-sediment changes from stream-crossing construction on a forest haul road in West Virginia, USA. Int. J. For. Eng. 2013, 24, 76–90. [Google Scholar] [CrossRef]
- Surfleet, C.G.; Dietterick, B.; Skaugset, A. Change detection of storm runoff and sediment yield using hydrologic models following wildfire in a coastal redwood forest, California. Can. J. For. Res. 2014, 44, 1572–1581. [Google Scholar] [CrossRef]
- Hansen, M.C.; Potapov, P.V.; Moore, R.; Hancher, M.; Turubanova, S.A.; Tyukavina, A.; Thau, D.; Stehman, S.V.; Goetz, S.J.; Loveland, T.R.; et al. High-Resolution Global Maps of 21st-Century Forest Cover Change. Science 2013, 342, 850–853. [Google Scholar] [CrossRef] [PubMed]
- Lindgren, D. Deforestation in the North? Available online: http://www.nbforest.info/blog/deforestation-north/ (accessed on 6 March 2019).
- Tropek, R.; Sedlacek, O.; Beck, J.; Keil, P.; Musilova, Z.; Simova, I.; Storch, D. Comment on “High-resolution global maps of 21st-century forest cover change”. Science 2014, 344, 981. [Google Scholar] [CrossRef] [PubMed]
- Ahlstrøm, A.P.; Bjørkelo, K.; Frydenlund, J. AR5 Classification System; 06/2014; Norwegian Forest and Landscape Institute: Ås, Norway, 2014; p. 45. [Google Scholar]
- Heyerdahl, H.; Høydal, Ø.A. Geomorphology and Susceptibility to Rainfall Triggered Landslides in Gudbrandsdalen Valley; Springer: Cham, Switzerland, 2017; pp. 267–279. [Google Scholar]
- Granhus, A.; Fjeld, D. Spatial distribution of injuries to Norway spruce advance growth after selection harvesting. Can. J. For. Res. 2001, 31, 1903–1913. [Google Scholar] [CrossRef]
- Talbot, B.; Tarp, P.; Nitteberg, M. Selecting an appropriate excavator-based yarder concept for Norwegian conditions through the analytic hierarchy process. Int. J. For. Eng. 2014, 25, 113–123. [Google Scholar] [CrossRef]
- Norwegian Mapping Authority. Arearesource (AR). Available online: https://hoydedata.no/LaserInnsyn/ (accessed on 12 April 2018).
- QGIS_Development_Team. QGIS Geographic Information System. Open Source Geospatial Foundation Project. Available online: https://www.osgeo.org/ (accessed on 6 March 2019).
- Norwegian Mapping Authority. Available online: https://www.kartverket.no/en/About-The-Norwegian-Mapping-Authority/ (accessed on 6 March 2019).
- Olofsson, P.; Foody, G.M.; Herold, M.; Stehman, S.V.; Woodcock, C.E.; Wulder, M.A. Good practices for estimating area and assessing accuracy of land change. Remote Sens. Environ. 2014, 148, 42–57. [Google Scholar] [CrossRef] [Green Version]
- Tyukavina, A.; Stehman, S.V.; Potapov, P.V.; Turubanova, S.A.; Baccini, A.; Goetz, S.J.; Laporte, N.T.; Houghton, R.A.; Hansen, M.C. National-scale estimation of gross forest aboveground carbon loss: A case study of the Democratic Republic of the Congo. Environ. Res. Lett. 2013, 8, 044039. [Google Scholar] [CrossRef]
- Tyukavina, A.; Baccini, A.; Hansen, M.C.; Potapov, P.V.; Stehman, S.V.; Houghton, R.A.; Krylov, A.M.; Turubanova, S.; Goetz, S.J. Aboveground carbon loss in natural and managed tropical forests from 2000 to 2012. Environ. Res. Lett. 2015, 10, 074002. [Google Scholar] [CrossRef] [Green Version]
- Murray, A.T. Spatial restrictions in harvest scheduling. For. Sci. 1999, 45, 45–52. [Google Scholar]
- Heinimann, H. A computer model to differentiate skidder and cable-yarder based road network concepts on steep slopes. J. For. Res. 1998, 3, 1–9. [Google Scholar] [CrossRef]
- Heinimann, H.R.; Stampfer, K.; Loschek, J.; Caminada, L. Perspectives on Central European Cable Yarding Systems. In Proceedings of the International Mountain Logging and 11th Pacific Northwest Skyline Symposium, Seattle, WA, USA, 10–12 December 2001. [Google Scholar]
- Aalmo, G.O.; Talbot, B. Operator performance improvement through training in a controlled cable yarding study. Int. J. For. Eng. 2014, 25, 5–13. [Google Scholar] [CrossRef]
- Vinson, J.A.; Barrett, S.M.; Aust, W.M.; Bolding, M.C. Evaluation of Bladed Skid Trail Closure Methods in the Ridge and Valley Region. For. Sci. 2017, 63, 432–440. [Google Scholar] [CrossRef] [Green Version]
- Visser, R.; Stampfer, K. Expanding ground-based harvesting onto steep terrain: A review. Croat. J. For. Eng. 2015, 36, 321–331. [Google Scholar]
- Stampfer, K.; Visser, R.; Kanzian, C. Cable Corridor Installation Times For European Yarders. Int. J. For. Eng. 2006, 17, 71–77. [Google Scholar] [CrossRef]
- Ottaviani, G.; Talbot, B.; Nitteberg, M.; Stampfer, K. Workload benefits of using a synthetic rope strawline in cable yarder rigging in Norway. Croat. J. For. Eng. 2011, 32, 561–569. [Google Scholar]
- TALBOT, B.; Pierzchala, M.; Bjerketvedt, J.; Fjeld, D. Forwarder operating conditions in Norway as quantified through GPS tracking. In Proceedings of the FORMEC From Theory to Practice: Challenges for Forest Engineering. 49th Symposium on Forest Mechanization, Warsaw, Poland, 4–7 September 2016; pp. 271–272. [Google Scholar]
Figure 1.
Location of the Gudbrandsdalen catchment in Norway and topography of the catchment.

Figure 2.
Percentage slopes of the whole Gudbrandsdalen catchment (A,C), and a selected zoom area (522,282 m E, 6,842,455 m N, UTM32) (B,D). A and B show the delineation of the productive forest areas based on the national forest site index map. Low, medium, and high productivity areas are displayed in yellow, light green, and dark green, respectively. C and D show the streams (Strahler stream order higher than 8) overlaid onto the slope map (%) calculated from the digital terrain model (DTM) at 10 m resolution.

Figure 3.
Workflow of the main datasets being analysed (green rounded boxes), other data sources used for masking and stratification (yellow rectangles), intermediate processing (parallelograms), assessment of the forest cover loss (FCL) and forest cover loss enhanced (FCLE) maps (red rectangles), and assessment of harvesting activities (blue rectangles).

Figure 4.
Example of creation of the FCLE by aggregating polygons to represent contiguous harvesting sites and eliminating fragmented small stands. Numbers report the year of harvest after the year 2000, originally recorded (FCL map, left) and retained after thresholding and aggregation (FCLE map, right).

Figure 5.
Area distribution of the harvesting site representations on the original FCL map and the enhanced map (FCLE). The results are shown for the whole data set (A), and a subset of the areas under 5 ha (B). The difference between the green and blue bar-pairs shows the impact of the elimination of fragmented features and aggregation of features into contiguous harvested site representations. Frequency refers to the number of polygons represented within each area class.

Figure 6.
Time periods of the reference data used for the assessment of annual FCL. The productive forest areas of the catchment are covered by aerial imaging campaigns from different time periods. Each of the eight maps report the strata created based on the aerial image cover.
Figure 6.
Time periods of the reference data used for the assessment of annual FCL. The productive forest areas of the catchment are covered by aerial imaging campaigns from different time periods. Each of the eight maps report the strata created based on the aerial image cover.

Figure 7.
Area distribution and frequency of occurrence of the manually delineated harvested sites to area classes (ha).
Figure 7.
Area distribution and frequency of occurrence of the manually delineated harvested sites to area classes (ha).

Figure 8.
Examples of a correctly represented harvesting site in FCLE (A,B), and a large underestimation (C,D).
Figure 8.
Examples of a correctly represented harvesting site in FCLE (A,B), and a large underestimation (C,D).

Figure 9.
Polar scatter plot of the centroid offset. The centroids of the manually delineated harvesting site polygons are normalised to the axis zeros, and the differences to the centroids of the FCLE representations are plotted. The red point shows the average offset. Colours indicate distance classes.

Figure 10.
Scatter plot of the explanatory variables (mean slope, maximum slope, isoperimetric quotient, area and altitude), and response variables (percentage area error, offset distance, azimuth of the offset).
Figure 10.
Scatter plot of the explanatory variables (mean slope, maximum slope, isoperimetric quotient, area and altitude), and response variables (percentage area error, offset distance, azimuth of the offset).

Figure 11.
Development of the FCLE area error over time.

Figure 12.
Changes over time in number of harvesting site representations (frequency) and total cut areas based on the FCLE map.
Figure 12.
Changes over time in number of harvesting site representations (frequency) and total cut areas based on the FCLE map.

Figure 13.
Evolution of the average harvested site area over time (by slope class, %).


Table 1.
Confusion matrix based on the reference observations. Plain values show the results of the whole data set; the data used for post-stratification are in parenthesis.
Table 1.
Confusion matrix based on the reference observations. Plain values show the results of the whole data set; the data used for post-stratification are in parenthesis.
| Forest Cover Loss in Reference Observations | ||||
|---|---|---|---|---|
| No | Yes | Total | ||
| Forest cover loss in the FCL and FCLE maps | No | 714 (634) | 9 (9) | 723 (643) |
| Yes | 1 (1) | 10 (9) | 11 (10) | |
| Total | 715 (635) | 19 (18) | 734 (653) | |
| Kappa: 0.66 | Commission error forest cover loss: 0.1% | Omission error forest cover loss: 47.6% | Overall accuracy: 98.6% | |
Table 2.
Confusion matrix based on the reference observations. Plain values show the results of the whole data set; the data used for post-stratification are in parenthesis.
Table 2.
Confusion matrix based on the reference observations. Plain values show the results of the whole data set; the data used for post-stratification are in parenthesis.
| Forest cover loss in reference observations | ||||
|---|---|---|---|---|
| No | Yes | Total | ||
| Forest cover loss in the FCL and FCLE maps | No | 714 (634) | 12 (12) | 726 (646) |
| Yes | 1 (1) | 10 (9) | 11 (10) | |
| Total | 715 (635) | 22 (21) | 737 (656) | |
| Kappa: 0.6 | Commission error forest cover loss: <0.1% | Omission error forest cover loss: 54.9% | Overall accuracy: 98.2% | |
Table 3.
Summary statistics of the area error and percentage area error of the harvesting site representations on the FCLE compared to the manually delineated harvesting sites.
Table 3.
Summary statistics of the area error and percentage area error of the harvesting site representations on the FCLE compared to the manually delineated harvesting sites.
| Variable | Area Error (ha) | Area Error (%) |
|---|---|---|
| average | 1.9 | 28.9 |
| RMSE | 2.9 | 39.7 |
| max | 12.3 | 99.2 |
| min | −2.4 | −70 |
© 2019 by the authors. Licensee MDPI, Basel, Switzerland. This article is an open access article distributed under the terms and conditions of the Creative Commons Attribution (CC BY) license (http://creativecommons.org/licenses/by/4.0/).
Share and Cite
MDPI and ACS Style
Rossi, F.; Breidenbach, J.; Puliti, S.; Astrup, R.; Talbot, B. Assessing Harvested Sites in a Forested Boreal Mountain Catchment through Global Forest Watch. Remote Sens. 2019, 11, 543. https://doi.org/10.3390/rs11050543
AMA Style
Rossi F, Breidenbach J, Puliti S, Astrup R, Talbot B. Assessing Harvested Sites in a Forested Boreal Mountain Catchment through Global Forest Watch. Remote Sensing. 2019; 11(5):543. https://doi.org/10.3390/rs11050543
Chicago/Turabian StyleRossi, Fernando, Johannes Breidenbach, Stefano Puliti, Rasmus Astrup, and Bruce Talbot. 2019. "Assessing Harvested Sites in a Forested Boreal Mountain Catchment through Global Forest Watch" Remote Sensing 11, no. 5: 543. https://doi.org/10.3390/rs11050543
Note that from the first issue of 2016, this journal uses article numbers instead of page numbers. See further details here.