Article

Comparison of Different Algorithms to Map Hydrothermal Alteration Zones Using ASTER Remote Sensing Data for Polymetallic Vein-Type Ore Exploration: Toroud–Chahshirin Magmatic Belt (TCMB), North Iran

1
School of Earth Sciences, Damghan University, Damghan 3671641167, Iran
2
Korea Polar Research Institute (KOPRI), Songdomirae-ro, Yeonsu-gu, Incheon 21990, Korea
3
Center for Advanced Modelling and Geospatial Information Systems (CAMGIS), Faculty of Engineering and Information Technology, University of Technology Sydney, 2007 New South Wales, Australia
4
Department of Energy and Mineral Resources Engineering, Choongmu-gwan, Sejong University, 209 Neungdong-ro Gwangjin-gu, Seoul 05006, Korea
5
Division of Science Education, Kangwon National University, 1 Kangwondaehak-gil, Chuncheon-si 24341, Korea
6
Department of Ecology, Institute of Science and High Technology and Environmental Sciences Graduate University of Advanced Technology, Kerman 7631133131, Iran
*
Authors to whom correspondence should be addressed.
Remote Sens. 2019, 11(5), 495; https://doi.org/10.3390/rs11050495
Submission received: 31 January 2019 / Revised: 20 February 2019 / Accepted: 22 February 2019 / Published: 1 March 2019

Abstract

:
Polymetallic vein-type ores are important sources of precious metal and a principal type of orebody for various base-metals. In this research, Advanced Spaceborne Thermal Emission and Reflection Radiometer (ASTER) remote sensing data were used for mapping hydrothermal alteration zones associated with epithermal polymetallic vein-type mineralization in the Toroud–Chahshirin Magmatic Belt (TCMB), North of Iran. The TCMB is the largest known goldfield and base metals province in the central-north of Iran. Propylitic, phyllic, argillic, and advanced argillic alteration and silicification zones are typically associated with Au-Cu, Ag, and/or Pb-Zn mineralization in the TCMB. Specialized image processing techniques, namely Selective Principal Component Analysis (SPCA), Band Ratio Matrix Transformation (BRMT), Spectral Angle Mapper (SAM) and Mixture Tuned Matched Filtering (MTMF) were implemented and compared to map hydrothermal alteration minerals at the pixel and sub-pixel levels. Subtle differences between altered and non-altered rocks and hydrothermal alteration mineral assemblages were detected and mapped in the study area. The SPCA and BRMT spectral transformation algorithms discriminated the propylitic, phyllic, argillic and advanced argillic alteration and silicification zones as well as lithological units. The SAM and MTMF spectral mapping algorithms detected spectrally dominated mineral groups such as muscovite/montmorillonite/illite, hematite/jarosite, and chlorite/epidote/calcite mineral assemblages, systematically. Comprehensive fieldwork and laboratory analysis, including X-ray diffraction (XRD), petrographic study, and spectroscopy were conducted in the study area for verifying the remote sensing outputs. Results indicate several high potential zones of epithermal polymetallic vein-type mineralization in the northeastern and southwestern parts of the study area, which can be considered for future systematic exploration programs. The approach used in this research has great implications for the exploration of epithermal polymetallic vein-type mineralization in other base metals provinces in Iran and semi-arid regions around the world.

Graphical Abstract

1. Introduction

Since the Bronze Age, polymetallic vein-type ores have been important sources of precious metal and established a main type of deposit for various base-metals [1,2,3,4,5]. Polymetallic vein-type ore deposits precipitated in the geological structures such as faults, fractures, brecciated rocks, and porous layers, where the pressure, temperature, and several other chemical factors are suitable for the precipitation [1,6]. Moreover, during the ore mineral precipitation processes, hydrothermal fluids react with the mineral constituents of lithological units they are passing and produce hydrothermal alteration zones with distinctive mineral assemblages [7]. The presence of intrusive rocks and hydrothermal alteration zones associated with polymetallic vein-type deposits provide an important guide for exploring this type of ore mineralization especially by the application of advanced satellite remote sensing data [8,9].
The Advanced Spaceborne Thermal Emission and Reflection Radiometer (ASTER) contains appropriate spectral and spatial resolution to detect spectral absorption features of hydrothermal alteration minerals and lithological units [10,11,12,13,14,15,16]. ASTER datasets can be used to identify and remotely map hydrothermal alteration zones associated with polymetallic vein-type ore deposits in vegetated regions and well-exposed terrain, especially in a semi-arid environment [8,9,17]. ASTER measures reflected radiation in three bands in the 0.52- to 0.86 μm (the visible and near-infrared (VNIR)), six bands in the 1.6- to 2.43 μm (the shortwave infrared (SWIR)), and five bands of emitted radiation in the 8.125- to 11.65 μm (the thermal infrared (TIR)) with 15, 30, and 90 meter resolution, respectively [18,19]. Hydrothermal alteration zones associated with various ore deposits such as porphyry copper, orogenic gold, epithermal gold, massive sulfide, iron, and chromite deposits have been successfully detected and mapped using ASTER imagery in metallogenic provinces around the world [20,21,22,23,24,25,26,27]. Specifically, some studies used ASTER data for the exploration of polymetallic vein-type ore deposits. Mahanta and Maiti [8] used ASTER VNIR+SWIR spectral data for mapping alteration zones such as kaolinization, ferruginization, silicification, phosphatization, and sulphidation associated with the polymetallic vein-type mineralization in the South Purulia Shear Zone (SPSZ), East India. In a recent work, Ahmadirouhani et al. [9] identified and mapped hydrothermal alteration zones, including propylitic, phyllic, argillic, and gossan with Cu-Fe-Au vein-type mineralization using ASTER VNIR+SWIR spectral bands in the Bajestan region, northern sector of the Lut Block, East Iran.
The Toroud–Chahshirin Magmatic Belt (TCMB) is located in Semnan province, central-north Iran (Figure 1A) and contains numerous occurrences of epithermal polymetallic vein-type mineralization (Figure 1B). The TCMB is the largest known goldfield and base metals province in central-north Iran [28,29]. Hydrothermally altered zones are reportedly associated with polymetallic vein-type mineralization in this belt [29,30,31,32,33]. Propylitic, phyllic, argillic, and advanced argillic alteration and silicification occur generally with Au-Cu, Ag, and/or Pb-Zn mineralization. Therefore, mapping and identification of hydrothermal alteration mineral assemblages using ASTER satellite remote sensing data in the TCMB can be considered as a cost-effective and applicable tool for targeting and prospecting epithermal polymetallic vein-type mineralization. In this research, the Moaleman region of the TCMB was selected (Figure 1B). This region has a high potential for epithermal polymetallic vein-type mineralization, particularly anomal Cu-Au values associated with altered dacite and dacite-andesite and volcaniclastics rocks [30,34,35]. Since no report on a comprehensive remote sensing investigation is available for epithermal Cu-Au exploration in the Moaleman region of the TCMB, results of an ASTER remote sensing mapping are necessary for future systematic exploration projects. The main objectives of this study are (i) to detect hydrothermal alteration mineral zones and assemblages using VNIR and SWIR spectral bands of ASTER data by application of specialized image processing techniques, including Selective Principal Component Analysis (SPCA) [36,37], Band Ratio Matrix Transformation (BRMT) [16], Spectral Angle Mapper (SAM) [38], and Mixture Tuned Matched Filtering (MTMF) [39,40,41]; (ii) to compare the results derived from SPCA and BRMT transformation algorithms and SAM and MTMF spectral mapping algorithms to map alteration minerals at the pixel and sub-pixel levels and (iii) to prospect high potential zones of epithermal Cu-Au mineralization for future systematic exploration programs in the study area.

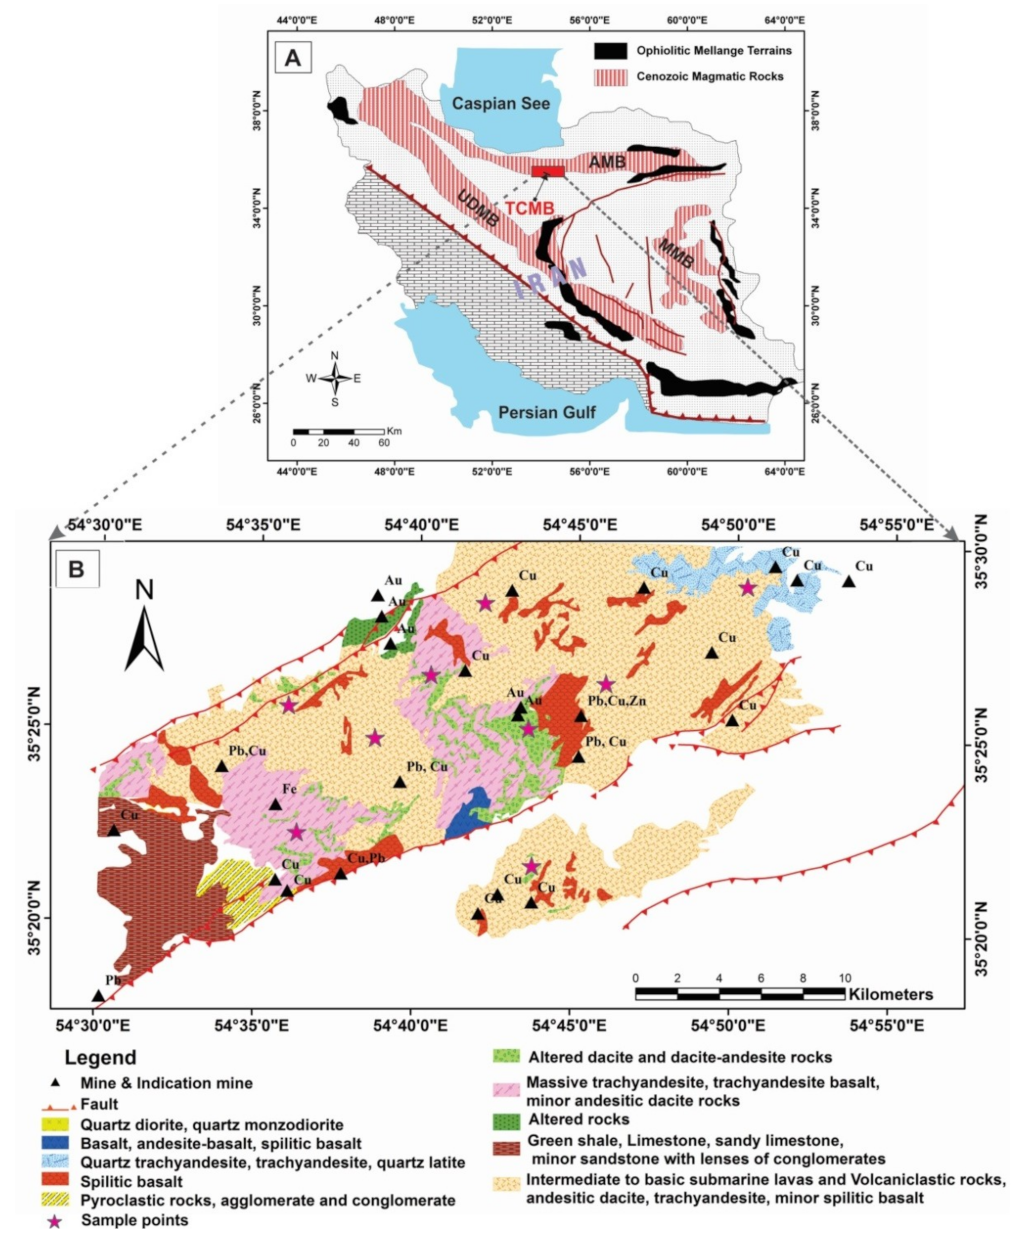
2. Geology of the TCMB and Mineralization

The TCMB is situated in the central to eastern Alborz Magmatic Belt (AMB) and lies in the northern part of the Central Iran Structural Zone (CISZ) (Figure 1A). It is restricted between the E–W trending Toroud fault in the south and the E–W trending Anjilou fault in the north [29]. This magmatic arc has a complex tectonic, magmatic, and stratigraphy history [29,30]. Alavi et al. [43] and Alavi [44] and proposed that Torud–Chahshiran range and adjacent volcanic rocks are displaced to Eocene magmatism in the CISZ to the south. The Magmatic arc contains mainly of igneous rocks of Tertiary age, while there are also scattered outcrops of metamorphosed Paleozoic and Mesozoic rocks [45]. Most of the magmatic activities in the TCMB occurred in the middle to late Eocene and have been divided into three stages from oldest to youngest, including (i) explosive volcanic activity represented by rhyolite to rhyodacite tuffs and locally andesitic lava flows, with subordinate marls, tuffaceous marlstones, and sandstones; (ii) lava flows and pyroclastic rocks of andesite, trachyandesite, and basaltic andesite composition; and (iii) subordinate dacitic-rhyodacitic rocks and hypabyssal intrusive rocks [46].
In the magmatic belt, many of the known mined deposits (gold and base metals) are associated with hydrothermally altered zones [30,31]. These deposits mostly include epithermal veins such as Kuhe Zar (Au-Cu), Abolhassani (Pb-Zn-Ag-Au), Pousideh (Cu), Dian (Cu), Cheshmeh Hafez (Pb-Zn), Gandy (Au-Ag, Pb-Zn), Chahmussa (Cu), Darestan (Cu), and Robae (Fe-Cu) mineralization zones. Moreover, Baghu (placer gold, turquoise) and Challu (Cu), Khanjar (Pb-Ag-Zn) are other types of mineralization in the sedimentary rocks of the TCMB [30,47,48,49,50]. Hydrothermal alterations such as propylitic, phyllic, argillic and advanced argillic, and silicification are reported in this magmatic arc, generally where alkaline to sub-alkaline plutonic rocks such as andesite are intruded into hosted volcano pyroclastic rocks [29,47]. For instance, mineralization in the Gandy deposit occurs in quartz-sulfide veins and breccias and is associated with alteration halos of argillic and propylitic (approximately 4 km) as well as narrow supergene jarosite, kaolinite, and iron hydroxide [29,31]. The granodiorite rocks are intruded in pyroclasitic and andesitic lavas in the Kuh-Zar deposit and Au and Cu rich hydrothermal fluids affected the host rocks which were followed by propylitic, phyllic, argillic and silicification alterations [50]. In the Moaleman area, mineralization is controlled by major faults. Numerous ore mineralizations such as Cu, Au, Pb, Zn, and Fe were reported in this area (Figure 1B). Although these deposits have a small size, most of them contain valuable economic mineralization [35].

3. Materials and Methods

3.1. Pre-processing of the Remote Sensing Data

A cloud-free level 1B ASTER in hierarchical data format (HDF) that was acquired on 25 March 2003 was used for remote spectral analyses in this study. This image was pre-georeferenced to UTM zone 40 North projections with using the WGS-84 data. The SWIR bands re-sampled to the spatial resolution of VNIR so that all pixels of nine bands (VNIR+SWIR) with 15*15 m2 pixel size were stacked. The level 1B data product measures radiance at the sensor without atmospheric corrections [18]. Therefore, atmospheric correction is necessary before image processing analysis for converting radiance-calibrated data to apparent reflectance. The Log-residual atmospheric correction technique was applied to the ASTER image in this study. The Log Residuals calibration is capable to remove atmospheric transmittance, topographic effects, solar irradiance, and albedo effects [51,52]. It produces a pseudo reflectance image, which is highly applicable for detecting absorption features related to alteration minerals. Additionally, Crosstalk correction was applied to the ASTER dataset [53]. We have performed this correction by Cross-Talk correction software that is available from www.gds.aster.ersdac.or.jp. The ENVI (Environment for Visualizing Images, http://www.exelisvis.com) version 5.2 and ArcGIS version 10.3 software (Esri, Redlands, CA, USA) packages were used to process the remote sensing datasets.

3.2. Image Processing Algorithms

The main target of the specialized image processing techniques adopted in this study was to apply image processing techniques that are capable of mapping hydrothermal alteration minerals at the pixel and sub-pixel levels using VNIR+SWIR spectral bands of ASTER data. Therefore, subtle differences between altered and non-altered rocks and hydrothermal mineral assemblages could be feasible by implementing specialized image processing techniques as follows.

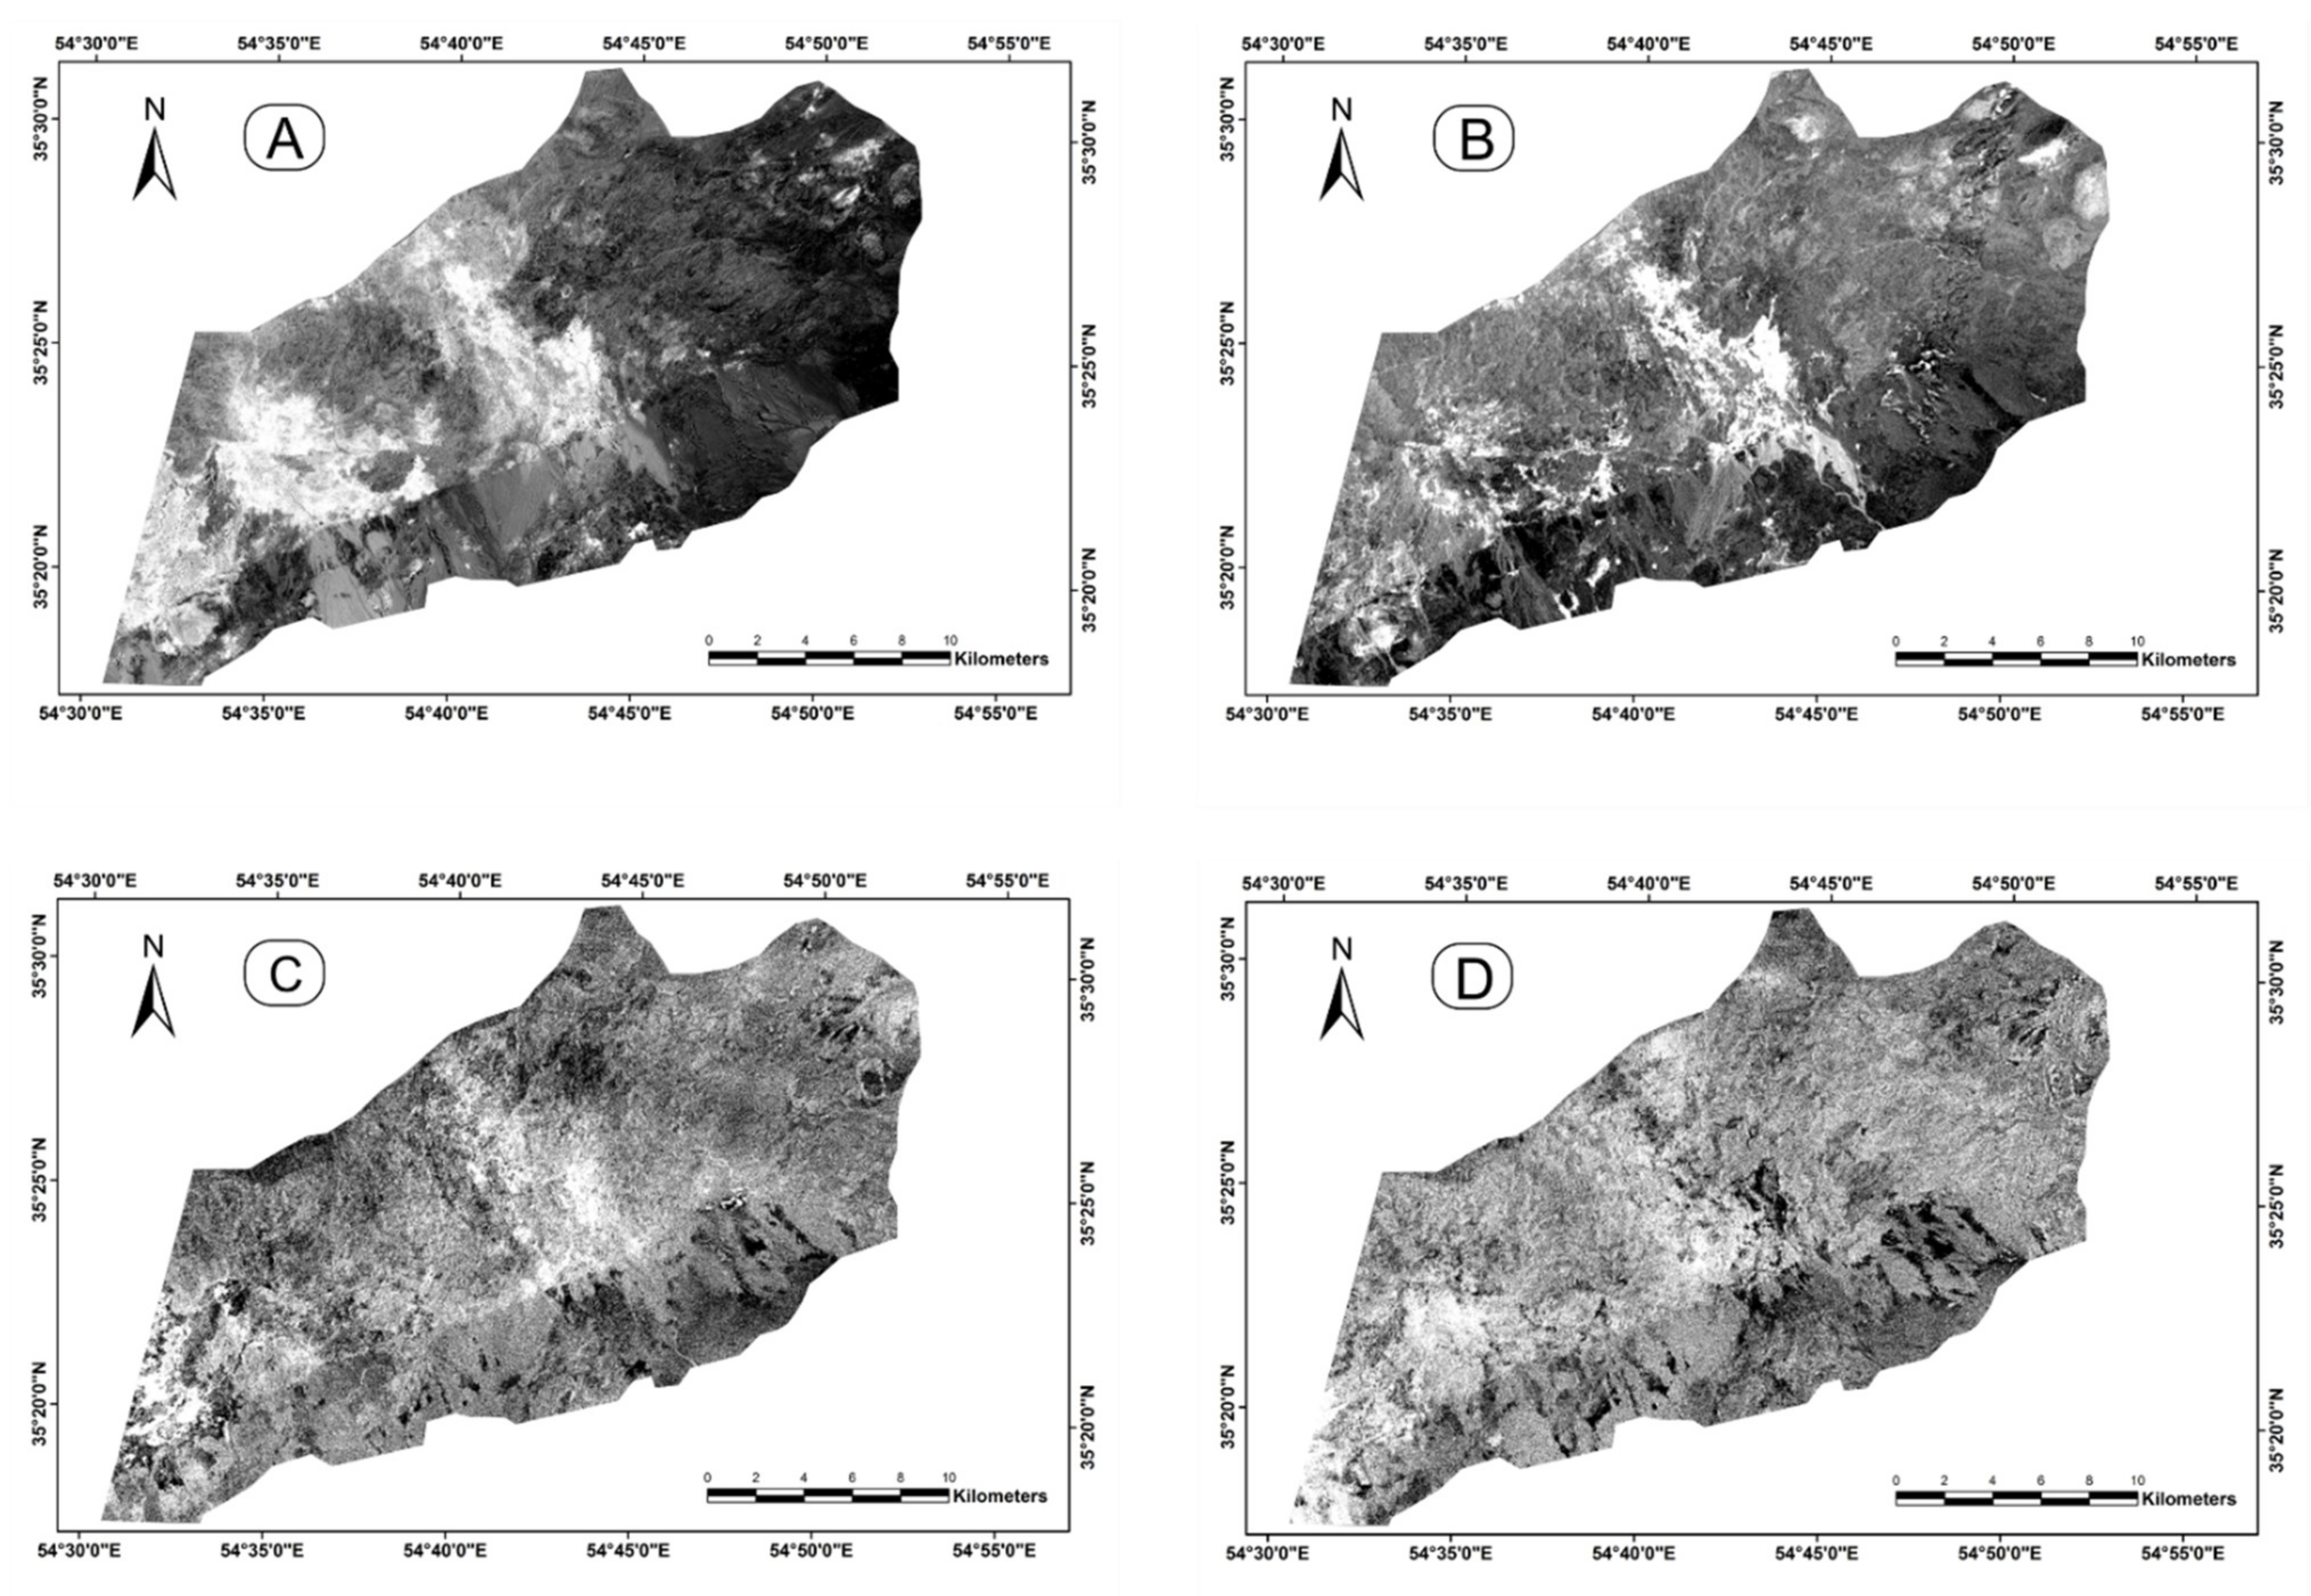
3.2.1. Principal Component Analysis (PCA)

The PCA is a multivariate statistical technique that used to reduce the dimensionally of input data and reduces the additional frequency among the data, as a result, the possibility of useful data loss is minimized. This information in terms of quantity is a very small part of the overall information content available in original bands. Spectral bands are selected that contain absorption and reflection features of alteration minerals. In this way, a new image (PC) is generated on the axes with the new coordinate system [36,37]. The resulting component is more interpretable than are the original images. A PC image contains the unique contribution of eigenvector loadings (magnitude and sign) for absorption and reflection bands of alteration mineral or mineral group is able to enhance the mineral or mineral group. If the loading is positive in the reflective band of a mineral the image tone will be bright, and if it is negative, the image tone will be dark for the enhanced target mineral [37]. The PCA technique has been applied to multispectral remote sensing data such as ASTER for highlighting spectral responses related to specific hydrothermal alteration minerals associated with porphyry copper mineralization [54,55,56,57,58,59].
In this research, the Selective Principal Component Analysis (SPCA) [60], known also as Directed Principal Component Analysis (DPCA) [61], was applied on VNIR+SWIR bands for mapping the specific alteration zones associated with polymetallic vein-type mineralization in the study area. The basic difference between the PCA and SPCA is that in the SPCA only a subgroup of bands is selected depending on the aims that plan to be achieved. In this study, according to the known ASTER band indices for hydrothermal alteration mineral mapping [62,63,64,65], some subsystems (specific bands) were selected for SPCA analysis. Bands 1, 2, and 4 were selected for mapping iron oxides/hydroxide minerals (Table 1A). Bands 4, 5, and 6 were designated for argillic alteration mapping (Table 1B). Bands 5, 6, and 7 were nominated to specify phyllic zone (Table 1C) and bands 7, 8, and 9 were used to map propylitic alteration zones.

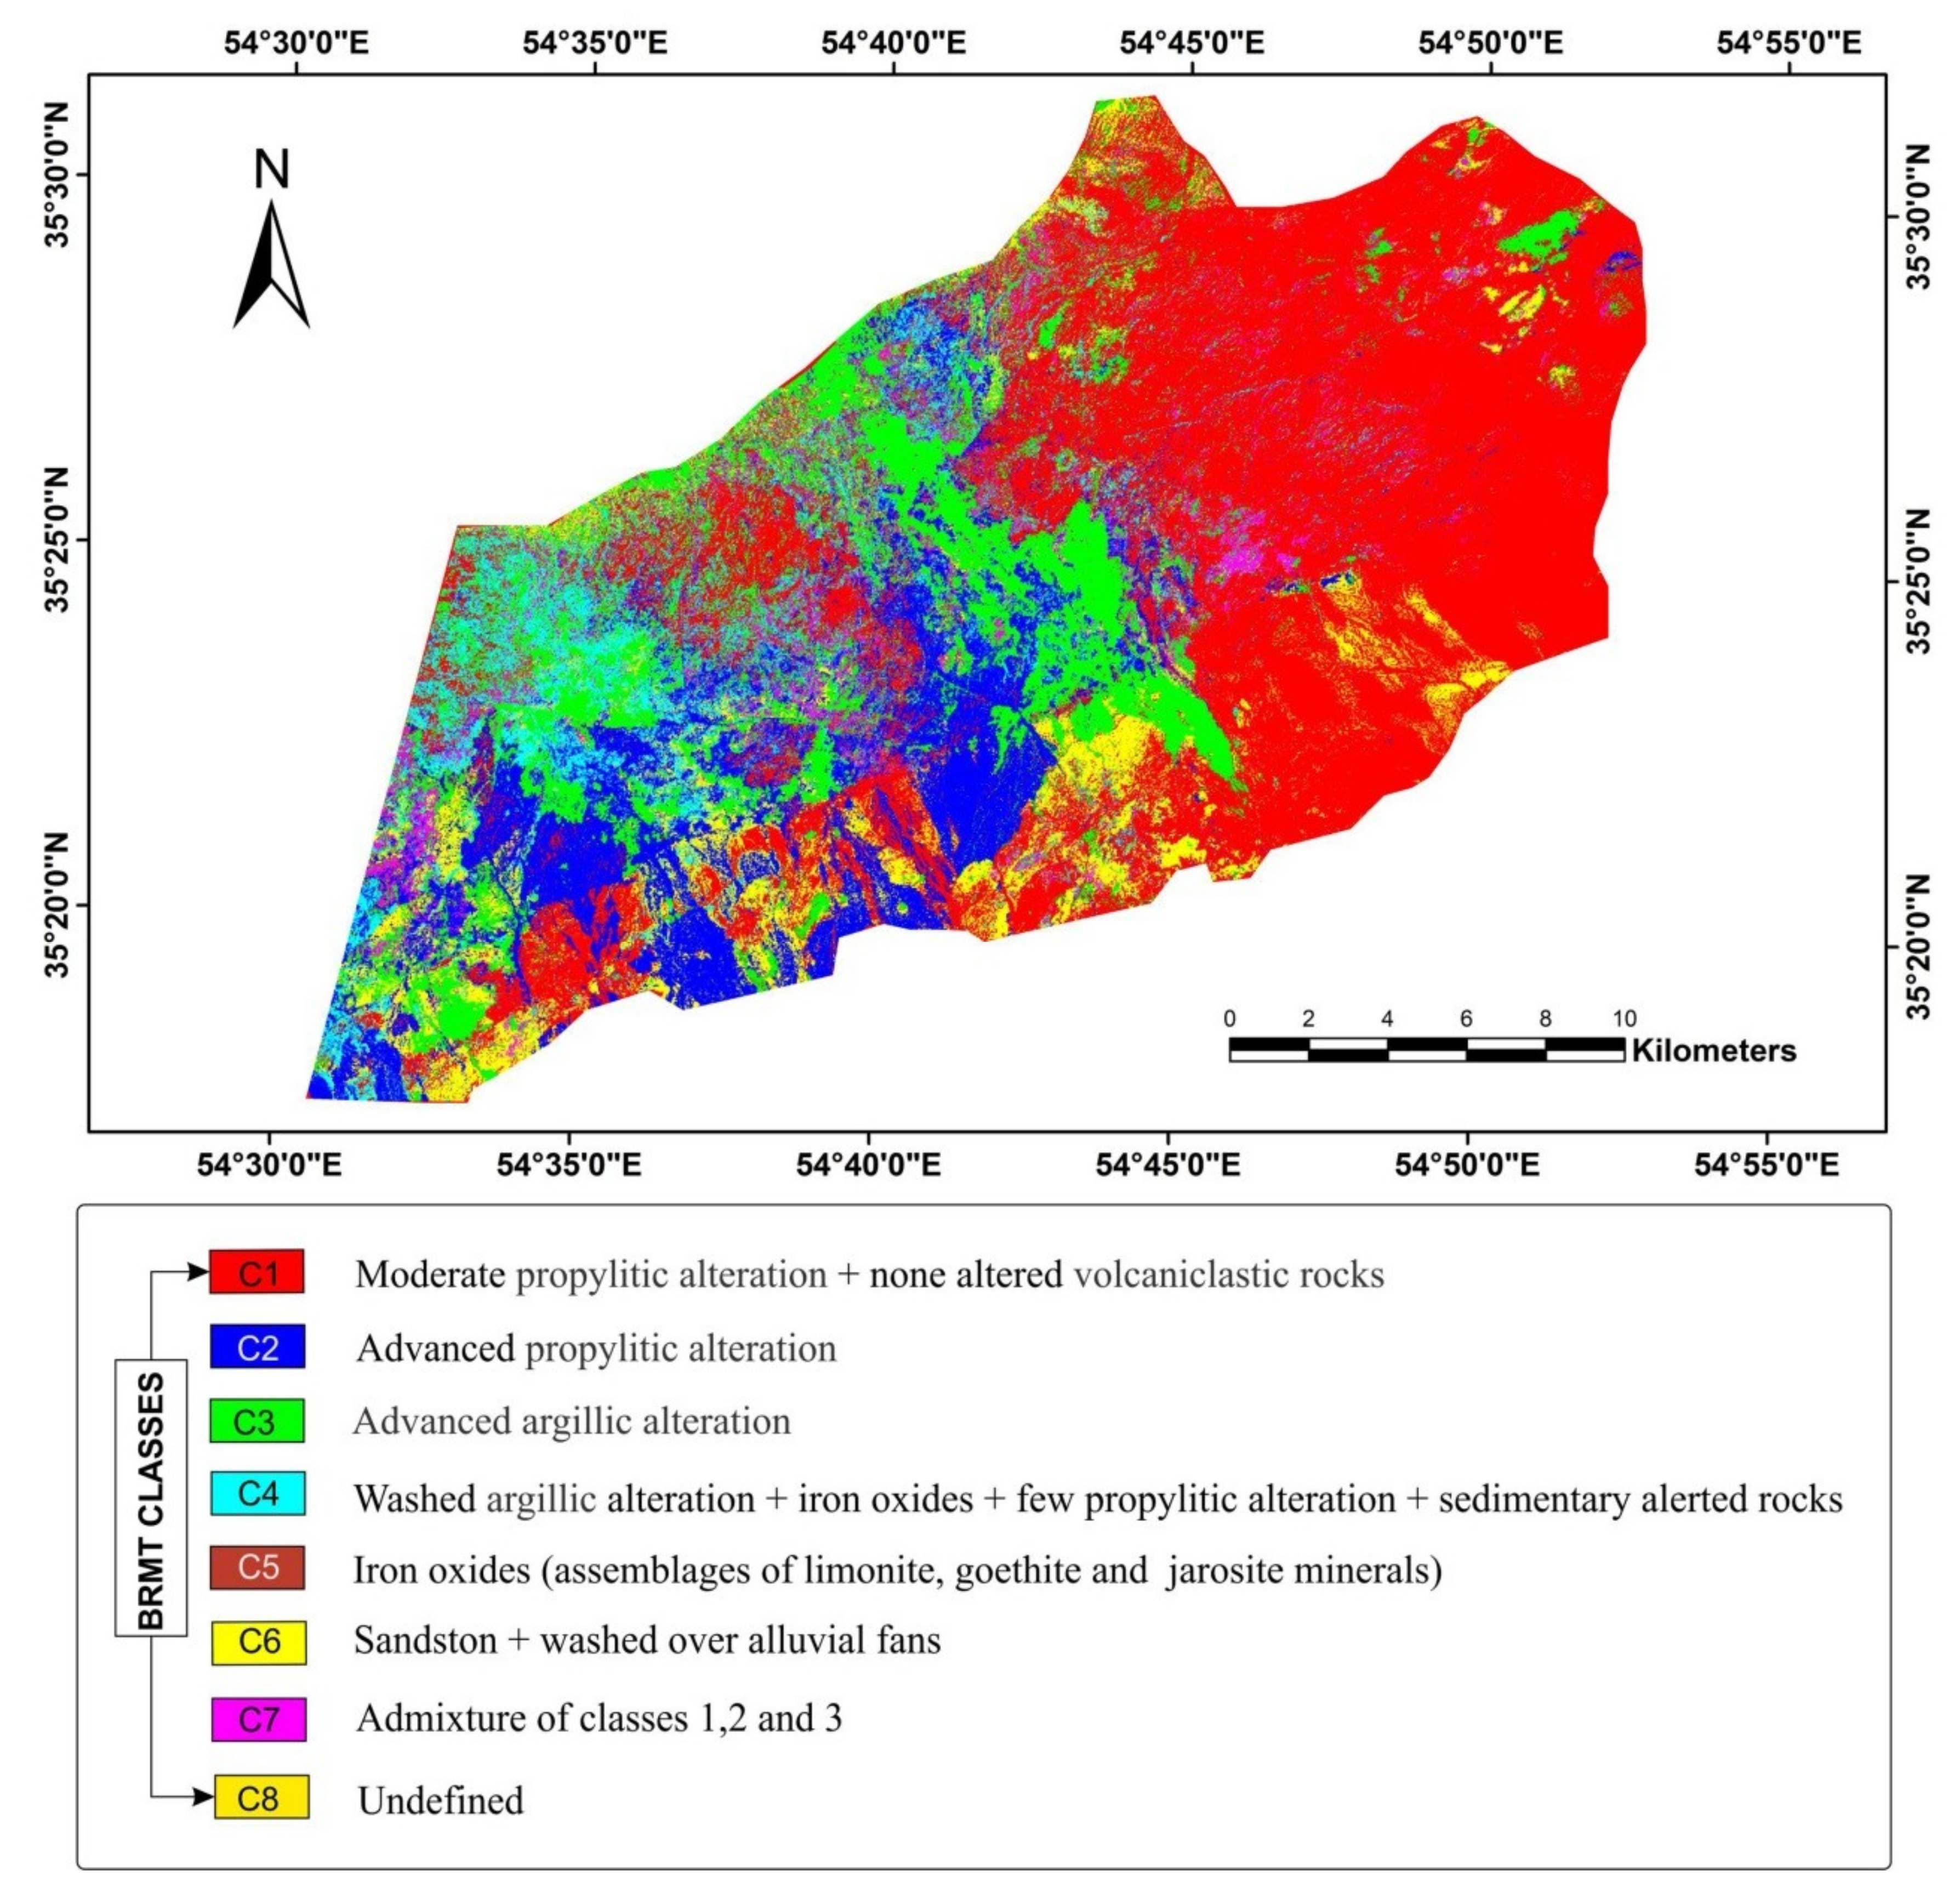
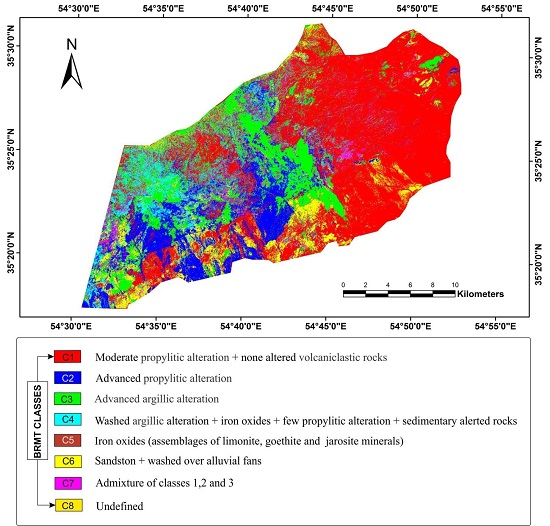
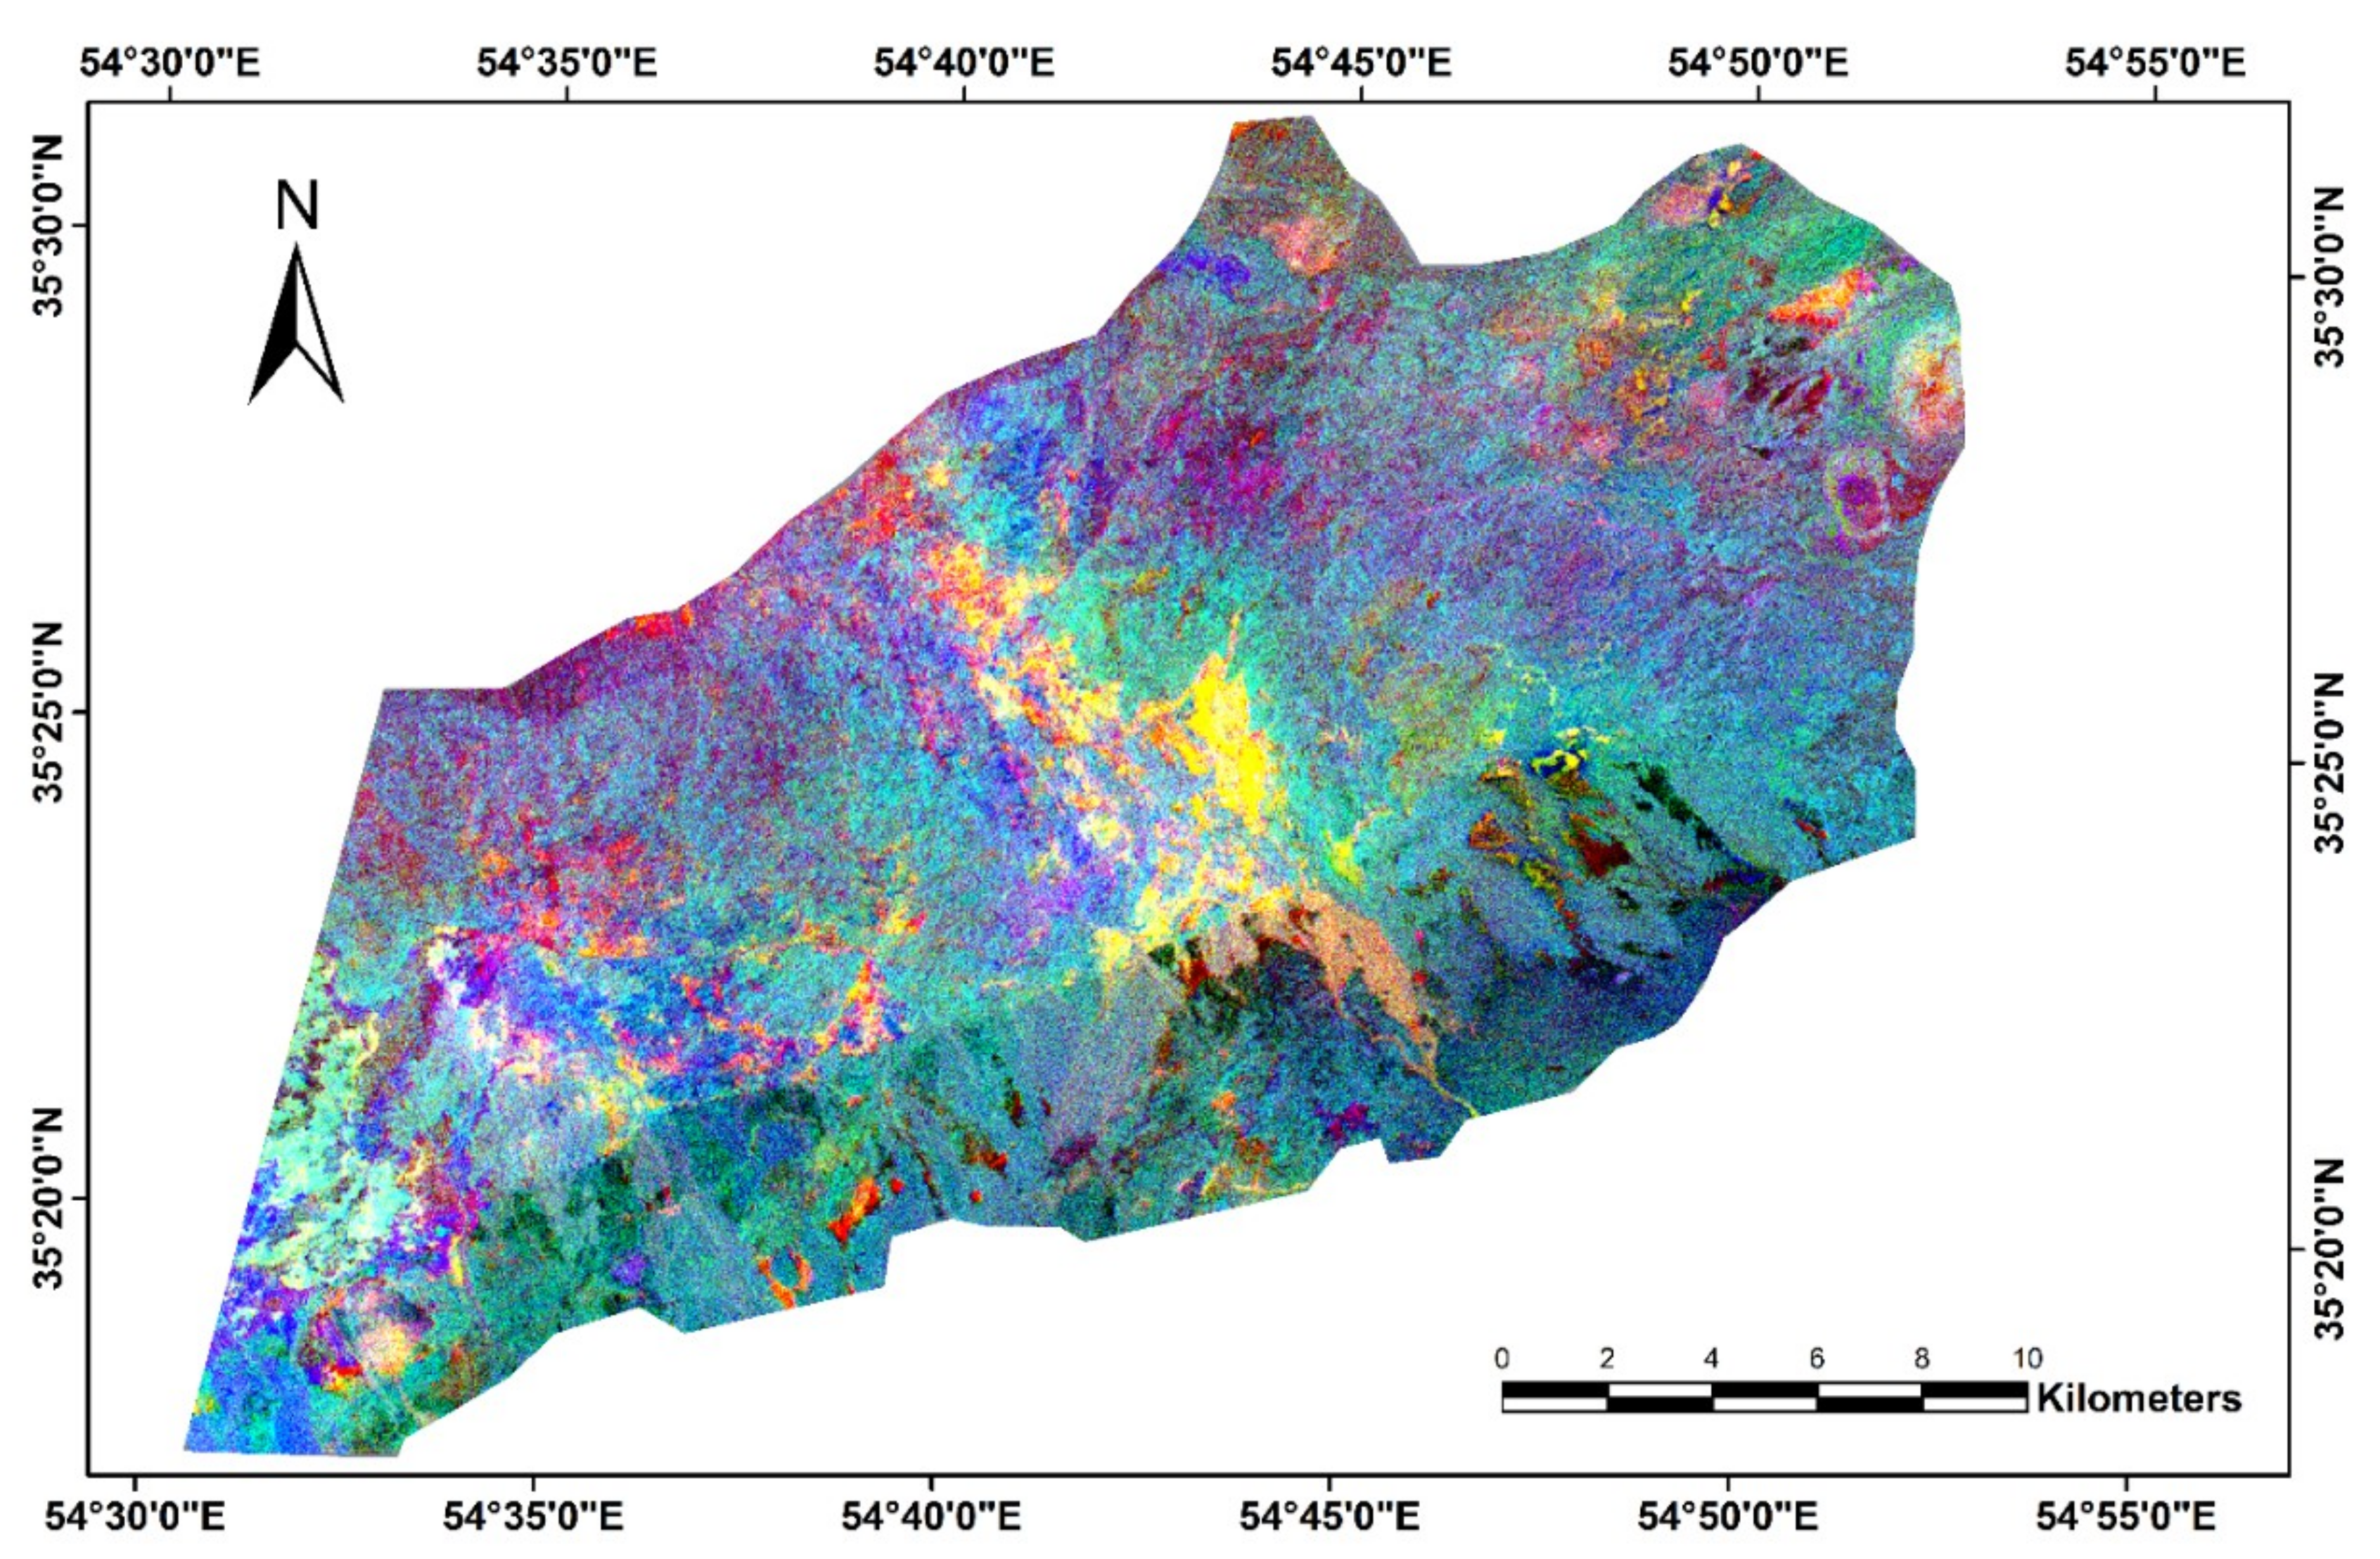
3.2.2. Band Ratio Matrix Transformation (BRMT)

The Band Ratio Matrix Transformation (BRMT) is a semiautomatic lithological-mineralogical mapping technique, which is proposed and established for sedimentary strata discrimination [16]. This analytical method extracts key spectral characteristics using VNIR and SWIR spectral bands of ASTER. Although BRMT methodology is proposed for sedimentary rocks discrimination, the effectiveness of this technique for mapping hydrothermal alteration zones in igneous rocks background is promising. The robustness of BRMT arises from a combination of statistical factors, including variance percent (V%), positive and negative correlation averages (±r), correlation averages (±rk), and contribution percent (C%). It maps key spectral characteristics using RGB color composites and rule classifier of the band ratio (BR) and band transform (BT) bands. In this study, the BRMT method was applied to VNIR+SWIR bands of ASTER data for detailed mapping of hydrothermal alteration zones in the study area. Table 2 shows positive and negative correlation and contribution percent of the band ratios n1–n36 used for BRMT transformation. Table 3 shows eigenvalues, variance percent (%V), positive and negative correlation averages (+rk > 0.1 and −rk < 0.1), and correlation percent of BT1 to BT10, which hold maximum spectral properties extracted from the image. The selected BT bands containing specific spectral properties (negative and positive contribution percent >3%) are listed in Table 4.

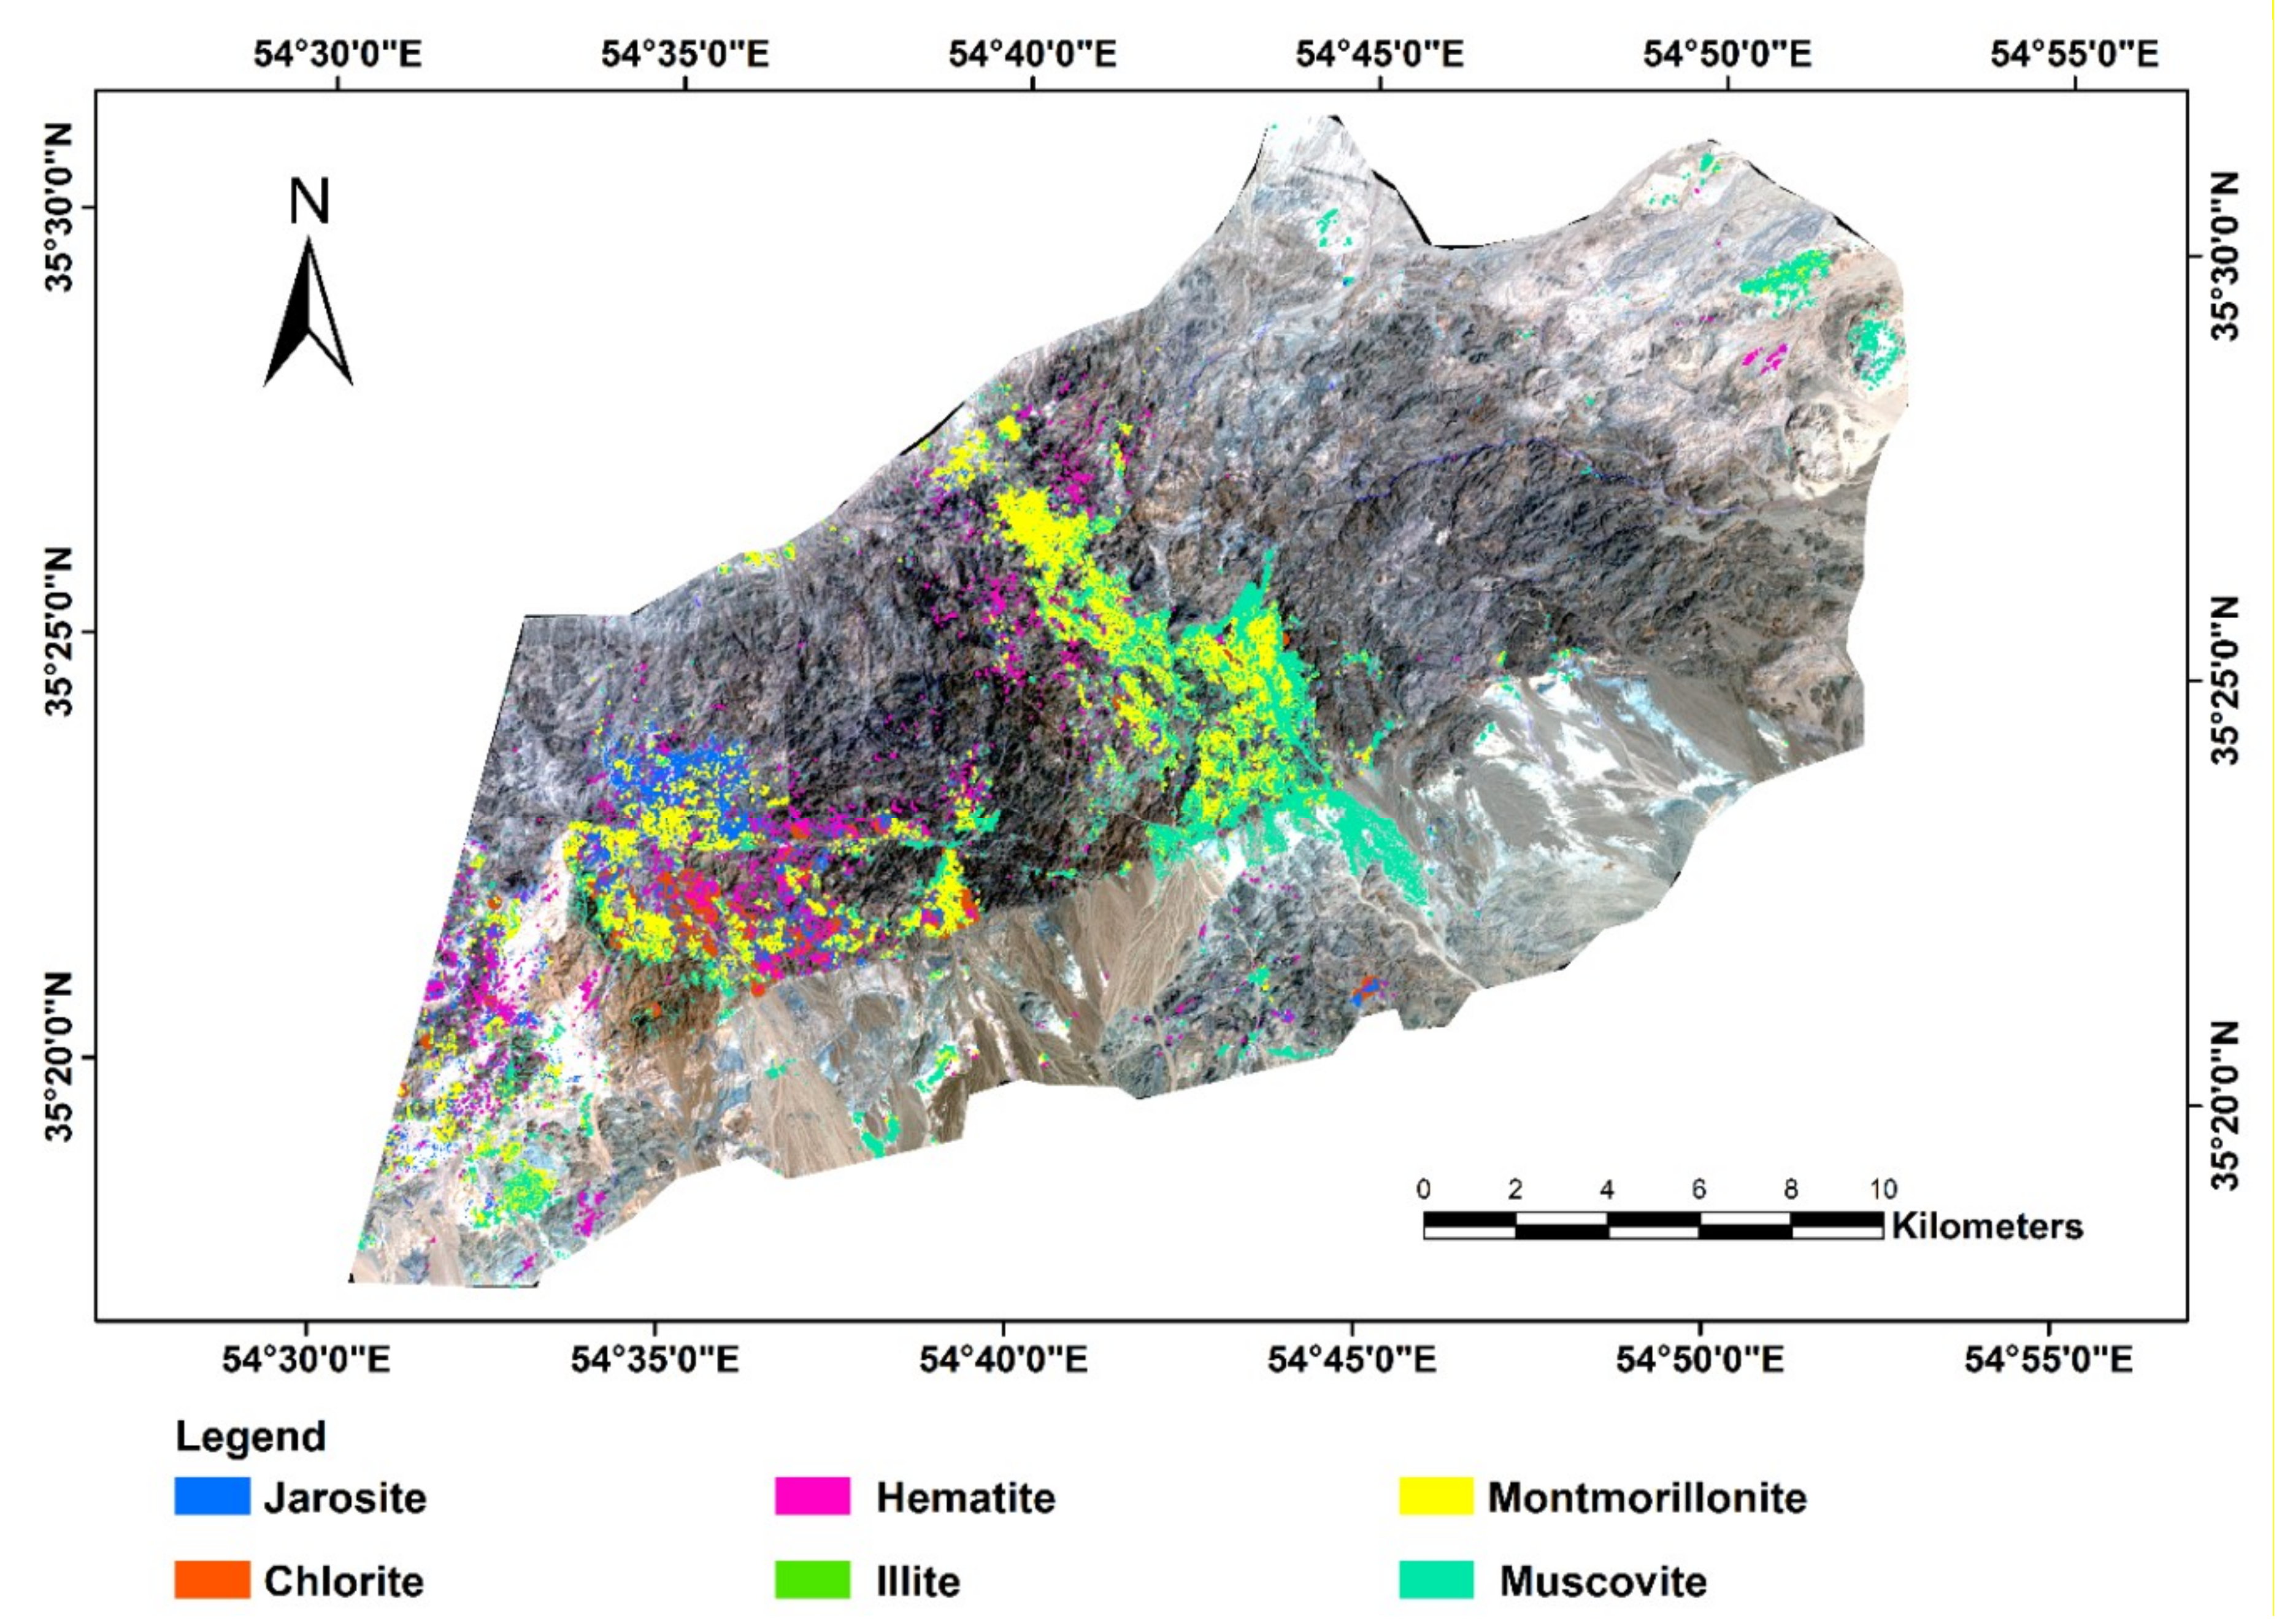
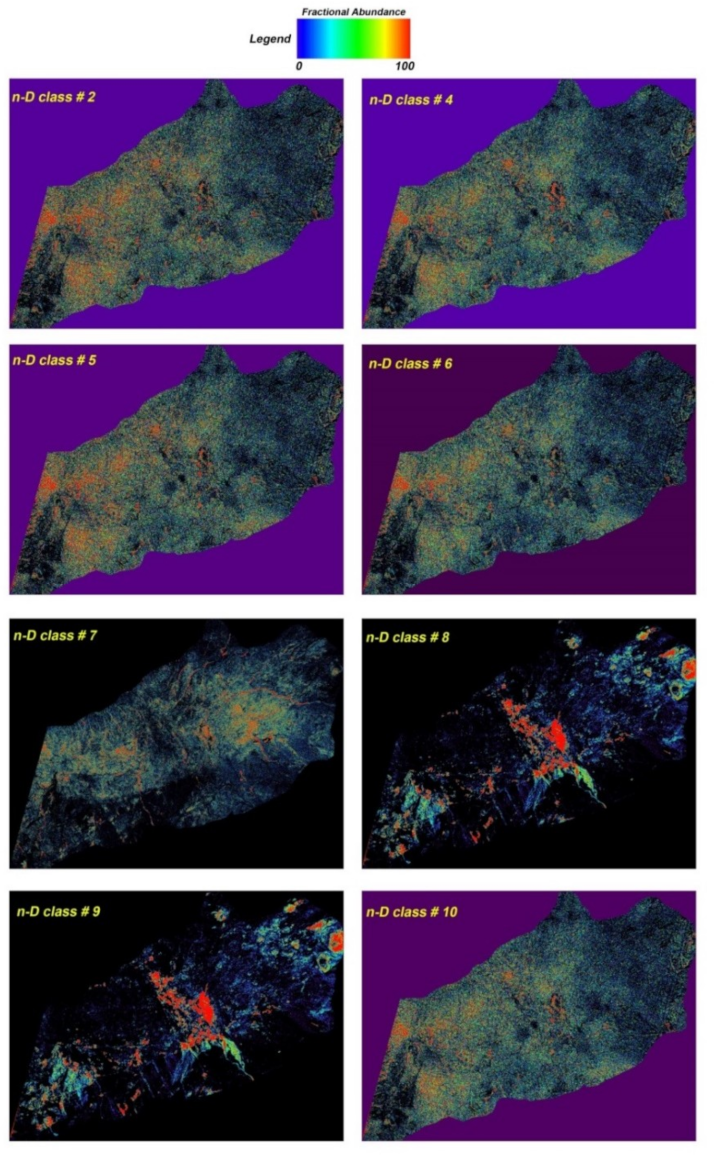
3.2.3. Mixture Tuned Matched Filtering (MTMF)

The MTMF is a partial unmixing, hybrid method based on the combination of well-known signal processing methodologies and liner mixture theory [39,40,41]. MTMF consist of two phases, an MF calculation for abundance estimation and a mixture tuning calculation for the identification and rejection of false positives [6,7,8,9,10,11,12,13,14,15,16,17,18,19,20,21,22,23,24,25,26,27,28,29,30,31,32,33,34,35,36,37,38,39,40,41,42,43,44,45,46,47,48,49,50,51,52,53,54,55,56,57,58,59,60,61,62,63,64,65,66,67,68]. In this study, the endmembers were extracted from the image using the Minimum Noise Fraction (MNF), Pixel Purity Index (PPI), and n-dimensional visualization techniques [69,70]. The MNF method was accomplished to separate noise from the data. The PPI detects the highest purity pixels in the image. The n-dimensional visualization was used to locate, identify, and cluster the purest pixels and the most extreme spectral responses (endmembers) in the VNIR+SWIR ASTER dataset. The threshold of 2.5 was applied to PPI. The output of PPI represents as bright pixels (more purity) and dark pixels (less spectral purity). After applying the n-dimensional visualization method, 10 n-D classes (endmembers) were extracted, which indicate distinctive absorption features related to alteration minerals. Figure 2 shows the extracted endmember spectra (n-D classes) for the study area. Comparison of the absorption characteristics of the extracted endmembers (n-D classes) with the USGS spectral library is considered for identification of alteration minerals.

3.2.4. Spectral Angle Mapper (SAM)

The SAM is a classification method that classifies the pixels based on similar spectral properties with reference spectra [38]. It uses endmember spectra that can be extracted directly from the image or spectral library. This process of calculating the spectral angle between the reference spectra and image determines the similarity of these two groups. The outputs of the algorithm are angles between zero and one. The large angle shows less similarity and the smaller angle more similarity [71,72]. In this analysis, the SAM was applied to VNIR+SWIR ASTER bands with default value 0.1 (radians) as a threshold, and the spectra for running the algorithm were obtained from the USGS library as reference spectra [73]. Figure 3 shows end-member minerals extracted from the USGS library, including hematite, jarosite, montmorillonite, illite, muscovite, and chlorite.

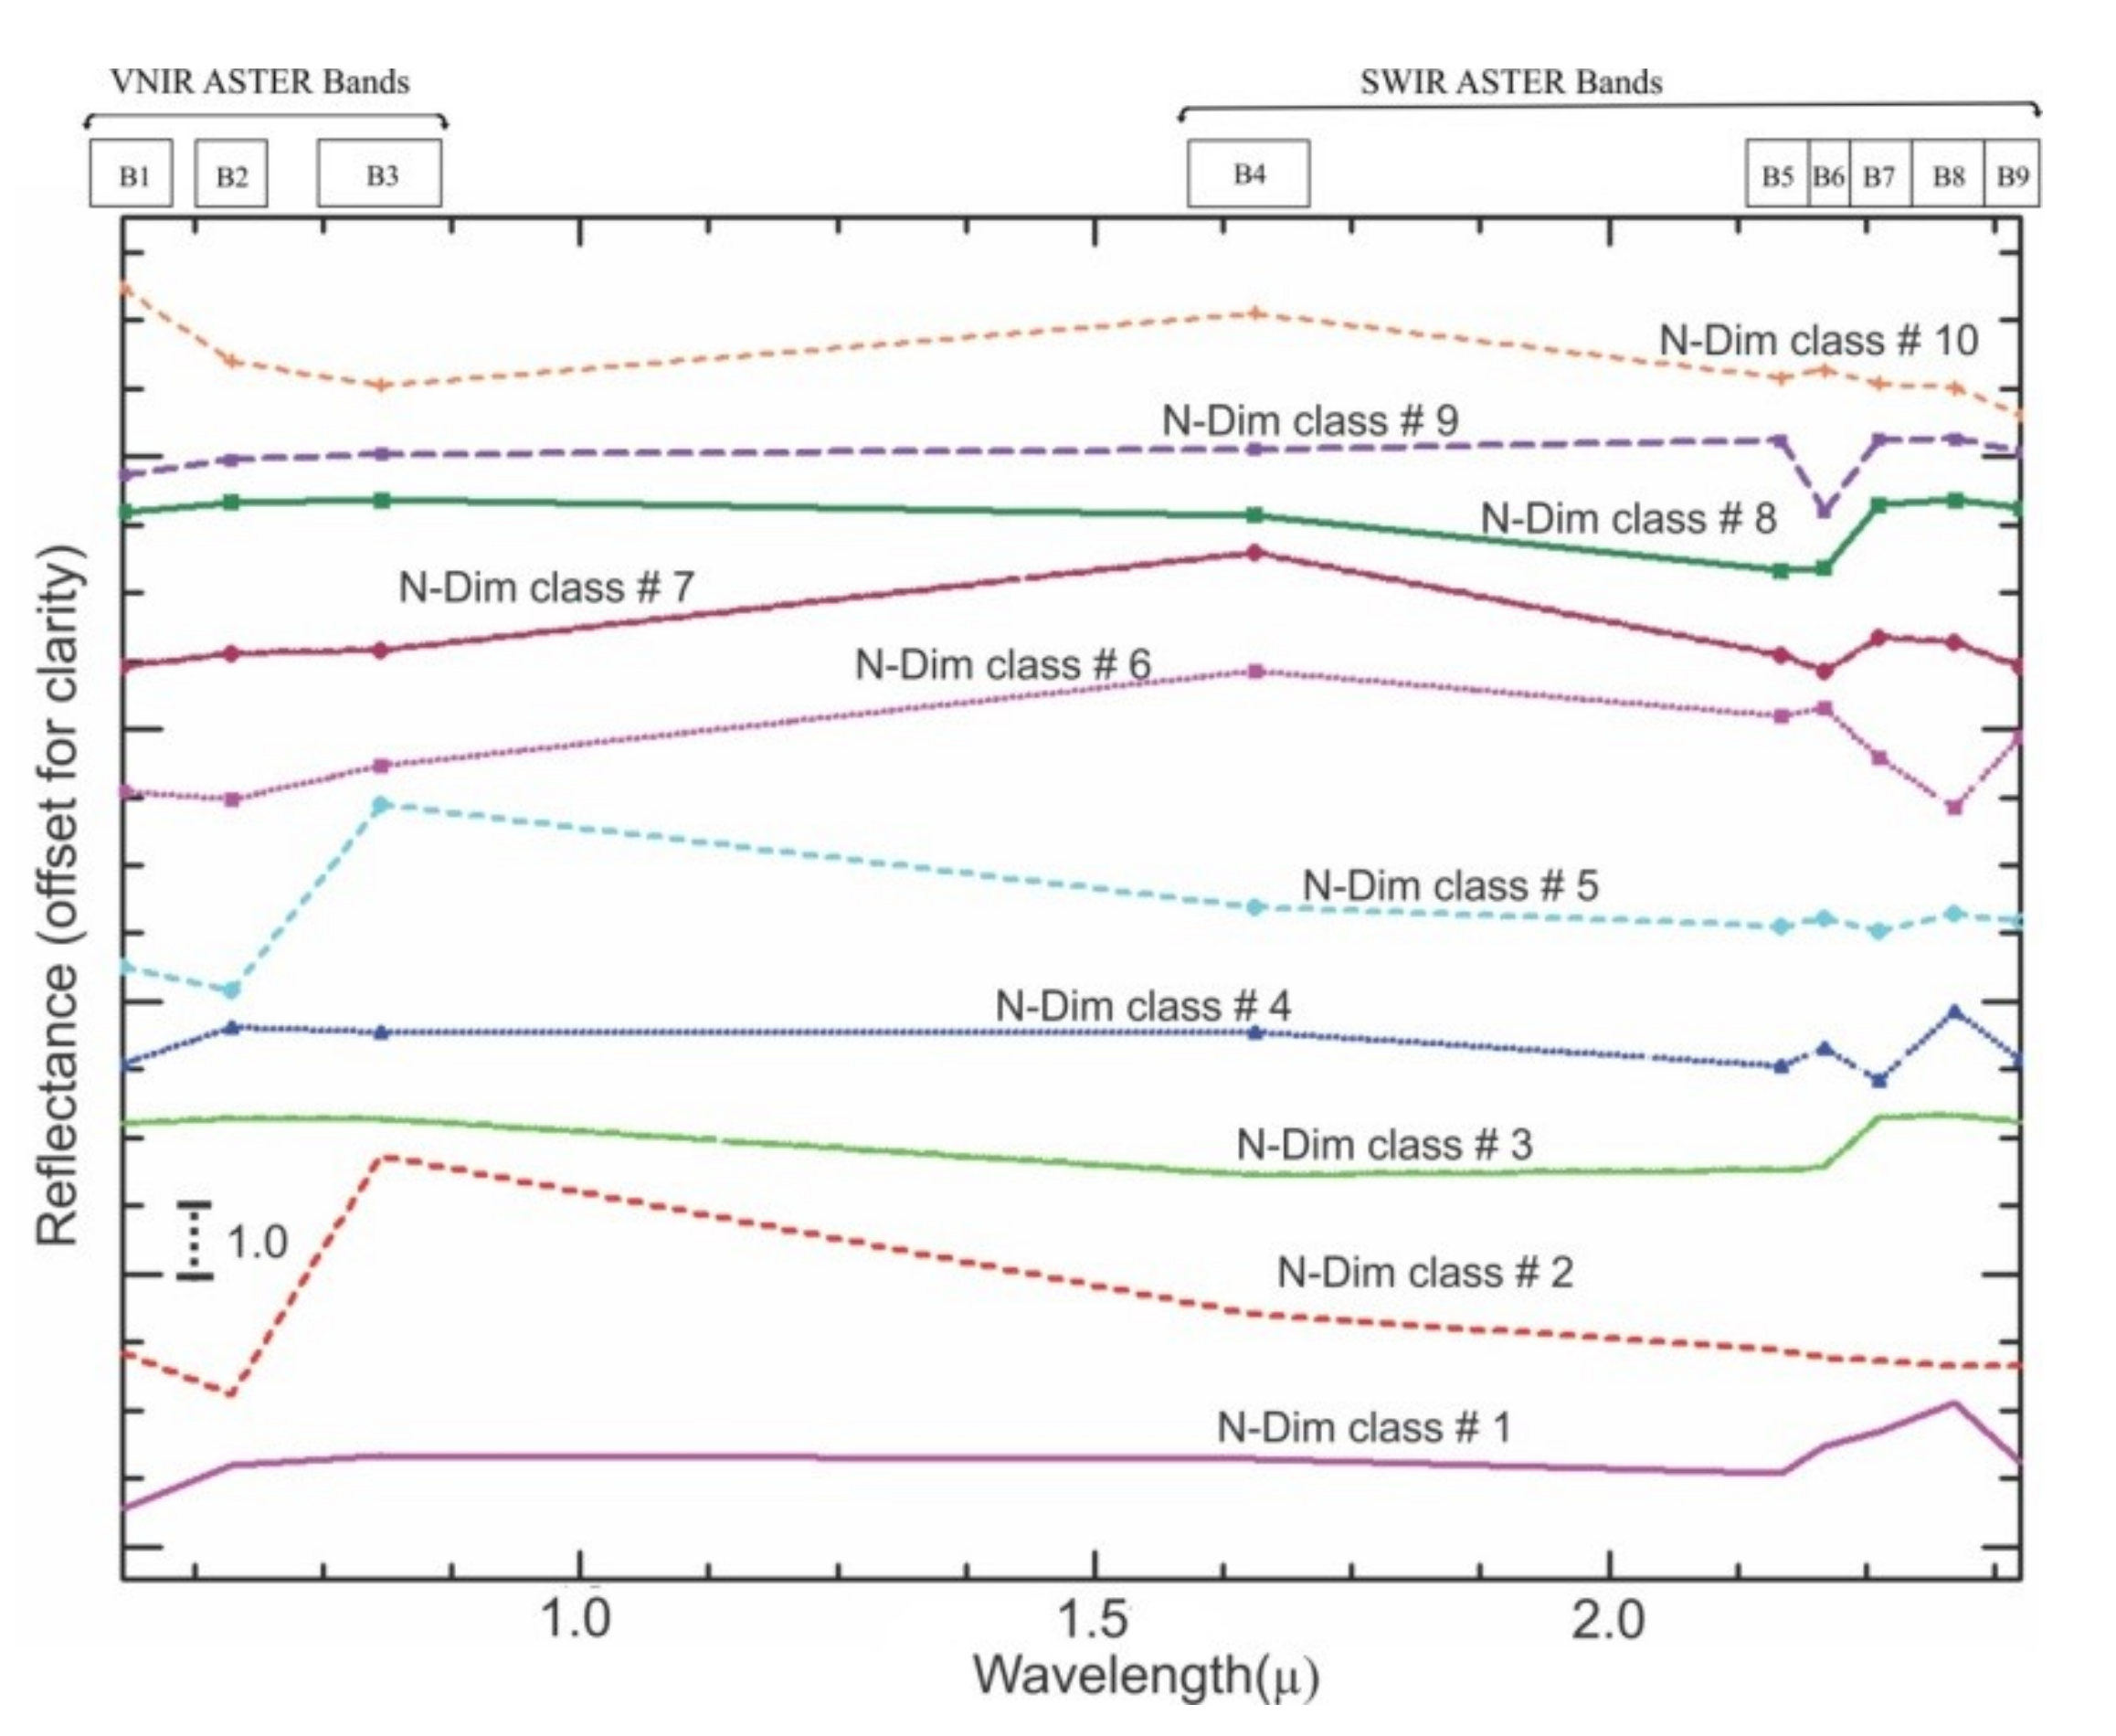
3.3. Fieldwork Data, Laboratory Analysis and Verification

For collecting field data, 10 zones showing the high spatial distribution of hydrothermal alteration minerals in the Moaleman region were selected. Global positioning system (GPS) survey was acquired using a GPS (Garmin eTrix 10, Nanjing Sifang Mapping Equipment Ltd., Jiangsu, China) with an average accuracy of 5m to find the exact location of the selected zones in the ASTER scene. Field photos were taking from alteration zones. Seventy rock samples were collected from the alteration zones and lithological units for laboratory analysis, including thin section preparation, X-ray diffraction (XRD) analysis, and analytical spectral devices (ASD) spectroscopy. The XRD analysis was applied using Advance-D8 XRD Bruker model at Central Laboratory of Damghan University, Damghan, Iran. The exposure time of powder samples (1 g) was about one hour by a monochromatic ray in the wavelength of 5.4 Å and ranging angles between 5 to 70 degrees. The step of diffraction was set as 0.2 degrees to guarantee detection of clay minerals which are detectable in low angles. The copper anode is used to generate X-rays with a voltage of 25 kilovolts (kV). The spectra of the representative samples from altered zones were measured using a FieldSpec3® spectroradiometer operating in the 0.35-2.5 μm spectral range at the Department of Ecology, Institute of Science and High Technology and the Environmental Sciences Graduate University of Advanced Technology, Kerman, Iran. The fore-optics were at a small distance from the surface under observation. Spectralon of Labsphere which is made of polytetrafluoroethylene (PTFE) and sintered halon G-80 was used as a white reference panel. About 10 measurements were performed per spot. Moreover, the Kappa coefficient was calculated using a Matlab code developed by Askari et al. [74] for SAM and MTMF results for accuracy assessment (Table 5A,B).

4. Results and Discussion

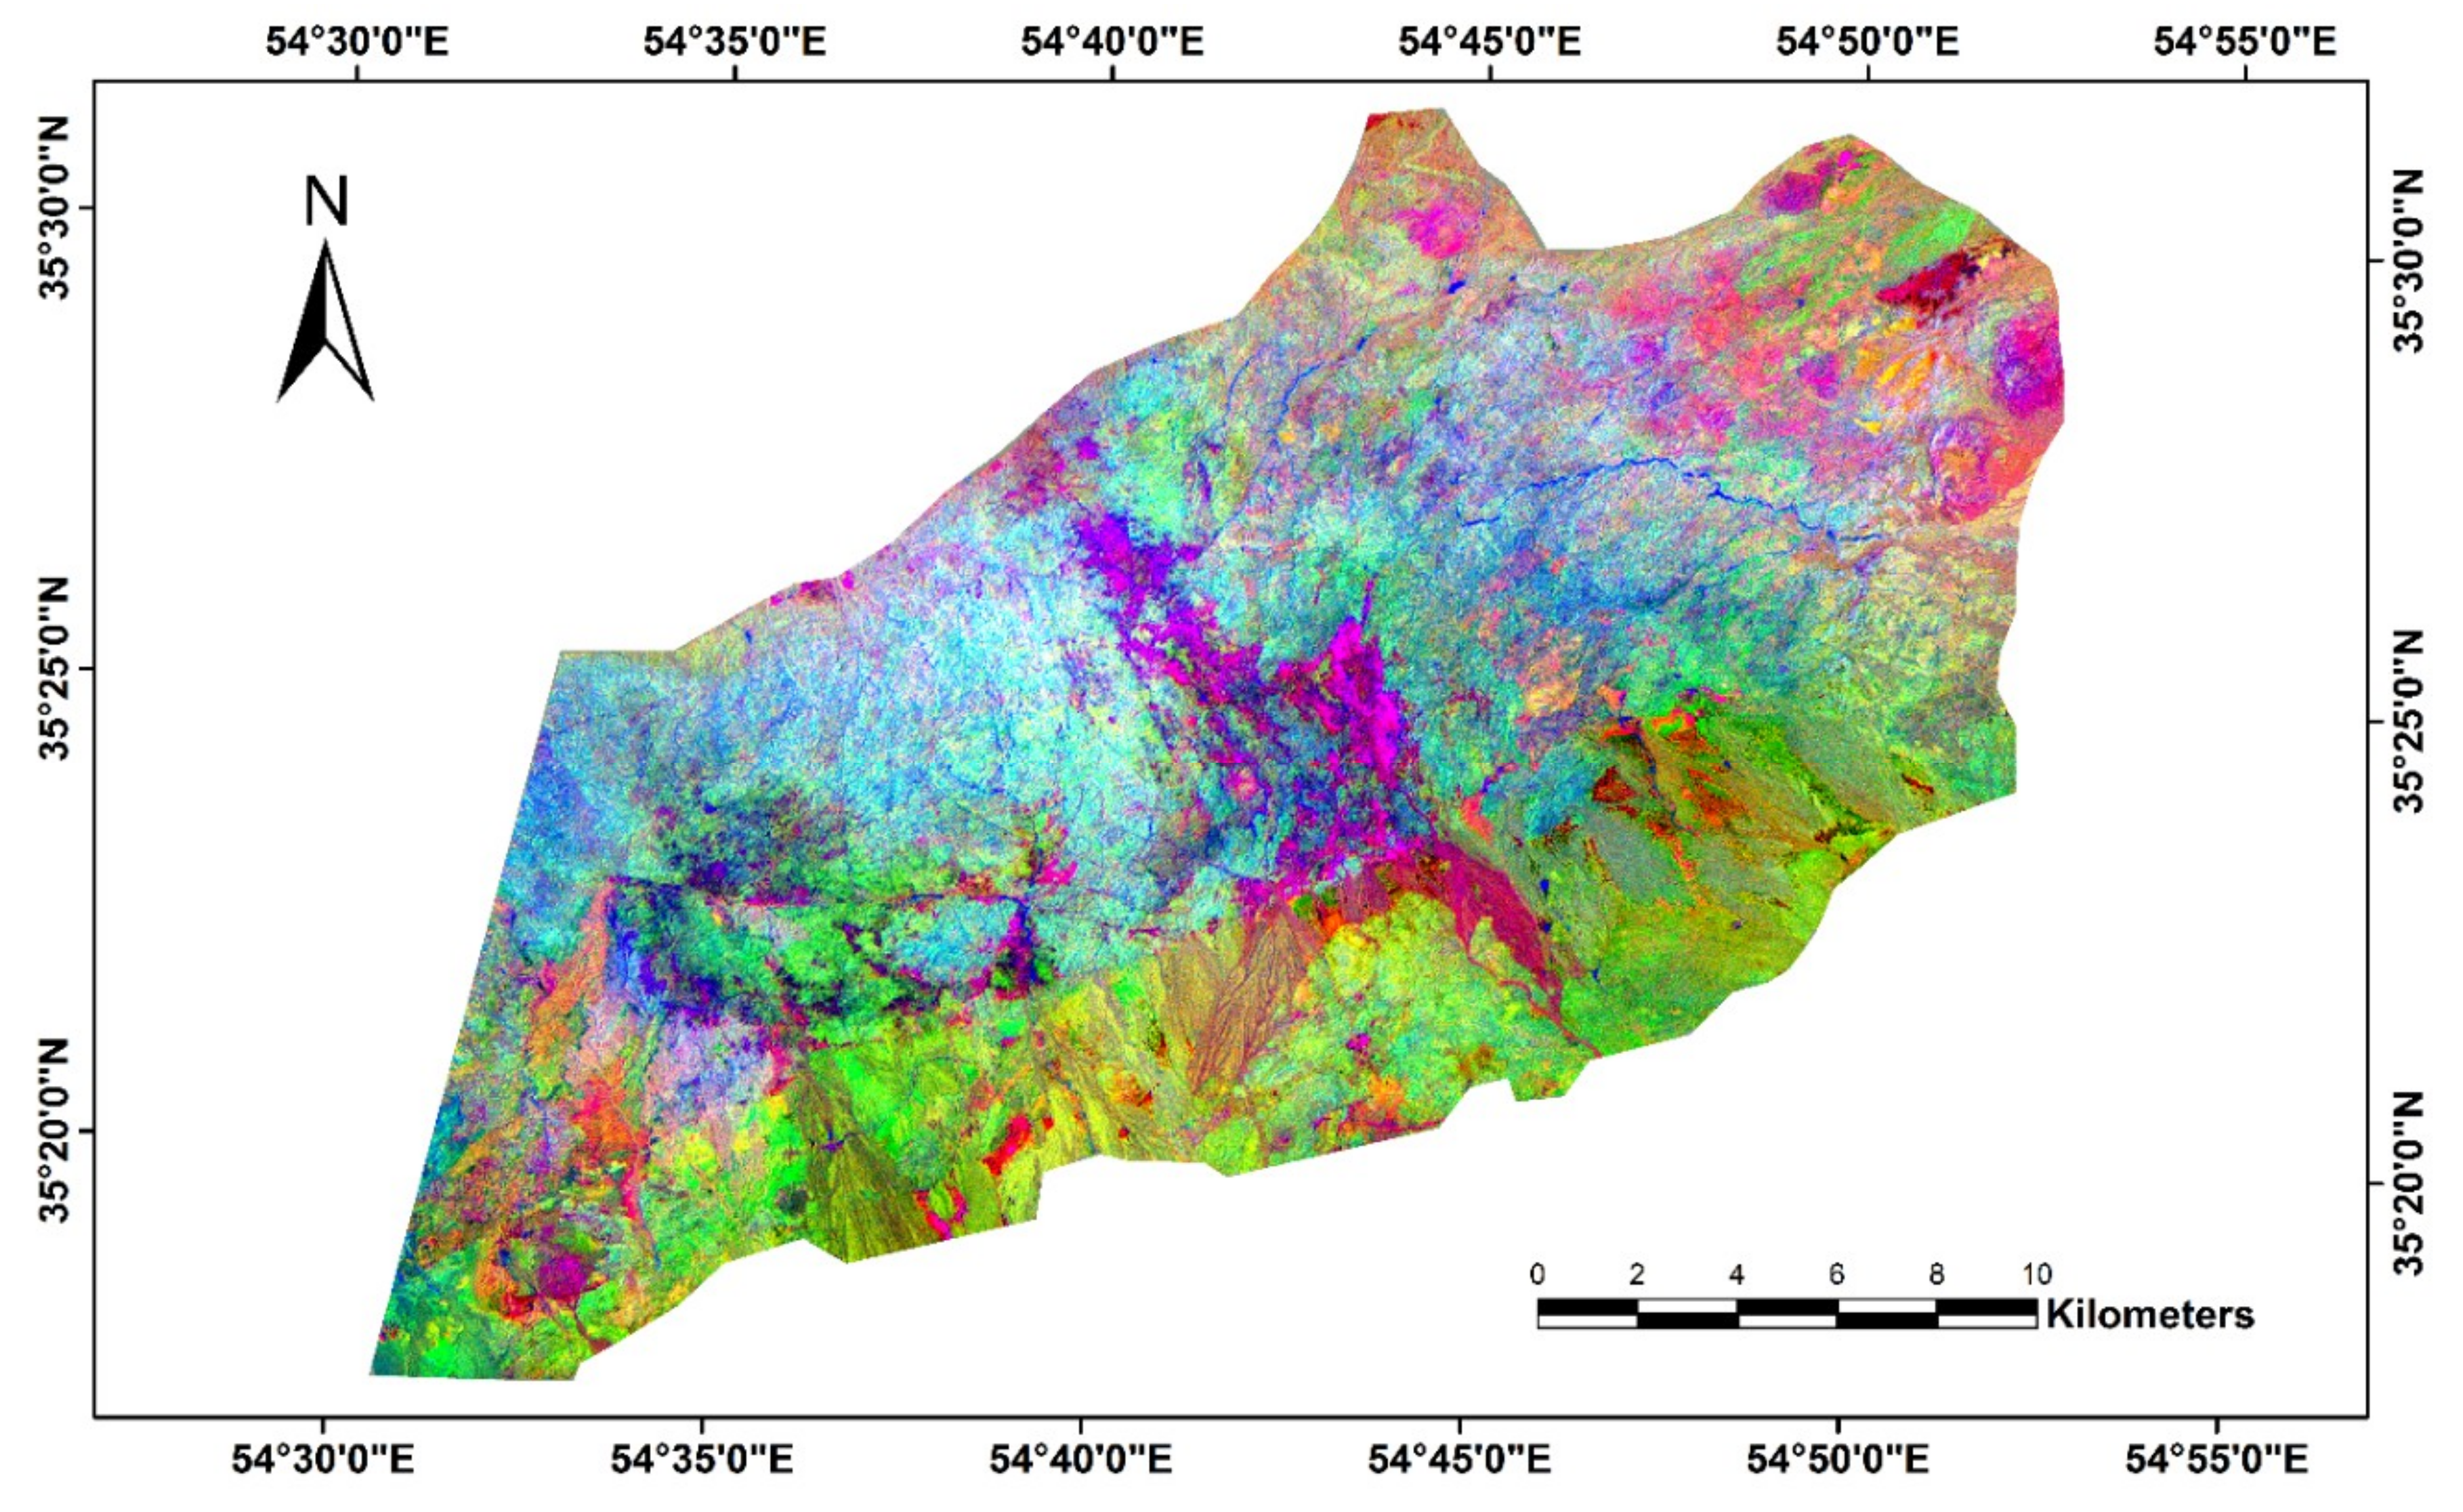
4.1. Alteration Mapping Results Derived from ASTER Data

Considering statistical results derived from SPCA (Table 1A–D), it evident that hydrothermally altered rocks were mapped in the SPC images that contain a unique contribution of components (eigenvectors) related to spectral characteristics of the alteration minerals. Table 1A shows eigenvector values for mapping iron oxide/hydroxide minerals in the study area. Analyzing the eigenvector loadings shows that the SPC2 contains a strong to moderate contribution of band 1 (−0.42) and band 2 (−0.39) with negative signs and a strong contribution of band 4 (0.81) with a positive sign. Iron oxide minerals have absorption features in bands 1 and 2 and reflectance features in band 4 of ASTER, respectively [54,62,75]. Therefore, the SPC2 is able to enhance oxide/hydroxide minerals as bright pixels due to opposite signs of the eigenvector loadings in the absorption bands (negative signs in bands 1 and 2) and reflection band (positive sign in band 4) (Figure 4A).
Looking at the eigenvector loadings in Table 1B for mapping argillic alteration indicates that the SPC3 has a strong contribution of band 4 (−0.61) and band 5 (−0.73) with negative signs and a strong contribution of band 6 (0.67) with a positive sign, respectively. Kaolinite and alunite are main constituents of argillic alteration that normally exhibit Al-OH absorption features in bands 5 and 6 of ASTER [63]. Al-OH minerals show maximum reflectance features in band 4 of ASTER that covers the spectral region of 1.6 μm [64]. Thus, the argillic alteration zone appears as dark pixels in the SPC3 image because of a negative sign in band 4 (reflection band). Dark pixels in the SPC3 image were inverted to bright pixels by multiplication to −1 (Figure 4B).
Table 1C shows the eigenvector loadings for mapping phyllic alteration zone. The SPC3 shows strong eigenvector loadings for band 5 (−0.69) and band 6 (0.71) with opposite signs, while band 7 (0.02) has a very small contribution in the SPC3. The phyllic zone composed of illite/muscovite (sericite) produces an intense Al-OH absorption feature at band 6 of ASTER [52]. Phyllic alteration zone in the study area manifests in bright pixels in the SPC3 image (Figure 4C). Considering the eigenvector loadings in Table 1D for identification of propylitic alteration zone in the study area, the SPC3 contains strong loadings of band 8 (−0.81) and moderate contribution of bands 7 (0.35) and 9 (0.45) with opposite signs, respectively. The propylitic alteration zone consisting of epidote, chlorite, and calcite display strong absorption features in band 8 of ASTER [64]. For that reason, the SPC3 image depicts propylitic alteration zone as bright pixels in the study area (Figure 4D).
Propylitic, phyllic, argillic, and advanced argillic alteration zones were reported as dominated alteration zones with epithermal polymetallic vein-type mineralization in the study area [30]. The surface distribution pattern of iron oxide/hydroxide minerals, argillic alteration zone, phyllic zone, and propylitic zone is almost similar and mostly concentrated in the central and southwestern parts of the study area (see Figure 4A–D). However, argillic zone and iron oxide/hydroxide minerals show more similar spatial distribution and strong surface abundances compare to phyllic and propylitic zones. Accordingly, a Red-Green-Blue (RGB) color composite was assigned to the SPC3 of argillic alteration, SPC3 of phyllic alteration, and SPC3 of propylitic alteration images for providing a false color-based classification image of the detected pixels. Figure 5 shows the resultant image for the study area. Argillic alteration zone appears in red and yellow colors, it is evident that the red zone can be considered as the advanced argillic and yellow zone is a combination of Argillic and phyllic alteration zones (Figure 5). The phyllic alteration zone is represented in green and cyan colors. The mixture of phyllic and propylitic alteration zones depict as cyan color. Propylitic alteration zone manifests as blue color (Figure 5). Comparison with the geological map of the study area (see Figure 1B), most of the ore mineralizations are concentrated in argillic and advanced argillic alteration zones (see Figure 5), which are associated with dacite and dicite-andesite, spilitic basalt, trachyandesite basalt, and quartz trachyandesite lithological units. Several advanced argillic (red mixed with yellow pixels) zones are observable in the southwestern and northeastern parts of the study area, which could be considered as prospective zones.
Considering of statistical results calculated for the BRMT algorithm (Table 2, Table 3 and Table 4), the eigenvalues, Vi%, positive and negative correlation averages ( + r ¯ k > 0.1 and − r ¯ k < 0.1) for the BT1, BT2, and BT3 are considerable (Table 3). High number of eigenvalues, Vi%, and + r ¯ k % and r ¯ k % were estimated in the BT1, BT2, and BT3. The BT1 contain the highest eigenvalue (0.123) Vi% (83.24), + r ¯ k % (20.7), and r ¯ k % (29.48). The BT2 shows eigenvalue of 0.00928, Vi% of 6.28, + r ¯ k % of 12.70, and r ¯ k % of 13.36. The BT3 has an eigenvalue of 0.00643, Vi% of 4.35, + r ¯ k % of 8.51, and r ¯ k % of 12.08 (Table 3). It shows that these BTs contain most of the spectral information that was extracted by the BRMT algorithm from the image. Therefore, the BTs were used for producing RGB false color composite to reveal the most spectrally dominated hydrothermal alteration zones and lithological units in the study area (Figure 6). With reference to SPCA results, it is discernable that argillic, phyllic, and advanced argillic alteration zones are most spectrally dominated alteration zones in the study area, which appear as magenta color in Figure 6. These alteration zones are typically concentrated in the central, southwestern, and northeastern parts of the study area, which contain mineralogically interesting zones for ore exploration.
The analysis of the negative and positive contribution percent > 3% for BTs (see Table 2 and Table 4) indicates that the BTs contain a negative contribution holding more specific spectral properties attributed to lithological units and hydrothermal alteration zones. Therefore, the BTs containing a negative contribution > 3% (Table 4), such as n10, n5, n19, n20, n6, n7, n22, n2, n17, n13, and n4, were used for running the rule image classifier. Figure 7 shows the resultant BRMT classification map for the study area. Eight classes (C1 to C8) were identified. The class C1 (red pixels) can be considered a moderate propylitic alteration zone that is combined with unaltered volcaniclastic rocks. This class (C1) mainly covers the eastern and northeastern parts of the study area. The class C2 (blue pixels) includes the advanced propylitic alteration zone, which is generally concentrated in the central and southwestern part of the study area (Figure 7). The advanced argillic alteration zone is depicted in class 3 (green pixels), which covers typically central and western parts and many other small exposures in the whole of the study area. Class C4 (cyan pixels) is a combination of argillic, iron oxide, and propylitic mineral assemblages and sedimentary rocks that weathered and transferred to the alluvial fan. Class 5 (brown pixels) is an accumulation of iron oxide minerals that are within the highly altered parts of argillic and phyllic zones. Sandstone and alluvium can be considered in class 6 (light yellow pixels), while class 7 (magenta pixels) might be an admixture of some weathered rocks of classes 1, 2, and 3. Class 8 (mustard pixels) represents unknown units that may consist of some weathered and transferred sedimentary rocks. By using the geological map of the study area (see Figure 1) as a reference, it is obvious that the most of the reported ore mineralizations in the study area are located in the interior of class 3 (advanced argillic alteration zone) of the BRMT classification map (Figure 7). Thus, some perspective zones (green pixels) could be considered in the southwestern and northeastern sectors.
Within the VNIR+SWIR interval, for identification of the n-D classes (#1 to #10) derived from the n-Dimensional visualization analysis technique (see Figure 3), diagnostic absorption features related to electronic process intensities and crystal field transitions due to Fe2+, Fe3+, and REE transitional metals in the VNIR [76,77] and vibrational overtones of the fundamental Al-OH/Fe-OH/Mg-OH and CO3 in the SWIR [78,79] should be taken into consideration. Generally, dominant spectral patterns correspond to the most abundant minerals or spectrally dominant mineral groups. Subordinate spectral patterns produce spectral variability due to spectrally less active or less abundant phases in the rock [80]. Therefore, the wavelength shift of the distinctive absorption features directly or inversely depends on the abundance of spectrally active mineral groups within the rocks. Comparison of the absorption characteristics of the n-D classes extracted for the study area with the USGS spectral library indicate some spectrally distinctive mineralogical phases (see Figure 2). The n-D class #1 does not contain any distinctive absorption features related to alteration minerals and could be considered as an unaltered/unknown class. The n-D class #2 represents diagnostic absorption features related to Fe3+ transitional metals, coinciding with bands 2 and 3 of ASTER. Thus, it contains iron oxide/hydroxide absorption features, which are attributable to hematite. There are no recognizable absorption features in the n-D class #3, which can be classified as unaltered/unknown.
Analyzing the n-D class #4 and n-D class #5 indicates spectral signatures attributed to jarosite, which correspond with bands 2, 3, and 7 of ASTER (see Figure 2). In fact, band 7 of ASTER is able to detect Fe-OH absorption features caused by jarosite and/or Fe-muscovite [81]. So, the n-D class #4 might contain spectral signatures of other mineral groups with subordinate spectral patterns. The n-D class #6 represents chlorite due to major Mg, Fe-OH absorption properties in band 8 of ASTER (2.30–2.360 μm). A major Al-OH absorption feature positioned in band 6 of ASTER is obvious in the n-D class #7, which reflects the spectral signatures of illite (see Figure 2 and Figure 3). The n-D class #8 might be considered as mixed spectral signatures of illite, muscovite, and montmorillonite. The n-D class #9 is characterized by a strong absorption feature centered at 2.20 μm (coinciding with band 6 of ASTER), which is attributable to muscovite/montmorillonite (see Figure 2 and Figure 3). The n-D class #10 exhibits mixed spectral signatures of hematite and jarosite (see Figure 2).
Fraction images of end-members (the n-D classes #1 to #10) resulting from MTMF analysis appear as a series of greyscale rule images (one for each extracted end-member) for the study area. High digital Number (DN) values (bright pixels) in the rule image represents the subpixel abundance of the end-member mineral in each pixel and map its location. The pseudo-color ramp of greyscale rule images was generated to illustrate high fractional abundance (high DN value pixels) of end-members (the n-D classes) in the study area (Figure 8). It helps to distinguish the contrast between subpixel targets and surrounding areas. This contrast expresses the fractional abundance of the target mineral present in the rule image. It should be noted here that unaltered/unknown class (the n-D class #1 and n-D class #3) was omitted during the production of Figure 8.
Figure 8 shows the pseudo-color ramp of the n-D class fraction images derived from the MTMF algorithm for the study area. Considering the fractional abundance of detected endmember minerals, muscovite, montmorillonite, and illite spectrally governed the study area, while hematite, jarosite, and chlorite have less contribution in total mixed spectral characteristics. Spatial distribution of the minerals with similar spectral features such as muscovite and montmorillonite (absorption features near 2.20 μm) and hematite and jarosite (absorption features near 0.48 μm to 0.85 μm) is comparable. It derives from the fact that ASTER multispectral signatures contain some limitations for detecting subtle differences between analogous absorption characteristics especially when mixture occurs. However, the ASTER VNIR and SWIR bands are sufficiently positioned to detect spectral feature differences between important key minerals [82]. Referencing geological map of the study area (see Figure 1), muscovite/montmorillonite/illite mineral assemblages are typically concentrated in the central, southwestern, and northeastern parts associated with dacitic and andesitic units. Nevertheless, hematite/jarosite/chlorite mineral assemblages are present in low surface abundance (Figure 8). The high concentration of iron oxide/hydroxide minerals is noticeable in the western and southwestern part of the study area associated with trachyandesite basalt units. In this part, the fractional abundance of muscovite/montmorillonite/illite is not high (Figure 8). Accordingly, the southwestern and northeastern parts of the study area contain a number of mineralogically interesting zones for ore mineralizations and holding high potential zones for future systematic exploration program.
SAM classification technique was implemented for mapping the spatial distribution of prevalent minerals such as hematite, jarosite, montmorillonite, illite, muscovite, and chlorite in the alteration zones. Hematite contains absorption features in bands 1 and 3 of ASTER. Jarosite shows absorption characteristics in bands 1, 3, and 7 of ASTER. Montmorillonite displays weak absorption features in band 5 and strong absorption features in band 6 of ASTER. Illite exhibits distinctive absorption properties in bands 5 and 6 of ASTER. Muscovite has absorption features in bands 1, 2, and 6 of ASTER. Chlorite contains absorption characteristics in bands 1, 2, and 3 and diagnostic absorption features in band 8 of ASTER (see Figure 3). Therefore, these spectral absorption signatures of alteration minerals in the VNIR+SWIR bands of ASTER can be used for detecting subtle differences between alteration minerals by running the SAM algorithm. Figure 9 shows the SAM classification map for the study area. Detailed spatial distribution of the selected minerals was mapped within the alteration zones. Montmorillonite, muscovite, and illite are the most dominated minerals in the argillic, phyllic, and advanced argillic alteration zones. However, hematite and jarosite demonstrate moderate surface distribution and chlorite has very low abundance in the argillic, phyllic, and advanced argillic alteration zones. High concentration of chlorite is mapped only in the propylitic alteration zone that is associated with hematite and jarosite. Several concentrations of muscovite and illite are mapped in the southwestern and northeastern parts of the study area, which previously deliberated as high potential zones for ore mineralizations (Figure 9).

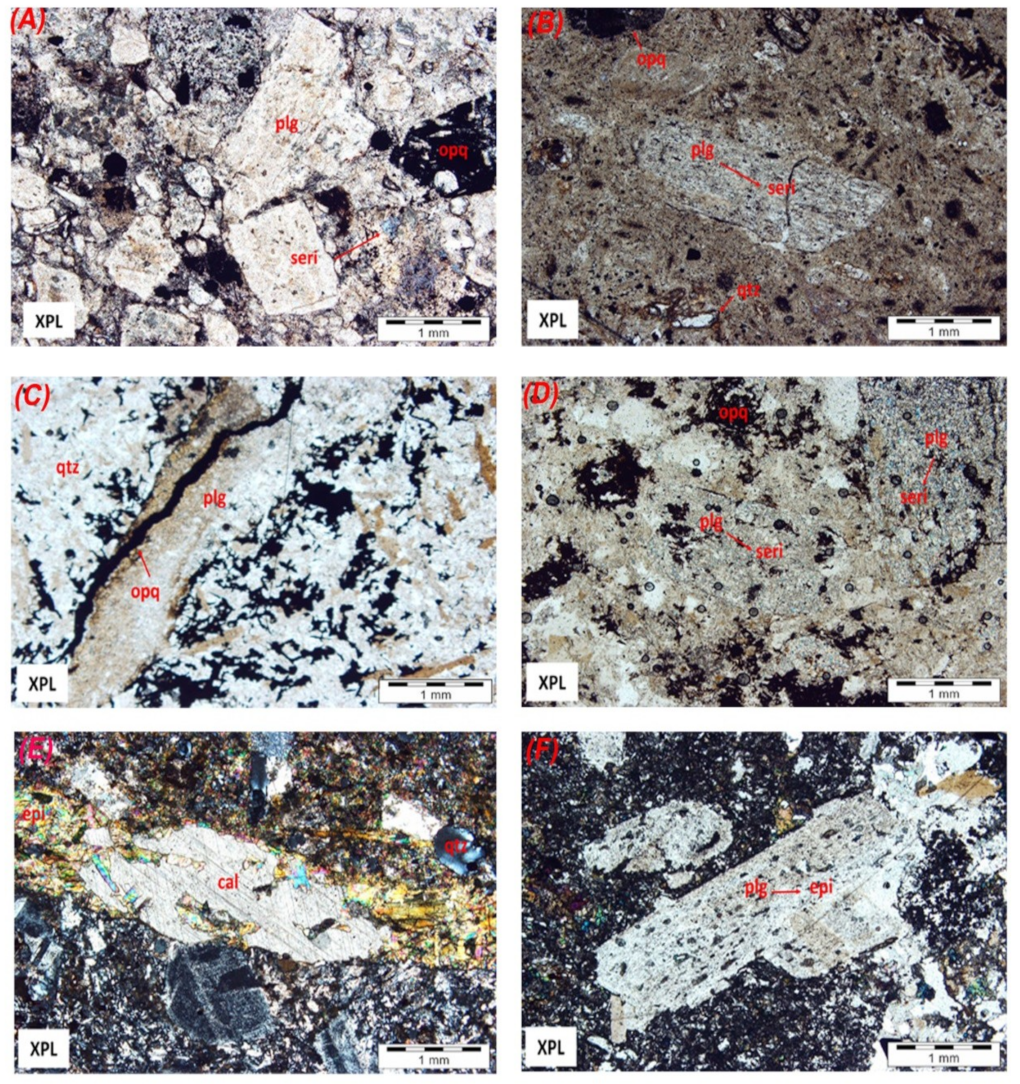
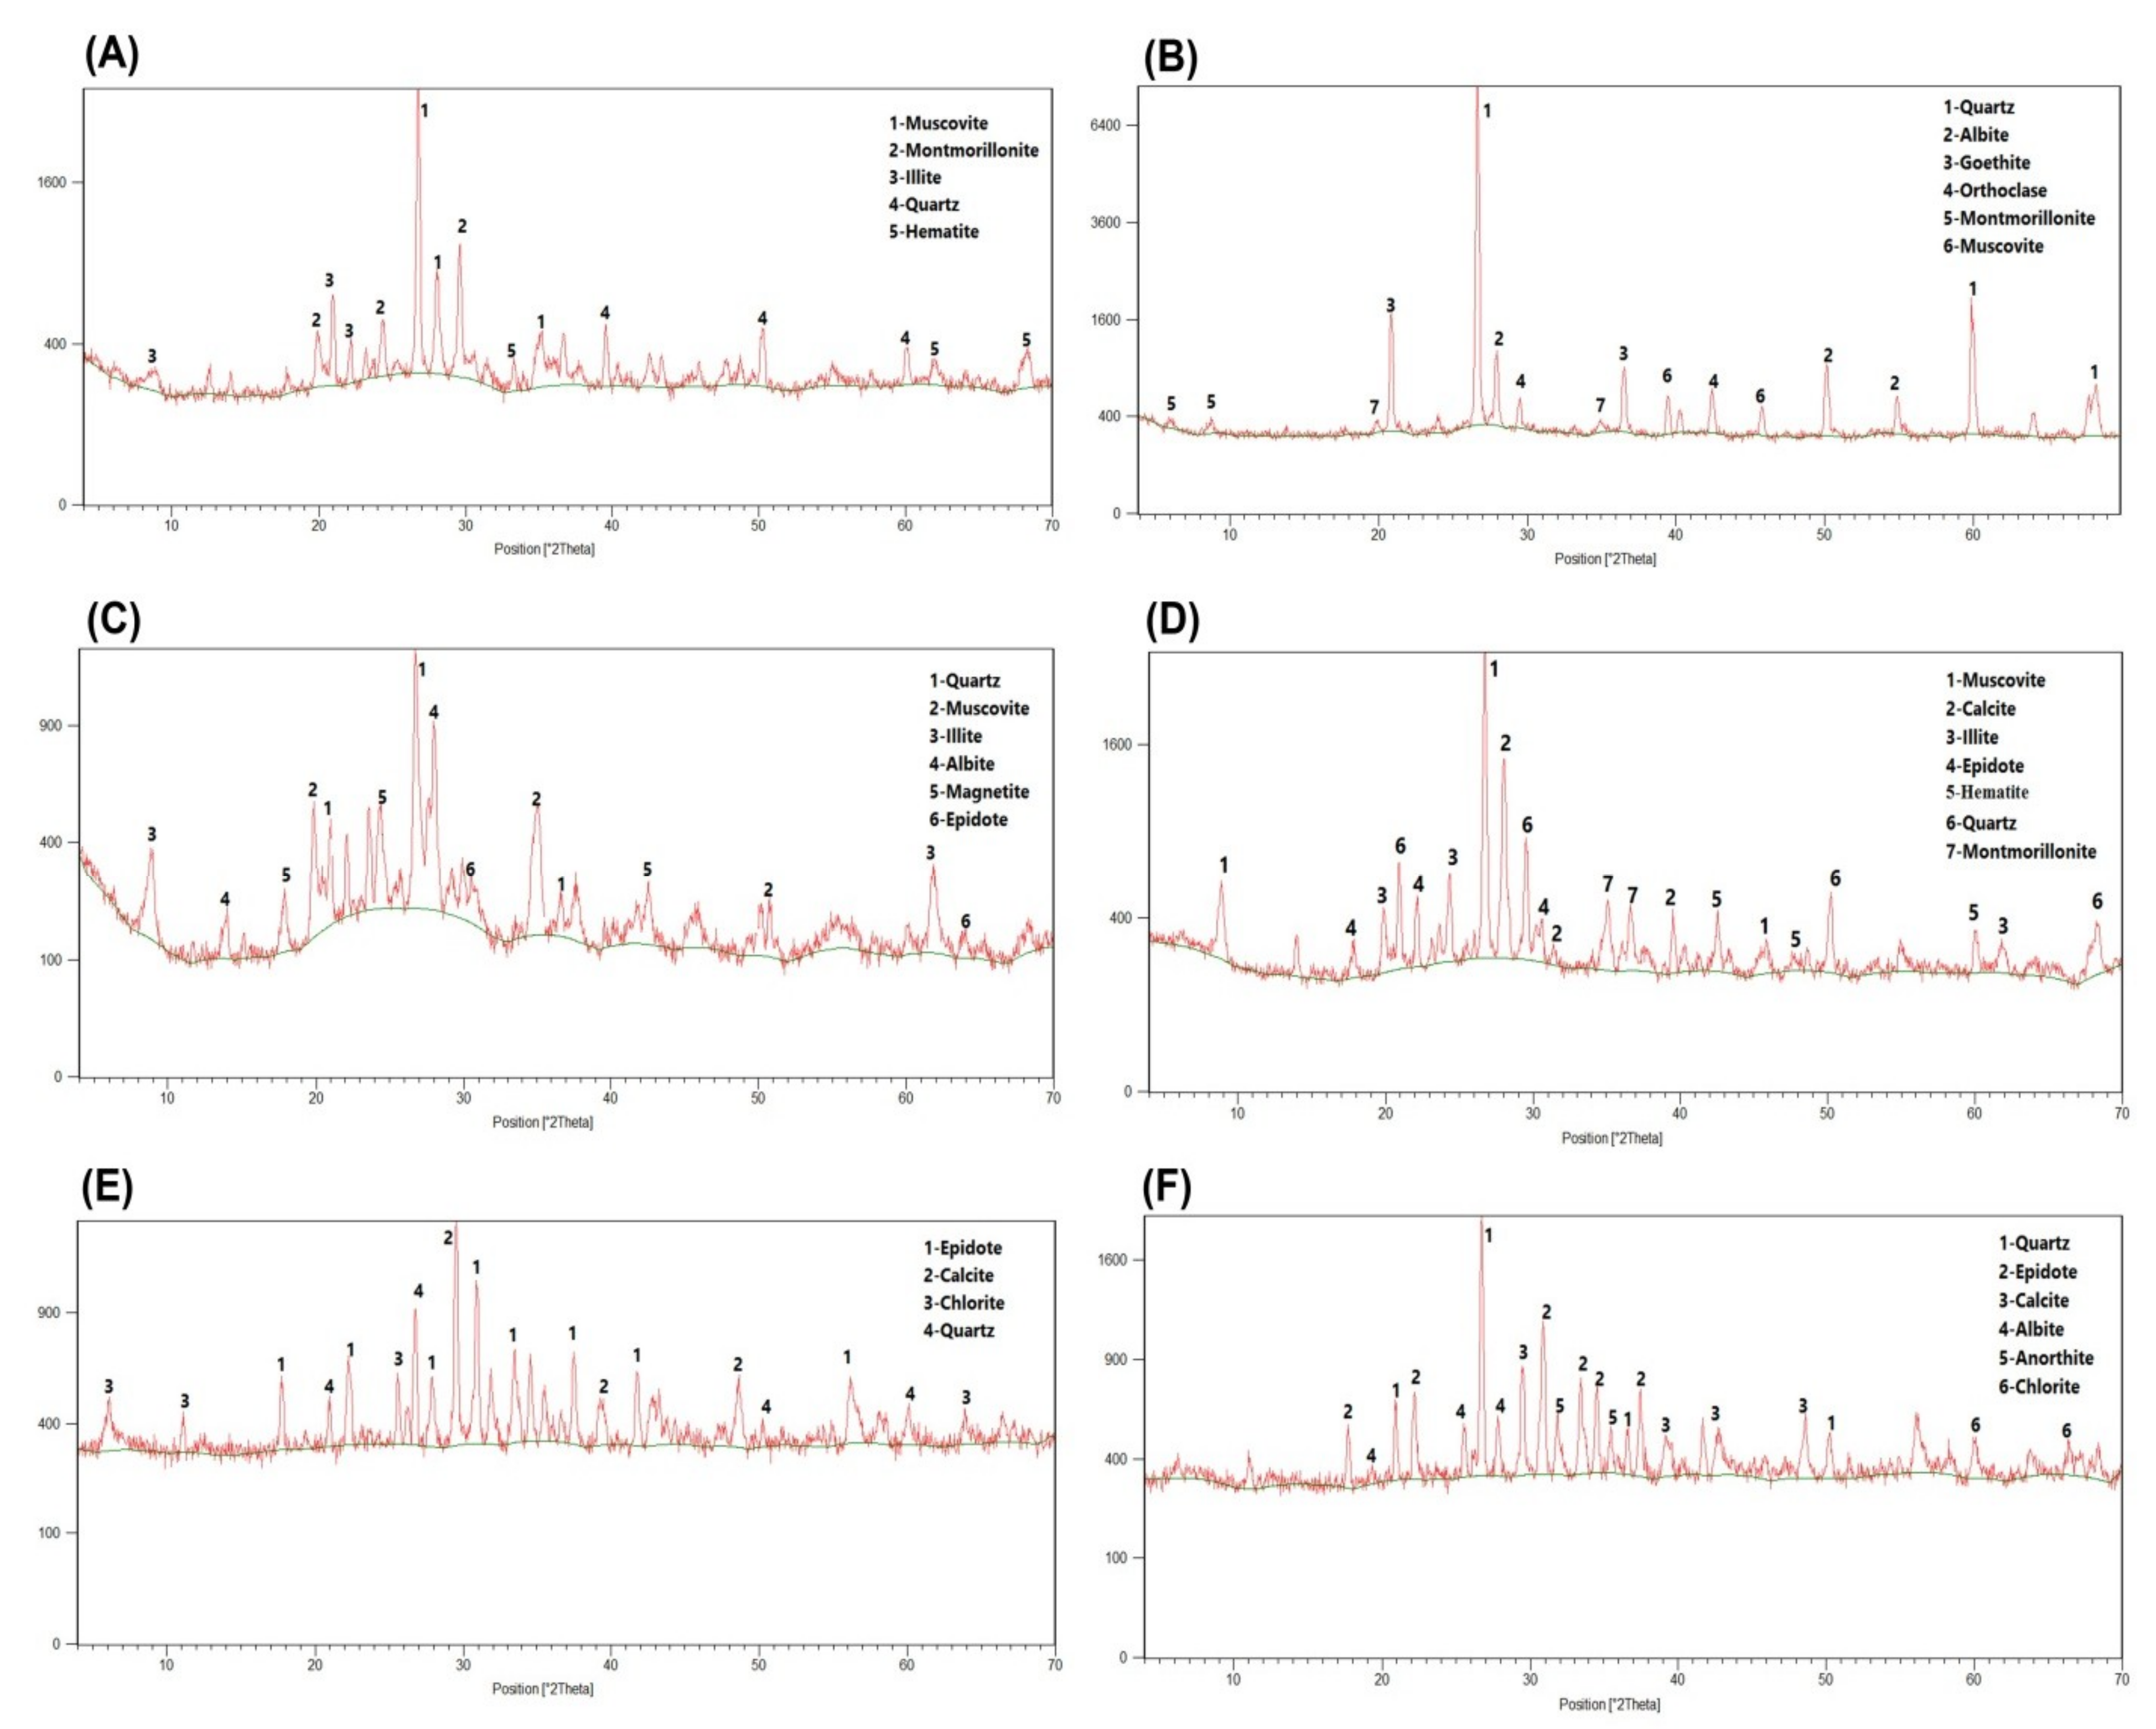
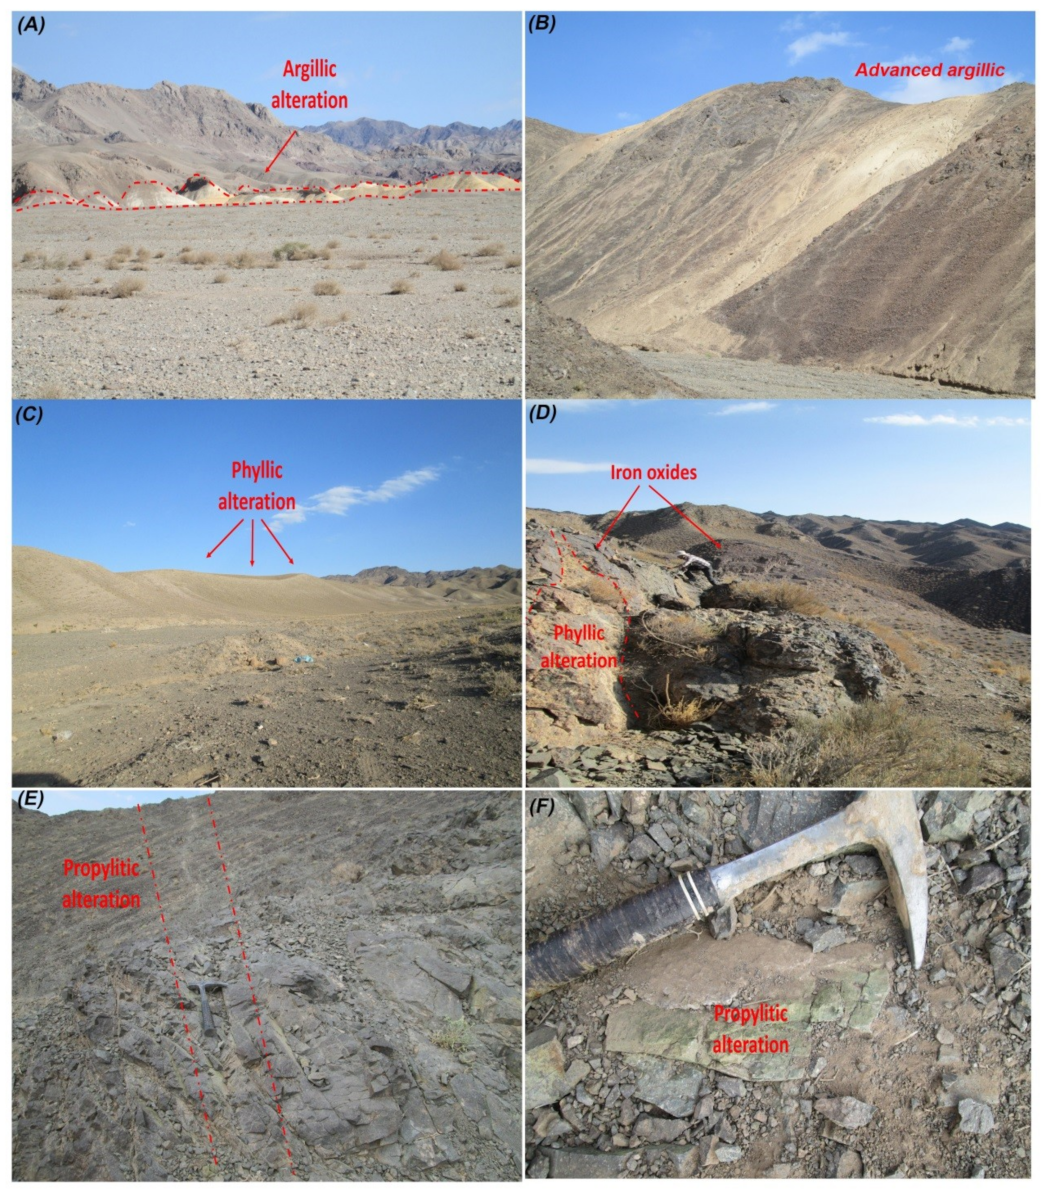
4.2. Fieldwork, Laboratory Analysis and Verification Results

Comprehensive geological fieldworks were carried out in the study area especially in the detected hydrothermal alteration zones. A number of prospects and mineralogically interesting zones were visited. The precise location of the alteration zones was recorded using GPS survey. The lithological units and alteration zones were checked and samples were collected. Part of the hand specimen was split off for a thin section and the rest was crushed to a grain size of less than 2 mm for XRD analysis. In particular, the study area contains a significant concentration of advanced argillic, argillic, and phyllic alteration zones (Figure 10A–C). However, hematite-rich altered oxidized zones and propylitic alteration zones cover also large parts of the study area (Figure 10D–F). Typically, hematite-rich altered oxidized zones and phyllic alteration zones show the close spatial relationship in many parts of the study area (See Figure 10D).
Petrographic studies were carried out on thin sections of the collected rock samples. Thin section observations indicate the transformation of primary silicate minerals (feldspars) to secondary altered minerals (sericite, clay minerals, calcite and epidote) (Figure 11A–F). Plagioclase is typically replaced by sericite, clay minerals, calcite, epidote, and quartz in the most of alteration zones. Veins and subhedral grains of opaque minerals are more observable in the thin sections of advanced argillic, argillic, and phyllic alteration zones (see Figure 11A–D). In the propylitic zone, the original minerals are fully replcaed by secondary minerals (calcite and epidote) (see Figure 11E,F). Minerals identified in the collected rock samples from hydrothermal alteration zones using XRD analysis include montmorillonite, illite, goethite, hematite, muscovite, albite, orthoclase and quartz in advanced argillic and argillic zones (Figure 12A,B); muscovite, illite, hematite, magnetite, albite, epidote, calcite, montmorillonite, and quartz in the phyllic zone (Figure 12C,D); epidote, calcite, chlorite, albite, anorthite, and quartz in the propylitic zone (Figure 12E,F).
The ASD spectroscopy is sensitive to detect the presence of alteration minerals with strong absorption features in the mineralogically interesting zones. Figure 13 shows the average reflectance spectra of phyllic, gossan (hematite-rich altered oxidized zone), argillic and propylitic rock samples. The reflectance spectra from phyllic samples show three prominent absorption features near 1.40 µm, 1.90 µm, and 2.20 µm, due to vibrational overtone and combination tones involving OH-stretching modes [83,84]. The absorption features near 1.40 µm and 1.90 µm in the phyllic samples can be attributed to OH stretches occurring at about 1.4 µm and the combination of the H-O-H bend with OH stretches near 1.90 µm [78]. The feature near 2.20 µm is due to a combination of the OH-stretching fundamental with Al-OH bending mode [84,85]. These spectral characteristics exhibit similarities to the spectra of muscovite (dominant absorption features located around 2.20 µm), which is a main alteration mineral in the phyllic zone.
Strong absorption features near 0.50 µm and 1.0 µm in the gossan samples are due to electronic transitions in iron ions (ferric and ferrous ions) [79,83]. Moreover, the feature near 2.27 µm is attributed to a combination of OH stretch and Fe-OH bend [78]. The two strong absorption features at about 0.50 µm and 1.0 µm are normally considered for hematite and goethite in the VNIR regions [86]. Jarosite has a diagnostic absorption feature at 2.27 μm [78]. The OH and H2O vibrational bands near 1.40 µm and 1.90 µm are also commonly seen in iron oxides/hydroxides spectra [86]. Thus, hematite, goethite, and jarosite are major alteration mineral constituents in the gossan zone.
The reflectance spectra of argillic samples display two overall absorption features at about 1.40 µm and 1.90 µm (due to the OH and H2O vibrational bands) and also consist of maximum absorption near 2.17 µm and 2.20 µm (Figure 13). Montmorillonite, kaolinite, illite, and alunite show spectral characteristics consisting of a major absorption feature at around 2.20 µm associated with a secondary feature between 2.16 and 2.18 µm, which are related to stretching vibration of the inner and outer hydroxyl groups (Al-OH bending mode) [85,87]. The spectra from Propylitic samples show also characteristics absorption features near 0.50 µm and 1.0 µm (due to ferric and ferrous iron ions) and the OH and H2O vibrational bands (about 1.40 µm and 1.90 µm) (Figure 13). The absorption feature near 2.35 µm in the samples is due to a combination of OH-stretching fundamental with the Mg-OH bending mode, and the feature near 2.50 µm can be attributed to combination and overtone bands of CO3 fundamentals, respectively [78,83]. Chlorite and epidote show distinctive absorption features at around 2.35 μm [85]. Carbonates (calcite, aragonite, and dolomite) have diagnostic absorption features between 2.30 and 2.50 μm [88].
Comparing the ASD spectroscopy results with XRD analysis indicates most diagnostic spectral features in the phyllic zone derived from muscovite, in the argillic zone resulting from montmorillonite and illite, and in the propylitic zone associated with chlorite, epidote, and calcite. Considering the XRD and ASD analysis, iron oxide/hydroxide minerals are associated with the alteration mineral assemblages in advanced argillic and argillic, phyllic, and propylitic alteration zones. Table 5A,B shows the accuracy assessment results for the MTMF and SAM methods based on GPS survey collected during fieldwork. Analysis of the statistical factors indicate that the overall accuracy and Kappa Coefficient for MTMF and SAM are 95.7 and 0.93 (see Table 5A) and 84.4 and 0.78 (see Table 5B), respectively. The assessment emphasizes that both MTMF and SAM methods provide accurate mapping results in the study area. However, the MTMF method was capable of providing more accurate results for mapping the surface distribution of hydrothermal alteration minerals.

5. Conclusions

ASTER remote sensing data processing provides maps of surface alteration mineralogy for the Moaleman region of the TCMB, which illustrate several high potential zones of polymetallic vein-type mineralization. The image processing algorithms implemented in this analysis, including the SPCA, BRMT, SAM, and MTMF provided a consistent way to identify and map hydrothermal alteration zones in the study area. The SPCA, BRMT spectral transformation algorithms used in this study were capable of mapping the surface distribution of hydrothermally altered rocks and lithological units. The surface distribution pattern of iron oxide/hydroxide minerals, argillic alteration zone, phyllic zone, and propylitic zone was mapped in the study area using a unique contribution of eigenvector loading in the SPC3. Iron oxide/hydroxide minerals and propylitic zones showed similar spatial distribution, while strong analogous surface distribution patterns were more obvious for argillic, phyllic, and iron oxide/hydroxide minerals zones. The BT1, BT2, and BT3 hold most of the spectral information in the image, which was extracted by the BRMT algorithm. The most spectrally dominated hydrothermal alteration zones, including argillic, phyllic, and advanced argillic alteration zones were revealed. Additionally, the BTs contain a negative contribution > 3% providing comprehensive information as eight different lithological/alteration/weathered classes (C1 to C8) for the study area. Therefore, more alteration/lithological information can be obtained from the BRMT algorithm compare to the SPCA.
Ten endmembers (n-D classes) were extracted using n-dimensional visualization method, which indicates distinctive absorption features related to alteration minerals in the study area. Spectrally distinctive mineralogical phases were identified, such as hematite, jarosite, chlorite, illite, muscovite, and montmorillonite, which may have some spectral signatures of subordinate mineralogical phases. Fraction images of end-members derived from the MTMF algorithm showed the similar sub-pixel distribution for minerals contain analogous spectral features, which can be attributed to some limitations of ASTER data for detecting subtle differences between equivalent absorption characteristics especially when mixture occurs. Detailed spatial distribution of prevalent minerals including hematite, jarosite, montmorillonite, illite, muscovite, and chlorite in the alteration zones was mapped using the SAM algorithm. Results indicate that montmorillonite, muscovite, and illite are the most dominated minerals in the argillic, phyllic, and advanced argillic alteration zones. However, hematite and jarosite demonstrate moderate surface distribution and chlorite has very low abundance in these alteration zones. A high concentration of chlorite was mapped only in the propylitic alteration zone, which was also associated with hematite and jarosite. The MTMF results confirmed the presence of alteration minerals and their spatial distribution at the subpixel level in the study area, while SAM mapped subtle differences between alteration minerals in the alteration zones. The accuracy assessment results show the MTMF method is proficient to be responsible for more accurate outcomes for mapping the surface distribution of hydrothermal alteration minerals. Hydrothermal alteration zones and minerals that mapped using ASTER data processing demonstrate good correspondence with the results of field survey, petrography, XRD analysis, and spectral measurements acquired by ASD spectrometer. A number of high potential zones of epithermal polymetallic vein-type mineralization were identified in the study area, particularly in the northeastern and southwestern sectors, which can be considered for future systematic exploration programs. The approach developed in this study can be used for the exploration of epithermal polymetallic vein-type mineralization in other base metals provinces in semi-arid regions around the world.

Author Contributions

L.N. performed experiments and field data collection; A.B.P. wrote the manuscript and analyzed the data; G.A. supervised and contributed to writing and analysis; N.T. supervised; C.-W.L. and B.P. edited, restructured, and professionally optimized the manuscript including the funding acquisition; M.H. provided ASD data.

Funding

This research is supported by the UTS under grant numbers 323930, 321740.2232335 and 321740.2232357. In addition, this research was supported by a grant from the National Research Foundation of Korea, provided by the Korea government (No. 2017R1A2B4003258, 2018).

Acknowledgments

We acknowledge the School of Earth Sciences, Damghan University for providing all facilities during this research. We are also thankful to Korea Polar Research Institute (KOPRI), Faculty of Engineering and Information Technology, the University of Technology, Sydney, and Department of Ecology, University of Advanced Technology, Kerman.

Conflicts of Interest

The authors declare no conflict of interest.

References

  1. Cox, D.P. Descriptive model of polymetallic veins. In Mineral Deposit Models; Cox, D.P., Singer, D.A., Eds.; U.S. Geological Survey Bulletin: Reston, VI, USA, 1986; Volume 1693, p. 125. [Google Scholar]
  2. Haynes, S.J. Vein-type ore deposits: Introduction. Ore Geol. Rev. 1993, 8, 205–211. [Google Scholar] [CrossRef]
  3. Ono, S.; Hirai, K.; Matsueda, H.; Kabashima, T. Polymetallic Mineralization at the Suttsu Vein-type Deposit, Southwestern Hokkaido, Japan. Resour. Geol. 2004, 54, 453–464. [Google Scholar] [CrossRef] [Green Version]
  4. Gharesi, M.; Karimi, M. Vein type mineralization and related alterations of Narigun polymetalli deposit, East of Yazd, Central Iran. In Proceedings of the 10th International Congress for Applied Mineralogy (ICAM); Springer: Berlin/Heidelberg, Germany, 2012; pp. 229–236. [Google Scholar]
  5. Tu, W.; Du, Y.S.; Wang, G.W.; Lei, Y.P. Cordilleran vein type Pb-Zn-polymetallic deposits of the Xidamingshan district, Guangxi, SW China: Fluid inclusion and geochemical studies. Geol. Ore Depos. 2013, 55, 494–502. [Google Scholar] [CrossRef]
  6. Box, S.E.; Bookstrom, A.A.; Zientek, M.L.; Derkey, P.D.; Ashley, R.P.; Elliot, J.E.; Peters, S.G. Assessment of Undiscovered Mineral Resources in the Pacific Northwest: A Contribution to the Interior Columbia Basin Ecosystem Management Project; USGS Open-File Report OF 95-682; USGS: Reston, VI, USA, 1996.
  7. Lowell, J.D.; Guilbert, J.M. Lateral and vertical alteration-mineralization zoning in porphyry ore deposits. Econ. Geol. 1970, 65, 373–408. [Google Scholar] [CrossRef]
  8. Mahanta, P.; Maiti, S. Regional scale demarcation of alteration zone using ASTER imageries in South Purulia Shear Zone, East India: Implication for mineral exploration in vegetated regions. Ore Geol. Rev. 2018, 102, 846–861. [Google Scholar] [CrossRef]
  9. Ahmadirouhani, R.; Rahimi, B.; Karimpour, M.H.; Malekzadeh Shafaroudi, A.; Pour, A.B.; Pradhan, B. Integration of SPOT-5 and ASTER satellite data for structural tracing and hydrothermal alteration mineral mapping: Implications for Cu–Au prospecting. Int. J. Image Data Fusion 2018, 9, 237–262. [Google Scholar] [CrossRef]
  10. Pour, A.B.; Hashim, M.; Hong, J.K.; Park, Y. Lithological and alteration mineral mapping in poorly exposed lithologies using Landsat-8 and ASTER satellite data: North-eastern Graham Land, Antarctic Peninsula. Ore Geol. Rev. 2017. [Google Scholar] [CrossRef]
  11. Pour, A.B.; Hashim, M.; Park, Y.; Hong, J.K. Mapping alteration mineral zones and lithological units in Antarctic regions using spectral bands of ASTER remote sensing data. Geocarto Int. 2018, 33, 1281–1306. [Google Scholar] [CrossRef]
  12. Pour, A.B.; Park, T.S.; Park, Y.; Hong, J.K.; Zoheir, B.; Pradhan, B.; Ayoobi, I.; Hashim, M. Application of multi-sensor satellite data for exploration of Zn-Pb sulfide mineralization in the Franklinian Basin, North Greenland. Remote Sens. 2018, 10, 1186. [Google Scholar] [CrossRef]
  13. Pour, A.B.; Park, Y.; Park, T.S.; Hong, J.K.; Hashim, M.; Woo, J.; Ayoobi, I. Regional geology mapping using satellite-based remote sensing approach in Northern Victoria Land, Antarctica. Polar Sci. 16, 23–46. [CrossRef]
  14. Pour, A.B.; Park, Y.; Park, T.S.; Hong, J.K.; Hashim, M.; Woo, J.; Ayoobi, I. Evaluation of ICA and CEM algorithms with Landsat-8/ASTER data for geological mapping in inaccessible regions. Geocarto Int. 2018. [Google Scholar] [CrossRef]
  15. Testa, F.J.; Villanueva, C.; Cooke, D.R.; Zhang, L. Lithological and hydrothermal alteration mapping of epithermal, porphyry and tourmaline breccia districts in the Argentine Andes using ASTER imagery. Remote Sens. 2018, 10, 203. [Google Scholar] [CrossRef]
  16. Askari, G.; Pour, A.B.; Pradhan, B.; Sarfi, M.; Nazemnejad, F. Band Ratios Matrix Transformation (BRMT): A Sedimentary Lithology Mapping Approach Using ASTER Satellite Sensor. Sensors 2018, 18, 3213. [Google Scholar] [CrossRef] [PubMed]
  17. Mars, J.C. Regional Mapping of Hydrothermally Altered Igneous Rocks along the Urumieh-Dokhtar, Chagai, and Alborz Belts of Western Asia Using Advanced Spaceborne Thermal Emission and Reflection Radiometer (ASTER) Data and Interactive Data Language (IDL) Logical Operators—A Tool for Porphyry Copper Exploration and Assessment; U.S. Geological Survey Scientific Investigations Report 2010-5090-O; USGS: Reston, VI, USA, 2014; 36p.
  18. Abrams, M. The Advanced Spaceborne Thermal Emission and Reflaction Radiometer (ASTER). Data Products for the high spatial resolution imager on NASA Terra Platform. Int. J. Remote Sens. 2000, 21, 847–859. [Google Scholar] [CrossRef]
  19. Fujisada, H. Design and performance of ASTER instrument. In Advanced and Next-Generation Satellites; Breckinridge, J.B., Ed.; International Society for Optics and Photonics: Bellingham, WA, USA, 1995; Volume 2583, pp. 16–25. [Google Scholar]
  20. Kurata, K.; Yamaguchi, Y. Integration and Visualization of Mineralogical and Topographical Information Derived from ASTER and DEM data. Remote Sens. 2019, 11, 162. [Google Scholar] [CrossRef]
  21. Rowan, L.C.; Hook, S.J.; Abrams, M.J.; Mars, J.C. Mapping hydrothermally altered rocks at Cuprite, Nevada, using te Advanced Spaceborne Thermal Emission and Reflection Radiometer (ASTER), A new satellite-imaging system. Econ. Geol. 2003, 98, 1019–1027. [Google Scholar] [CrossRef]
  22. Carrino, T.A.; Crósta, A.P.; Toledo, C.L.B.; Silva, A.M.; Silva, J.L. Geology and hydrothermal alteration of the Chapi Chiara prospect and nearby targets, Southern Peru, using ASTER data and reflectance spectroscopy. Econ. Geol. 2015, 110, 73–90. [Google Scholar] [CrossRef]
  23. Cudahy, T. Mineral Mapping for Exploration: An Australian Journey of Evolving Spectral Sensing Technologies and Industry Collaboration. Geosciences 2016, 6, 52. [Google Scholar] [CrossRef]
  24. Sheikhrahimi, A.; Pour, B.A.; Pradhan, B.; Zoheir, B. Mapping hydrothermal alteration zones and lineaments associated with orogenic gold mineralization using ASTER remote sensing data: A case study from the Sanandaj-Sirjan Zone, Iran. Adv. Space Res. 2019, in press. [Google Scholar] [CrossRef]
  25. Rajendran, S.; Nasir, S. Characterization of ASTER spectral bands for mapping of alteration zones of volcanogenic massive sulphide deposits. Ore Geol. Rev. 2017, 88, 317–335. [Google Scholar] [CrossRef]
  26. Rajendran, S.; Thirunavukkarasu, A.; Balamurugan, G.; Shankar, K. Discrimination of iron ore deposits of granulite terrain of Southern Peninsular India using ASTER data. J. Asian Earth Sci. 2011, 41, 99–106. [Google Scholar] [CrossRef]
  27. Rajendran, S.; Al-Khirbasha, S.; Pracejusa, B.; Nasira, S.; Al-Abria, A.H.; Kusky, T.M.; Ghulam, A. ASTER detection of chromite-bearing mineralized zones in Semail Ophiolite Massifs of the northern Oman Mountains: Exploration strategy. Ore Geol. Rev. 2012, 44, 121–135. [Google Scholar] [CrossRef]
  28. Rastad, E.; Tajeddin, H.; Rashidnejad-Omran, N.; Babakhani, A. Genesis and gold (copper) potential in Darestan-Baghou mining area. Iran. Geosci. J. 2000, 36, 60–79. (In Persian) [Google Scholar]
  29. Fard, M.; Rastad, E.; Ghaderi, M. Epithermal Gold and Base Metal mineralization at Gandy Deposite, North of central Iran and the Role of Rhyolitic Intrusions. J. Sci. Islamic Repub. Iran 2006, 17, 327–335. [Google Scholar]
  30. Shamanian, G.H.; Hedenquist, J.W.; Hattori, K.H.; Hassanzadeh, J. The Gandy and Abolhassani epithermal deposits in the Alborz magmatic arc, Semnan Province, northern Iran. Econ. Geol. 2004, 99, 691–712. [Google Scholar] [CrossRef]
  31. Ziaii, M.; Abedi, A.; Kamkar, A.; Zendahdel, A. GIS modelling for Au-Pb-Zn potential mapping in Torud-Chahshirin area Iran. Int. J. Min. Environ. Issues 2010, 1, 17–27. [Google Scholar]
  32. Moghadam, H.S.; Li, X.H.; Stern, R.J.; Santos, J.F.; Ghorbani, G.; Pourmohsen, M. Age and nature of 560–520 Ma calc-alkaline granitoids of Biarjmand, northeast Iran: Insights into Cadomian arc magmatism in northern Gondwana. Int. Geol. Rev. 2016, 58, 1492–1509. [Google Scholar] [CrossRef]
  33. Moghadam, H.S.; Li, X.H.; Santos, J.F.; Stern, R.J.; Griffin, W.L.; Ghorbani, G.; Sarebani, N. Neoproterozoic magmatic flare-up along the N. margin of Gondwana: The Taknar complex, NE Iran. Earth Planet. Sci. Lett. 2017, 474, 83–96. [Google Scholar] [CrossRef]
  34. Mehrabi, B.; Siani, M.G. Mineralogy and economic geology of Cheshmeh Hafez polymetallic deposit, Semnan province, Iran. J. Econ. Geol. 2010, 2, 1–20, (In Persian with English Abstract). [Google Scholar]
  35. Ghorbani, G. Chemical composition of minerals and genesis of mafic microgranular enclaves in intermediate-acidic plutonic rocks from Kuh-e-Zar area (south of Semnan). Iran. J. Crystallogr. Mineral. 2007, 2, 293–310. [Google Scholar]
  36. Crosta, A.P.; Desouza Filho, C.; Azevedo, F.B. Targeting key alteration mineral in epithermal deposits in Patagonia, Argentin, using ASTER imagery and principal component Analysis. Int. J. Remote Sens. 2003, 24, 4233–4240. [Google Scholar] [CrossRef]
  37. Loughlin, W.P. Principal Components Analysis for alteration mapping. Photogramm. Eng. Remote Sens. 1991, 57, 1163–1169. [Google Scholar]
  38. Kruse, F.A.; Lefkoff, A.B.; Boardman, J.B.; Heidebrecht, K.B.; Shapiro, A.T.; Barloon, P.J.; Goetz, A.F.H. The Spectral Image Processing System (SIPS)—Interactive Visualization and Analysis of Imaging spectrometer Data. Remote Sens. Environ. 1993, 44, 145–163. [Google Scholar] [CrossRef]
  39. Boardman, J.W. Leveraging the high dimensionality od AVIRIS data for improved sub-pixel target unmixing and rejection of false positives: Mixture Tuned Matched filtering. In Proceedings of the Summaries Workshop Seventh Annual JPL Airborne Geoscience Workshop, Pasadena, CA, USA, 12–16 January 1998; Green, R.O., Ed.; 1998; pp. 55–56. [Google Scholar]
  40. Harsanyi, J.C.; Farrand, W.H.; Chang, C.I. Detection of Subpixel Signatures in hyperspectral image sequences. Proceeding of the 1994 ASPRS Annual Conference, Reno, NV, USA, 25–28 April 1994; pp. 236–247. [Google Scholar]
  41. Boardman, J.W.; Green, R.O. Exploring the spectral variability of the Earth as Measured by AVIRIS in 1999. In Proceedings of the Summaries of the Ninth Annual JPL Airborne Geosciences Workshop; Jet Propulsion Special Publication: Pasadena, CA, USA, 2000; Volume 8, p. 10. [Google Scholar]
  42. Eshraghi, S.A.; Jalali, A. Geologycal Map of Moaleman, 1:100,000; Geology Survey: Tehran, Iran, 2006. [Google Scholar]
  43. Alavi, M. Tectonic of zagros orogenic belt of Iran; new data and interpretation. Tectonophysics 1994, 229, 211–238. [Google Scholar] [CrossRef]
  44. Alavi, M.; Vaziri, H.; Seyed-Emami, K.; Lasemi, Y. The Triassic and associated rocks of the Nakhlak and Aghdarband areas in central and northeastern Iran as remnants of the southern Turanian active continental margin. Geol. Soc. Am. Bull. 1997, 109, 1563–1575. [Google Scholar] [CrossRef]
  45. Alavi, M. Structures of the Zagros fold-thrust belt in Iran. Am. J. Sci. 2007, 307, 1064–1095. [Google Scholar] [CrossRef]
  46. Hushmandzadeh, A.R.; Alavi, M.; Haghipour, A.A. Evalution of Geological Phenomenon in Toroud Area (From Precambrian to Recent) of Iran; Report No. H5; GSI.IR: Tehran, Iran, 1978; 136p. [Google Scholar]
  47. Akhyani, M.; Kharqani, M.; Rahimi, M.; Sereshki, F. Alteration Zones Detection of Troud-Chah Shirin Volcanic—Plutonic Belt using different processing methods of ASTER images. Eng. Environ. Geol. 2015, 24, 107–116. [Google Scholar]
  48. Liaghat, S.; Sheykhi, V.; Najjaran, M. Petrology, gheochemistry and genesis of Baghu turquoise, Damghan. J. Sci. 2008, 34, 133–142, (In Persian with English Abstract). [Google Scholar]
  49. Nahidifar, E.; Fardoost, F.; Rezaii, M. Mineralogy of Dian Copper Deposit (South of Damghan). In Proceedings of the 17th Symposium of Geological Survey of Iran, Tehran, Iran, (In Persian). 29–31 October 2013. [Google Scholar]
  50. Roohbakhsh, P.; Karimpour, M.H.; Malekzadeh, A. Geology, mineralization, geochemistry and petrology of intrusions in the Kuh Zar Au-Cu deposit, Damghan. J. Econ. Geol. 2018, 10, 1–2. [Google Scholar]
  51. Green, A.A.; Craig, M.D. Analysis of aircraft spectrometer data, with logarithmic residuals. In Proceedings of the Airborne Imaging Spectrometer Data Analysis Workshop; Vane, G., Goetz, A., Eds.; JPL: Pasadena, CA, USA, 1985; pp. 111–119. [Google Scholar]
  52. Research Systems, Inc. ENVI Tutorials; Research Systems, Inc.: Boulder, CO, USA, 2008. [Google Scholar]
  53. Iwasaki, A.; Tonooka, H. Validation of a crosstalk correction algorithm for ASTER/SWIR. IEEE Trans. Geosci. Remote Sens. 2005, 43, 2747–2751. [Google Scholar] [CrossRef]
  54. Pour, B.A.; Hashim, M. Identification of hydrothermal alteration minerals for exploring of porphyry copper deposit using ASTER data, SE Iran. J. Asian Earth Sci. 2011, 42, 1309–1323. [Google Scholar] [CrossRef]
  55. Pour, B.A.; Hashim, M. Spectral transformation of ASTER and the discrimination of hydrothermal alteration minerals in a semi-arid region, SE Iran. Int. J. Phys. Sci. 2011, 6, 2037–2059. [Google Scholar]
  56. Pour, B.A.; Hashim, M. Identifying areas of high economic-potential copper mineralization using ASTER data in Orumieh–Dokhtar Volcanic Belt, Iran. Adv. Spaceborn Res. 2012, 49, 753–769. [Google Scholar] [CrossRef]
  57. Pour, B.A.; Hashim, M. The application of ASTER remote sensing data to porphyry copper and epithermal gold deposits. Ore Geol. Rev. 2012, 44, 1–9. [Google Scholar] [CrossRef] [Green Version]
  58. Honarmand, M.; Ranjbar, H.; Shahabpour, J. Application of Principal Component Analysis and Spectral Angle Mapping in the mapping of hysrothermal alteration in the Jebal–Barez area, southeastern Iran. Resour. Geol. 2012, 62, 119–139. [Google Scholar] [CrossRef]
  59. Khaleghi, M.; Ranjbar, H.; Shahabpour, J.; Honarmand, M. Spectral angle mapping, Spectral information divergence and Principal component analysis of the ASTER SWIR data for exploration of porphyry copper mineralization in the Sarduiyeh area, Kerman province, Iran. Appl. Geomat. 2014, 6, 49–58. [Google Scholar] [CrossRef]
  60. Siljestrom, P.; Moreno, A.; Vikgren, K.; Cáceres Puro, L. The application of selective principal components analysis (SPCA) to a Thematic Mapper (TM) image for the recognition of geomorphologic configuration. Int. J. Remote Sens. 1997, 18, 3843–3852. [Google Scholar] [CrossRef]
  61. Fraser, S.J.; Green, A. A software defoliant for geological analysis of band ratios. Int. J. Remote Sens. 1987, 8, 525–532. [Google Scholar] [CrossRef]
  62. Abdelsalam, M.; Stern, R. Mapping gossan in arid regions with landsat TM and SIR-C images, the Beddaho Alteration Zone in northern Eritrea. J. Afr. Earth Sci. 2000, 30, 903–916. [Google Scholar] [CrossRef]
  63. Rowan, L.C.; Mars, J.C. Lithologic mapping in the Mountain Pass, California area using Advanced Spaceborne Thermal Emission and Reflection Radiometer (ASTER) data. Remote Sens. Environ. 2003, 84, 350–366. [Google Scholar] [CrossRef]
  64. Mars, J.C.; Rowan, L.C. Regional mapping of phyllic- and argillic-altered rocks in the Zagros magmatic arc, Iran, using Advanced Spaceborne Thermal Emission and Reflection Radiometer (ASTER) data and logical operator algorithms. Geosphere 2006, 2, 161–186. [Google Scholar] [CrossRef]
  65. Rowan, L.C.; Robert, G.S.; John, C. Distribution of hydrothermally altered rocks in the Peko Diq, Pakestan mineralized area based on spectralysis of ASTER data. Remote Sens. Environ. 2006, 104, 74–87. [Google Scholar] [CrossRef]
  66. Yang, C.; Everitt, J.H.; Bradford, J.M. Yield estimation from hyperspectral imagery using spectral angle mapper (SAM). Am. Soc. Agric. Biol. Eng. 2008, 51, 729–737. [Google Scholar]
  67. Hosseinjani, M.; Tangestani, M. Mapping alteration minerals using sub-pixel unmixing of ASTER data in the Sarduyeh area, SE Kerman, Iran. Int. J. Digit. Earth 2011, 4, 487–504. [Google Scholar] [CrossRef]
  68. Dennison, P.E.; Roberts, D.A. Endmember selection for multiple endmember spectral mixture analysis using endmember average RMSE. Remote Sens. Environ. 2003, 87, 123–135. [Google Scholar] [CrossRef]
  69. Boardman, J.W.; Kruse, F.A. Automated Spectra Analysis: A Geologic Example Using AVIRIS Data, North Grapevine on Geologic Remote Sensing; Environmental Research Institute of Michigan: Arbor, MI, USA, 1994; pp. 407–418. [Google Scholar]
  70. Green, A.A.; Berman, M.; Switzer, P.; Craig, M.D. A transformation for ordering multispectral data in terms of image quality with implications for noise removal. IEEE Trans. Geosci. Remote Sens. 1988, 26, 65–74. [Google Scholar] [CrossRef] [Green Version]
  71. Jensen, J.R. Introductory Digital Image Processing; Pearson Prentice Hall: Upper Saddle River, NJ, USA, 2005. [Google Scholar]
  72. Sabins, F.F. Remote sensing for mineral exploration. J. Geol. Rev. 1999, 14, 157–183. [Google Scholar] [CrossRef]
  73. Kokaly, R.F.; Clark, R.N.; Swayze, G.A.; Livo, K.E.; Hoefen, T.M.; Pearson, N.C.; Wise, R.A.; Benzel, W.M.; Lowers, H.A.; Driscoll, R.L.; et al. USGS Spectral Library Version 7; U.S. Geological Survey Data Series 1035; USGS: Reston, VI, USA, 2017; 61p.
  74. Askari, G.; Li, Y.; Moezzi Nasab, R. An adaptive polygonal centroidal voronoi tessellation algorithm for segmentation of noisy SAR images. Int. Arch. Photogramm. Remote Sens. Spat. Inf. Sci. 2014, XL-2/W3, 65–68. [Google Scholar] [CrossRef]
  75. Velosky, J.C.; Stern, R.J.; Johnson, P.R. Geological control of massive sulfide mineralization in the Neoproterozoic Wadi Bidah shear zone, southwestern Saudi Arabia, inferences from orbital remote sensing and field studies. Precambrian Res. 2003, 123, 235–247. [Google Scholar] [CrossRef]
  76. Hunt, G.R. Electromagnetic radiation: The communication link in remote sensing. In Remote Sensing in Geology; Siegal, B.S., Gillespie, A.R., Eds.; John Wiley & Sons: New York, NY, USA, 1980; pp. 5–45. [Google Scholar]
  77. Burns, R.G. Mineralogical Applications of Crystal Field Theory; Cambridge University Press: Cambridge, UK, 1993; 551p. [Google Scholar]
  78. Clark, R.N. Spectroscopy of rocks and minerals, and principles of spectroscopy. In Manual of Remote Sensing; Rencz, A., Ed.; Wiley and Sons Inc.: New York, NY, USA, 1999; Volume 3, pp. 3–58. [Google Scholar]
  79. Hunt, G.R. Spectral signatures of particulate minerals in the visible and near-infrared. Geophysics 1977, 42, 501–513. [Google Scholar] [CrossRef]
  80. Sgavetti, M.; Pomilio, L.; Meli, S. Reflectance spectroscopy (0.3–2.5 μm) at various scales for bulk-rock identification. Geosphere 2006, 2, 142–160. [Google Scholar] [CrossRef]
  81. Di Tommaso, I.; Rubinstein, N. Hydrothermal alteration mapping using ASTER data in the infiernillo porphyry deposite, Argentina. Ore Geol. Rev. 2007, 32, 275–270. [Google Scholar] [CrossRef]
  82. Kruse, F.A.; Perry, S.L. Mineral mapping using simulated Worldview-3 short-wave-infrared imagery. Remote Sens. 2013, 5, 2688–2703. [Google Scholar] [CrossRef]
  83. Hunt, G.R.; Evarts, R.C. The use of near-infrared spectroscopy to determine the degree of serpentinization of ultramafic rocks. Geophysics 1980, 46, 316–321. [Google Scholar] [CrossRef]
  84. Hunt, G.R. Near-infrared 1/3–2/4 (μm) spectra of alteration minerals potential for use in remote sensing. J. Geophys. 1979, 44, 1974–1986. [Google Scholar] [CrossRef]
  85. Bishop, J.L.; Lane, M.D.; Dyar, M.D.; Brwon, A.J. Reflectance and emission spectroscopy study of four groups of phyllosilicates: Smectites, kaolinite-serpentines, chlorites and micas. Clay Miner. 2008, 43, 35–54. [Google Scholar] [CrossRef]
  86. Cudahy, T.J.; Ramanaidou, E.R. Measurement of the hematite: Goethite ratio using field visible and near-infrared reflectance spectrometry in channel iron deposits, Western Australia. Aust. J. Earth Sci. 1997, 44, 411–420. [Google Scholar] [CrossRef]
  87. Frost, R.L.; Johansson, U. Combination bands in the infrared spectroscopy of kaolins—A drift spectroscopic study. Clays Clay Miner. 1998, 46, 466–477. [Google Scholar] [CrossRef]
  88. Gaffey, S.J. Spectral reflectance of carbonate minerals in the visible and near-infrared (0.35–2.55 microns): Calcite, aragonite, and dolomite. Am. Mineral. 1986, 71, 151–162. [Google Scholar]
Figure 1. (A) The geographical location of the Toroud–Chahshirin Magmatic Belt (TCMB) in North of Iran (red rectangle). (B) Simplified geological map of the Moaleman region showing the distribution of polymetallic vein-type mineralization (modified from [42]). Abbreviations: UDMB: Urumieh–Dokhtar Magmatic Belt; MMB: Makran Magmatic Belt; AMB: Alborz Magmatic Belt.
Remotesensing 11 00495 g001
Figure 2. The endmember mineral extracted from the ASTER dataset using of n-Dimensional visualization method. The reference spectra were resampled to the response function of ASTER bands. The ASTER band center positions are also shown.
Remotesensing 11 00495 g002
Figure 3. Reference endmember spectra of hematite, jarosite, montmorillonite, illite, muscovite, and chlorite obtained from the USGS spectral library for mapping alteration zones in the study area. The reference spectra were resampled to the response function of ASTER bands. The ASTER band center positions are also shown.
Remotesensing 11 00495 g003
Figure 4. SPC images derived from SPCA analysis. (A) SPC2 image showing oxide/hydroxide minerals as bright pixels; (B) SPC3 image showing the argillic alteration zone as bright pixels; (C) SPC3 image showing the phyllic alteration zone as bright pixels; and (D) SPC3 image showing the propylitic alteration zone as bright pixels.
Remotesensing 11 00495 g004
Figure 5. RGB false color composite of the SPC3 of argillic alteration (R), SPC3 of phyllic alteration (G), and SPC3 of propylitic alteration (B) images covering the study area.
Remotesensing 11 00495 g005
Figure 6. RGB false color composite of the BT1 (R), BT2 (G), and BT3 (B) derived from the BRMT algorithm for the study area.
Remotesensing 11 00495 g006
Figure 7. BRMT classification map for the study area.
Remotesensing 11 00495 g007
Figure 8. Fraction images of the selected n-D classes derived from MTMF algorithm for the study area. Pseudo-color ramp was applied to greyscale rule images. n-D class #2: hematite; n-D class #4 and n-D class #5: jarosite; n-D class #6: chlorite; n-D class #7: illite; n-D class #8: mixed spectral signatures of illite, muscovite, and montmorillonite; n-D class #9: muscovite/montmorillonite; n-D class #10: mixed spectral signatures of hematite and jarosite.
Remotesensing 11 00495 g008
Figure 9. Spectral Angle Mapper (SAM) classification map for the study area.
Remotesensing 11 00495 g009
Figure 10. Field photographs of the hydrothermal alteration zones in the study area. (A) A panoramic view of argillic alteration zones; (B) a view of the advanced argillic alteration zone; (C) a regional view of the phyllic alteration zone; (D) a regional view of hematite-rich altered oxidized zones in association with phyllic alteration zones; (E) a view of the propylitic zone; (F) a close up of a specimen from the propylitic alteration zone.
Remotesensing 11 00495 g010
Figure 11. Different types of alteration mineralogy in the alteration zones. Microphotographs of (A) argillic zone: plagioclase has been replaced by sericite and clay mineral groups; (B) advanced argillic zones: plagioclase crystals topotactically replaced by sericite and clay mineral groups; (C) phyllic zone: vein of opaque minerals and relicts of plagioclase that replaced by clay mineral groups and quartz; (D) phyllic zone: relicts of plagioclase replaced by sericite; (E) propylitic zone: completely replaced original mineralogy by calcite, epidote, and quartz; (F) propylitic zone: variolitic to sub-ophytic texture of plagioclase phenocrysts replaced by epidote. Abbreviation: plg = plagioclase, seri = sericite, opq = opaque minerals, qtz = quartz, epi = epidote, cal = calcite.
Remotesensing 11 00495 g011
Figure 12. Results of XRD analysis shows minerals of representative samples collected from (A) and (B) advanced argillic and argillic zones; (C,D) phyllic zone; and (E,F) propylitic zone.
Remotesensing 11 00495 g012
Figure 13. Laboratory reflectance spectra (average) of altered rock samples collected from phyllic, gossan, argillic, and propylitic zones. The main absorption feature spectra attributed to Fe+2, Fe+3, OH, H2O, Fe-OH, Al-OH, Fe, Mg-OH, and CO3 are annotated. A sensor-shift could be seen around 1.0 µm especially for gossan and argillic zone.
Remotesensing 11 00495 g013
Table 1. Eigenvector loadings matrix calculated using Selective Principal Component Analysis (SPCA) for selected Advanced Spaceborne Thermal Emission and Reflection Radiometer (ASTER) bands. (A) Iron oxides/hydroxides minerals; (B) Argillic alteration; (C) Phyllic alteration; and (D) Propylitic alteration.
ABand1Band2Band4 BBand4Band5Band6
PC1−0.57−0.57−0.58PC10.58−0.57−0.57
PC2−0.42−0.390.81PC2−0.810.350.46
PC3−0.7−0.14−0.14PC3−0.61−0.730.67
CBand5Band6Band7 DBand7Band8Band9
PC1−0.57−0.57−0.57PC1−0.58−0.57−0.57
PC2−0.42−0.390.81PC2−0.730.060.67
PC3−0.690.710.02PC30.35−0.810.45
Table 2. Positive and negative correlation (±r) and contribution percent (C%) of the band ratios n1–n36 used for Band Ratio Matrix Transformation (BRMT).
Band RatioNegative Positive Band RatioNegative Positive
r C%+r C% r C%+r C%
n1−0.341.860.404.81n19−0.583.130.121.49
n2−0.864.650.364.38n20−0.603.240.131.61
n3−0.542.910.283.42n21−0.372.010.121.40
n4−0.985.320.121.39n22−0.824.440.222.66
n5−0.563.060.121.50n23−0.361.960.313.71
n6−0.603.260.121.45n24−0.361.980.354.23
n7−0.633.420.131.57n25−0.372.030.334.02
n8−0.452.46--n26−0.512.750.526.22
n9−0.321.750.323.87n27−0.442.370.212.56
n10−0.553.010.151.79n28−0.412.250.313.68
n11−0.552.960.111.36n29−0.432.330.344.07
n12−0.412.23--n30−0.361.940.566.74
n13−0.985.320.131.62n31−0.321.750.334.04
n14−0.402.180.111.30n32−0.372.020.323.85
n15−0.482.62--n33−0.382.060.394.69
n16−0.542.940.182.21n34−0.231.270.404.83
n17−0.955.190.263.17n35−0.522.840.182.18
n18−0.392.110.161.98n36−0.442.380.182.22
Table 3. Eigenvalues, variance percent (%V) and positive and negative correlation averages (+rk > 0.1 and −rk < 0.1) of the forward BRMT for BT1–BT10.
BT Number12345678910
Eigenvalue 0.123000000066060.009280.006430.003350.002550.001250.000980.000830.000050.00002
V%83.246.284.352.271.720.850.660.560.030.01
+ r ¯ k 0.400.250.170.220.230.270.210.24--
+ r ¯ k %20.0712.708.5111.0211.3913.6710.5812.06--
r ¯ k −0.92−0.42−0.38−0.36−0.27−0.24−0.27−0.26--
r ¯ k %29.4813.3612.0811.548.787.628.828.32--
Table 4. The selected band transform bands (BTs) contain specific spectral properties (negative and positive contribution percent > 3%).
Contribution > 3%BT
Positiven30n26n34n1n33n2n24n29n31n25n9n32n23n28n3n17
Negative n10n5n19n20n6n7n22n2n17n13n4-----
Table 5. (A) The accuracy assessment for the Mixture Tuned Matched Filtering (MTMF) method based on GPS survey collected during the field study. (B) The accuracy assessment for the Spectral Angle Mapper (SAM) method based on GPS survey collected during the field study.
(A) Ground Truth Samples
ClassArgillicPhyllicPropyliticUser Acc. (Percent)
Unclassified1151-
Argillic570098.2
Phyllic084084.8
Propylitic004998
Prod. Acc.100100100
Over. acc. (Percent)Kappa Coef. (Percent)
95.70.93
(B) Ground Truth Samples
ClassArgillicPhyllicPropyliticUser Acc. (Percent)
Unclassified129-
Argillic5325662
Phyllic472092.3
Propyllitic003579.5
Prod. Acc.92.974.285.3-
Over. acc. (Percent)Kappa Coef. (Percent)
84.40.78

