Article

Mapping and Monitoring of Biomass and Grazing in Pasture with an Unmanned Aerial System

by
Adrien Michez
1,*,
Philippe Lejeune
1,
Sébastien Bauwens
1,
Andriamandroso Andriamasinoro Lalaina Herinaina
2,
Yannick Blaise
3,
Eloy Castro Muñoz
3,4,
Frédéric Lebeau
1,5 and
Jérôme Bindelle
3
1
TERRA Research and Teaching Center—Forest Is life, Gembloux Agro Bio-Tech, University of Liege, 5030 Gembloux, Belgium
2
Biotechnologie et Gestion des Agents Pathogènes en agriculture (BIOGAP), Yncréa Hauts-de-France, Institut Supérieur d’Agriculture, 48 boulevard Vauban, 59046 Lille Cedex, France
3
AgroBioChem/TERRA, Precision Livestock and Nutrition Unit, Gembloux Agro Bio-Tech, University of Liege, 5030 Gembloux, Belgium
4
Universidad Central del Ecuador, Facultad de Ciencias Agrícolas. Jerónimo Leiton y Av. La Gasca s/n. Ciudadela Universitaria, 170521 Quito, Ecuador
5
Lebeau Frederic ITAP, University Montpellier, Irstea, Montpellier SupAgro, 34196 Montpellier, France
*
Author to whom correspondence should be addressed.
Remote Sens. 2019, 11(5), 473; https://doi.org/10.3390/rs11050473
Submission received: 24 January 2019 / Revised: 20 February 2019 / Accepted: 21 February 2019 / Published: 26 February 2019
(This article belongs to the Special Issue Progress on the Use of UAS Techniques for Environmental Monitoring)

Abstract

:
The tools available to farmers to manage grazed pastures and adjust forage demand to grass growth are generally rather static. Unmanned aerial systems (UASs) are interesting versatile tools that can provide relevant 3D information, such as sward height (3D structure), or even describe the physical condition of pastures through the use of spectral information. This study aimed to evaluate the potential of UAS to characterize a pasture’s sward height and above-ground biomass at a very fine spatial scale. The pasture height provided by UAS products showed good agreement (R2 = 0.62) with a reference terrestrial light detection and ranging (LiDAR) dataset. We tested the ability of UAS imagery to model pasture biomass based on three different combinations: UAS sward height, UAS sward multispectral reflectance/vegetation indices, and a combination of both UAS data types. The mixed approach combining the UAS sward height and spectral data performed the best (adj. R2 = 0.49). This approach reached a quality comparable to that of more conventional non-destructive on-field pasture biomass monitoring tools. As all of the UAS variables used in the model fitting process were extracted from spatial information (raster data), a high spatial resolution map of pasture biomass was derived based on the best fitted model. A sward height differences map was also derived from UAS-based sward height maps before and after grazing. Our results demonstrate the potential of UAS imagery as a tool for precision grazing study applications. The UAS approach to height and biomass monitoring was revealed to be a potential alternative to the widely used but time-consuming field approaches. While reaching a similar level of accuracy to the conventional field sampling approach, the UAS approach provides wall-to-wall pasture characterization through very high spatial resolution maps, opening up a new area of research for precision grazing.

1. Introduction

Grasslands cover 26% of the world’s total land area and 69% of the agricultural area and are the least expensive way to feed ruminants, such as cattle reared for milk or meat production [1]. In the European Union, permanent pastures and meadows occupy 34% of the utilized agricultural area. A significant share of the cultivated fields include temporary pastures in their rotation [2]. Grazed pastures benefit the sustainability of dairy production in multiple ways, such as lower feeding costs [3], higher animal welfare and a lower occurrence of lameness and mastitis, good public image, and increased milk quality [4]. In addition, grasslands have an important role in the provision of social and environmental services [5]. The selection of an adequate choice of diverse grass and legume species and varieties with adequate management could also support the growth of a wider range of micro-fauna and crop auxiliaries. Finally, pastures could play a significant role in trapping atmospheric CO2 through soil carbon sequestration [6].
Managing pastures through direct grazing is not an easy task, as it requires combining actions to allow the dynamic growth of multispecies grassland vegetation while managing animals that consume it selectively and non-homogeneously. The plant and the animal components of the grazed pasture system have mutual influences in addition to the influences of environmental factors. Both components also have different biological dynamics. Unfortunately, the tools available to farmers to manage grazed pastures and adjust forage demand to grass growth are generally rather static, for example, the use of stocking rates, fences, grazing pressure, resting times, locations of water troughs, locations of salt licks, fertilization, and irrigation [7].
The application of precision livestock farming to grazing has the potential to promote more dynamic management of ruminants on grasslands by switching from management at the herd level to the management of each individual on the pasture. In the past decade, several works have demonstrated how the development in sensors and information technology can be used to improve the monitoring of grazing animals, especially cattle [8,9,10,11]. Monitoring the grazing process to the finest scale, namely at the consumption level, in space and time is now possible [8], and the development of such technology as a research tool is likely to enter farms progressively as a complement to virtual fences [12]. In addition to the monitoring of individual grazing animals, improvements in the monitoring of the grazed vegetation are also called for. French et al. [12] presented a rising plate meter that automatically communicates the pasture height and biomass data to a geographic information system (GIS). Other techniques, such as satellite-based remote-sensing [13] and on-field 2-D and 3D-cameras, have been used to measure photosynthetic activity and forage height [14] or to identify weeds in grasslands [15]. Handcock et al. [16] proposed combining satellite remote sensing and collar-based georeferenced information to characterize animal behavior and environmental interactions. Even though the accessibility and the spatial resolution of satellite imagery are continuously improving, generally, they are too coarse to describe pastures at the scale of individual animals on the pasture. On the other hand, field-based remote sensing methods, such as terrestrial light detection and ranging (LiDAR), allow for the fine 3D characterization of vegetation structure [17]. LiDAR technology was also successfully combined with a vegetation index (normalized difference vegetation index, NDVI) by Schaeffer and Lamb [18] to estimate the standing biomass on tall fescue pastures. Nevertheless, terrestrial remote sensing remains spatially limited. At the interface of satellite-based remote sensing and on-field approaches, unmanned aerial systems (UASs) can cover substantial areas (>10 ha in a single flight), providing imagery at a very high spatial resolution (<0.1 m). Moreover, UASs are very versatile tools that can be deployed by the end user on-demand. Over the past decade, UASs have been widely used in various environmental applications including forest characterization [19], wildlife census [20], invasive species mapping [21], and precision agriculture [22]. In precision agriculture, UASs have been used for quantitative crop monitoring [23], weed detection [24], and plant phenotyping [25]. They have also been used for grazing applications in research, including biomass monitoring [26] and adventive species detection [27]. The success of UASs is linked to the development of structure from motion (SFM) photogrammetry [28], which allows 3D data (digital surface model in case of aerial survey) to be derived from overlapping images acquired with consumer-grade digital cameras. In the agricultural field, SFM photogrammetry can be used to derive the crop surface/height model (CSM/CHM) from UAS imagery at very low cost compared to LiDAR. In the context of precision grazing, pioneer studies [29,30] have demonstrated the quality of height and biomass information derived from the UAS. However, these previous studies have mostly focused on ungrazed, experimental pastures while leaving open the question of monitoring grazing through the use of a multi-temporal approach. Such approaches are needed to develop innovative tools to provide quick responses to allow the adaptation of grazing schedules or other decision-making tools for farmers.
Pastures should be consumed by animals when they display a specific structure that is principally defined by height and density, ensuring the removal of only grass leaves during bites [31]. Pasture height information is very important for farmers to maximize the intake rate of animals. However, such measurements are still taken using low frequency and time-consuming instruments, notably sward-sticks or rising plate meters [14]. The use of UAS imagery could be a solution to provide higher frequency, higher spatial resolution, and more precise information about the biomass productivity of a pasture.
In this context, this study aimed to evaluate the potential of UAS as a tool for the characterization of pasture 3D structure (sward height) and above-ground biomass at a very fine spatial scale. More specifically, it evaluated the suitability of UAS for monitoring sward height differences and pasture biomass. Based on the hypothesis that UAS products (e.g., sward height model and orthophotos mosaic) can reflect the pasture biomass and sward height multi-temporal differences, this approach investigated the potential of UASs to monitor grazing at the feeding station level.

2. Materials and Methods

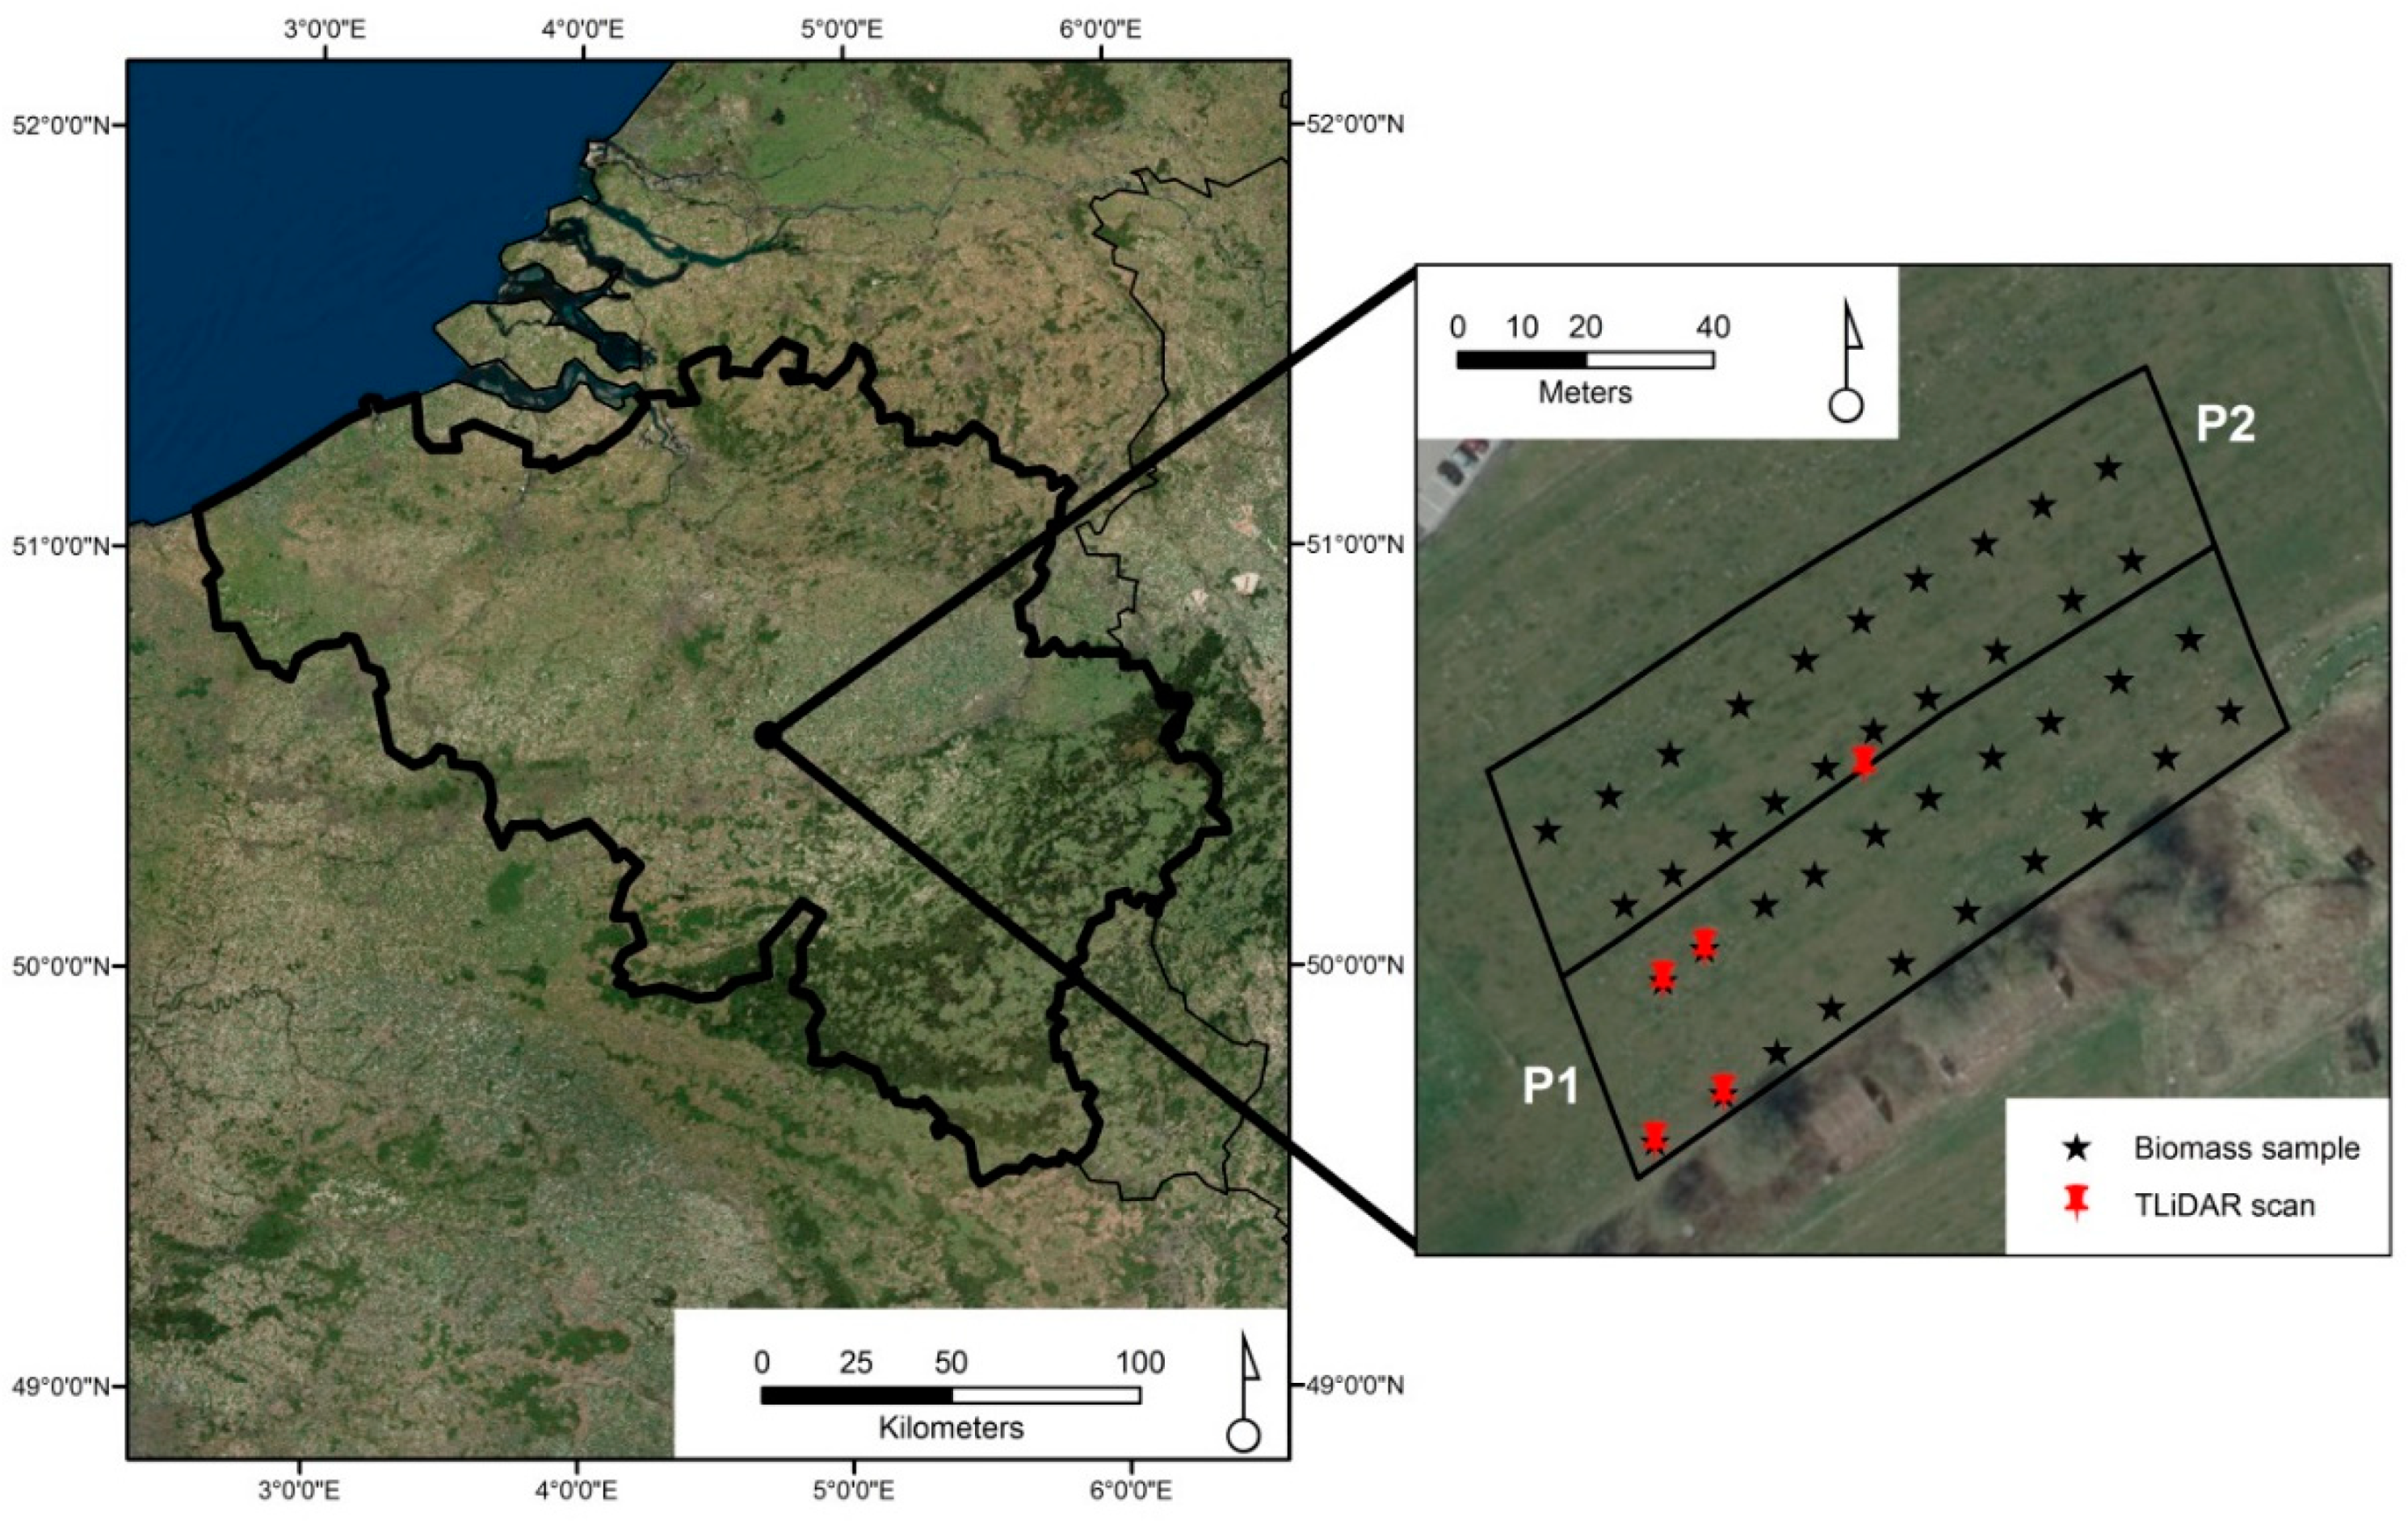
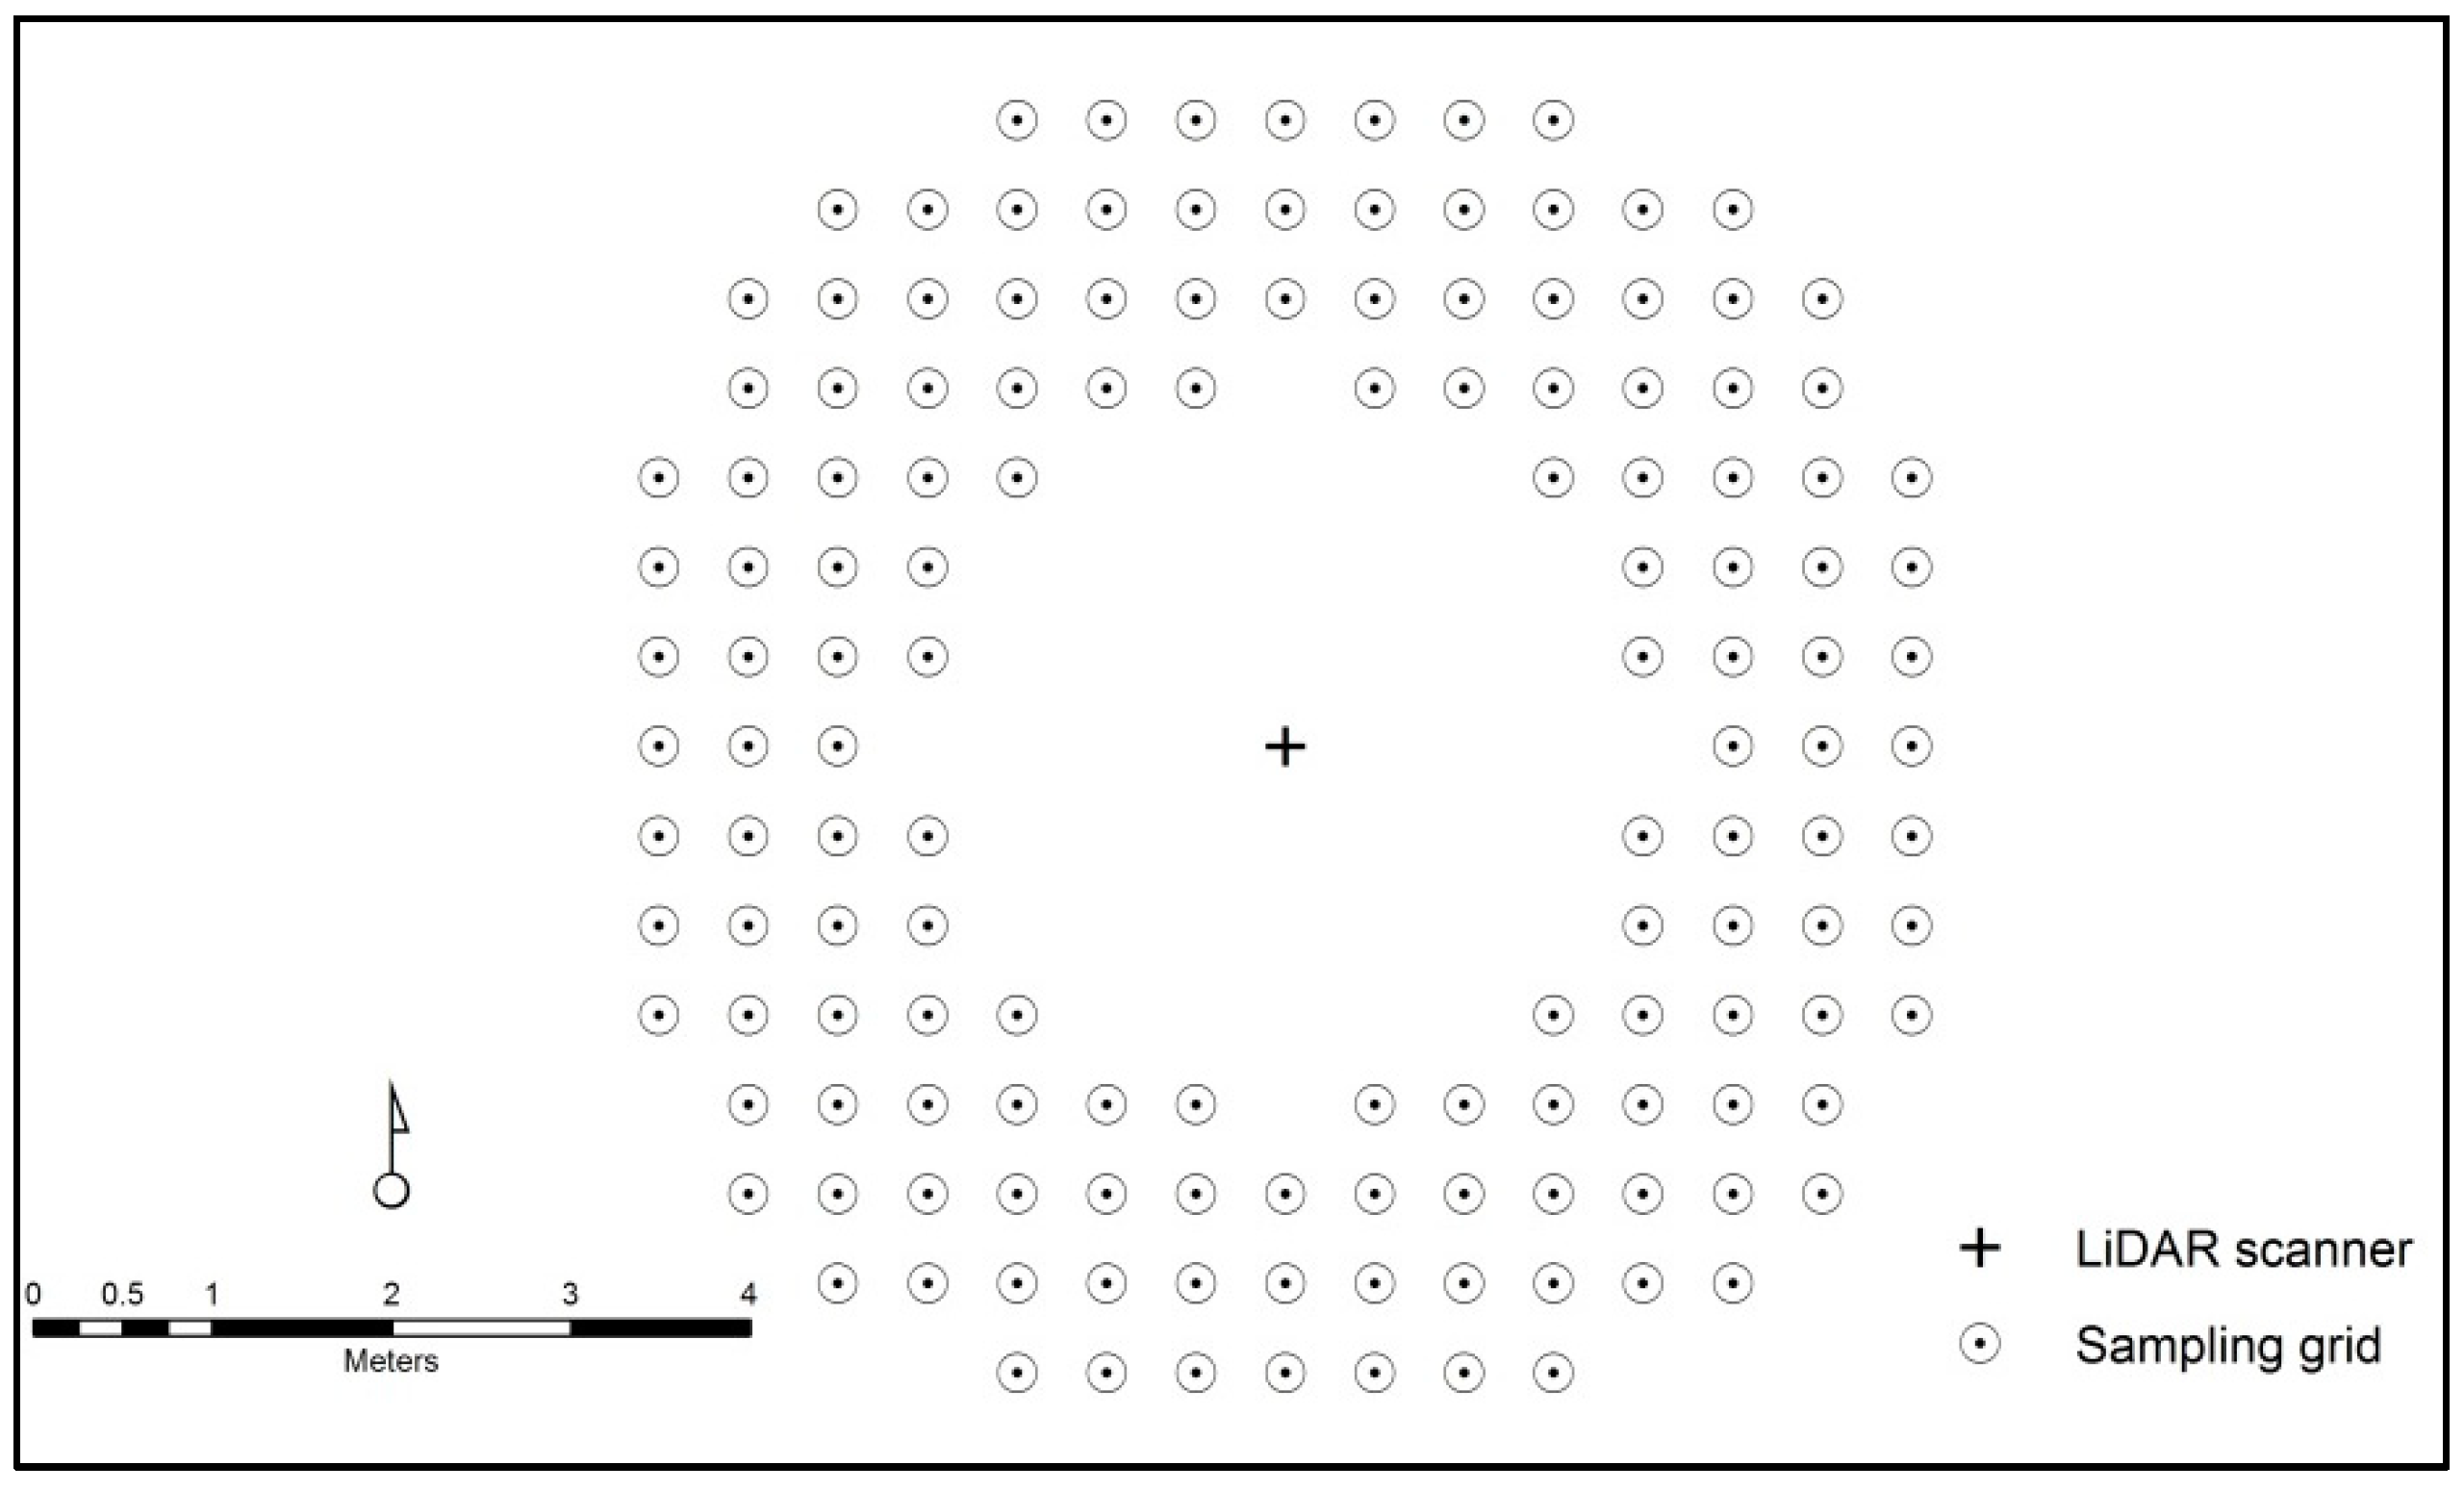
2.1. Study Site and Field Sampling

The study site consisted of experimental Lolium perenne (ryegrass) and Trifolium repens (clover) based pastures (Figure 1) located in Gembloux (Belgium). Each individual plot represented an area of ca. 4000 m2. The study took place from 9 May to 12 May 2017. All pastures had been deferred from grazing since October 2016 (seven months), and grass was allowed to regrow ungrazed until the beginning of the experiment. Six dry red-pied cows were introduced to the first pasture (see Figure 1, plot P1) for two consecutive days (9 May to 10 May) and were moved to the next test pasture (P2) for the last two days (11 May to 12 May). Forty above-ground biomass samples were taken for dry-weighing from both pastures (P1 and P2) within a square of 0.09 m2 centered on the marked point (four squares and center) along the sampling grid (Figure 1) before cows were set to graze. No distinction between the different species was made in the data collection. The center of the biomass samples was precisely geo-referenced using an RTK GPS (±0.04 m mean XYZ accuracy).

2.2. UAS Imagery Acquisition and Processing

An octocopter drone (X frame type) equipped with an off-the-shelf high resolution (20 Mpx) RGB camera (Sony RX 100, 8.8 mm focal length) and a multispectral camera (Parrot Sequoia) was used. The multispectral camera had a lower spatial resolution (1.2 Mpx), but provided fine multispectral information, covering green (550 nm), red (660 nm), near infrared (735 nm), and red-edge (790 nm) wavelengths. The full width at half maximum was 40 nm for red, green, and near infrared, and 10 nm for the red-edge wavelength. The flight height was set to 50 m above ground level, with a cruise speed of 5 m.s-1 and front and side overlaps above 80%. The UAS flight surveys were performed before (May 8) and after the cows grazed the pastures (15 May).
Eight ground control points (GCPs) consisting of 0.4 m white square plastic plates were placed in the surveyed area to ensure geometric calibration. The GCPs were georeferenced with an RTK GPS (±0.04 m mean XYZ accuracy).
The images provided by the high spatial resolution RGB sensor (Sony RX100 III) were processed with Agisoft Photoscan 1.3 to produce a high spatial resolution digital surface model (DSM, 0.025 m GSD). Agisoft Photoscan is widely used by the UAS scientific community to perform high resolution and reliable 3D models from UAS surveys (e.g., [32,33,34]). The sparse and dense clouds were processed using the “high” level of accuracy for parameters. The depth filtering strategy was set to “aggressive”. The optimization process was based on the GCP location and was applied to all of the available parameters (except for the rolling shutter parameter). As Agisoft Photoscan 1.3 does not allow radiometric calibration workflow, we used Pix4D Suite 3.1 (Lausanne, Switzerland) to perform a photogrammetric 3D reconstruction of the multispectral imagery using the “Ag Multispectral” predefined workflow. Radiometric calibration of the multispectral camera was undertaken before each flight with a calibration target (Airinov). The images acquired by the multispectral sensor were used to derive reflectance maps (0.05 m ground sampling distance, GSD) of the four wavelengths (green, red, near-infrared, and red-edge). The four reflectance layers were combined to produce four straight-forward vegetation indices (0.05 m GSD) covering the different layers of the multispectral camera (Table 1). We did not include the spectral information provided by the visible camera in the analysis because of its lower spectral resolution.
Using the same approach as Michez et al. [23] with Zea mays field crops, a height model was derived by subtracting a LiDAR digital terrain model (DTM) from the high spatial resolution photogrammetric DSM in order to provide a raster of the sward height at the study site (0.025 m GSD). This height model will be further referred to as the sward height model (SHM). The LiDAR DTM used in this study was derived from a relatively low-density LiDAR survey (<1 point/m2) acquired during the years 2013 and 2014 (see http://geoportail.wallonie.be/ for further information). As the pastures were installed before the LiDAR survey and have not been tilled since, this LiDAR DTM was considered to be relevant for describing the topography of the study site.
At the center of the field measurement locations, we extracted the UAS information (height and reflectance values) as the median values of the considered layers’ pixels in a 0.15 m radius circular buffer. The UAS variables used for the analysis are listed in Table 2.

2.3. Validation of UAS Sward Height

Five static LiDAR laser scans were performed using a FARO Focus 3D 120 (FARO, 250 Technology Park Lake Mary, FL 32746, United States) to produce reference sward height data. The LiDAR scanner uses phase-shift-based LIDAR technology to measure the XYZ locations of objects surrounding the scanner. The FARO scanner has a maximum range of 120 m with an accuracy of 2 mm at 10 m. The Focus 3D 120 has a 360° horizontal field of view and a 305° vertical field of view. Due to the 55° missing vertical field of view, a disc of 1.5 m of radius was not scanned under the scanner (the position height of the scanner was 1.3 m). The scanner was located in the center of five subsamples of the plots. The resolution of the scans was set to one-quarter of the full resolution. The different locations of the scanner were recorded with an RTK GPS (±0.04 m mean XYZ accuracy). The LiDAR scans were performed on May 7 before cows were set to graze.
The five generated point clouds were georeferenced using the FARO SCENE software (version 6.2.4). The LASTools suite (version 171124, http://rapidlasso.com/LAStools) was used to produce five digital surface models corresponding to a triangulation (0.01 m grid) of the highest points. In order to remove the noise, triangulation was performed over the 95th percentile points (Z values) within a XY grid of 0.01 m. The five DSM were subtracted to the above-referenced aerial LiDAR DTM to produce a LiDAR sward height model (SHM) at 0.01 m spatial resolution. This last step was performed to counter the low ground point density in the terrestrial laser scans due to occlusion by the pasture canopy.
The five grass LiDAR-derived SHM were compared to the UAS SHM (before grazing) using a 0.5 m grid within a circular area of interest (2 m < radius < 5 m) centered on the location of the scans (Figure 2). For every grid cell, a median value of the compared SHM was computed within a circular buffer of 0.1 m. A linear regression model was fitted to evaluate the correspondence between the sward height estimated with the UAS imagery and a reference SHM extracted with highly accurate LiDAR data:
Model 1: Ref. LiDAR sward height = f (UAS sward height).
Model 1 was a linear regression model fitted between the pasture height in the study area obtained from the LiDAR SHM and the UAS SHM (575 observations before cattle grazing). Considering the high quality of the LiDAR 3D products, the LiDAR pasture height was considered as a reference pasture height. The goodness of fit of Model 1 was considered as a proxy of the ability of the UAS height to describe the pasture height in further analyses, notably to produce sward height maps before and after grazing as well as sward height difference maps from multitemporal sward height models. A cross validation of Model 1 was performed using the repeated k-fold approach (k = 5; repetitions = 100).

2.4. Modeling Biomass of Pasture with UAS Imagery

The modeling of pasture biomass (before grazing) was investigated comparatively with different UAS products (3D and/or spectral):
Model 2: Pasture biomass = f (UAS height)
Model 3: Pasture biomass = f (UAS Reflectance, UAS VI)
Model 4: Pasture biomass = f (UAS height, UAS Reflectance, UAS VI).
Models 2, 3 and 4 evaluated the strictly 3D, spectral, and mixed (3D + spectral) UAS biomass modeling approaches, respectively (see Table 2 for a detailed list of variables). The UAS heights and spectral data averaged (median) within a circle of 0.15 m radius were compared to the pasture biomass values measured on the 0.09 m2 georeferenced spots. We checked for non-linearity between the predictors and the field measured pasture biomass. To reduce the number of predictors in the fitted multivariate models (Models 3 and 4), stepwise selection (both directions) was performed using the Akaike information criterion [39] implemented in the StepAIC tool from the “MASS” R package [40]. Within the selected set of variables, only significant variables (as determined by p-value) were kept in the final model. To determine the pasture biomass model that presented the best performance, the relative importance of the selected variables was computed by a decomposition of the models’ explained variance into non-negative contributions, following the approach of Lindeman et al. [41]. This was implemented in the “relaimpo” package in R. For all of the UAS pasture biomass models, cross validation using the repeated k-fold approach was performed (k = 5; repetitions = 100).

2.5. Mapping Sward Height Differences and Biomass with UAS

As all of the UAS variables used in the model fitting process were extracted from spatial information (raster data), a high spatial resolution map of pasture height and pasture biomass was derived based on the previously fitted models. The multitemporal height maps were combined to produce a high resolution map of sward height differences (height map ‘before’ MINUS height map ‘after’). As field biomass sampling only occurred ‘before grazing’, the pasture biomass map was subsequently computed for this time window.

3. Results

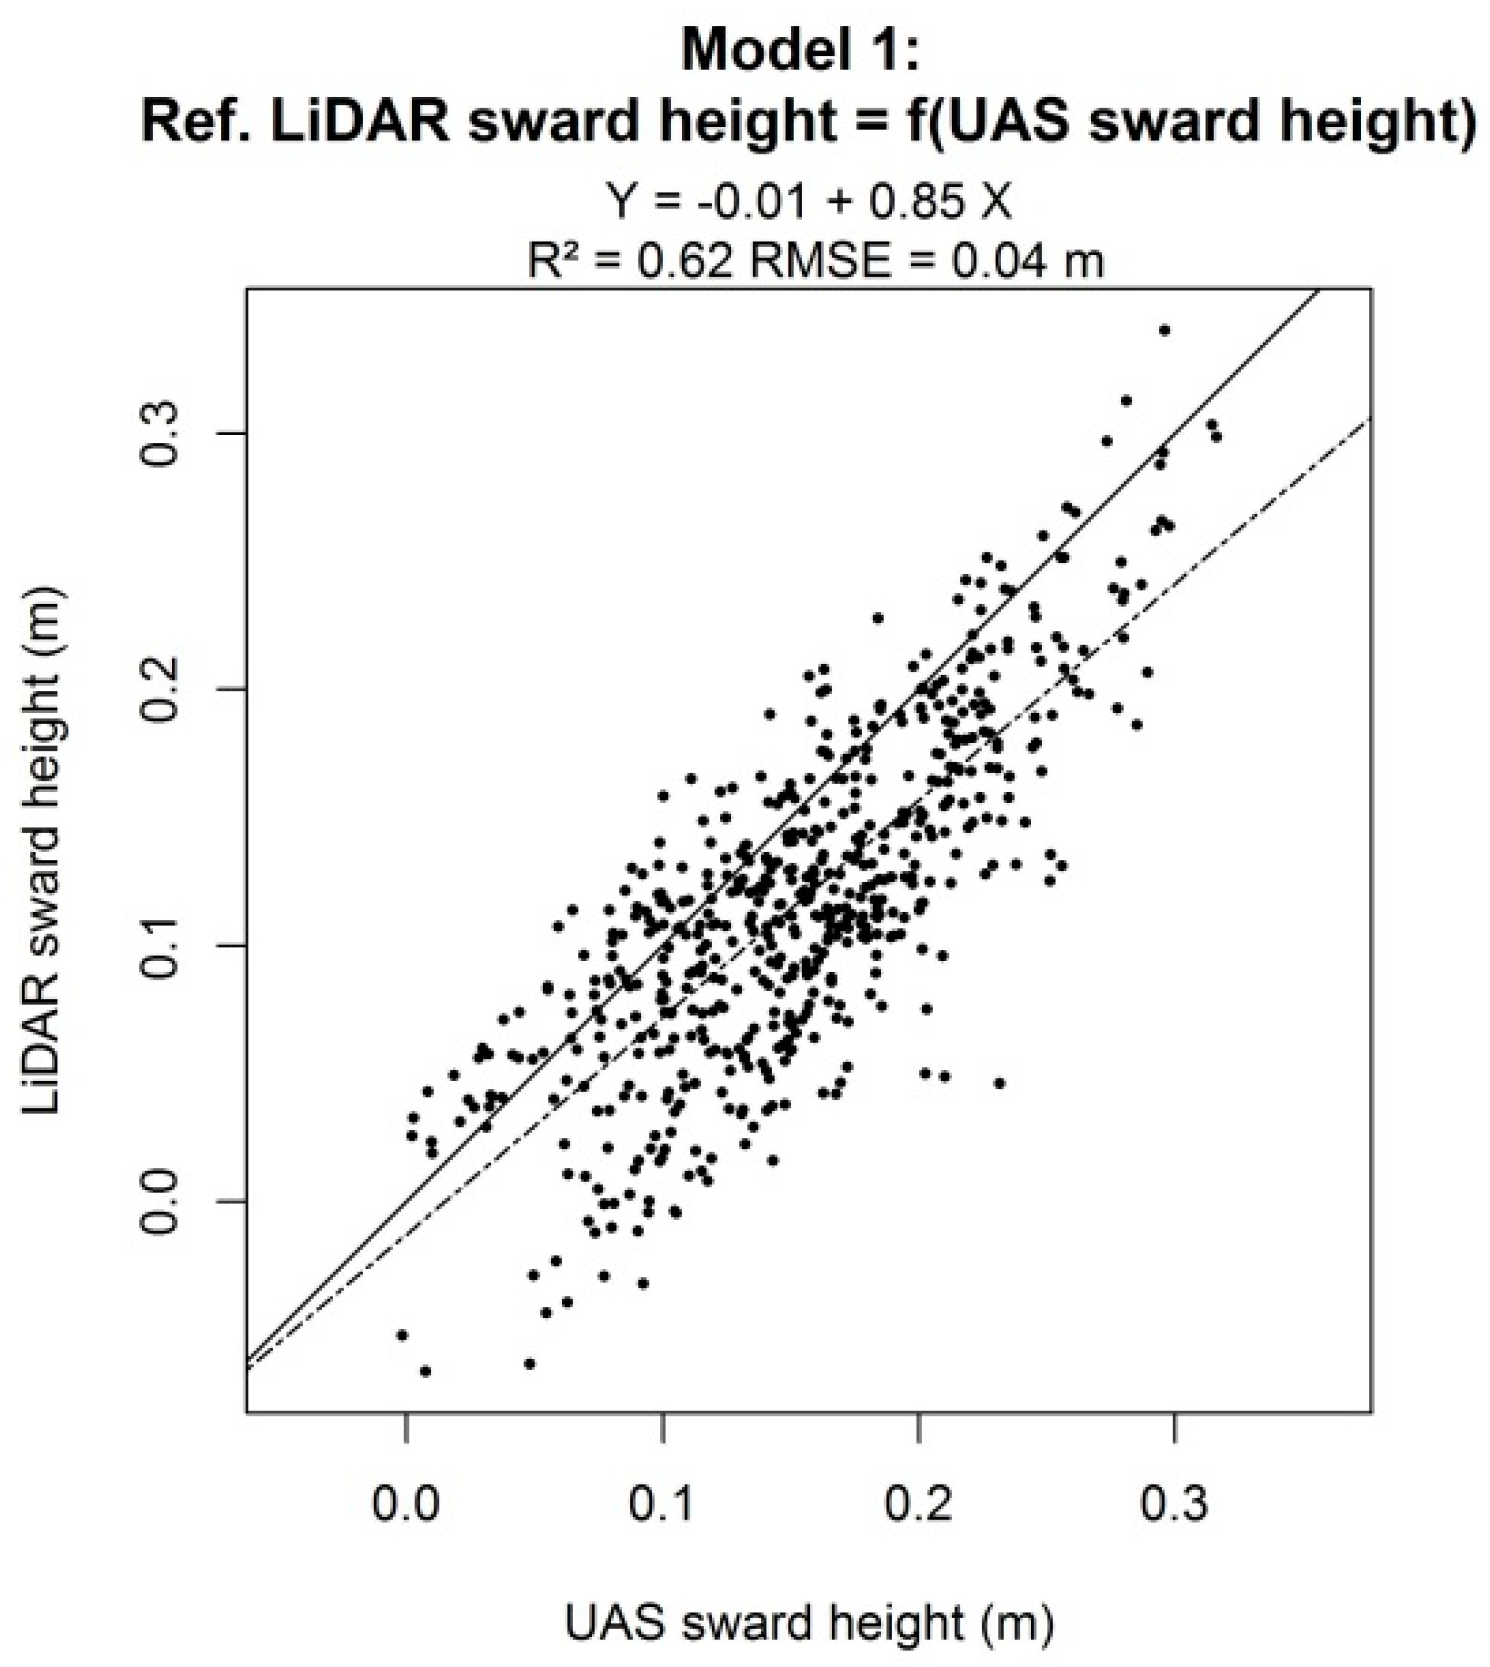
3.1. Validation of UAS Sward Height

The sward height provided by UAS products agreed well (R2 = 0.62, RMSE = 0.04 m) with the reference (LiDAR) sward height information (Figure 3). The results of the cross validation process showed a similar performance and can be found in Appendix A.
Regarding our objectives, the accuracy of the sward height estimated with UAS imagery was consequently considered to be sufficient to produce sward height maps for the study site (before and after grazing) to derive a sward height differences map.

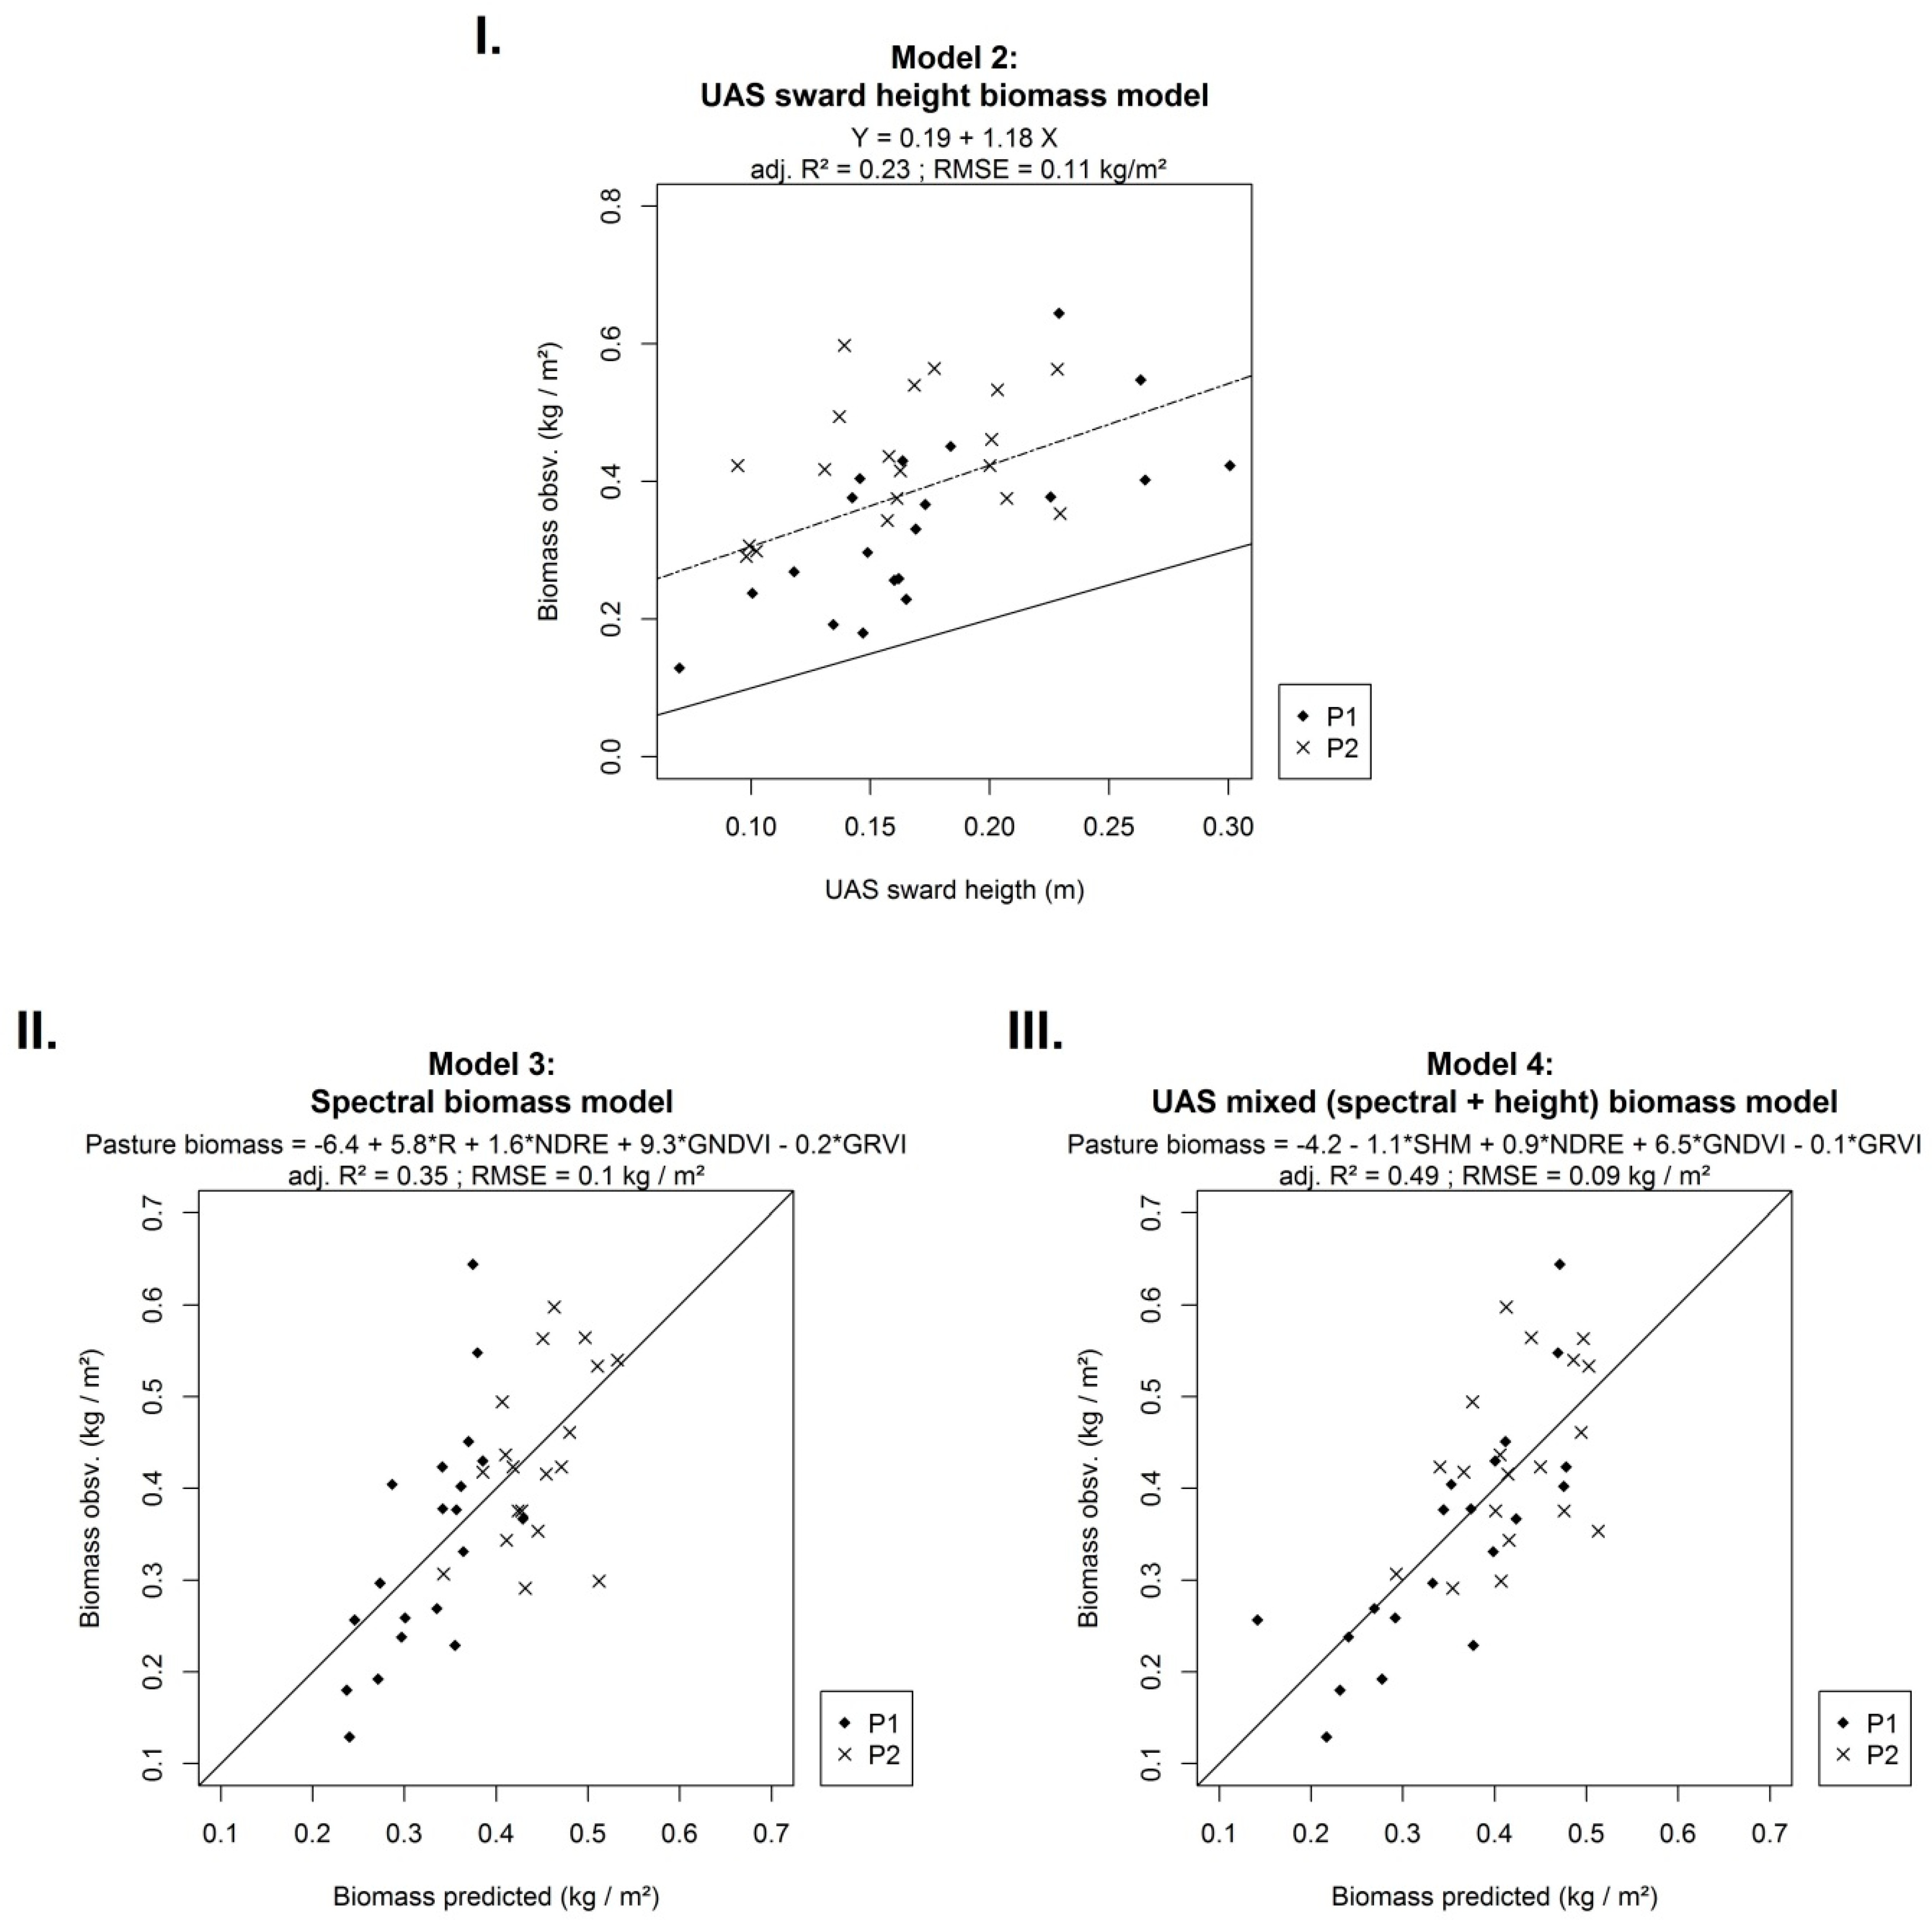
3.2. Modeling Biomass of Pasture with UAS Imagery

The quality of the fitted pasture biomass models (Figure 4) presented adjusted R2 values ranging from 0.23 (Model 2) to 0.49 (Model 4) with a RMSE of ca. 0.1 kg/m2. These results also show that the spectral information provided by the UAS imagery was meaningful, as the spectral biomass model (Model 3) displayed better performance than the UAS sward height biomass model (Model 2). The complementarity of spectral information and sward height information provided by UAS in the mixed model (Model 4) was also highlighted, as Model 4 had the best performance (adj. R2 = 0.49, R2 = 0.62). Despite the complementarity of the UAS height and the UAS spectral information, 45% of the variance of the mixed biomass model (Model 4) is associated with the UAS height (Table 3). The results of the cross validation (found in Appendix A) highlighted a similar performance for all of the pasture biomass UAS models.

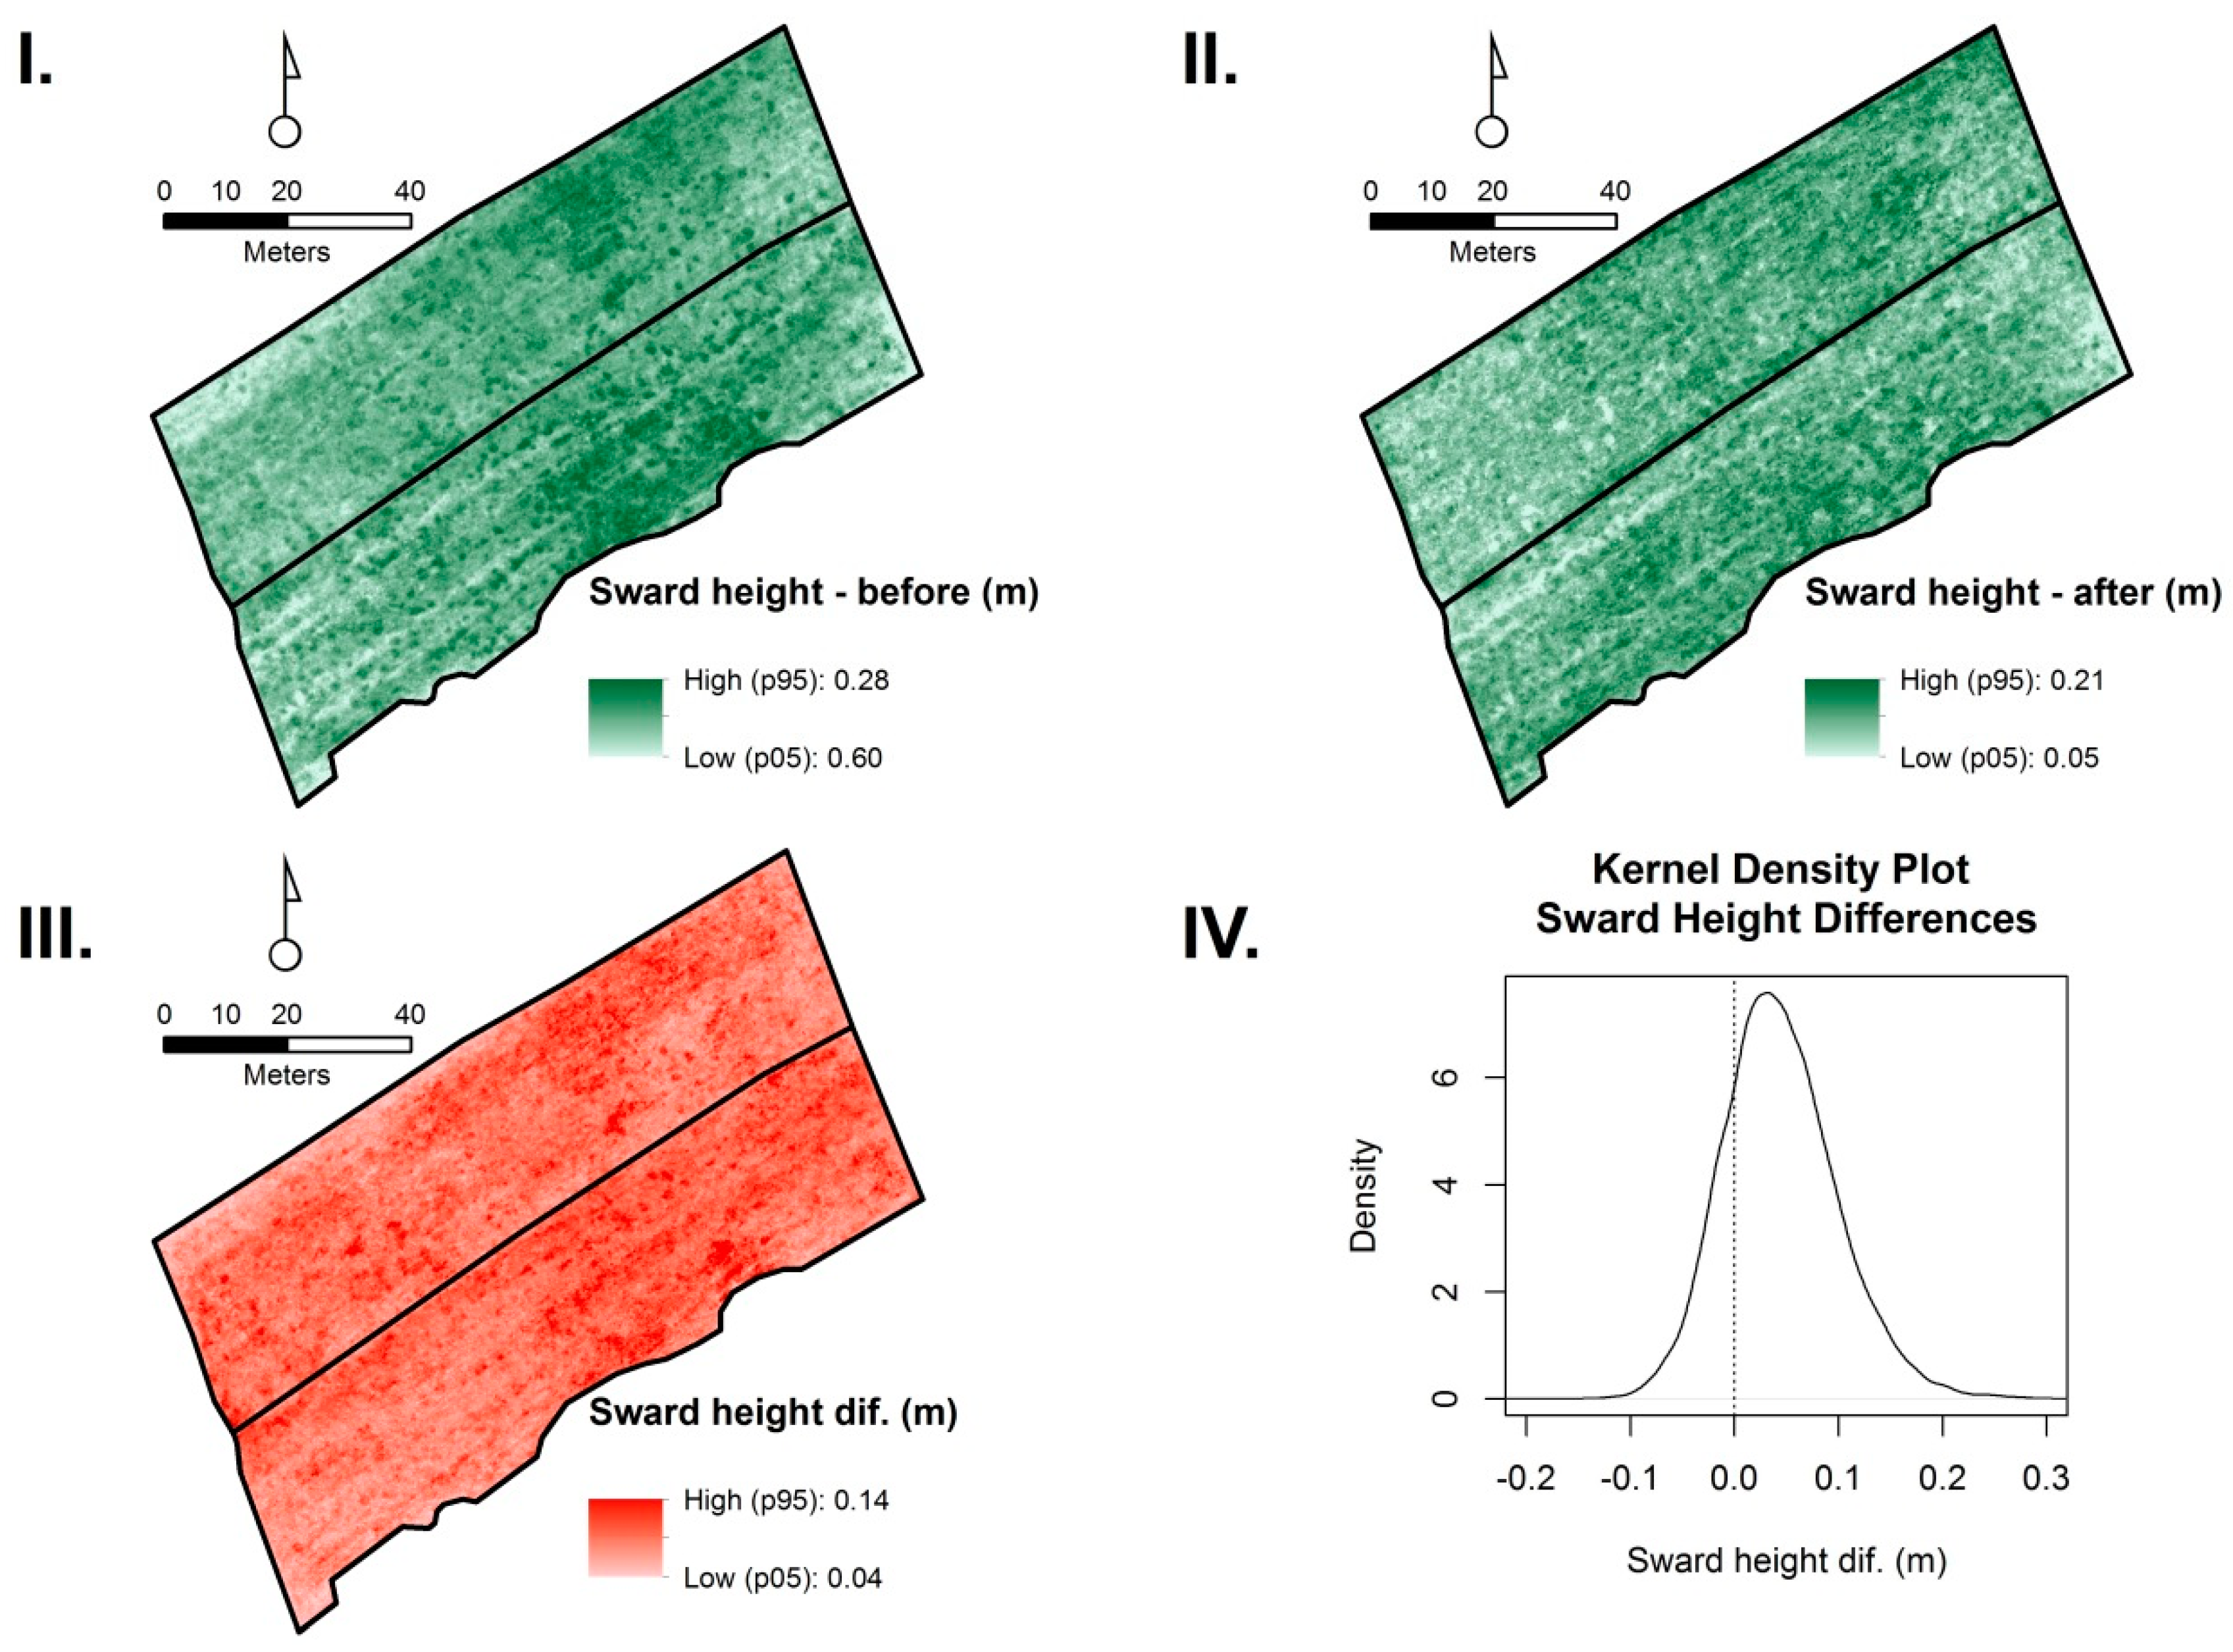
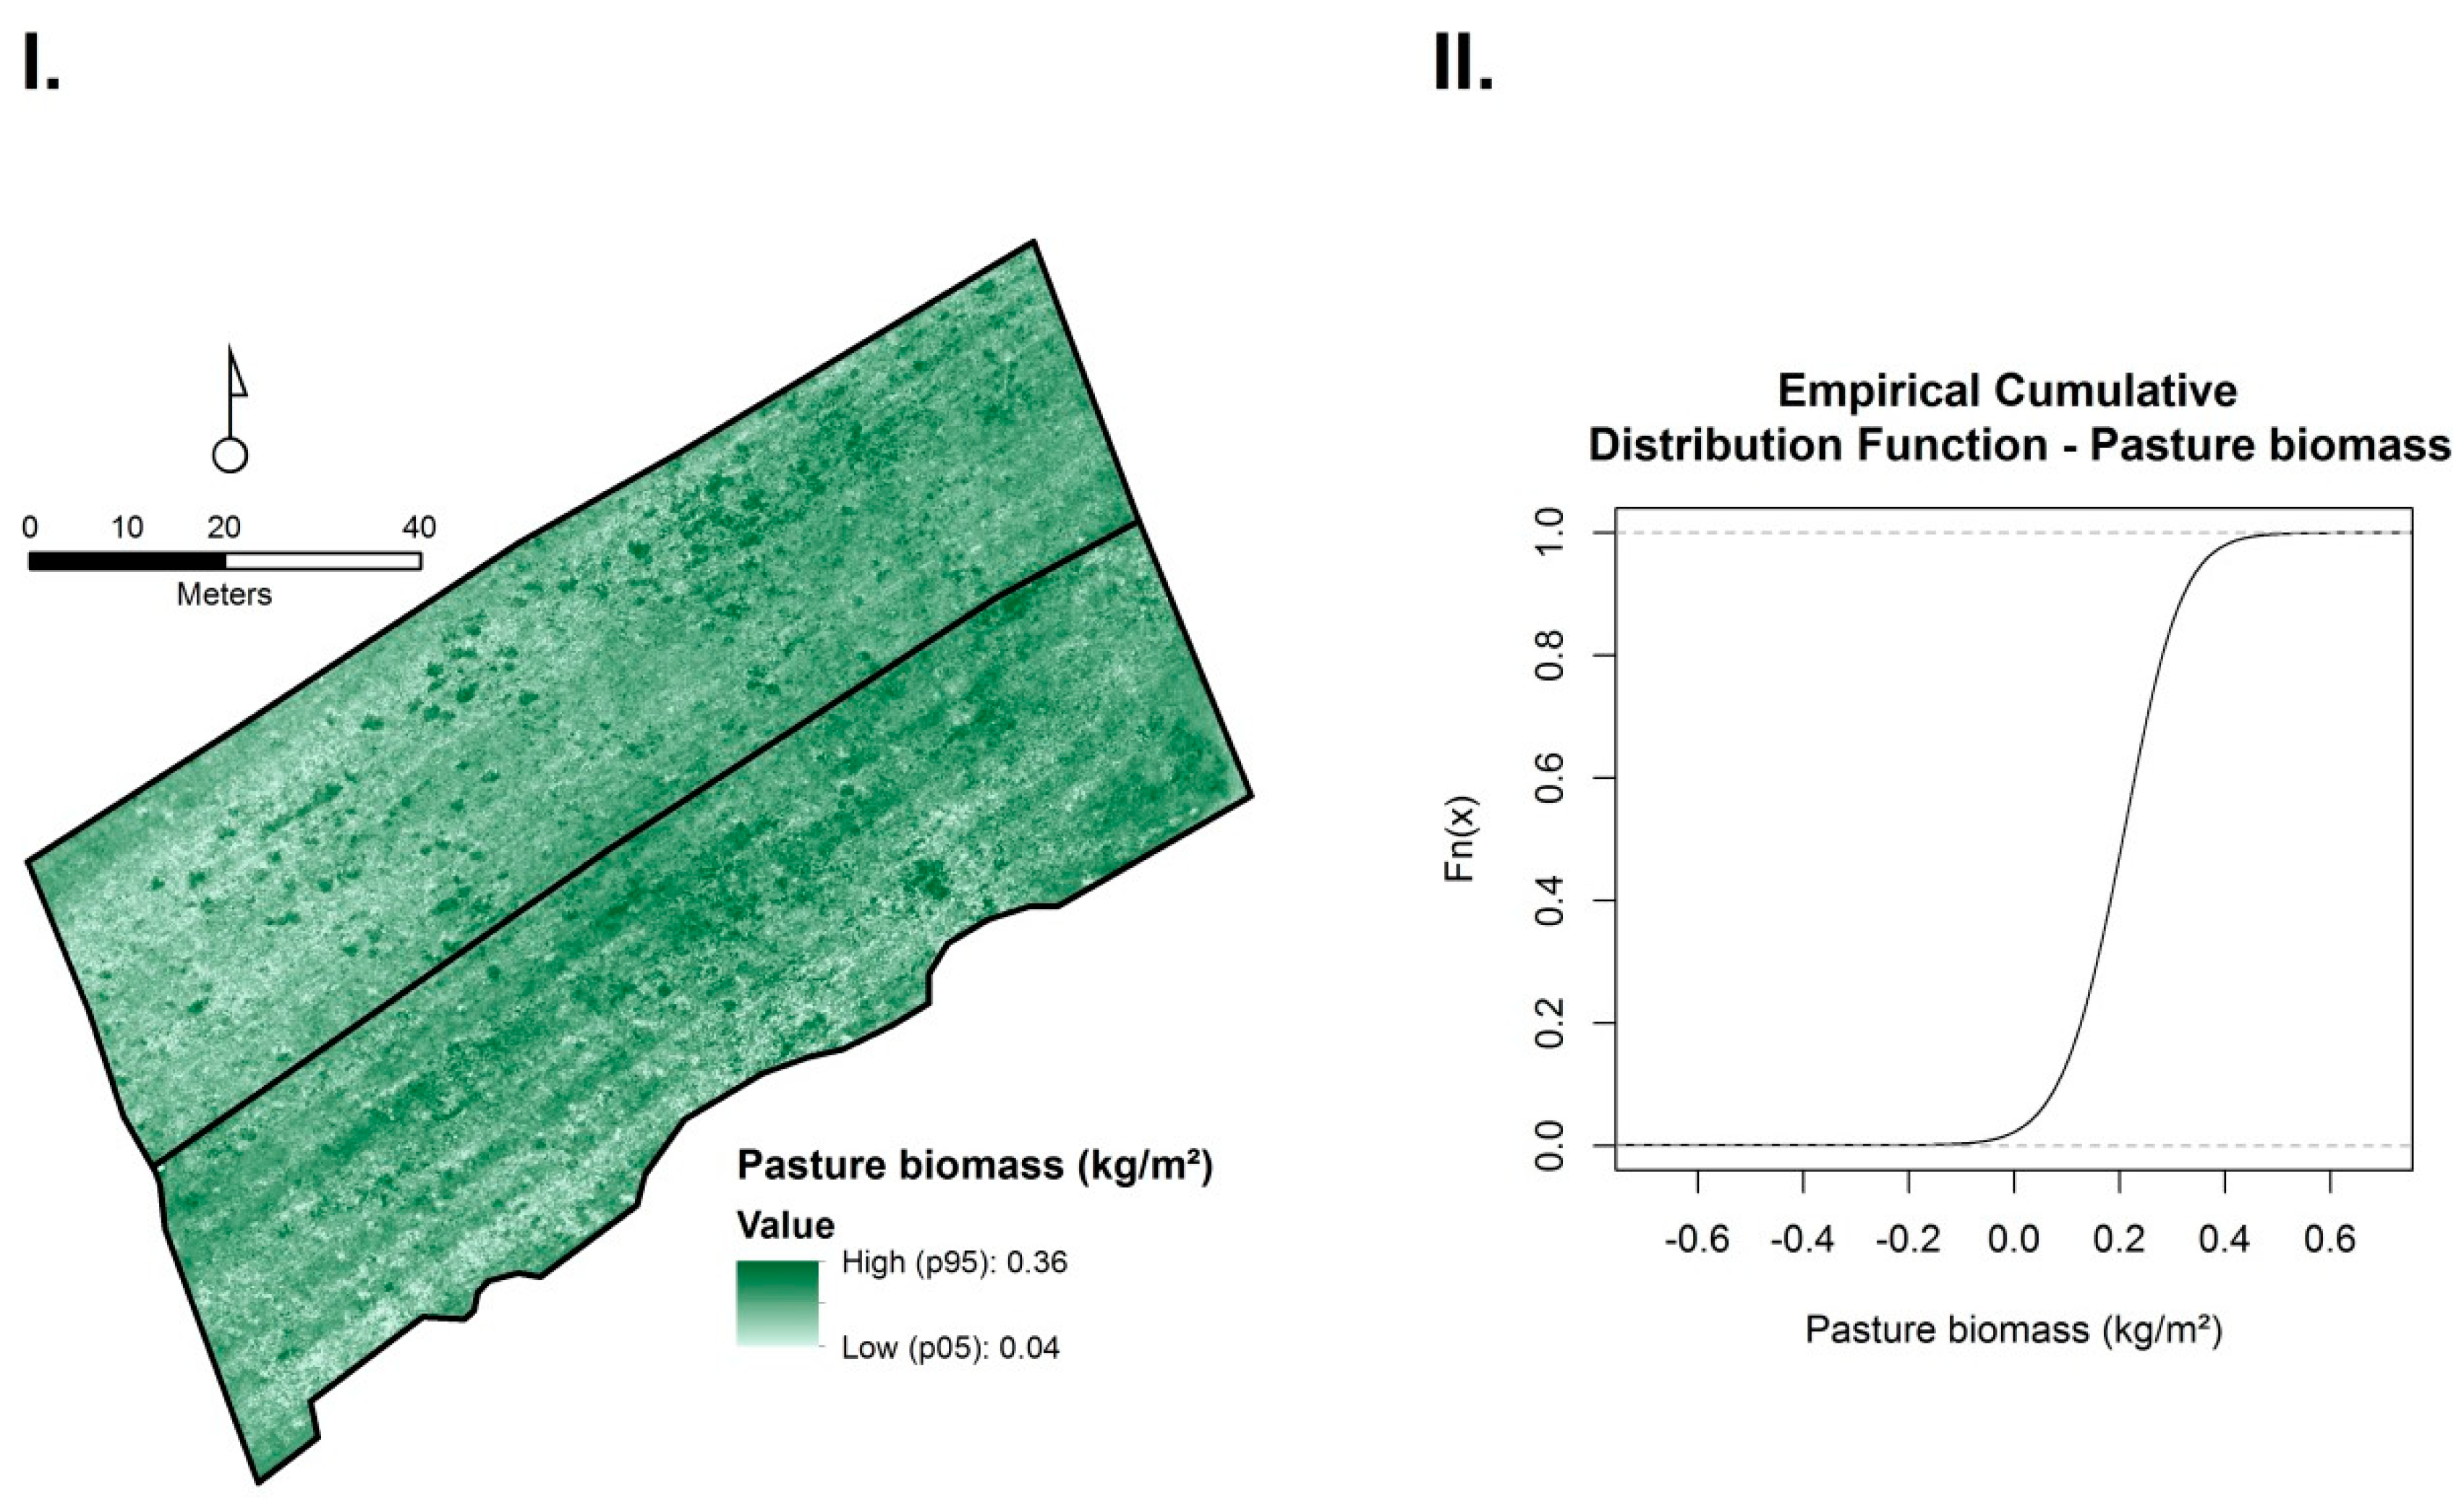
3.3. Mapping Sward Height Differences and Biomass with UAS

The maps of the UAS sward height before and after grazing (Figure 5I,II) presented interesting spatial patterns with a clearly distinguishable area with higher values in the center of the study site in the ‘before grazing’ height map (Figure 5I). The combination of sward height maps ‘before’ and ‘after’ grazing allowed for the computation of a sward height differences map (Figure 5III). Considering the distribution represented in the density curve (Figure 5IV), it can be seen that most of the study site was grazed or trampled as the peak was associated with positive values. The area with a higher sward height valued in the ‘before’ map (Figure 5I), located in the center of the area, was more intensively grazed or trampled.
Figure 6 allowed us to visualize the spatial pattern of the pasture biomass and its heterogeneity at a very fine scale. This map was produced through the use of Model 4 applied to the associated UAS variables (i.e., UAS sward height, GRVI, GNDVI, and NDRE). The northwestern part of the study site presented lower biomass values. Some abnormal values were shown on the empirical cumulative distribution function (ECDF) plot (Figure 6II) that were well above the usual averages observed for such pastures or were even negative. Nevertheless, these values can be considered as noise when considering that the 5th and 95th percentiles of the predicted (and mapped) pasture biomass values were 0.04 kg/m2 and 0.36 kg/m2, respectively.

4. Discussion

4.1. Modeling Biomass of Pasture with UAS Imagery

The performance (adj. R2 = 0.49) of the best performing UAS-based biomass model (Model 4) was similar to the state-of-art field pasture biomass non-destructive monitoring tools for swards—turf grasses such as the rising plate meter [42,43]. There are still very few references for the application of UAS imagery products to pasture biomass modeling on such intensively managed pastures with rather low pasture heights. Lee et al. [26] achieved a better model performance (R2 = 0.77) than this study, but their work was performed on a multisite dataset in Korea, which had a higher diversity and more contrasting biomass values. In contrast, Rowbottom [44], in a comparison between the rising plate meter (RPM) height and UAS as monitoring tools for pasture biomass, reached a lower modeling quality with the UAS imagery than with the RPM height. It is worth noting that this last study only used spectral information from a consumer grade digital camera and that their results in terms of variance explanation were similar to the ones found for the spectral biomass model in this study (Figure 4, Model 3). Our approach, which used both sward height and spectral information, allowed us to take advantage of a top canopy parameter (sward height) and subcanopy parameters, reflecting the activity of the swards over most of their depths (spectral data).

4.2. Mapping Sward Height Differences and Biomass with UAS

Our approach highlights pasture biomass spatial heterogeneity, which cannot be easily captured using classical pasture field monitoring tools for research or grazing management purposes. Capturing this spatial heterogeneity is essential as it plays a crucial role in animal grazing behavior and the selection of feeding stations across a given area.
The mapping of sward height and sward height differences at such a fine spatial resolution scale are essential to accommodate the full potential of virtual fencing, and they could give new perspectives to more traditional grazing management, such as the quick response to the adaptation of grazing schedules, provided that adequate automated data acquisition and treatment applications and decision support tools are developed for farmers.

4.3. Operational Recommendation

Considering the targeted spatial resolution of the UAS products and the scale of the study site (2 × 2000 m2 plots), the choice of an octocopter seemed to be appropriate and is recommended for potential users of the developed approach. The use of fixed-wing UAS would induce higher and faster flights, with a negative impact on the spatial resolution of the UAS imagery and the quality of the 3D reconstruction. Moreover, the relatively low shutter speed of multispectral sensors (1/500 for the multispectral sensors of the Parrot Sequoia) can induce blurry images if acquired at higher flight speeds (>12 m.s−1 at 50 m above ground level for the Parrot Sequoia).
Our study leveraged the height information provided by the combination of photogrammetric DSM and a LiDAR digital terrain model acquired on a regional scale by public administration. The availability of aerial LiDAR for an entire region/country is becoming quite common in Western Europe, but is still rare in other parts of the world. As an alternative, a UAS flight survey after an early mowing of studied pastures before growing could produce a reference initial digital surface model, which could then be used to normalize the DSM acquired later. Moreover, the computation of a high resolution photogrammetric DSM requires a long computational time and more specific photogrammetric expertise. Although these elements could reduce the replication of our approach in diverse contexts, they can be circumvented by the use of UAS LiDAR. Bringing a LiDAR sensor onboard would allow the direct production of a height model while decreasing the computing time and error in terms of sward height estimation. The cost of such an UAS LiDAR approach is still prohibitive for many, but one can assume that prices will drop in the near future.
The regression models proposed in our study must be calibrated if used in different contexts (species, season, stocking rates, etc.). Nonetheless, they still represent a valuable improvement compared to the use of state-of-art field approaches regarding model performance and the production of high resolution maps.

5. Conclusions

Our results demonstrate the potential of UAS imagery to be used as a tool for precision grazing study applications. The best performing pasture biomass model combined UAS sward height information with UAS vegetation indices. The quality of the fitted models (sward height or biomass) using UAS imagery opens up a new area of research in precision grazing. The UAS approach of height and biomass monitoring was revealed to be a potential alternative to more conventional time-consuming field methods. In addition, the quality of the models based on UAS imagery, UAS spectral information, and 3D imagery can be used to derive sward height differences and biomass maps at a very fine spatial scale. Considering the versatility of the UAS, future research should integrate pasture monitoring at a very fine spatial scale using denser time series at a sub-daily (even hourly) scale. As the products of UAS imagery are georeferenced precisely, they can be compared with other types of spatial information to monitor the grazing of single individuals. This study also demonstrated that 3D information (sward height) derived from the UASs could be useful for pasture biomass modeling. Even if it requires additional photogrammetric skills, UAS 3D information is a direct product of the photogrammetric process used to obtain the spectral orthoimages. The use of UAS 3D data should be promoted in further studies, as this information has been used relatively less often in agricultural studies, while other research fields, such as forestry, have been evaluating its use quite extensively. The use of other modeling approaches, such as mechanist models, could further improve the reliability of predicted and mapped pasture biomass results.
In terms of grazing behavior research, our approach could be combined with information provided by motion capture collars, such as those described by Andriamandroso et al. [45]. Regarding the very fine spatial scale of the UAS products, attention must be paid to the quality of the positioning associated with the information to which it is compared. The recent arrival on the market of low-cost centimetric precision GPS and inertial measurement units will soon allow for the development of new motion capture systems, which combined with UAS imagery, will provide new research opportunities in terms of precision grazing and the characterization of grazing animal behavior.

Author Contributions

Conceptualization, A.M. and J.B.; Data curation, A.M., S.B., A.A.L.H.A., Y.B., E.C.M., and J.B.; Supervision, P.L.; Writing—original draft, A.M. and J.B.; Writing—review & editing, A.M., S.B., A.A.L.H.A., Y.B., E.C.M., F.L., and J.B.

Funding

This research received no external funding.

Acknowledgments

The authors would like to thank the ‘drone’ team who performed the UAS flight surveys (particularly Cédric Geerts and Samuel Quevauvillers).

Conflicts of Interest

The authors declare no conflict of interest.

Appendix A

Table A1. Repeated k-fold cross validation of the models (k = 5; repetitions = 100) mean performance metrics for the different UAS models. R-squared: coefficient of determination; RMSE: Root Mean Squared Error; MAE: Mean Absolute Error.
ReferenceR SquaredRMSEMAE
Model 10.620.040.03
Model 20.330.110.09
Model 30.400.100.08
Model 40.520.090.08

References

  1. O’Mara, F.P. The role of grasslands in food security and climate change. Ann. Bot. 2012, 110, 1263–1270. [Google Scholar] [CrossRef] [PubMed] [Green Version]
  2. Eurostat Farm Structure Statistics—Statistics Explained. Available online: http://ec.europa.eu/eurostat/statistics-explained/index.php/Farm_structure_statistics (accessed on 1 December 2017).
  3. Dillon, P.; Roche, J.; Shalloo, L.; Horan, B. Optimising financial return from grazing in temperate pastures. In Proceedings of the Satellite Workshop of the XXth International Grassland Congress, Cork, Ireland, July 2005; pp. 131–147. [Google Scholar] [CrossRef]
  4. Burow, E.; Rousing, T.; Thomsen, P.; Otten, N.D.; Sørensen, J. Effect of grazing on the cow welfare of dairy herds evaluated by a multidimensional welfare index. Animal 2013, 7, 834–842. [Google Scholar] [CrossRef] [PubMed]
  5. Boval, M.; Dixon, R. The importance of grasslands for animal production and other functions: A review on management and methodological progress in the tropics. Animal 2012, 6, 748–762. [Google Scholar] [CrossRef] [PubMed]
  6. Dumortier, P.; Aubinet, M.; Beckers, Y.; Chopin, H.; Debacq, A.; de la Motte, L.G.; Jérôme, E.; Wilmus, F.; Heinesch, B. Methane balance of an intensively grazed pasture and estimation of the enteric methane emissions from cattle. Agric. For. Meteorol. 2017, 232, 527–535. [Google Scholar] [CrossRef]
  7. Holechek, J.L.; Pieper, R.D.; Herbel, C.H. Range Management. Principles and Practices; Prentice-Hall: Upper Saddle River, NJ, USA, 1989. [Google Scholar]
  8. Andriamandroso, A.L.H.; Bindelle, J.; Mercatoris, B.; Lebeau, F. A review on the use of sensors to monitor cattle jaw movements and behavior when grazing. BASE 2016, 20, 273–286. [Google Scholar]
  9. Debauche, O.; Mahmoudi, S.; Andriamandroso, A.L.H.; Manneback, P.; Bindelle, J.; Lebeau, F. Web-based cattle behavior service for researchers based on the smartphone inertial central. Procedia Comput. Sci. 2017, 110, 110–116. [Google Scholar] [CrossRef]
  10. Laca, E.A. Precision livestock production: Tools and concepts. Rev. Bras. Zootec. 2009, 38, 123–132. [Google Scholar] [CrossRef]
  11. Larson-Praplan, S.; George, M.; Buckhouse, J.; Laca, E. Spatial and temporal domains of scale of grazing cattle. Anim. Prod. Sci. 2015, 55, 284–297. [Google Scholar] [CrossRef]
  12. French, P.; O’Brien, B.; Shalloo, L. Development and adoption of new technologies to increase the efficiency and sustainability of pasture-based systems. Anim. Prod. Sci. 2015, 55, 931–935. [Google Scholar] [CrossRef]
  13. Schellberg, J.; Verbruggen, E. Frontiers and perspectives on research strategies in grassland technology. Crop Pasture Sci. 2014, 65, 508–523. [Google Scholar] [CrossRef]
  14. Andriamandroso, A.; Castro Muñoz, E.; Blaise, Y.; Bindelle, J.; Lebeau, F. Differentiating pre-and post-grazing pasture heights using a 3D camera: A prospective approach. Precis. Livest. Farming ‘17 2017, 238–246. [Google Scholar]
  15. Van Evert, F.; Polder, G.; Van Der Heijden, G.; Kempenaar, C.; Lotz, L. Real-time vision-based detection of Rumex obtusifolius in grassland. Weed Res. 2009, 49, 164–174. [Google Scholar] [CrossRef]
  16. Handcock, R.N.; Swain, D.L.; Bishop-Hurley, G.J.; Patison, K.P.; Wark, T.; Valencia, P.; Corke, P.; O’Neill, C.J. Monitoring animal behaviour and environmental interactions using wireless sensor networks, GPS collars and satellite remote sensing. Sensors 2009, 9, 3586–3603. [Google Scholar] [CrossRef] [PubMed]
  17. Tilly, N.; Hoffmeister, D.; Cao, Q.; Huang, S.; Lenz-Wiedemann, V.; Miao, Y.; Bareth, G. Multitemporal crop surface models: Accurate plant height measurement and biomass estimation with terrestrial laser scanning in paddy rice. J. Appl. Remote Sens. 2014, 8, 083671. [Google Scholar] [CrossRef]
  18. Schaefer, M.T.; Lamb, D.W. A combination of plant NDVI and LiDAR measurements improve the estimation of pasture biomass in tall fescue (Festuca arundinacea var. Fletcher). Remote Sens. 2016, 8, 109. [Google Scholar] [CrossRef]
  19. Michez, A.; Piégay, H.; Lisein, J.; Claessens, H.; Lejeune, P. Classification of riparian forest species and health condition using multi-temporal and hyperspatial imagery from unmanned aerial system. Environ. Monit. Assess. 2016, 188, 146. [Google Scholar] [CrossRef] [PubMed]
  20. Vermeulen, C.; Lejeune, P.; Lisein, J.; Sawadogo, P.; Bouché, P. Unmanned Aerial Survey of Elephants. PLoS ONE 2013, 8, e54700. [Google Scholar] [CrossRef] [PubMed]
  21. Michez, A.; Piégay, H.; Jonathan, L.; Claessens, H.; Lejeune, P. Mapping of riparian invasive species with supervised classification of Unmanned Aerial System (UAS) imagery. Int. J. Appl. Earth Obs. Geoinf. 2016, 44, 88–94. [Google Scholar] [CrossRef]
  22. Zhang, C.; Kovacs, J.M. The application of small unmanned aerial systems for precision agriculture: A review. Precis. Agric. 2012, 13, 693–712. [Google Scholar] [CrossRef]
  23. Michez, A.; Bauwens, S.; Brostaux, Y.; Hiel, M.-P.; Garré, S.; Lejeune, P.; Dumont, B. How Far Can Consumer-Grade UAV RGB Imagery Describe Crop Production? A 3D and Multitemporal Modeling Approach Applied to Zea mays. Remote Sens. 2018, 10, 1798. [Google Scholar] [CrossRef]
  24. Lopez-Granados, F. Weed detection for site-specific weed management: Mapping and real-time approaches. Weed Res. 2011, 51, 1–11. [Google Scholar] [CrossRef]
  25. Yang, G.; Liu, J.; Zhao, C.; Li, Z.; Huang, Y.; Yu, H.; Xu, B.; Yang, X.; Zhu, D.; Zhang, X.; et al. Unmanned Aerial Vehicle Remote Sensing for Field-Based Crop Phenotyping: Current Status and Perspectives. Front. Plant Sci. 2017, 8, 1111. [Google Scholar] [CrossRef] [PubMed]
  26. Lee, H.; Lee, H.-J.; Jung, J.-S.; Ko, H.-J. Mapping Herbage Biomass on a Hill Pasture using a Digital Camera with an Unmanned Aerial Vehicle System. J. Korean Soc. Grassl. Forage Sci. 2015, 35, 225–231. [Google Scholar] [CrossRef]
  27. Lee, H.; Lee, H.; Go, H. Estimating the spatial distribution of Rumex acetosella L. on hill pasture using UAV monitoring system and digital camera. J. Korean Soc. Grassl. Forage Sci. 2016, 36, 365–369. [Google Scholar] [CrossRef]
  28. Westoby, M.J.; Brasington, J.; Glasser, N.F.; Hambrey, M.J.; Reynolds, J.M. “Structure-from-Motion” photogrammetry: A low-cost, effective tool for geoscience applications. Geomorphology 2012, 179, 300–314. [Google Scholar] [CrossRef]
  29. Bareth, G.; Bolten, A.; Hollberg, J.; Aasen, H.; Burkart, A.; Schellberg, J. Feasibility study of using non-calibrated UAV-based RGB imagery for grassland monitoring: Case study at the Rengen Long-term Grassland Experiment (RGE), Germany. DGPF Tagungsband 2015, 24, 1–7. [Google Scholar]
  30. Viljanen, N.; Honkavaara, E.; Näsi, R.; Hakala, T.; Niemeläinen, O.; Kaivosoja, J. A Novel Machine Learning Method for Estimating Biomass of Grass Swards Using a Photogrammetric Canopy Height Model, Images and Vegetation Indices Captured by a Drone. Agriculture 2018, 8, 70. [Google Scholar] [CrossRef]
  31. Da Trindade, J.K.; Pinto, C.E.; Neves, F.P.; Mezzalira, J.C.; Bremm, C.; Genro, T.C.; Tischler, M.R.; Nabinger, C.; Gonda, H.L.; Carvalho, P.C. Forage allowance as a target of grazing management: Implications on grazing time and forage searching. Rangel. Ecol. Manag. 2012, 65, 382–393. [Google Scholar] [CrossRef]
  32. James, M.R.; Robson, S.; d’Oleire-Oltmanns, S.; Niethammer, U. Optimising UAV topographic surveys processed with structure-from-motion: Ground control quality, quantity and bundle adjustment. Geomorphology 2017, 280, 51–66. [Google Scholar] [CrossRef]
  33. Javernick, L.; Brasington, J.; Caruso, B. Modeling the topography of shallow braided rivers using Structure-from-Motion photogrammetry. Geomorphology 2014, 213, 166–182. [Google Scholar] [CrossRef]
  34. Gonçalves, J.; Henriques, R. UAV photogrammetry for topographic monitoring of coastal areas. ISPRS J. Photogramm. Remote Sens. 2015, 104, 101–111. [Google Scholar] [CrossRef]
  35. Rouse, J., Jr.; Haas, R.; Schell, J.; Deering, D. Monitoring Vegetation Systems in the Great Plains with ERTS. 1974. Available online: http://adsabs.harvard.edu/abs/1974NASSP.351..309R (accessed on 24 January 2019).
  36. Barnes, E.; Clarke, T.; Richards, S.; Colaizzi, P.; Haberland, J.; Kostrzewski, M.; Waller, P.; Choi, C.; Riley, E.; Thompson, T.; et al. Coincident detection of crop water stress, nitrogen status and canopy density using ground based multispectral data. In Proceedings of the Fifth International Conference on Precision Agriculture, Bloomington, MN, USA, 16–19 July 2000; Volume 1619. [Google Scholar]
  37. Moges, S.; Raun, W.; Mullen, R.; Freeman, K.; Johnson, G.; Solie, J. Evaluation of green, red, and near infrared bands for predicting winter wheat biomass, nitrogen uptake, and final grain yield. J. Plant Nutr. 2005, 27, 1431–1441. [Google Scholar] [CrossRef]
  38. Sripada, R.P.; Heiniger, R.W.; White, J.G.; Meijer, A.D. Aerial Color Infrared Photography for Determining Early In-Season Nitrogen Requirements in Corn. Agron. J. 2006, 98, 968–977. [Google Scholar] [CrossRef]
  39. Akaike, H. Maximum likelihood identification of Gaussian autoregressive moving average models. Biometrika 1973, 60, 255–265. [Google Scholar] [CrossRef]
  40. Venables, W.N.; Ripley, B.D. Modern Applied Statistics with S, 4th ed.; Springer: New York, NY, USA, 2002. [Google Scholar]
  41. Lindeman, R.; Merenda, P.; Gold, R. Introduction to Bivariate and Multivariate Analysis; Foresman and Co.: London, UK, 1980. [Google Scholar]
  42. Harmoney, K.R.; Moore, K.J.; George, J.R.; Brummer, E.C.; Russell, J.R. Determination of pasture biomass using four indirect methods. Agron. J. 1997, 89, 665–672. [Google Scholar] [CrossRef]
  43. Laca, E.A.; Demment, M.W.; Winckel, J.; Kie, J.G. Comparison of weight estimate and rising-plate meter methods to measure herbage mass of a mountain meadow. J. Range Manag. 1989, 42, 71–75. [Google Scholar] [CrossRef]
  44. Rowbottom, M. Potential of Unmanned Aerial Vehicles (UAV) and Remote Sensing to Accurately Estimatepasture Biomass in Intensively Grazed Dairy Pastures; School of Earth and Environment, University of Western Australia: Perth, Australia, 2015. [Google Scholar]
  45. Andriamandroso, A.L.H.; Lebeau, F.; Beckers, Y.; Froidmont, E.; Dufrasne, I.; Heinesch, B.; Dumortier, P.; Blanchy, G.; Blaise, Y.; Bindelle, J. Development of an open-source algorithm based on inertial measurement units (IMU) of a smartphone to detect cattle grass intake and ruminating behaviors. Comput. Electron. Agric. 2017, 139, 126–137. [Google Scholar] [CrossRef] [Green Version]
Figure 1. Study site location in Belgium (Western Europe) and locations of the field measurements (biomass sampling and terrestrial LiDAR scans)). P1 and P2 were grazed for two consecutive days.
Remotesensing 11 00473 g001
Figure 2. Sampling scheme for the UAS sward height model (SHM) validation with the LiDAR sward height model. The SHMs were compared within a circular area of interest (2 m < radius < 5 m), following a 0.5 m square grid.
Remotesensing 11 00473 g002
Figure 3. The linear regression (Model 1) between the reference sward height data (LiDAR) and UAS sward height data had good agreement between the two methods. The dashed line represents the fitted model and the solid line represents the 1:1 line (i.e., x = y).
Remotesensing 11 00473 g003
Figure 4. Comparison of different approaches of pasture biomass modeling with UAS. The Model 2 (I) is a biomass model based on UAS height. Model 3 (II) and Model 4 (III) are multilinear models using UAS spectral data (Model 3) and a combination of UAS spectral and height data (Model 4). For Model 2, the dashed lines represent the fitted models. The solid lines represent the 1:1 lines (i.e., x = y).
Remotesensing 11 00473 g004
Figure 5. Sward height before (I) and after (II) cattle grazing, sward height differences (III) (sward height ‘before’ minus sward height ‘after’) and associated Kernel density plot (IV). The majority of the pixel values were associated with positive values (intakes or trampling by cattle).
Remotesensing 11 00473 g005
Figure 6. Mapping pasture biomass before grazing using predictors of the best model (Model 4) within pastures P1 and P2 (I) and the empirical cumulative distribution function (ECDF) plot of the UAS pasture biomass values (II).
Remotesensing 11 00473 g006
Table 1. Vegetation indices computed from the reflectance layers provided by the multispectral camera.
Vegetation IndexFormulaParameterReference
Normalized Difference Vegetation Index (NDVI)(NIR − RED)/(NIR + RED)Photosynthetic activity, plant stress[35]
Normalized Difference Red Edge (NDRE)(NIR − REDEDGE)/(NIR + REDEDGE)Chlorophyll and nitrogen content[36]
Green NDVI (GNDVI)(NIR − GREEN)/(NIR + GREEN)More sensitive to chlorophyll-a concentration, monitoring of plant stress[37]
Green Ratio Vegetation Index (GRVI)NIR/GREENPhotosynthetic activity[38]
Table 2. Variables extracted from the UAS imagery.
NameTypeGround Sampling Distance of the Layer (m)Sensor
NDVIVegetation index (VI)0.05Multispectral (Sequoia)
NDREVegetation index (VI)0.05Multispectral (Sequoia)
GNDVIVegetation index (VI)0.05Multispectral (Sequoia)
GRVIVegetation index (VI)0.05Multispectral (Sequoia)
Red (R)Reflectance0.05Multispectral (Sequoia)
Green (G)Reflectance0.05Multispectral (Sequoia)
Near Infra-Red (NIR)Reflectance0.05Multispectral (Sequoia)
Red-Edge (RE)Reflectance0.05Multispectral (Sequoia)
Sward Height Model (SHM)3D0.025RGB (Sony RX100)
Table 3. Relative importance (% of R2), estimates of coefficients, and p-values of the fitted linear model with the selected variables computed for Model 4, which combines the UAS sward height and UAS spectral data.
Rel. Importance (%)Regression CoefficientsPr (>|t|)
UAS height (SHM)451.10.00105**
GRVI27−0.10.00139**
GNDVI176.50.01162*
NDRE110.80.04675*
Intercept/−4.20.01725*

