Integration of Multiple Spectral Indices and a Neural Network for Burned Area Mapping Based on MODIS Data


1
State Key Laboratory of Fire Science, University of Science and Technology of China, Jinzhai 96, Hefei 2300026, China
2
Department of Civil and Architectural Engineering, City University of Hong Kong, Tat Chee Avenue, Kowloon, Hong Kong
3
College of Ocean Science and Engineering, Shanghai Maritime University, Haigang Ave 1550, Shanghai 201306, China
*
Author to whom correspondence should be addressed.
Remote Sens. 2019, 11(3), 326; https://doi.org/10.3390/rs11030326
Submission received: 25 December 2018
/
Revised: 31 January 2019
/
Accepted: 2 February 2019
/
Published: 6 February 2019
Abstract
:Since wildfires have occurred frequently in recent years, accurate burned area mapping is required for wildfire severity assessment and burned land reconstruction. Satellite remote sensing is an effective technology that can provide valuable information for wildfire assessment. However, the common approaches based on using a single satellite image to promptly detect the burned areas have low accuracy and limited applicability. This paper develops a new burned area mapping method that surpasses the detection accuracy of previous methods, while still using a single Moderate Resolution Imaging Spectroradiometer (MODIS) sensor image. The key innovation is integrating optimal spectral indices and a neural network algorithm. We used the traditional empirical formula method, multi-threshold method and visual interpretation method to extract the sample sets of five typical types (burned area, vegetation, cloud, bare soil, and cloud shadow) from the MODIS data of several wildfires in the American states of Nevada, Washington and California in 2016. Afterward, the separability index M was adopted to assess the capacity of seven spectral bands and 13 spectral indices to distinguish the burned area from four unburned land cover types. Based on the separability analysis between the burned area and unburned areas, the spectral indices with an M value higher than 1.0 were employed to generate the training sample sets that were assessed to have an overall accuracy of 98.68% and Kappa coefficient of 97.46%. Finally, we utilized a back-propagation neural network (BPNN) to learn the spectral differences of different types from the training sample sets and obtain the output burned area map. The proposed method was applied to three wildfire cases in the American states of Idaho, Nevada and Oregon in 2017. A comparison of detection results between the new MODIS-based burned area map and the reference burned area map compiled from Landsat-8 Operational Land Imager (OLI) data indicates that the proposed method can effectively exploit the spectral characteristics of various land cover types. Also, this new method can achieve higher accuracy with the reduction of commission error (CE, >10%) and omission error (OE, >6%) compared to the traditional empirical formula method. The new burned area mapping method could help managers and the public perform more effective wildfire assessments and emergency management.
1. Introduction
Wildfires have occurred frequently throughout the world in the past few decades. This type of natural disaster has a serious impact on the ecological system and human lives. Fire also plays an important role in ecosystem succession [1], global carbon budget [2], climate cycles [3], and land cover change [4]. Since wildfires ruin the terrestrial vegetation layer, accurate burned area mapping is essential for disaster assessment, burned landscape management and vegetation recovery [5,6,7]. In recent years, the topic has become a research hotspot because of its important practical significance.
The rapid development of satellite remote sensing technology provides an excellent chance to make full use of the advantages of satellites for burned area research. In comparison to manual field measurement of a burned area after wildfires, satellite remote sensing is more convenient, safe and applicable with fast response capability. So far, the satellite sensors applied to burned area research mainly consist of the VEGETATION (VEG) [8,9,10], Advanced Very High Resolution Radiometer (AVHRR) [2,11,12,13,14,15], Moderate Resolution Imaging Spectroradiometer (MODIS) [1,16,17,18,19], Advanced Spaceborne Thermal Emission and Reflection Radiometer (ASTER) [20,21,22], Visible Infrared Imaging Radiometer Suite (VIIRS) [7], Thematic Mapper (TM) [5,23,24], Enhanced Thematic Mapper plus (ETM+) [24,25,26,27], and Operational Land Imager (OLI) [28]. Besides, the availability of Synthetic Aperture Radar (SAR) for burned area mapping has also been investigated [25,29,30]. Among the satellite sensors, MODIS sensors onboard Terra and Aqua satellites have 36 spectral bands that cover from the visible region (0.4 μm) to the thermal infrared region (TIR, 14.4 μm) [31]. Moreover, the sensor can provide global and daily observations so that the MODIS data contains abundant information for wildfire assessment. In particular, the complex spectral characteristics of the burned area and unburned types of land cover (hereafter simply “unburned types”) can also be obtained from the data. Therefore, the application of remote sensing technology with MODIS data for burned area mapping has been widely investigated in current research [4,19,32].
A variety of methods have been developed for burned area detection based on MODIS data. The traditional threshold-based methods were developed for wide use with a single satellite image. Li et al. [18] used false-color composition RGB images of MODIS bands 7, 5 and 6 to identify the burned area visually, and then developed an empirical formula to distinguish the burned areas from unburned areas. Methods based on multi-temporal satellite images and time series data were also proposed to evaluate the burned area. Loboda et al. [17] developed a regionally adaptable semi-automated algorithm based on the Normalized Burned Ratio differencing (dNBR) images derived from pre- and post-fire data, which adopted the MODIS Surface Reflectance 8-Day Composite product and MODIS Active Fire product to output the yearly maps of the burned area. Giglio et al. [16] proposed an algorithm that applied the dynamic thresholds to the images generated from burn-sensitive vegetation index (bsVI) and a measure of temporal texture, and cumulative active fire maps were also used to select the burned and unburned samples. Guindos-Rojas F. et al. [19] developed a Bayesian-based algorithm to detect the burned area using the MODIS 10-day products of surface reflectance and land surface temperature (LST) data for the Canary Islands’ dry woodlands and forests ecoregion. In addition, Melchiorre et al. [4] utilized the Collection 6 MODIS Global Burned Area Product (MCD64A1) of the global monthly record from 2003 to 2016 and the time series data of normalized burn ratio (NBR) to carry out a global analysis of the burned area persistence time. Ryu et al. [33] also employed the multi-temporal MODIS products of Normalized Burn Ratio (NBR), Normalized Difference Vegetation Index (NDVI) and Gross Primary Production (GPP) to monitor the burned area during the process of post-fire recovery. Furthermore, the spectral indices have been widely used to represent the spectral characteristics of the burned area, vegetation and other types. Stroppiana et al. [10,20,24,25,27], Veraverbeke et al. [22,34], and Xiao et al. [5] evaluated the capacity of spectral indices in discrimination of the burned area and unburned types based on the satellite data. These algorithms based on multi-temporal satellite data are typical and can utilize the information on changes before and after the wildfire; whereas the traditional threshold-based methods with a single satellite image need to manually extract the samples to do analysis and cannot make the best of the spectral differences between land cover types. Hence, the distinguishing capacity of the spectral bands and derived spectral indices of MODIS data to detect the burned area needs to be further explored. Also, it is necessary to develop a method that can take full advantage of the spectral differences to improve the performance of burned area mapping.
In this paper, we develop a flexible and applicable method for burned area mapping, a technique that can be applied using a single MODIS image. The sample sets of five typical types including burned area, vegetation, cloud, bare soil, and cloud shadow are extracted by the empirical formula method, multi-threshold method and visual interpretation method. Then, the spectral bands and derived spectral indices are evaluated to investigate the separability between the burned area and unburned area types. The optimal indicators with high distinguishing capacity for burned area are input into a back-propagation neural network (BPNN) to finally yield the burned area map.
2. Materials and Methods
2.1. Satellite Data
The MODIS sensors onboard Aqua and Terra satellites have high temporal resolution and rich spectral bands, which can capture abundant spectral information and data of burned areas. The MODIS Level 1B and geolocation products were acquired from Level-1 and Atmosphere Archive & Distribution System (LAADS) Distributed Active Archive Center (DAAC) [35] and our Remote Sensing Laboratory (location in Hefei, China), which can receive the daily MODIS data as well as subsequent data-processing. In addition, the Operational Land Imager (OLI) sensor onboard Landsat 8 satellite was employed as an independent reference data source to verify the accuracy of the burned area map derived from MODIS data (see Section 2.4 for the details). The OLI data over the study area was downloaded from the United States Geological Survey (USGS) EarthExplorer website [36]. The pre-fire and post-fire OLI scenes of the wildfire cases were used to generate the reference burned area maps that were utilized to validate the accuracy of the proposed method. The characteristics of the spectral bands used of MODIS and OLI sensors are shown in Table 1.
2.2. Study Area
Three large wildfires that occurred in the western United States in 2016 were used to extract the sample sets for the new method. The wildfire cases included the Hot Pot Fire (Nevada), Range 12 Fire (Washington) and Rey Fire (California). Three other American wildfires that occurred in 2017 were used to validate our method, including the Powerline Fire (Idaho), Tohakum 2 Fire (Nevada) and Cinder Butte Fire (Oregon). The geographic location of the six wildfire cases and their false-color composition RGB images of MODIS bands 7, 5 and 6 are shown in Figure 1. Serious wildfires frequently occur in this region due to the extreme climate, and this frequency underscores the urgent need for wildfire assessment and emergency management. The selected wildfire cases with the cloud-free MODIS data contribute to the implementation of the proposed method. All the MODIS images of the wildfires are from the Terra satellite. Through the comparison with MODIS/Terra Thermal Anomalies & Fire 5-Min L2 Swath 1km V006 products (MOD14 version 6 products), the wildfires in the acquisition time of MODIS data were not active. Detailed information about the wildfire cases and the acquisition time of corresponding MODIS data are presented in Table 2. The information of the fuels involved was obtained from the Incident Information System (InciWeb) [37], and the detailed information of wildfire cases was obtained from the GeoMAC website (by the Geospatial Multi-Agency Coordination Group) [38,39] and Monitoring Trends in Burn Severity (MTBS) website [40,41].
2.3. Burned Area Mapping Method
The new burned area mapping method consists of four phases: data pre-processing, extraction of sample sets, spectral characteristics analysis, and training of the BPNN. The flowchart of the proposed method is depicted in Figure 2. In the first phase, we carried out pre-processing on the MODIS Level 1B data to obtain the data of reflectance, emissivity and land surface temperature (LST). In the second phase, sample sets of five typical types (burned area, vegetation, cloud, bare soil, and cloud shadow) were extracted by the empirical formula method [18], multi-threshold method [31,42,43,44,45], and visual interpretation method [18,25,46]. Thirdly, the separability analysis of spectral bands and spectral indices between the burned area and four unburned types was investigated to find the optimal feature vectors for the input layer of the BPNN. In the last phase, training samples were used to train the BPNN and then to derive the burned area map.
2.3.1. Data Pre-Processing
The MODIS data with 1-km spatial resolution were processed by geometric correction to the map projection of transverse Mercator and to obtain the geographic location information. Then we carried out radiometric calibration [28] and atmospheric correction [47] to obtain the data of reflectance and emissivity using ENVI software. Afterward, brightness temperature (BT) and LST data were generated by the split-window algorithm [48]. Finally, the spectral indices were obtained by combining the data of reflectance, emissivity and LST.
2.3.2. Extraction of Samples Sets
The empirical formula method [18], multi-threshold method [31,42,43,44,45] and visual interpretation method [18,25,46] were used to extract the sample sets of burned area, vegetation, cloud, bare soil, and cloud shadow. The visual interpretation method is frequently used to visually identify the burned regions on MODIS images while the traditional empirical formula method has proved to be able to detect the burned area based on data analysis, so we utilized these methods to extract the samples of the burned area. Here are the detailed steps. Firstly, two rectangular boxes were used to extract the samples of the burned area and unburned types with ENVI software, as depicted in Figure 3. In the false-color composition RGB image (band 7 at 2.13 μm as red channel, band 5 at 1.24 μm as green channel, band 6 at 1.64 μm as blue channel), the dark purple region in Box 1 of Figure 3 is the burned area of the Range 12 Fire in Washington, according to the independent burned area mapping from the MTBS website. The samples of the burned area and unburned types can be extracted from Box 1, and the samples extracted from Box 2 only belong to the unburned types. Then, the relationship between the reflectance of MODIS band 5 and band 7 can be investigated using the scatter plot with the reflectance of band 7 as the independent variable and the reflectance of band 5 as the dependent variable. Because the unburned types of vegetation and soil have higher reflectance at band 5 (1.24 μm) than the burned area [18], the samples of unburned types extracted by Box 1 and Box 2 are located in the upper left of the scatter plot while the samples of the burned area extracted by Box 1 are located in the lower right (see Section 3.1 and Figure 5 for details). Finally, the traditional empirical formula method can be established to separate the samples of the burned area and unburned types. The empirical formula can be determined as the following form:
where ρ5 and ρ7 are the reflectance of band 5 (1.24 μm) and band 7 (2.13 μm) and α and β are the slope and intercept of the formula line, respectively. The samples satisfying the empirical formula are located below the line, which can be classified as the burned area. The conservative coefficients of the empirical formula can be used to ensure that the samples below the line belong to the burned area type. The samples of the burned area can be extracted using the traditional empirical formula method.
The multi-threshold method has been widely used in the detection of land cover types on the satellite images. In order to obtain the samples of unburned types, the multi-threshold method in conjunction with the visual interpretation method was employed to extract the samples of vegetation, cloud and bare soil, while the samples of cloud shadow were selected by photo-interpretation in the true-color RGB images generated from MODIS bands 1, 4 and 3 with ENVI software. The multiple threshold criteria used are shown in Table 3. The vegetation samples were extracted by the Normalized Difference Vegetation Index (NDVI) because NDVI is strongly related to the surface biomass. The cloud samples were obtained based on the cloud detection techniques proposed in the research of Stroppiana et al. [43] and Giglio et al. [44]. For the extraction of bare soil samples, the empirical thresholds [45] were applied to NDVI and the normalized reflectance ratio of band 9 and band 7. Also, water pixels that satisfy the criteria combined with band 2, band 7, NDVI and Normalized Difference Water Index (NDWI) were masked as unburned type. The formula of NDWI [49] is as follows:
2.3.3. Spectral Characteristics Analysis
The spectral characteristics analysis consists of two parts: Spectral bands analysis and spectral indices analysis to distinguish between the burned area and unburned types. The separability index M [22,24,25,31] can assess the separability between the two types, so we utilized it to analyze the capacity of the spectral band and spectral index to distinguish the burned area from unburned types. Any M value greater than 1.0 represents a superior separation between the burned and unburned type, while an M value lower than 1.0 indicates an inferior separation. The formula of separability index M is defined as follows:
where μi,b and μi,u are the mean value of burned pixels and unburned pixels respectively, and σi,b and σi,u are the standard deviations of burned pixels and unburned pixels respectively.
The spectral bands of the MODIS sensor range from the visible region to thermal infrared (TIR) region. It has been demonstrated that the near-infrared (NIR) and shortwave infrared (SWIR) region are important for burned area detection [22], so we investigated the capacity of the reflectance of MODIS bands 1–7 including the visible (band 1, 3, 4), NIR (band 2, 5) and SWIR (band 6, 7) spectral regions to discriminate the burned area from unburned types. In addition, the reflectance data that is sensitive to the burned area, as well as the emissivity and LST data, which has been proved to show high separating capacity for the burned area [22,34], were combined into the spectral indices listed in Table 4. We carried out the separability analysis of 13 spectral indices for discriminating the burned area. The spectral indices BAI, CSI, MIRBI, and NBR (burned area indices) were developed to reflect the spectral characteristics of burned land. The spectral indices NDVI, EVI, GEMI, SAVI, and bsVI are vegetation indices and were designed to show the characteristics of terrestrial biomass. For the purpose of burned area detection, the NBR-modified spectral indices (including NSEv1, NSEv2, NSTv1, and NSTv2) integrated the data of emissivity and LST in addition to the reflectance data. Based on the analysis of the spectral characteristics of the burned area and the unburned types, the optimal indicators applicable for burned area detection will be used as the feature vectors of the input layer of our BPNN.
2.3.4. Back-Propagation Neural Network
Back-propagation neural networks have been widely used for the classification of multispectral remote sensing data [58] and confirmed to be valid for smoke identification in the process of fire monitoring [31]. A BPNN can capture the nonlinear relationships between variables in complex systems [59] with low computation memory and time. In this study, a BPNN technique was utilized to learn the spectral differences between the burned area and unburned types from training samples that are generated from the optimal indicators with high distinguishing capacity for the burned area.
The BPNN framework includes the input layer, hidden layer and output layer, as visualized in Figure 4. Connections are built between the neurons of neighboring layers while no connections exist between the neurons of one common layer [58]. The input layer presents the feature information of each type to the network, and the data is computed by the hyperbolic tangent sigmoid transfer function in the hidden layer, after which the outputs of the hidden layer are computed by the linear transfer function in the output layer. The computation formulas of the activation function in the hidden layer (Equation (4)) and the activation function in the output layer (Equation (5)) are shown as follows, respectively:
In these formulas, j, i and k index the neurons of the input, hidden and output layers respectively, and r and s1 are the number of neurons in the hidden and output layers respectively. The pj are the feature vectors of the input layer. Also, ω1ij and ω2ki represent the connection weights of hidden neuron i to input neuron j and output neuron k to hidden neuron i, respectively; b1i and b2k represent the bias of hidden neuron i and output neuron k, respectively; and a1i and a2k are the outputs of hidden neuron i and output neuron k respectively. Function f1 is the hyperbolic tangent sigmoid transfer function in the hidden layer and f2 is the linear transfer function in the output layer.
The data information spreads forward from the input layer and moves through the hidden layer to the output layer while the error information propagates in reverse to update the weights and biases of neurons between layers based on the back-propagation algorithm [59,60]. The weights and biases are updated until the value of mean squared error is minimized, which demonstrates that the actual outputs of the network are maximized to approximate the target outputs. The formula of the error function is shown below:
where Er stands for the error function; k and s2 represent the output layer neurons and the number of them, respectively; a2k is the actual output of neuron k in the output layer; and tk is the target output of neuron k.
The nonlinear optimization method used in the network is the gradient descent with momentum and adaptive learning rate method, which is used to update the weights and biases. In order to apply the proposed method to a variety of wildfire cases, the local minima that approximate the global minimum are generally acceptable. The additional momentum of the gradient descent method was utilized to reduce the error and achieve the local minimum. The learning rate adjusts based on the performance of the network toward the goal in each training epoch. The learning rate will increase if the weights of the network make the value of error function decrease while it will decrease if the error increases [61]. In practice, the gradient descent with momentum and adaptive learning rate back-propagation method outperforms other optimization methods in training experiments, and it exhibits a superior convergence speed.
Training of the BPNN was implemented using MATLAB. The training sample sets of the indicators on behalf of the five typical types were used to train the BPNN until it reached the optimal performance with a low mean squared error. Finally, the trained network was applied to several wildfire cases to generate burned area maps. We adopted a threshold T for the final outputs of the output layer. The output layer pixels with output values greater than T were identified as burned pixels, whereas the pixels with output values lower than T were regarded as unburned pixels. The omission error and commission error of the final burned area map will change as the threshold T changes. If the T value is set relatively high, that is a conservative threshold, and the omission error will increase while the commission error will decrease. In contrast, if the T value is low, the omission error will decrease while the commission error will increase. The value of threshold T can be determined by the user, which means the new method has flexibility to meet the user’s demands.
2.4. Accuracy Assessment
To validate the effectiveness and applicability of our method, accuracy assessment was applied to the extracted training sample sets and the final burned area map. Since the performance of the proposed method depends on the accuracy of the training sample sets, it is necessary to assess their accuracy first. We applied the 10-fold cross validation method to access the accuracy of the training sample sets used by the BPNN. The sample sets were divided into 10 groups, nine groups of which were employed as the training samples, and the remaining group was used as the test sample. The validation process can take all the samples as training sets and test sets, and each sample can be validated once. The evaluation metrics of overall accuracy (OA), omission error (OE), commission error (CE), and Kappa coefficient (K) were measured to quantificationally assess the accuracy. These evaluation metrics are defined as follows:
In these formulas, m represents a certain type, n refers to the number of types, Nc is the number of samples correctly classified, Ntotal is the total number of the samples of all types, Nmiss,m is the number of miss-classified samples of type m, Nactual,m is the actual number of type m, Nfalse,m is the number of false-classified samples of type m, and Npredit,m is the predicted number of type m.
Also, accuracy assessment for the burned area map was carried out to demonstrate the applicability of the proposed method. We assessed the accuracy of the burned area maps derived from our method using the reference data compiled by remote sensing data of finer resolution [9,16]. In this study, Landsat 8 OLI Collection 1 L1TP products were processed to generate the reference burned area map as ground truth. The OLI products have already been radiometrically calibrated and orthorectified using ground control points and digital elevation model (DEM) data to correct for relief displacement [5]. Here are the processing steps of Landsat-8 OLI data with ENVI software: Firstly, the L1TP products were atmospherically corrected to obtain surface reflectance free from the influence of atmosphere, solar illumination and similar interferences [27,47]. Then, two adjacent atmospherically-corrected images in the pre-fire or post-fire period were processed by image mosaic to a wide and seamless image. Thirdly, the mosaic images were cropped to the study area according to the longitude and latitude of the wildfires. Then the OLI spectral bands at finer spatial resolution (30-m) were then spatially down-sampled to the 1-km resolution for comparison with the MODIS-based burned area results. Afterward, the Normalized Burn Ratio (NBR) images in the pre-fire and post-fire period were obtained. The post-fire NBR image was subtracted from the pre-fire NBR image to get the differenced NBR (dNBR) according to the formula below [62]:
Finally, the dNBR in conjunction with the post-fire NDVI and post-fire NDWI were used with empirical thresholds to remove noisy pixels [33,63]:
Both the MODIS and OLI data used the map projection of transverse Mercator. In the comparison between the MODIS-based and OLI-based burned area maps, a pixel-wise accuracy assessment was performed to evaluate the proposed method. The commission error (CE) and omission error (OE) of the burned area detection have been analyzed to represent the accuracy of the MODIS-based burned area map.
3. Results
3.1. Application of the Method
3.1.1. Extracted Sample Sets
The proposed burned area mapping method was applied to the Hot Pot Fire, Range 12 Fire, and Rey Fire to extract the sample sets of five typical types of land cover. The relationship of reflectance at band 5 (1.24 μm) and band 7 (2.13 μm) of the extracted samples was investigated. Figure 5a,b show the scatter plots of band 5 and band 7 reflectance comparisons of the samples extracted by Box 1 and Box 2, respectively, in the Range 12 Fire. The samples of unburned types in Box 1 and Box 2 are in the upper left corner of the scatter plots, whereas the samples of the burned area in Box 1 are in the lower right corner of Figure 5a,b. Figure 5c is the scatter plot made by combining Figure 5a,b. The empirical formula with an intercept of -0.003 and a slope of 1.079 can effectively separate the burned area samples from unburned samples in the Range 12 Fire, so the samples below the line are extracted as burned area samples. Using the same method, we can determine the empirical formulas of the other two wildfire cases and then extract more samples of the burned area. The empirical formula and its coefficients α and β of the three wildfires are shown in Table 5.
The samples of vegetation, cloud, bare soil, and cloud shadow were also extracted from the three wildfire cases. Finally, the sample sets acquired from the Hot Pot Fire, Range 12 Fire and Rey Fire contained burned area pixels (1251), vegetation pixels (1101), bare soil pixels (898), cloud pixels (302), and shadow pixels (205); the total number of extracted samples is 3757.
3.1.2. Spectral Analysis Results
The capacity of MODIS bands 1–7 for burned area identification was investigated based on the sample sets of five typical types extracted from Hot Pot Fire. Reflectance curves of the five types in the Hot Pot Fire are shown in Figure 6a. The results show that the average reflectance of cloud is much higher than that of the burned area, which means that it is easier to discriminate the cloud and burned area. Moreover, the reflectance of shadow is lower than that of burned area except for the slightly higher reflectance at band 3. Compared with the average reflectance of vegetation, the reflectance of burned area drops in the NIR spectral region. It accounts for 61.6% of the vegetation reflectance at band 5, and the proportion is 72.7% at band 7; whereas the average burned area reflectance increases in the SWIR spectral region. It is 110.5% of the vegetation reflectance at band 6 and 189.1% at band 7. This also indicates that the NIR and SWIR spectral regions are more sensitive to the burned area.
To demonstrate the capacity of the spectral bands to separate the burned area and unburned types, we calculated the separability index M of three comparisons: burned area vs. shadow, burned area vs. bare soil, and burned area vs. vegetation. The M statistic results of the three comparisons for the Hot Pot Fire are presented in Figure 6b. The results prove that the visible region (bands 1, 3 and 4) has low capacity to discriminate the burned area from three unburned types, and is especially weak in the separation of the burned area and shadow with M values lower than 0.4. Moreover, in the comparison between the burned area and bare soil, the M values of band 2 and band 5 are both 1.0, and in the comparison between the burned area and vegetation, the M values of band 2 and band 5 are both 1.1, which indicates that the NIR region shows high distinguishing capacity to the burned area. Furthermore, the M values of band 6 and 7 are higher than 1.8 in the burned and shadow comparison. This shows that the reflectance in the SWIR region is useful to discriminate the burned area and shadow. Overall, based on the samples of the Hot Pot Fire, the M values of band 5 in the three comparisons are all greater than 1.0, which demonstrates that the reflectance of band 5 has the optimal performance to discriminate burned area among bands 1–7.
The sample sets extracted from the Range 12 Fire and Rey Fire consist only of three types including burned area, vegetation and bare soil. To determine the distinguishing capacity of band 5, we calculated the separability index M for two comparisons (burned area vs. bare soil and burned area vs. vegetation) at band 5 in these two wildfire cases. The results, presented in Figure 7, indicate that the M values between burned area and vegetation in these two wildfire cases are lower than 1.0, which means that the reflectance of band 5 has poor performance in separating the burned area from vegetation in different wildfires. The primary reason for the results is the differences of the fuels involved in the three wildfire cases, including the vegetation differences between the long grass of Hot Pot Fire [64], the tall grass of Range 12 Fire [65], and the oak canopy of Rey Fire. Also, the varying space and time of wildfires can cause inconsistent performance of the spectral band [5]. In addition, the results also highlight the regional limitation of the single spectral band that is not normalized to the pre-fire spectral condition, as found by Reference [66]. Thus, the reflectance of a single band with the separating capacity of regional differences should not be used as the input feature vector of the BPNN. Despite this, the spectral bands are sensitive to the burned area (e.g., the reflectance of the NIR and SWIR spectral regions can be used to generate the spectral indices), which can further enhance the capacity to identify the burned area.
To investigate the capacity of the spectral indices listed in Table 4 for burned area discrimination, we calculated the separability index M value of each spectral index on the comparisons between the burned area and unburned types over the three wildfire cases. Figure 8a–c shows the M statistics of the Hot Pot Fire, Range 12 Fire and Rey Fire, respectively. The horizontal lines in the figures with an M value equal to 1.0 can be used to separate the spectral indices of high (>1.0) or poor (<1.0) distinguishing capacity. In general, a spectral index with M value above the horizontal line performs well in discriminating the burned area from other types. The results indicate that the MIRBI, NBR, bsVI, NsEv1, and NsTv1 have the best performance among all the spectral indices. We also selected CSI as the input feature vector of BPNN, considering that it has a relatively good separating performance despite the fact that its M value for the comparison of burned area vs. vegetation in the Rey Fire is slightly lower than 1.0. It can be found that the indices MIRBI, NBR, bsVI, and CSI, combining the reflectance of the NIR and SWIR spectral region, have a more robust capacity to discriminate burned area than the indices BAI, NDVI, EVI, GEMI, and SAVI which incorporate the reflectance of the visible spectral region. In addition, the high separability of NSEv1 and NSTv1 also proves that the LST and the emissivity of the thermal infrared (TIR) band are useful for burned area detection [22].
Our separability analysis between the burned area and unburned types demonstrated that the spectral indices MIRBI, NBR, CSI, bsVI, NSEv1, and NSTv1 are applicable for burned area discrimination, and those indicators are used as the six feature vectors of the input layer of BPNN.
3.1.3. Accuracy Analysis and Training of BPNN
In our application, the structure of the BPNN contains the input layer with six input feature vectors, one hidden layer with 25 processing neurons, and the output layer with one neuron. Before training the BPNN, we assessed the accuracy of the extracted sample sets to validate the availability of our method. Table 6 shows the average value of the 10 results of 10-fold cross-validation with error matrix, omission error (OE), commission error (CE), overall accuracy (OA), and Kappa coefficient (K) value [9,24,31,67]. The 10-fold cross validation method shows that the extracted sample sets achieve high values of overall accuracy and Kappa coefficient as well as low values of omission error and commission error. The average values of overall accuracy and Kappa coefficient are 98.68% and 97.46% respectively, which indicates that the predicted outputs were close to the target outputs. Thus, the training sample sets are applied to the BPNN for burned area detection.
The sample sets generated from the optimal spectral indices (MIRBI, NBR, CSI, bsVI, NSEv1, and NSTv1) of the five land cover types were used to train the network. The training setting was set with a stopping criterion on a mean squared error value of 0.001. The network was trained until it reached the local minimum. Afterward, the trained network was applied to other wildfire cases to validate the applicability of the new burned area mapping method (see Section 3.2.2 and Section 3.2.3 for the details).
3.2. Burned Area Map
3.2.1. Results of Traditional Empirical Formula Method
For comparison with the proposed method, we utilized the traditional empirical formula method [18] on the Hot Pot Fire and Range 12 Fire to obtain the burned area maps; the results are shown in Figure 9a,b. The empirical formula used to analyze the two wildfire cases is listed in Table 5. The red pixels in the figures are the burned area identified by the empirical formula method.
The results demonstrate that the traditional empirical formula method can detect the main burned area in these two cases. However, there are too many misclassifications and miss-classifications in the burned area maps. Figure 9a shows that a few burned area pixels are not identified in the middle of the image, and a few unburned pixels are misclassified as burned at the lower right and lower left quadrants of the image. Figure 9b shows the poor detection results for the Range 12 Fire, the evidence being the large number of misclassifications. Although the main burned area in the middle of the image is identified, many pixels of unburned types are misclassified as burned. This is mainly due to the limited sample sets extracted from this wildfire case; in other words, the misclassified pixels were not extracted in the separability analysis, so the established empirical formula cannot separate them from the burned pixels. In comparison to the OLI-based burned area map, the traditional empirical formula method achieves a CE of 20.16% and an OE of 20.00% in Hot Pot Fire, and it performed worse with a CE of 66.73% and an OE of 20.32% in Range 12 Fire. This weakness proves that the traditional empirical formula method has low applicability for burned area detection in varying regions.
3.2.2. Threshold Selection and Accuracy Evaluation
The new burned area mapping method aims to derive a MODIS-based burned area map, which can be assessed by comparison to the OLI-based burned area map. In this method, the threshold T used in the BPNN output layer will determine the commission errors and omission errors of the burned area map. The threshold selection was investigated to validate its applicability compared to the OLI-based results for burned area detection. The threshold application was analyzed in the four wildfire cases (Hot Pot Fire, Range 12 Fire, Tohakum 2 Fire, and Cinder Butte Fire), but Powerline Fire was not investigated due to the lack of its corresponding cloud-free Landsat OLI data. The OLI L1TP scene-pairs in the pre-fire and post-fire period of the four wildfire cases were obtained. The specific information of the OLI scenes used is shown in Table 7. The acquisition dates between the post-fire OLI and MODIS scenes in three wildfire cases were within 1 day except for Tohakum 2 Fire, which can reduce the differences of fire spreading between image date and burn date, and the error caused by the rapid change of ash and vegetation as much as possible.
The variation in the accuracy of the burned area map along with the threshold T was analyzed by examining evaluation metrics including CE and OE [25], as shown in Figure 10. The range of T is [0, 0.9]. Figure 10 indicates that CE decreases and OE increases as T increases. This is because high values of T (i.e., conservative threshold) can avoid unburned pixels being misidentified as burned area pixels, but a few burned pixels cannot be identified. In contrast, a low T value contributes to the identification of all the burned areas, but some unburned pixels can be misidentified as burned. The threshold T in the BPNN output layer can be modified according to the user’s demand. The change trends of the average errors in the four wildfire cases shows that the average CE intersects with the average OE around the T value of 0.8 with CE of 12.125% and OE of 12.458%. Accordingly, we adopted the threshold T = 0.8 for each wildfire case as a result of the balanced low errors.
To validate the applicability of our method, a pixel-wise accuracy assessment has been applied to the new method in comparison to the OLI-based burned area map. The OE and CE in the application of Hot Pot Fire, Range 12 Fire, Cinder Butte Fire, and Tohakum 2 Fire are shown in Table 7. Comparing with the traditional empirical formula method, the proposed method greatly improves the accuracy of burned area detection. In the Hot Pot Fire, the CE and OE have been reduced by 10.28% and 9.69%, respectively. Also, in the Range 12 Fire, the CE and OE have been reduced by 50.58% and 6.03%, respectively. The results prove that the new method achieved a better performance than the traditional empirical formula method. We also applied the new burned area mapping method to the Cinder Butte Fire and Tohakum 2 Fire. The pixel-wise comparison results presented by color mixing of the MODIS-based and OLI-based burned area maps in the two fires are shown in Figure 11. The CE and OE are 8.07% in Cinder Butte Fire, and they are 14.40% and 17.16% in Tohakum 2 Fire, respectively.
According to the accuracy assessment results between the MODIS-based and OLI-based burned area maps that are shown in Table 7 and Figure 11, it demonstrates that the new method achieves high accuracy in burned area detection. The success is mainly due to the combination of the training samples of optimal spectral indices and the BPNN algorithm. In the application of the wildfire cases, the omission errors illustrate an underestimation of the burned area detected in the MODIS-based map. This can be mainly ascribed to the conservative threshold used to separate the burned and unburned pixels in the BPNN output layer. In addition, the impact of the spatial pattern of burned patches at high spatial resolution data can lead to the false detection [68]. Moreover, because the MODIS data was corrected to the transverse Mercator projection, the pixel shift and the resampling method could also bias the commission and omission errors between the MODIS-based and OLI-based burned area map. Considering that the OLI image used in the Tohakum 2 Fire is 22 days later than the applied MODIS image, the loss of ash and restoration of herbaceous plants may account for the discrepancy in the northeast of the fire.
3.2.3. Results of the Burned Area Mapping Method
To demonstrate the effectiveness and applicability of the new burned area mapping method, we applied it to five wildfire cases to derive burned area maps. The five cases are the Hot Pot Fire, Range 12 Fire, Powerline Fire, Tohakum 2 Fire, and Cinder Butte Fire which are shown in Figure 12a,c,e,g,i, respectively. The figures are the false-color composition RGB images of MODIS bands 7, 5 and 6 of the corresponding wildfires, which can provide supplementary information for burned area identification by visual interpretation. Also, Figure 12b,d,f,h,j present the detection results of the burned area in the five wildfire cases using the proposed method. In the burned area maps, the red pixels with the network output value greater than 0.8 are identified as the burned area while the white pixels with the value lower than 0.8 are the unburned area.
The detection results in the five wildfire cases, as shown in Figure 12, validate the effectiveness and applicability of the proposed method for burned area detection through visual interpretation with the false-color composition RGB images and the accuracy evaluation in Section 3.2.2. It can be seen that the main burned region can be effectively identified by the method; each burned region outline coincides with the dark purple region in the corresponding false-color composition images. Also, small burned patches can also be identified by our method, such as the dark purple patches in the upper-right corner of Figure 12c. Compared with the detection results by the traditional empirical method (Figure 9), the results of the same wildfire cases in Figure 12b,d by the new burned area mapping method are greatly improved. The commission error of unburned pixels that has similar spectral characteristics with burned pixels has been eliminated by our method. However, there are a few pixels along the long river in Figure 12d that were identified as burned pixels by mistake. In view of the water mask work described in Section 2.3.2, the commission error appears due to the similar spectral characteristics of river bank pixels and burned pixels. Further research will be devoted to removing this type of commission error. The wildfire cases in Figure 12e,g,i involved the land cover types of water, vegetation and bare soil in addition to the burned area. From the detection results in Figure 12f–j, the new method can effectively separate the burned area from these unburned cover types. In general, the detection results indicate that the new method performs well in burned area detection.
4. Discussion
The resulting burned area maps for five wildfire cases indicate that the new burned area mapping method obtains higher accuracy than the traditional empirical formula method based on a single MODIS image. The advantages of the proposed method come from the integration of multiple spectral indices and a neural network. The separability analysis between the burned area type and unburned types indicates that using six spectral indices (MIRBI, NBR, CSI, bsVI, NSEv1, and NSTv1) brings better performance, even though using a single spectral band results in inconsistent separating capacity. In contrast to the traditional empirical formula method [18], the new method utilizes the optimal spectral indices rather than the spectral bands to identify the burned pixels. Also, based on the training samples of multiple spectral indices, the BPNN algorithm used in our method can make better use of the differences between the burned area and unburned cover types. The refinements will greatly improve the accuracy of burned area detection results. The new method can be applied to a single MODIS image by taking full advantage of the spectral information of different types in the image while providing rapid wildfire assessment.
The accuracy of this method is based upon the important premise that the extracted samples of one type definitely belong to this type. A couple of factors are considered to ensure that the sample sets are correct. First of all, a combination of traditional methods based on previous research [18,25,31,42,43,44,45,46,69] is utilized to extract the samples of five typical land cover types. Conservative thresholds from the corresponding references and the appropriate empirical formulas derived from the data analysis are used in the traditional methods to guarantee the validity of the extracted samples. Moreover, we also performed the quantitative accuracy assessment by 10-fold cross validation for the sample sets. The analysis results of high accuracy and low error rate indicate that the sample sets extracted by the methods described in Section 2.3.2 are valid for training the neural network.
Spectral differences between the burned area and unburned types were investigated based on the sample sets. We analyzed seven spectral bands of visible, NIR and SWIR spectral regions and 13 spectral indices including the vegetation indices, burned area indices, and NBR-based indices in the separability analysis. The beneficial effect of using the reflectance of NIR and SWIR spectral regions, as well as the data of emissivity and LST, to identify the burned area is consistent with the findings of References [20,22,24,52]. Nevertheless, the reflectance of any single spectral band has limited capacity to distinguish the land cover types in varying regions, which explains the limitations of using spectral bands to identify the burned area with the traditional empirical formula method. Also, multiple spectral indices of NBR, bsVI, NSEv1, and NSTv1 performed well in burned region detection, which corroborates the research of References [5,16,22]. The index CSI was also proved with high separability in Reference [20], and MIRBI is known to be suitable in shrub-savannah ecosystems [24,52]. The spectral indices could not reach the same performance in different regions [5] due to the vegetation types, the conditions of climate, and the illumination, as well as the wavelengths of the sensor; these results were also found by Reference [22]. However, we can utilize the learning and modeling ability of the BPNN algorithm to obtain the spectral differences of different types based on the samples of the spectral indices, thereby achieving better separability of the burned area. This contributes to improving the accuracy of detection results in the burned area map. Furthermore, whether for MODIS data or other sensor data, the results of the separability analysis in this paper provide valuable assessment information about the use of spectral regions and spectral indices to discriminate burned areas. Future research will concentrate on the spectral characteristics of the seasonal and regional sample sets of varying pre-fire vegetation types [22,32], which can further reveal the distinguishing capacity of the spectral regions and indices to a burned area.
The BPNN used in the method can learn the spectral differences based on the input samples of spectral indices for known types and can use that training to predict the unknown type of each pixel. The complex nonlinear relationship between the inputs and targets can be modeled using a BPNN. However, the traditional empirical formula method needs to analyze the spectral characteristics of the burned area and unburned types based on the extracted samples to find an empirical formula to separate them. Finding the formula is time-consuming and limited to the region where the data is extracted. Besides, the empirical formula is determined by the specific sample sets, which means it needs to be re-established in other regions. Thus, the proposed method is more applicable and effective than the traditional empirical formula method. Considering that the threshold T set for the output layer of the BPNN is an important parameter, the impact of threshold selection on the errors of results was verified in comparison to the reference OLI-based results. Intrinsic restrictions cause a tradeoff which is indicated by the change trends of the two kinds of errors (CE and OE) [25]; in other words, if the threshold value choice decreases one error, the other error will increase. On the one hand, selection of an appropriate threshold T can balance the CE and OE of the results so both are at a relatively low level. On the other hand, the setting of different thresholds can meet the demands of different users who prioritize CE and OE differently. If the user needs to identify all the burned areas, a low threshold can be applied. However, if the user needs to guarantee that all identified areas are actually burned, then a conservative threshold is required. In this study, we adopted a conservative threshold T = 0.8 in the analysis of the four wildfire cases to demonstrate the effectiveness of our method. However, the current method has a limitation of threshold selection for the output value in BPNN. The structure of BPNN can be further improved as more land cover types and more samples are collected to the training sets.
Overall, the new method presents a better capacity for burned area detection based on a single MODIS image. The most intuitive benefit is that the proposed method can accurately and promptly determine the burned regions that are burned areas. In addition, the range of wildfire spread can also be estimated based on the premise that the wildfire can be captured by the MODIS sensor. Since the MODIS sensor has a large viewing swath of 2330 km with a revisit cycle of 1 or 2 days [70], and it has four overpasses per day (two daytime and two nighttime) when combining Aqua and Terra, it is reasonable to believe that our method is significant for the assessment of the burned regions. In addition to the application to MODIS data, the new burned area mapping method has good prospects for extension to other polar-orbiting and synchronous satellite data as well as Unmanned Aerial Vehicle (UAV) data for wildfire assessment. Furthermore, taking note of the possible spectral differences of training samples in varying seasons, regions and vegetation types [22,32], we may establish seasonal, regional, and vegetation-based sample sets to improve the method further. Moreover, the deep learning techniques with powerful learning ability may be introduced to the data-processing of the abundant satellite data expected in the future.
5. Conclusions
The new burned area mapping method integrating multiple spectral indices and a neural network was developed for near real-time burned area detection based on a single MODIS image. Besides this, the spectral characteristics analysis in this study can contribute to the selection of adequate spectral regions and spectral indices, which is applicable to the use of data from other sensors with a finer spatial resolution for burned area discrimination and wildfire assessment.
The advantages of this proposed method come from the use of multiple spectral indices and the BPNN technique. Our separability analysis between the burned area and unburned types found that NIR and SWIR spectral regions are more sensitive to the burned area than the visible region. The data of LST and emissivity is also proved to be applicable for burned area detection. Rather than using the distinguishing capacity of a single spectral band, the spectral indices with a high capacity for burned area discrimination in various wildfires were used to generate the training sample sets for the BPNN. The sample sets’ high accuracy of 98.68% and Kappa coefficient value of 97.46% improved the detection accuracy of the method. Compared to the traditional empirical formula method applied in the Hot Pot Fire and Range 12 Fire, the proposed method demonstrates a significant improvement in burned area detection with a reduction of 10.28% and 50.58% for the CE as well as 9.69% and 6.03% for the OE. This accuracy improvement is mainly due to the BPNN, which can take full advantage of the spectral differences between the burned area and unburned types. The new method was also applied in the validation fire cases to derive the MODIS-based burned area maps, which were assessed by the OLI-based burned area maps: the CE and OE of the Cinder Butte Fire are 8.07%, and they are 14.40% and 17.16% in Tohakum 2 Fire. The application of the method in the wildfire cases proves that it can effectively identify the burned area based on a single MODIS image.
Although the method performed well in burned area detection in this study, more sample sets of varying wildfire cases need to be investigated. Future research will be devoted to establishing specific seasonal and regional training sample sets including different vegetation types, which can further improve the reliability and applicability of the method.
Author Contributions
Data curation, R.B. and Z.X.; Funding acquisition, W.S. and S.L.; Investigation, R.B. and Z.X.; Methodology, R.B., W.S. and Z.X.; Software, R.B. and Xiaolian Li; Supervision, W.S. and S.L.; Validation, R.B. and X.L.; Visualization, Z.X.; Writing—original draft, R.B.; Writing—review & editing, W.S., X.L. and S.L.
Funding
This research was funded by National Key R&D Program of China (2018YFC0807000), Fundamental Research Funds for the Central Universities (Grant No. WK2320000040), and the Research Grant Council of the Hong Kong Special Administrative Region, China (contract grant number CityU 11300815).
Acknowledgments
We are very grateful for the valuable suggestions and comments of peer reviewers. We also acknowledge the use of MODIS Level 1B data which was acquired from the Level-1 and Atmosphere Archive & Distribution System (LAADS) Distributed Active Archive Center (DAAC), located in the Goddard Space Flight Center in Greenbelt, Maryland (https://ladsweb.nascom.nasa.gov/), and the use of OLI Collection 1 L1TP products which were acquired from EarthExplorer website (https://earthexplorer.usgs.gov/) of United States Geological Survey (USGS).
Conflicts of Interest
The authors declare no conflict of interest.
Abbreviations
The following abbreviations are used in this paper:
| MODIS | Moderate Resolution Imaging Spectroradiometer |
| OLI | Operational Land Imager |
| BPNN | back-propagation neural network |
| VEG | VEGETATION |
| AVHRR | Advanced Very High Resolution Radiometer |
| ASTER | Advanced Spaceborne Thermal Emission and Reflection Radiometer |
| VIIRS | Visible Infrared Imaging Radiometer Suite |
| TM | Thematic Mapper |
| ETM+ | Enhanced Thematic Mapper plus |
| SAR | Synthetic Aperture Radar |
| GPP | Gross Primary Production |
| LAADS | Level-1 and Atmosphere Archive & Distribution System |
| DAAC | Distributed Active Archive Center |
| USGS | United States Geological Survey |
| InciWeb | Incident Information System |
| GeoMAC | Geospatial Multi-Agency Coordination Group |
| MTBS | Monitoring Trends in Burn Severity |
| NIR | near-infrared |
| SWIR | short wave infrared |
| TIR | thermal infrared |
| BT | Brightness Temperature |
| LST | Land surface temperature |
| BAI | Burned Area Index |
| CSI | Char Soil Index |
| MIRBI | Mid Infrared Burn Index |
| NBR | Normalized Burn Ratio |
| dNBR | Normalized Burned Ratio differencing |
| NDVI | Normalized Difference Vegetation Index |
| EVI | Enhanced Vegetation Index |
| GEMI | Global Environment Monitoring Index |
| SAVI | Soil Adjusted Vegetation Index |
| bsVI | burn-sensitive Vegetation Index |
| NSEv1 | NIR-SWIR-emissivity Version 1 |
| NSEv2 | NIR-SWIR-emissivity Version 2 |
| NSTv1 | NIR-SWIR-Ts Version 1 |
| NSTv2 | NIR-SWIR-Ts Version 2 |
| OA | overall accuracy |
| OE | omission error |
| CE | commission error |
| K | Kappa coefficient |
| DEM | digital elevation model |
| M | Separability index |
| T | Threshold in the output layer of BPNN |
| UAV | Unmanned Aerial Vehicle |
References
- Cao, X.; Chen, J.; Matsushita, B.; Imura, H.; Wang, L. An automatic method for burn scar mapping using support vector machines. Int. J. Remote Sens. 2009, 30, 577–594. [Google Scholar] [CrossRef]
- Barbosa, P.M.; Gregoire, J.M.; Pereira, J.M.C. An algorithm for extracting burned areas from time series of AVHRR GAC data applied at a continental scale. Remote Sensi. Environ. 1999, 69, 253–263. [Google Scholar] [CrossRef]
- Thonicke, K.; Spessa, A.; Prentice, I.; Harrison, S.P.; Dong, L.; Carmona-Moreno, C. The influence of vegetation, fire spread and fire behaviour on biomass burning and trace gas emissions: Results from a process-based model. Biogeosciences 2010, 7, 1991. [Google Scholar] [CrossRef]
- Melchiorre, A.; Boschetti, L. Global Analysis of Burned Area Persistence Time with MODIS Data. Remote Sens. 2018, 10, 750. [Google Scholar] [CrossRef]
- Fornacca, D.; Ren, G.; Xiao, W. Evaluating the Best Spectral Indices for the Detection of Burn Scars at Several Post-Fire Dates in a Mountainous Region of Northwest Yunnan, China. Remote Sens. 2018, 10, 1196. [Google Scholar] [CrossRef]
- Mouillot, F.; Schultz, M.G.; Yue, C.; Cadule, P.; Tansey, K.; Ciais, P.; Chuvieco, E. Ten years of global burned area products from spaceborne remote sensing-A review: Analysis of user needs and recommendations for future developments. Int. J. Appl. Earth Obs. 2014, 26, 64–79. [Google Scholar] [CrossRef]
- Pereira, A.A.; Pereira, J.; Libonati, R.; Oom, D.; Setzer, A.W.; Morelli, F.; Machado-Silva, F.; de Carvalho, L.M.T. Burned area mapping in the brazilian savanna using a one-class support vector machine trained by active fires. Remote Sens. 2017, 9, 1161. [Google Scholar] [CrossRef]
- Stroppiana, D.; Pinnock, S.; Pereira, J.M.C.; Gregoire, J.M. Radiometric analysis of SPOT-VEGETATION images for burnt area detection in Northern Australia. Remote Sens. Environ. 2002, 82, 21–37. [Google Scholar] [CrossRef]
- Brivio, P.; Maggi, M.; Binaghi, E.; Gallo, I. Mapping burned surfaces in Sub-Saharan Africa based on multi-temporal neural classification. Int. J. Remote Sens. 2003, 24, 4003–4016. [Google Scholar] [CrossRef]
- Stroppiana, D.; Tansey, K.; Gregoire, J.M.; Pereira, J.M.C. An algorithm for mapping burnt areas in Australia using SPOT-VEGETATION data. IEEE Trans. Geosci. Remote 2003, 41, 907–909. [Google Scholar] [CrossRef]
- Kasischke, E.S.; French, N.H.F. Locating and estimating the areal extent of wildfires in alaskan boreal forests using multiple-season avhrr ndvi composite data. Remote Sens. Environ. 1995, 51, 263–275. [Google Scholar] [CrossRef]
- Razafimpanilo, H.; Frouin, R.; Iacobellis, S.F.; Somerville, R.C.J. Methodology for estimating burned area from AVHRR reflectance data. Remote Sens. Environ. 1995, 54, 273–289. [Google Scholar] [CrossRef]
- Pereira, J.M.C. A comparative evaluation of NOAA/AVHRR vegetation indexes for burned surface detection and mapping. IEEE Trans. Geosci. Remote 1999, 37, 217–226. [Google Scholar] [CrossRef]
- Fraser, R.H.; Li, Z.; Cihlar, J. Hotspot and NDVI differencing synergy (HANDS): A new technique for burned area mapping over boreal forest. Remote Sens. Environ. 2000, 74, 362–376. [Google Scholar] [CrossRef]
- Ruiz, J.A.M.; Riano, D.; Arbelo, M.; French, N.H.F.; Ustin, S.L.; Whiting, M.L. Burned area mapping time series in Canada (1984–1999) from NOAA-AVHRR LTDR: A comparison with other remote sensing products and fire perimeters. Remote Sens. Environ. 2012, 117, 407–414. [Google Scholar] [CrossRef]
- Giglio, L.; Loboda, T.; Roy, D.P.; Quayle, B.; Justice, C.O. An active-fire based burned area mapping algorithm for the MODIS sensor. Remote Sens. Environ. 2009, 113, 408–420. [Google Scholar] [CrossRef]
- Loboda, T.; O’Neal, K.J.; Csiszar, I. Regionally adaptable dNBR-based algorithm for burned area mapping from MODIS data. Remote Sens. Environ. 2007, 109, 429–442. [Google Scholar] [CrossRef]
- Li, R.R.; Kaufman, Y.J.; Hao, W.M.; Salmon, J.M.; Gao, B.C. A technique for detecting burn scars using MODIS data. IEEE Trans. Geosci. Remote 2004, 42, 1300–1308. [Google Scholar] [CrossRef]
- Guindos-Rojas, F.; Arbelo, M.; García-Lázaro, J.R.; Moreno-Ruiz, J.A.; Hernández-Leal, P.A. Evaluation of a Bayesian Algorithm to Detect Burned Areas in the Canary Islands’ Dry Woodlands and Forests Ecoregion Using MODIS Data. Remote Sens. 2018, 10, 789. [Google Scholar] [CrossRef]
- Stroppiana, D.; Boschetti, M.; Zaffaroni, P.; Brivio, P.A. Analysis and Interpretation of Spectral Indices for Soft Multicriteria Burned-Area Mapping in Mediterranean Regions. IEEE Geosci. Remote Sens. Lett. 2009, 6, 499–503. [Google Scholar] [CrossRef]
- Boschetti, M.; Stroppiana, D.; Brivio, P.A. Mapping Burned Areas in a Mediterranean Environment Using Soft Integration of Spectral Indices from High-Resolution Satellite Images. Earth Interact. 2010, 14. [Google Scholar] [CrossRef]
- Veraverbeke, S.; Harris, S.; Hook, S. Evaluating spectral indices for burned area discrimination using MODIS/ASTER (MASTER) airborne simulator data. Remote Sens. Environ. 2011, 115, 2702–2709. [Google Scholar] [CrossRef]
- García-Lázaro, J.; Moreno-Ruiz, J.; Riaño, D.; Arbelo, M. Estimation of Burned Area in the Northeastern Siberian Boreal Forest from a Long-Term Data Record (LTDR) 1982–2015 Time Series. Remote Sens. 2018, 10, 940. [Google Scholar] [CrossRef]
- Stroppiana, D.; Bordogna, G.; Boschetti, M.; Carrara, P.; Boschetti, L.; Brivio, P.A. Positive and Negative Information for Assessing and Revising Scores of Burn Evidence. IEEE Geosci. Remote Sens. Lett. 2012, 9, 363–367. [Google Scholar] [CrossRef]
- Stroppiana, D.; Azar, R.; Calo, F.; Pepe, A.; Imperatore, P.; Boschetti, M.; Silva, J.M.N.; Brivio, P.A.; Lanari, R. Integration of Optical and SAR Data for Burned Area Mapping in Mediterranean Regions. Remote Sens. 2015, 7, 1320–1345. [Google Scholar] [CrossRef]
- Bastarrika, A.; Chuvieco, E.; Martin, M.P. Mapping burned areas from Landsat TM/ETM plus data with a two-phase algorithm: Balancing omission and commission errors. Remote Sens. Environ. 2011, 115, 1003–1012. [Google Scholar] [CrossRef]
- Stroppiana, D.; Bordogna, G.; Carrara, P.; Boschetti, M.; Boschetti, L.; Brivio, P.A. A method for extracting burned areas from Landsat TM/ETM+ images by soft aggregation of multiple Spectral Indices and a region growing algorithm. ISPRS J. Photogramm. Remote Sens. 2012, 69, 88–102. [Google Scholar] [CrossRef]
- Axel, A.C. Burned Area Mapping of an Escaped Fire into Tropical Dry Forest in Western Madagascar Using Multi-Season Landsat OLI Data. Remote Sens. 2018, 10, 371. [Google Scholar] [CrossRef]
- Lohberger, S.; Stängel, M.; Atwood, E.C.; Siegert, F. Spatial evaluation of Indonesia’s 2015 fire affected area and estimated carbon emissions using Sentinel-1. Glob. Chang. Biol. 2018, 24, 644–654. [Google Scholar] [CrossRef]
- Engelbrecht, J.; Theron, A.; Vhengani, L.; Kemp, J. A simple normalized difference approach to burnt area mapping using multi-polarisation C-Band SAR. Remote Sens. 2017, 9, 764. [Google Scholar] [CrossRef]
- Li, X.L.; Song, W.G.; Lian, L.P.; Wei, X.G. Forest Fire Smoke Detection Using Back-Propagation Neural Network Based on MODIS Data. Remote Sens. 2015, 7, 4473–4498. [Google Scholar] [CrossRef]
- Santana, N.; de Carvalho Júnior, O.; Gomes, R.; Guimarães, R.J.R.S. Burned-Area Detection in Amazonian Environments Using Standardized Time Series Per Pixel in MODIS Data. Remote Sens. 2018, 10, 1904. [Google Scholar] [CrossRef]
- Ryu, J.-H.; Han, K.-S.; Hong, S.; Park, N.-W.; Lee, Y.-W.; Cho, J. Satellite-Based Evaluation of the Post-Fire Recovery Process from the Worst Forest Fire Case in South Korea. Remote Sens. 2018, 10, 918. [Google Scholar] [CrossRef]
- Harris, S.; Veraverbeke, S.; Hook, S. Evaluating spectral indices for assessing fire severity in chaparral ecosystems (Southern California) using MODIS/ASTER (MASTER) airborne simulator data. Remote Sens. 2011, 3, 2403–2419. [Google Scholar] [CrossRef]
- Level-1 and Atmosphere Archive & Distribution System (LAADS) Distributed Active Archive Center (DAAC). Available online: https://modis.gsfc.nasa.gov/ (accessed on 15 December 2018).
- United States Geological Survey (USGS) Earth Explorer Website. Available online: https://earthexplorer.usgs.gov/ (accessed on 18 January 2019).
- Incident Information System (InciWeb). Available online: https://inciweb.nwcg.gov/ (accessed on 20 December 2018).
- Capata, A.; Marella, A.; Russo, R. A geo-based application for the management of mobile actors during crisis situations. In Proceedings of the 5th International ISCRAM Conference, Washington, DC, USA, 4–7 May 2008. [Google Scholar]
- GeoMAC Website (by the Geospatial Multi-Agency Coordination Group). Available online: https://www.geomac.gov/ (accessed on 20 December 2018).
- Parson, A.; Robichaud, P.R.; Lewis, S.A.; Napper, C.; Clark, J.T. Field Guide for Mapping Post-Fire Soil Burn Severity; Department of Agriculture, Forest Service, Rocky Mountain Research Station: The Collins, CO, USA, 2010; Volume 243, p. 49.
- Monitoring Trends in Burn Severity (MTBS) Website. Available online: https://www.mtbs.gov/ (accessed on 18 November 2018).
- Chowdhury, E.H.; Hassan, Q.K. Use of remote sensing-derived variables in developing a forest fire danger forecasting system. Nat. Hazards 2013, 67, 321–334. [Google Scholar] [CrossRef]
- Stroppiana, D.; Pinnock, S.; Gregoire, J.-M. The global fire product: Daily fire occurrence from April 1992 to December 1993 derived from NOAA AVHRR data. Int. J. Remote Sens. 2000, 21, 1279–1288. [Google Scholar] [CrossRef]
- Giglio, L.; Descloitres, J.; Justice, C.O.; Kaufman, Y.J. An Enhanced Contextual Fire Detection Algorithm for MODIS. Remote Sens. Environ. 2003, 87, 273–282. [Google Scholar] [CrossRef]
- Xie, Y.; Qu, J.J.; Xiong, X.; Hao, X.; Che, N.; Sommers, W. Smoke plume detection in the eastern United States using MODIS. Int. J. Remote Sens. 2007, 28, 2367–2374. [Google Scholar] [CrossRef]
- Li, Z.Q.; Khananian, A.; Fraser, R.H.; Cihlar, J. Automatic detection of fire smoke using artificial neural networks and threshold approaches applied to AVHRR imagery. IEEE Trans. Geosci. Remote 2001, 39, 1859–1870. [Google Scholar]
- Module, F.J.V. Atmospheric correction module: Quac and flaash user’s guide. Version 2009, 4, 44. [Google Scholar]
- Mao, K.; Qin, Z.; Shi, J.; Gong, P. A practical split-window algorithm for retrieving land-surface temperature from MODIS data. Int. J. Remote Sens. 2005, 26, 3181–3204. [Google Scholar] [CrossRef]
- McFeeters, S.K. The use of the Normalized Difference Water Index (NDWI) in the delineation of open water features. Int. J. Remote Sens. 1996, 17, 1425–1432. [Google Scholar] [CrossRef]
- Chuvieco, E.; Martin, M.P.; Palacios, A. Assessment of different spectral indices in the red-near-infrared spectral domain for burned land discrimination. Int. J. Remote Sens. 2002, 23, 5103–5110. [Google Scholar] [CrossRef]
- Smith, A.M.; Wooster, M.J.; Drake, N.A.; Dipotso, F.M.; Falkowski, M.J.; Hudak, A.T. Testing the potential of multi-spectral remote sensing for retrospectively estimating fire severity in African Savannahs. Remote Sens. Environ. 2005, 97, 92–115. [Google Scholar] [CrossRef]
- Trigg, S.; Flasse, S. An evaluation of different bi-spectral spaces for discriminating burned shrub-savannah. Int. J. Remote Sens. 2001, 22, 2641–2647. [Google Scholar] [CrossRef]
- Key, C.; Benson, N. Measuring and remote sensing of burn severity. In Proceedings of the Joint Fire Science Conference and Workshop, Boise, ID, USA, 15–17 June 1999; p. 284. [Google Scholar]
- Tucker, C.J. Red and photographic infrared linear combinations for monitoring vegetation. Remote Sens. Environ. 1979, 8, 127–150. [Google Scholar] [CrossRef]
- Huete, A.; Didan, K.; Miura, T.; Rodriguez, E.P.; Gao, X.; Ferreira, L.G. Overview of the radiometric and biophysical performance of the MODIS vegetation indices. Remote Sens. Environ. 2002, 83, 195–213. [Google Scholar] [CrossRef]
- Pinty, B.; Verstraete, M. GEMI: A non-linear index to monitor global vegetation from satellites. Plant Ecol. 1992, 101, 15–20. [Google Scholar] [CrossRef]
- Huete, A.R. A soil-adjusted vegetation index (SAVI). Remote Sens. Environ. 1988, 25, 295–309. [Google Scholar] [CrossRef]
- Heermann, P.D.; Khazenie, N. Classification of multispectral remote sensing data using a back-propagation neural network. IEEE Trans. Geosci. Remote 1992, 30, 81–88. [Google Scholar] [CrossRef]
- Goh, A.T. Back-propagation neural networks for modeling complex systems. Artif. Intell. Eng. 1995, 9, 143–151. [Google Scholar] [CrossRef]
- Rumelhart, D.E.; Hinton, G.E.; Williams, R.J. Learning Internal Representations by Error Propagation; California Univ San Diego La Jolla Inst for Cognitive Science: San Diego, CA, USA, 1985. [Google Scholar]
- Yu, C.-C.; Liu, B.-D. A backpropagation algorithm with adaptive learning rate and momentum coefficient. In Proceedings of the 2002 International Joint Conference on the Neural Networks, Honolulu, HI, USA, 12–17 May 2002; pp. 1218–1223. [Google Scholar]
- Key, C.H.; Benson, N.C. Landscape Assessment. In FIREMON: Fire Effects Monitoring and Inventory System; Department of Agriculture, Forest Service, Rocky Mountain Research Station: Fort Collins, CO, USA, 2006; pp. 1–55. [Google Scholar]
- Hall, J.V.; Loboda, T.V.; Giglio, L.; McCarty, G.W. A MODIS-based burned area assessment for Russian croplands: Mapping requirements and challenges. Remote Sens. Environ. 2016, 184, 506–521. [Google Scholar] [CrossRef]
- Brough, T.; Bridgman, C.J. An evaluation of long grass as a bird deterrent on British airfields. J. Appli. Ecol. 1980, 17, 243–253. [Google Scholar] [CrossRef]
- Tallgrass Prairie. Available online: https://en.wikipedia.org/wiki/Tallgrass_prairie (accessed on 20 December 2018).
- Miller, J.D.; Thode, A.E. Quantifying burn severity in a heterogeneous landscape with a relative version of the delta Normalized Burn Ratio (dNBR). Remote Sens. Environ. 2007, 109, 66–80. [Google Scholar] [CrossRef]
- Congalton, R.G.; Green, K. Assessing the Accuracy of Remotely Sensed Data: Principles and Practices; CRC Press: Boca Raton, FL, USA, 2008. [Google Scholar]
- Eva, H.; Lambin, E.F. Remote sensing of biomass burning in tropical regions: Sampling issues and multisensor approach. Remote Sens. Environ. 1998, 64, 292–315. [Google Scholar] [CrossRef]
- Justice, C.; Giglio, L.; Korontzi, S.; Owens, J.; Morisette, J.; Roy, D.; Descloitres, J.; Alleaume, S.; Petitcolin, F.; Kaufman, Y. The MODIS fire products. Remote Sens. Environ. 2002, 83, 244–262. [Google Scholar] [CrossRef]
- Pagano, T.S.; Durham, R.M. Moderate resolution imaging spectroradiometer (MODIS). In Proceedings of the Sensor Systems for the Early Earth Observing System Platforms, Orlando, FL, USA, 13–14 April 1993; pp. 2–18. [Google Scholar]
Figure 1.
The geographic location and the false-color composition RGB images of MODIS bands 7, 5 and 6 of the six wildfire cases.
Figure 1.
The geographic location and the false-color composition RGB images of MODIS bands 7, 5 and 6 of the six wildfire cases.

Figure 2.
The flowchart of the new burned area mapping method.

Figure 3.
False-color composition MODIS RGB image (red: 2.13 μm; green: 1.24 μm; blue: 1.64 μm) acquired from Range 12 Fire on 6 August 2016. Box 1 contains samples of burned area and unburned types while Box 2 contains only unburned samples.
Figure 3.
False-color composition MODIS RGB image (red: 2.13 μm; green: 1.24 μm; blue: 1.64 μm) acquired from Range 12 Fire on 6 August 2016. Box 1 contains samples of burned area and unburned types while Box 2 contains only unburned samples.
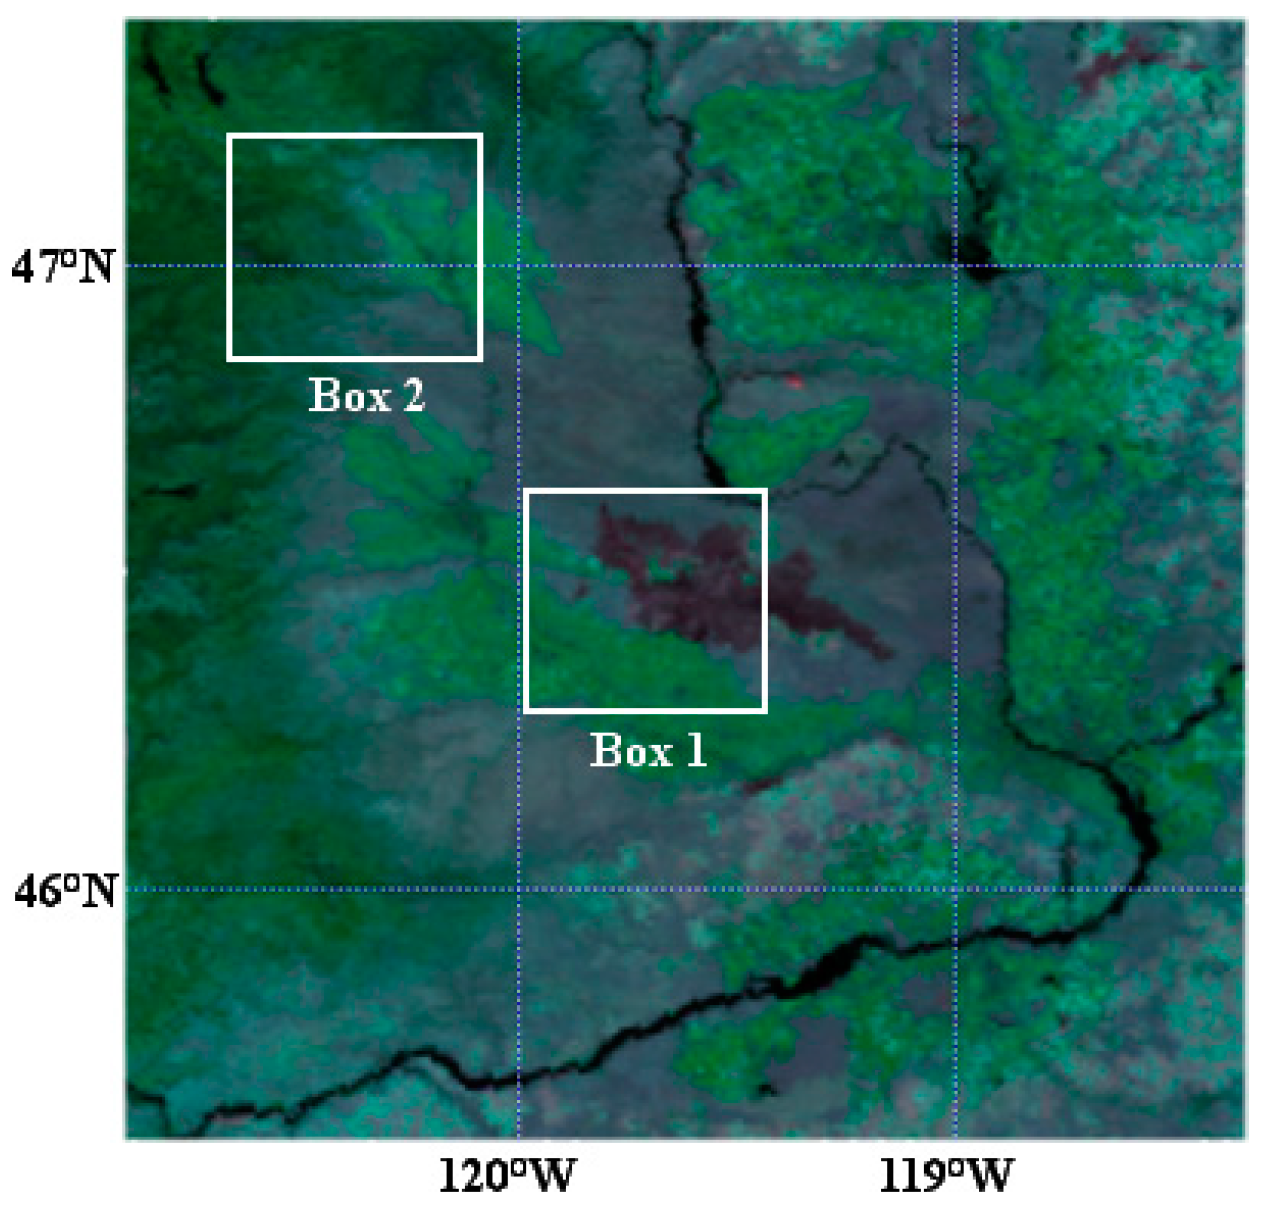
Figure 4.
Framework of the back-propagation neural network (BPNN) in our method.

Figure 5.
Relationship between the reflectance at MODIS band 5 (1.24 μm) and the reflectance at MODIS band 7 (2.13 μm) of the samples extracted in Range 12 Fire: (a) scatter plot of samples in Box 1; (b) scatter plot of samples in Box 2; (c) Combined scatter plot of (a) and (b).
Figure 5.
Relationship between the reflectance at MODIS band 5 (1.24 μm) and the reflectance at MODIS band 7 (2.13 μm) of the samples extracted in Range 12 Fire: (a) scatter plot of samples in Box 1; (b) scatter plot of samples in Box 2; (c) Combined scatter plot of (a) and (b).

Figure 6.
(a) Reflectance curve of the five typical types extracted from Hot Pot Fire; (b) separability index M of the three comparisons: burned area vs. shadow, burned area vs. bare soil, burned area vs. vegetation.
Figure 6.
(a) Reflectance curve of the five typical types extracted from Hot Pot Fire; (b) separability index M of the three comparisons: burned area vs. shadow, burned area vs. bare soil, burned area vs. vegetation.

Figure 7.
Separability index M of reflectance at band 5 for two comparisons (burned area vs. bare soil, burned area vs. vegetation) in the Hot Pot Fire, Range 12 Fire and Rey Fire.
Figure 7.
Separability index M of reflectance at band 5 for two comparisons (burned area vs. bare soil, burned area vs. vegetation) in the Hot Pot Fire, Range 12 Fire and Rey Fire.

Figure 8.
Separability index M of each spectral index on the comparisons between burned area and unburned types: (a) M results of Hot Pot Fire; (b) M results of Range 12 Fire; (c) M results of Rey Fire.
Figure 8.
Separability index M of each spectral index on the comparisons between burned area and unburned types: (a) M results of Hot Pot Fire; (b) M results of Range 12 Fire; (c) M results of Rey Fire.


Figure 9.
Results of burned area detection by the traditional empirical formula method. (a) Detected burned area in Hot Pot Fire; (b) detected burned area in Range 12 Fire.
Figure 9.
Results of burned area detection by the traditional empirical formula method. (a) Detected burned area in Hot Pot Fire; (b) detected burned area in Range 12 Fire.

Figure 10.
Change trends of commission error and omission error along with the thresholds of [0, 0.9] range in the wildfire cases using the proposed method.
Figure 10.
Change trends of commission error and omission error along with the thresholds of [0, 0.9] range in the wildfire cases using the proposed method.

Figure 11.
The pixel-wise comparison results of the MODIS-based and OLI-based burned area maps. The images on the left of (a) and (b) are the true-color composition RGB image of OLI bands 4, 3 and 2, while the images on the right side are the comparison results: the OLI burned area is symbolized by blue, MODIS burned area is red, and the agreement between them is purple. (a) OLI image on 17 August 2017 (path/row is 44/30) and the comparison result in Cinder Butte Fire; (b) OLI image on 27 September 2017 (path/row is 43/32) and the comparison result for Tohakum 2 Fire.

Figure 12.
(a), (c), (e), (g), and (i) are the false-color composition RGB images of MODIS bands 7, 5 and 6 in Hot Pot Fire, Range 12 Fire, Powerline Fire, Tohakum 2 Fire, and Cinder Butte Fire, respectively; (b), (d), (f), (h) and (j) are the proposed method’s detection results of the burned area for (a), (c), (e), (g) and (i), respectively.


Table 1.
The characteristics of the spectral bands used of MODIS and OLI sensors.
| Sensor, Satellite | Spectral Band | Bandwidth (μm) | Spectral Region | Spatial Resolution (m) |
|---|---|---|---|---|
| MODIS, Terra/Aqua | 1 | 0.62–0.67 | R | 250 |
| 2 | 0.841–0.876 | NIR | 250 | |
| 3 | 0.459–0.479 | B | 500 | |
| 4 | 0.545–0.565 | G | 500 | |
| 5 | 1.23–1.25 | NIR | 500 | |
| 6 | 1.628–1.652 | SWIR | 500 | |
| 7 | 2.105–2.155 | SWIR | 500 | |
| 9 | 0.438–0.448 | B | 1000 | |
| 19 | 0.915–0.965 | NIR | 1000 | |
| 31 | 10.78–11.28 | FIR | 1000 | |
| 32 | 11.77–12.27 | FIR | 1000 | |
| OLI, Landsat 8 | 3 | 0.53–0.59 | G | 30 |
| 4 | 0.64–0.67 | R | 30 | |
| 5 | 0.85–0.88 | NIR | 30 | |
| 6 | 1.57–1.65 | SWIR | 30 | |
| 7 | 2.11–2.29 | SWIR | 30 |
Abbreviations of spectral regions: B (blue), G (green), R (red), NIR (near infrared), SWIR (short wave infrared), and FIR (far infrared).
Table 2.
Detailed information of the wildfire cases and acquisition time of MODIS data.
| Wildfire Case | Duration | Acquisition Time of MODIS Data | Fuels Involved |
|---|---|---|---|
| Hot Pot Fire | 2 to 17 July 2016 | 7 July 2016 | brush, long and short grass |
| Range 12 Fire | 30 July to 29 August 2016 | 6 August 2016 | tall grass, brush and short grass |
| Rey Fire | 18 August to 15 September 2016 | 28 August 2016 | burned grass, brush, and oak canopy |
| Powerline Fire | 4 August to 25 September 2017 | 20 August 2017 | short grass, brush, dormant brush and hardwood slash |
| Tohakum 2 Fire | 29 August to 15 September 2017 | 5 September 2017 | short grass, brush, closed timber litter |
| Cinder Butte Fire | 2 August to 16 October 2017 | 18 August 2017 | short grass, dormant brush, hardwood slash |
Table 3.
Multiple threshold criteria used to extract samples of unburned types and water masking.
| Type | Multiple Threshold Criteria | References |
|---|---|---|
| Vegetation | [42] | |
| Cloud | ( and ) or () or () | [43,44] |
| Bare soil | () and () | [45] |
| Water | () and () and () and () | [31,49] |
ρi and BTi refer to the reflectance and brightness temperature of band i respectively.
Table 4.
Formula of the spectral indices used and corresponding reference.
| Spectral Index | Formula | Reference |
|---|---|---|
| Burned Area Index | [50] | |
| Char Soil Index | [51] | |
| Mid Infrared Burn Index | [52] | |
| Normalized Burn Ratio | [53] | |
| Normalized Difference Vegetation Index | [54] | |
| Enhanced Vegetation Index | [55] | |
| Global Environment Monitoring Index | with | [56] |
| Soil Adjusted Vegetation Index | [57] | |
| burn-sensitive Vegetation Index | [16] | |
| NIR-SWIR-emissivity Version 1 | [22] | |
| NIR-SWIR-emissivity Version 2 | ||
| NIR-SWIR-Ts Version 1 | ||
| NIR-SWIR-Ts Version 2 |
The subscript of each spectral index corresponds to the spectral band of MODIS sensor. ρi represents the reflectance of band i, E represents the emissivity, Ts refers to the land surface temperature.
Table 5.
Empirical formula and coefficients α and β of the three wildfire cases.
| Empirical Formula | Coefficient | Hot Pot Fire | Range 12 Fire | Rey Fire |
|---|---|---|---|---|
| α | 1.04 | 1.079 | 0.75 | |
| β | 0.02 | −0.003 | 0.06 |
ρi is the reflectance of MODIS band i, α is the slope of the line, β is the y-intercept of the line.
Table 6.
Average error matrix of accuracy assessment by a 10-fold cross-validation method. (The values are the mean and its standard deviations; the columns of the error matrix represent the actual types, and the rows represent the predicted types of the proposed method.).
Table 6.
Average error matrix of accuracy assessment by a 10-fold cross-validation method. (The values are the mean and its standard deviations; the columns of the error matrix represent the actual types, and the rows represent the predicted types of the proposed method.).
| Type | Burned | Unburned | Average OE | Average CE |
|---|---|---|---|---|
| Burned | 120.90 ± 1.92 | 0.10 ± 0.30 | 2.72% ± 1.96% | 0.08% ± 0.25% |
| Unburned | 4.10 ± 1.92 | 250.90 ± 0.30 | 0.04% ± 0.12% | 1.33% ± 0.95% |
| average OA | 98.68% ± 0.94% | |||
| average K | 97.46% ± 1.27% | |||
OE: omission error, CE: commission error, OA: overall accuracy, K: Kappa coefficient.
Table 7.
Information of the used Landsat-8 OLI scenes and the CE and OE of the new method in the four wildfire cases.
Table 7.
Information of the used Landsat-8 OLI scenes and the CE and OE of the new method in the four wildfire cases.
| Fire | Landsat Scenes | CE | OE | ||
|---|---|---|---|---|---|
| Period | Path/Row | Acquisition Date | |||
| Hot Pot Fire | pre-fire | 41/31 | 22 June 2016 | 9.88% | 10.31% |
| 41/32 | |||||
| post-fire | 41/31 | 8 July 2016 | |||
| 41/32 | |||||
| Range 12 Fire | pre-fire | 45/27 | 20 July 2016 | 16.15% | 14.29% |
| 45/28 | |||||
| post-fire | 45/27 | 5 August 2016 | |||
| 45/28 | |||||
| Cinder Butte Fire | pre-fire | 44/30 | 1 August 2017 | 8.07% | 8.07% |
| post-fire | 44/30 | 17 August 2017 | |||
| Tohakum 2 Fire | pre-fire | 43/32 | 26 August 2017 | 14.40% | 17.16% |
| post-fire | 43/32 | 27 September 2017 | |||
© 2019 by the authors. Licensee MDPI, Basel, Switzerland. This article is an open access article distributed under the terms and conditions of the Creative Commons Attribution (CC BY) license (http://creativecommons.org/licenses/by/4.0/).
Share and Cite
MDPI and ACS Style
Ba, R.; Song, W.; Li, X.; Xie, Z.; Lo, S. Integration of Multiple Spectral Indices and a Neural Network for Burned Area Mapping Based on MODIS Data. Remote Sens. 2019, 11, 326. https://doi.org/10.3390/rs11030326
AMA Style
Ba R, Song W, Li X, Xie Z, Lo S. Integration of Multiple Spectral Indices and a Neural Network for Burned Area Mapping Based on MODIS Data. Remote Sensing. 2019; 11(3):326. https://doi.org/10.3390/rs11030326
Chicago/Turabian StyleBa, Rui, Weiguo Song, Xiaolian Li, Zixi Xie, and Siuming Lo. 2019. "Integration of Multiple Spectral Indices and a Neural Network for Burned Area Mapping Based on MODIS Data" Remote Sensing 11, no. 3: 326. https://doi.org/10.3390/rs11030326
Note that from the first issue of 2016, this journal uses article numbers instead of page numbers. See further details here.