Sensitivity Analysis of Machine Learning Models for the Mass Appraisal of Real Estate. Case Study of Residential Units in Nicosia, Cyprus


1
School of Architecture, Land & Environmental Sciences, Department of Real Estate, Neapolis University Pafos, 2 Danais Avenue, 8042 Pafos, Cyprus
2
Faculty of Engineering & Technology, Department of Civil Engineering & Geomatics, Cyprus University of Technology, P.O.Box 50329-3603, Limassol, Cyprus
*
Author to whom correspondence should be addressed.
Remote Sens. 2019, 11(24), 3047; https://doi.org/10.3390/rs11243047
Submission received: 30 October 2019
/
Revised: 13 December 2019
/
Accepted: 15 December 2019
/
Published: 17 December 2019
(This article belongs to the Special Issue Remote Sensing in Applications of Geoinformation)
Abstract
:A recent study of property valuation literature indicated that the vast majority of researchers and academics in the field of real estate are focusing on Mass Appraisals rather than on the further development of the existing valuation methods. Researchers are using a variety of mathematical models used within the field of Machine Learning, which are applied to real estate valuations with high accuracy. On the other hand, it appears that professional valuers do not use these sophisticated models during daily practice, rather they operate using the traditional five methods. The Department of Lands and Surveys in Cyprus recently published the property values (General Valuation) for taxation purposes which were calculated by applying a hybrid model based on the Cost approach with the use of regression analysis in order to quantify the specific parameters of each property. In this paper, the authors propose a number of algorithms based on Artificial Intelligence and Machine Learning approaches that improve the accuracy of these results significantly. The aim of this work is to investigate the capabilities of such models and how they can be used for the mass appraisal of properties, to highlight the importance of sensitivity analysis in such models and also to increase the transparency so that automated valuation models (AVM) can be used for the day-to-day work of the valuer.
1. Introduction
1.1. Background of the Study
Machine Intelligence imitates human perception, by utilizing mathematical models that compete against humans to deliver certain tasks such as the assessment and analysis of a studied system and predictions of out-of-sample observations. The accomplished tasks can be highly complex, based on mathematical models which simulate a physical, social, financial and so forth, system of study [1,2]. Machine learning algorithms belong to the wider thematic area of Artificial Intelligence, with applications in Healthcare [3], Automotive (self-driving cars) [4], Finance and Economics (predictions, assets management) [5], Military (drones capable of autonomous action) [6], Advertising (predict/quantify the behaviour of customers) [7], Image Recognition [8], and so forth. The idea that machines could exhibit intelligence is not a new concept, rather it stems from ancient times [9], for example, the robot Talos made by Hephaestus in Ancient Greek Mythology [10]. A bibliometric study of Artificial Intelligence Algorithms in Mass Appraisals Research [11] revealed that complex methods are increasingly considered in Real Estate predictions, in contrast to the well-established five methods for valuations.
At this point, it should be noted that remote sensing, aerial or oblique photos can be used in order to obtain this information automatically (this research paper though, only focuses on the mathematical modelling of price prediction. It should also be noted, however, that professional valuers hesitate to utilize such algorithms [12], and certain questions arise concerning the application of mathematical models for the improvement of the valuer’s work. Questions such as, whether Machine Intelligence can replace Human Intelligence, if the mathematical models can replace the judgment of the individual valuer, and who would sign the outcome of an Automated Valuation Model are commonly debated topics. Yann LeCun quoted: “Our intelligence is what makes us human, Artificial intelligence is an extension of that quality. Many discussions have been had over recent years about whether there shall be a limit to restrict artificial intelligence and which level of artificial intelligence is optimal”. Merriam-Webster [13] would add that AI can perform tasks that a human is unable to perform either at the same pace, quality, at the same cost or at all. The question arises whether artificial intelligence can replace the human valuer, taking into consideration computer-assisted mass appraisal (CAMA) and automated valuation models (AVM). It needs to be stated that, within the environment of appraisals, CAMA and AVM have been used since as early as the 1950s [14], and were further developed in the 1960s.
1.2. State of the Art
It appears that machine intelligence up until today can only successfully replace humans in the execution of specific tasks [15,16] which are often repetitive, dull and time-consuming [17]. Typical examples of Machine Intelligence for the case of Real Estate Valuations could be the collection of comparable evidence, automated exclusion of incorrect registrations in a database (anomaly detection) [18], calculation of the uncertainty of prediction in each particular chosen region through the computation of the local outliers and calibration of the prediction according to spatial parameters [19]. Contradictory, Artificial Intelligence cannot be considered to accurately understand specific property characteristics regarding the quality of construction, aesthetic characteristics, design, internal materials and appliances, the view to sea or nature, the deterioration of specific structural elements, local price peaks where comparable evidence is not available, property ownership issues (shares of ownership, rights of use etc.) and tax, legal or governmental special cases, because such models are complex and incomprehensible [20].
Artificial intelligence and machine learning methods have been widely utilized in Real-Estate, and a variety of studies have been performed. In Reference [21] the Hierarchical Linear Model is utilized in Mass appraisals of residential properties, to overcome the limitations of traditional econometric models such as Ordinary Least Squares. The absence of data of comparable properties is a major issue, while the consideration of micro- & macro- level characteristics of the properties should be considered [22]. In Reference [23], the spatial and temporal variation of properties is investigated, by a regression-cokriging method. However, to the best of our knowledge, no study exists on the interpretation of the black-box machine learning models, regarding Real Estate Mass Appraisals.
The purpose of this study is to investigate how the complex, machine learning models work, regarding Real Estate price predictions, and present the various models and the corresponding results. In Section 2, we explain the analyzed dataset as well as it variables, followed by the Machine Learning Methods utilized for the target task, as well as the generic algorithm to obtain the closed-form formula for the Higher Order Regression Model, via an automated, step-wise method. In Section 3, we present the sensitivity analysis results of the predictors, regarding Real Estate prices. In Section 3.3, the influence of the dataset volume is also investigated, by a parametric study, for a variety of partitions of the given dataset. In Section 3.4, we present the obtained formulas, utilizing five (5), and ten (10), and in Appendix A.1, for one hundred (100) nonlinear terms.
2. Comparable Evidence and Methods
2.1. Database, Pre-Processing, Methods and Performance Metrics
The studied database was obtained from the Department of Lands and Surveys (DLS). The data were used for the purposes of the Cyprus new general valuation [24] and refers to transactions between 2008 and 2014, out of which only transactions for apartments in Nicosia District were studied. Although it does not contain important socioeconomic variables [25], it is considered as vastly useful by professional valuers, as it contains comparable evidence about certain property types. Hence, the level of information available for the valuer could be greatly enhanced; however, the reliable exploitation of the contained information remains vague. A significant effort was spent in order to prepare the database in a predictors-output format. At this point, the authors highlight that the data would be significantly enhanced if remote sensing was integrated in order to enrich the database provided that was completed by on-site or drive-by observations.
In particular, 4261 observations of apartment/office sales in Nicosia existed, nevertheless from column Unit_desc, only values “APPARTMENT & 2-FLOOR APPRTMENT” were kept, resulting in 3786 remaining observations. Furthermore, only Municipalities that are regulated by the Nicosia Local Town Plan were selected, those Quarters with less than 20 observations were deleted and, finally, 3561 sales data were used for the analysis and predictions. In order to enhance the prediction accuracy of the models, Urban Planning data were added for each Planning Zone, and in particular, the maximum building density, the number of stories, height and coverage of the allowed building, the minimum sq.m. per resident and the expected sq.m. per resident. Due to multicollinearity among urban planning variables, only the maximum building density was finally kept. The transaction dates were converted to reflect the date 30 September 2018, as floating numbers constituting a continuous variable, and the prices were adjusted to 1 January 2013 utilizing the Central Bank of Cyprus Index. This index is using property data gathered from valuations submitted to the contracted banks since 2006. The relevant information is provided from independent property surveyors that evaluate properties mainly for mortgage purposes such as housing loans, mortgage refinancing and mortgage collateral.
The utilized variables were as follows, with their abbreviations in parentheses, for each Unit (Appartment)
- Unit Enclosed extent, which is the Internal Area in m (IntArea).
- The Unit covered extent, which is the Area of covered verandahs in m (CovVer).
- The Unit uncovered extent, which is the Area of uncovered verandahs in m (UnCovVer).
- Parcel extent, that is the Area of parcel (or plot) in m (ParcExt).
- The Built Years, calculated as the difference among the date the transaction happened and the date the building was constructed, in years (BuiltYrs).
- The Unit condition code (Cond), that denotes the condition of the building, and takes values from 1 (best condition) to 4 (worst condition).
- The Unit’s view code (View), which denotes the view of the unit, with values from 1 (best view) to 4 (worst view).
- The Unit’s class code (Class), denoting the class of the building. It takes Values from 1 (best class) to 4 (worst class).
- Density (Dens), as the maximum allowed density (built m, over plots m) of the specific district.
The dependent variable was the apartment’s price as accepted by the Cyprus Department of Lands and Surveys. This price was adjusted by utilizing the Central Bank of Cyprus Index and the dates were transferred to 30 September 2018. The abbreviation for the dependent variable is (Adj. Accepted Price).
2.2. Error Metrics
Machine learning methods exhibit diverse performance on a studied dataset, with respect to the error metrics each time utilized. The Coefficient Of Dispersion (COD) was used (Equation (1)) as defined by Appraisal Ratio Studies [26], as a common metric utilized in Real Estate Appraisals. It is based on the Predicted Values (PV), the Dependent Variable (DV), and the number of observations N. COD is defined by . Furthermore, the utilized error metrics were the Root Mean Squared Error , the Mean Absolute Error , the Mean Absolute Percentage Error , the Maximum Absolute Percentage Error (MAXAPE), as well as the Pearson Correlation Coefficient , the slope of the Predicted versus Actual values , such that , and the .
2.3. Anomaly Detection
Although the observations in the studied database regard official registration in the DLS, some extremely unreasonable records occur. For example, property in Nicosia Municipality, Ag. Andreas Quarter, built in 1965, with 66 sq.m covered area, and a price of 3.524€, Latsia/Ag. Georgios (1977), 68 sq.m, with a price of 17.781€, Nicosia/Ag. Omologites (1982), 44 sq.m, 15.724€, Nicosia/Ag. Antonios (1973), 35 sq.m, 22.562€, and. Strovolos/Chryseleousa (1986), 76 sq.m, 17.283€. Accordingly, an iterative procedure was implemented in order to identify the outliers and eliminate at each step the observation which violates a specified threshold. The corresponding results were highly enhanced, as even for the Linear Regression (LR) (Figure 1) the R squared was increased from 0.611 to 0.744, while the shape of the scattered observations is closer to a straight line after the removal of the outliers.
Algorithm 1 was selected in order to exclude observations with high prediction errors, as they represent apartments which were under- or over- priced by the DLS, for some particular reason. The algorithm was selected amongst others because it presented better results in terms of percentage errors that are more easily understood by property professionals.
| Algorithm 1:Anomaly Detection |
 |
2.4. Machine Learning Methods
In order to evaluate more complex models, apart from Multiple Linear Regression (MLR), a Higher Order, Nonlinear Regression (NLR) was implemented. In particular, all combination of the variables were created, up to third order
with for all the nine independent variables. Afterwards, a forward step-wise algorithm was implemented, in order to sequentially add to the model the combined variable with , which corresponds to the model with the lowest . Algorithm 2 represent the applied procedure.
| Algorithm 2:Step-wise, Higher Order Regression |
 |
3. Results
3.1. Regression Analysis
The regression results are presented in Table 1 for the four methods studied and the corresponding error metrics.
3.2. Sensitivity Analysis
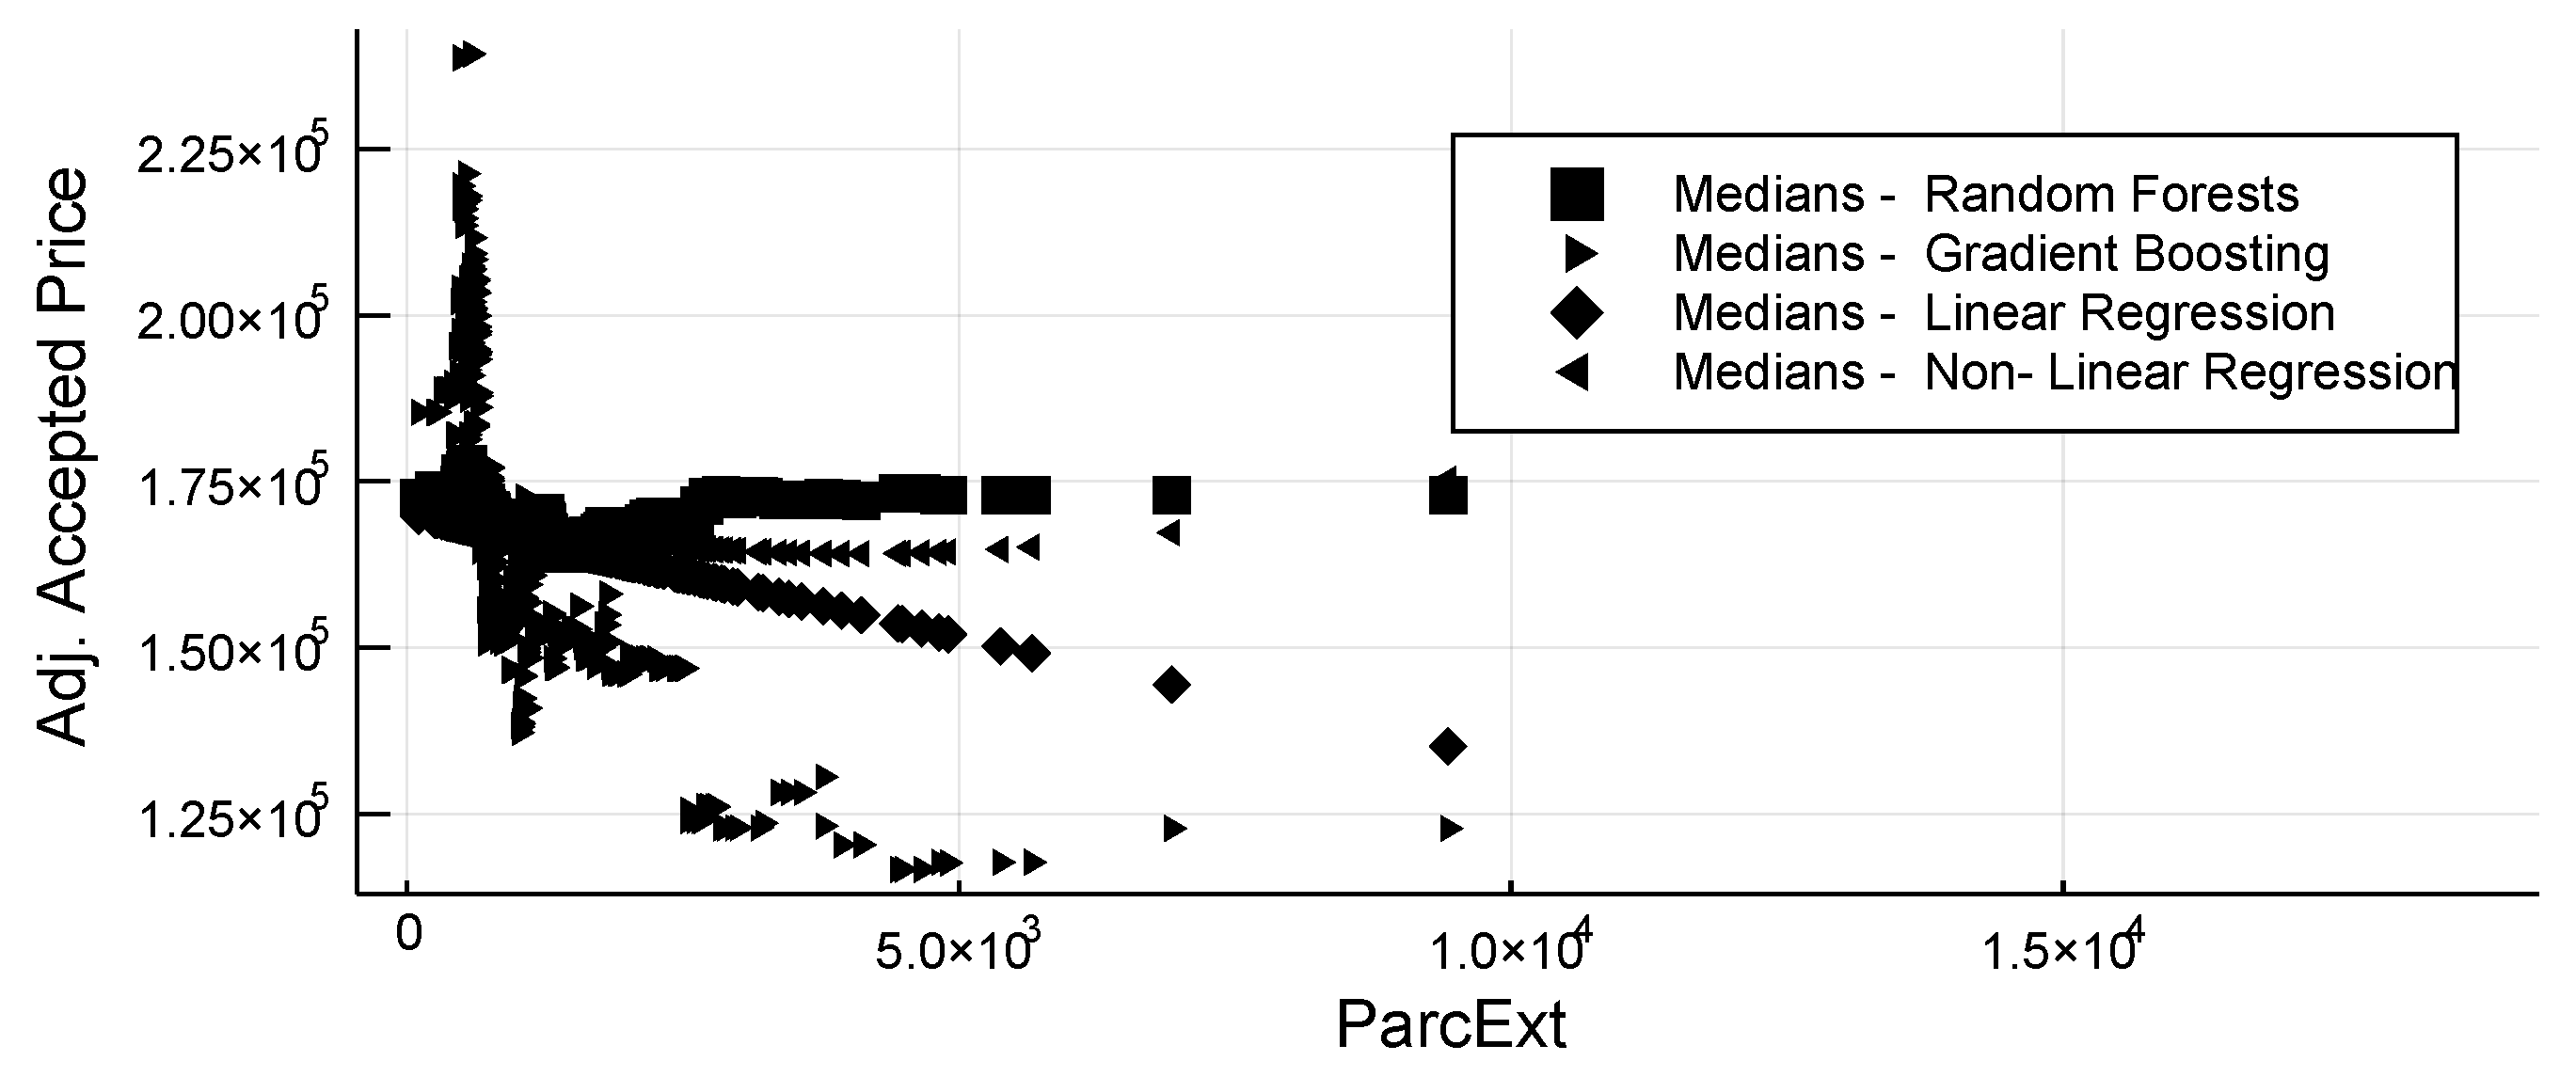
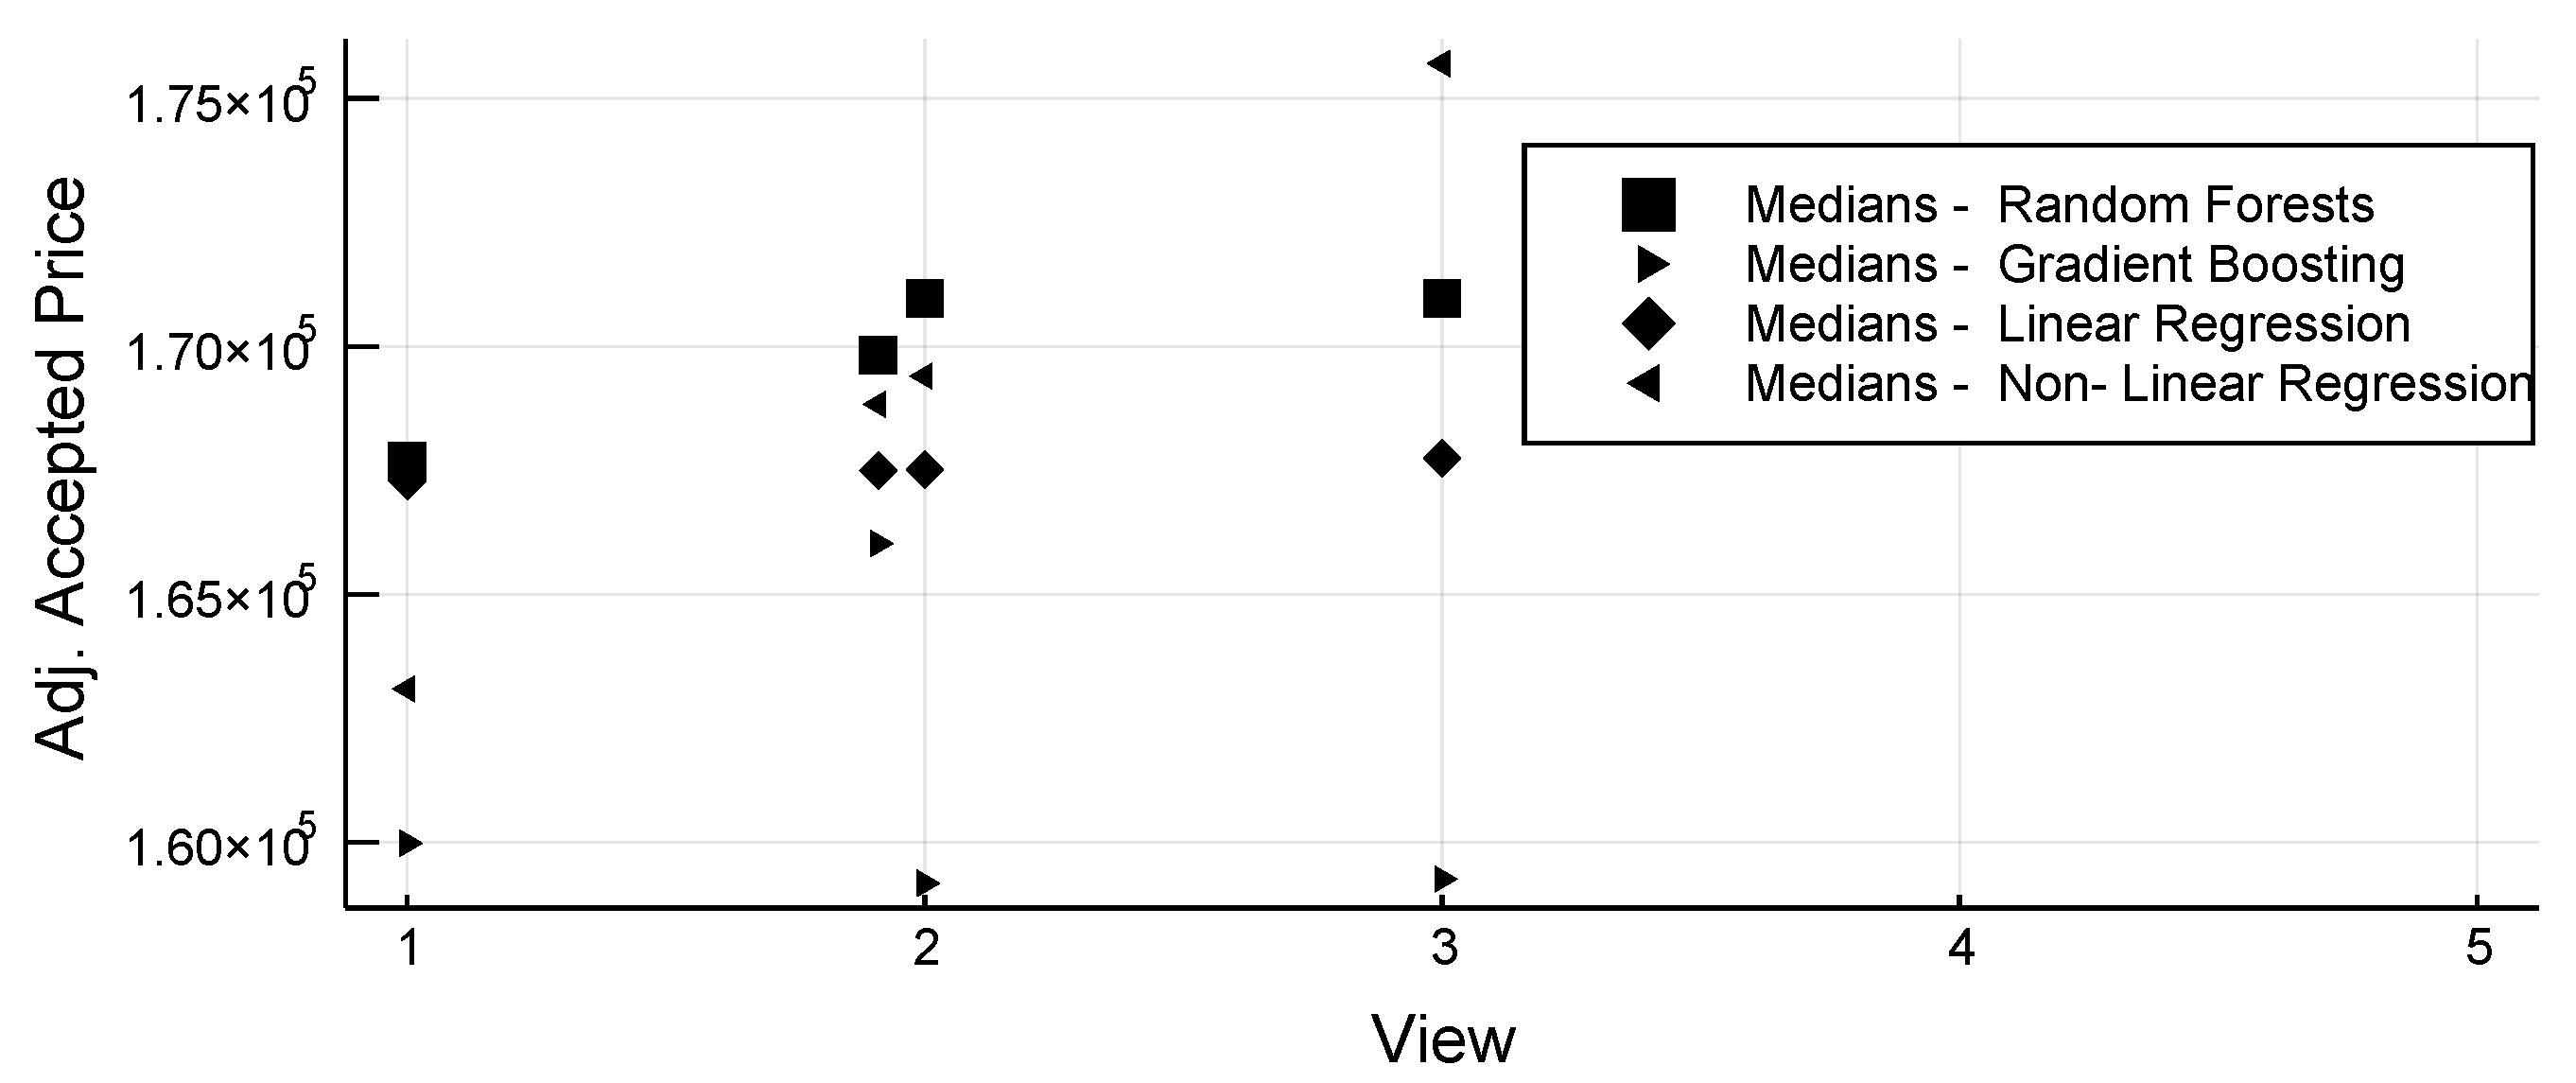
A modified version of the Profile method [31,32] is utilized, in order to investigate the contribution of each independent variable to the dependent variable. In particular, each input variable varies within its given (raw) range while all the other input variables are kept constant in a certain value. This constant takes three discrete values: 25% Percentile, Median, 75% Percentile. Through Sensitivity Analysis, the comparison of the black-box models can be illuminated, as we compare the effect of a predictor (i.e., Unite Enclosed Extent in Figure 2) to the studied variable (Adj. Accepted Price), indicating a decreasing pattern for IntArea higher than 180 m, which cannot be identified with the Linear Model. Accordingly, in Figure 3, the Adj. Accepted Price is being decreased with respect to the built years; however, the Machine Learning models concur that this effect is weakens for built years more than 30. However, although all models exhibit similar patterns, different sensitivity curves are obtained for each model. This effect indicates the complexity of such models, which should be utilized critically, or as ensembles [33]. The complete presentation of the Sensitivity Analysis Figures for all predictors is presented in Appendix A.
3.3. How Much Data Is Big Enough?
A common problem in simulation with Machine Learning Methods is the amount of data. In order to investigate the importance of the data volume to the accuracy of prediction, we utilized random portions of the dataset and each time we fitted a Random Forests model to the partition of the data. In Figure 4 we present the corresponding Mean Absolute Percentage Errors concerning the number of observations. Afterwards, we fit a logarithmic curve:
to the obtained results, and extended the curve up to 5000 observations from the results we see that the number of data is an important factor influencing the prediction accuracy, with a clear decreasing pattern.
3.4. Prediction Formula
With nonlinear Regression, we obtain the following Equations for the prediction:
(A) With five terms (MAE=23993€)
(B) With ten terms (MAE=23748€, also used in sensitivity)
4. Discussion
Sensitivity analysis for features’ importance to the dependent variable (Adj. accepted Price), demonstrated similar patterns, for all the four methods used. However, Certain differences were also depicted, which highlights the need for such analyses on the trained machine learning models. The accurate modelling of a studied system is challenging, and its predictive value is controversial [12,34], while the hopeful prospects that computers and refined models, will accomplish high prediction accuracy, were repeatedly defeated [1]. The utilization of a more accurate model instead of empirical rules exhibited enhanced prediction accuracy in property valuations. However, mathematical models without error estimation could jeopardize valuations hence we recommend that one obtains an initial estimation +/− a prediction error, as well as comprehensively investigating the errors’ extrema and distributions. Machine learning algorithms can be used to validate professional valuations and not to replace human judgment, in order to avoid the impact of the highly improbable [35].
The outermost important factors that the authors recommend to be examined are Time, Money, Quality, Accuracy, Bureaucracy, Responsibility, Regulations, Licenses, Initial cost, Neutrality and available data. Every single property valuation is a unique project and has a clear starting and ending date. Manual valuations are usually resourced intensive for both time and money and often deliver results in crucial revaluations later or sometimes never (Quevara [36]). In a project, there is always a trade-off between Time, Money and Quality. Increasing one of the factors almost automatically decreases the remaining two. For example, a valuer who tries to complete more valuations within a given period, either must decrease the quality of each valuation to be faster per valuation or must hire more staff to deliver more valuations. AI does not have any of these constraints. It can work 24/7 and with the correct data, can produce a theoretically infinite amount of valuations. Practically, the amount is limited to the available data as well as the input of this data by a human source.
In the above paragraph, data has been mentioned as an important component. CAMA and AVM can only exhibit high computational efficiency if the database contains adequate data. Theoretically, one could state that if no data is available, AI could not be used. On the other hand, without precise data, any human-based valuation would not be very precise either. It takes years of studying and obtaining practical experience as well as local market knowledge for a valuer to be able to deliver accurate valuations and appraisals. This process of learning is time-consuming and rather expensive. AI can do so within a short period of time and can improve its performance based on past observations. Due to that, human valuers are expensive. AI can offer a much less expensive rate for any valuation since cost such as travel time and travel expenses to the property can be saved. However, AI has a higher initial cost as it is expensive to set up a model. The maintenance of the database and feeding the AI model with more data are usually the highest running expenses. Any invention that may replace workers with machines in a particular field can have a positive effect on society by “reducing the price of goods, increasing real income” [37]. Research conducted in this context suggests that the methods, currently used extensively, have inherent errors regarding how they derive their value estimates [38]. Many scientists stated that feelings and sympathy are what make us humans. These are unarguably great assets of every human; however, in valuations, they can create inaccuracies due to the loss of neutrality. Humans can only control their doings up to a certain level. AI does not lose neutrality and hence accuracy, due to sympathy, therefore, in this aspect it can create more accurate valuations.
Carrying out an official valuation requires, in almost every country, a license. These licenses are often provided by human-based associations. Often political reasons block any technological process as some humans fear losing their job to AI. This political lobbying reduces progress considerably and by doing so the human valuer is heavily favoured. Human valuers often argue about the responsibility and legal pursuit of AI. A valuation carried out by a human valuer can always be challenged and one can sue the person who completed the valuation but the questions to be answered are—who do you sue when a CAMA valuation is in question, and who signs a CAMA valuation. The above two questions can unfortunately not be answered easily. Looking for the responsible party of a CAMA valuation is a tricky process, which is one of the major drawbacks of AI. However, if we feed the AI model with enough data and constantly maintain and update the database, the possible margin of error shall be small enough to be negligible, and costly legal processes could be avoided or minimized. Besides that, we must understand in which situations we value properties and if all valuations need to be legally appropriate in terms of responsibility and suitability. Nowadays, countless valuations are done daily; mostly valuations for courts or banks giving out mortgages or attempting to repossess distressed/mortgaged assets, but there are so many more valuations conducted for many other reasons.
All the explanations described in the above paragraph could be ideal situations for the use of AI, in order to provide cheaper and faster valuations. Having this kind of valuation completed by AI models would, of course, reduce the total number of valuations completed by human valuers. However, it has to be stated that the effect of artificial intelligence on the level of human employment will be dramatic reduced [39]. This, however, does not necessarily mean that any human valuer should lose their job. It could mean the opposite. Human valuers could focus more on each valuation, automatically increasing the quality of every valuation completed by a human valuer. Special reference must be made to complex valuations where a valuer needs a lot of time to fully understand and adjust the influencing factors. By giving human valuers more time to focus on these complex valuations and valuations for bank lending or repossessing purposes, increases the quality significantly. The improvement of quality will automatically lead to a higher achieved price per valuation which could, in the end, create higher profits for any valuer.
Remote Sensing Integration in Mass Appraisals
Remote sensing is another important tool that can be used in Mass Appraisals and data collection. In remote sensing, information about a given category of property is acquired without necessarily visiting the property [40]. According to Nayak and Zlatanova [41], remote sensing experts establish GIS systems that are often utilized. Remote sensing makes it possible to determine the attributes of a property such as its location, lot size, and type of structures that have been erected on the land. This is especially helpful because some property may be located in areas where access is restricted, as mentioned by Xiao-sheng, Zhe and Ting-li [42]. Remote sensing makes the identification of property easier because in the remote sensing developed maps, property lines can be drawn that show the exact location of the property [43]. Remote sensing can also be used to provide measures for a number of dependent variables, which are linked to human activity, especially with regards to the environmental impacts of various social, economic, as well as, demographic processes. For instance, remote sensing observations of land cover may depict the footprints of agricultural intensification, the expansion of urban areas, as well as road development and many other factors that are affecting the value of properties. These may also entail observations of vegetation density that may be linked to the impacts of fertilization, irrigation, coupled with other agricultural practices. Other areas may cover observations of new buildings constructions that are related to mass appraisals. Therefore, models that combine remote observations with ground-based social data may be very important in understanding their market value.
5. Conclusions
Machine learning models are highly non-transparent and it is difficult to completely understand what affects the value of a particular property the most. We defeat this issue by detailed sensitivity analysis for each predictor, by utilizing and comparing four machine learning models. Further studies in this sector need to be carried out in order to improve the overall transparency of any model used. However, Machine learning models are characterized by a consistent error across all the given observations, which follows a known statistical distribution, while valuations completed by human valuers might contain different types and magnitude of biases. The models would be even more precise if the database was enriched with more data that are related to the characteristics of the property. The easiest and cheapest way to get these data today is through satellite imagery. Data such as elevation, building height, age, construction type and distance from value influence centers such as schools, hospitals, public transportation and so forth, or even pollution or air quality in the area under study can be collected from satellites. Lastly, with machine learning techniques, important constraints have been identified such as the transparency of models and the repeatability of the results [14]. Especially in Cyprus, larger-scale tests on still needed to be completed repeatedly. Finally, machines have already taken over a lot of jobs that were previously carried out by humans and every time we got to a point where the chance that humans could lose jobs, more jobs were created thereby increasing prosperity and the quality of life for humans. Machines assist us and improve our lives. Coming back to the starting quote, machines, and especially AI as described above, are capable of increasing our quality of intelligence as humans.
Author Contributions
T.D. conceived of the presented idea and wrote the main part of the manuscript. N.B. performed the computations and wrote the relevant part. T.D. interpreted the numerical results.
Funding
This research received no external funding.
Acknowledgments
Special thanks to Varnavas Pashoulis from the Department of Lands and Surveys, who helped us to gain access to the dataset used in this research paper. Also to D.G. Hadjimitsis for his continuous support.
Conflicts of Interest
The authors declare no conflict of interest.
Appendix A
Appendix A.1. Prediction Formula with 100 terms (MAE = 19694€)
Figure A1.
Sensitivity Analysis for Unit Class.

Figure A2.
Sensitivity Analysis for Unit Condition Code.

Figure A3.
Sensitivity Analysis for Unit Covered Extent.

Figure A4.
Sensitivity Analysis for Density.

Figure A5.
Sensitivity Analysis for Parcel Extent.

Figure A6.
Sensitivity Analysis for Uncovered Extent.

Figure A7.
Sensitivity Analysis for View.

References
- Makridakis, S.; Bakas, N. Forecasting and uncertainty: A survey. Risk Decis. Anal. 2016, 6, 37–64. [Google Scholar] [CrossRef] [Green Version]
- Bakas, N.P. Numerical Solution for the Extrapolation Problem of Analytic Functions. Res. 2019, 2019, 1–10. [Google Scholar] [CrossRef] [PubMed] [Green Version]
- Jiang, F.; Jiang, Y.; Zhi, H.; Dong, Y.; Li, H.; Ma, S.; Wang, Y.; Dong, Q.; Shen, H.; Wang, Y. Artificial intelligence in healthcare: past, present and future. Stroke Vasc. Neurol. 2017, 2, 230–243. [Google Scholar] [CrossRef] [PubMed]
- Pozna, C.; Antonya, C. Issues about autonomous cars. In Proceedings of the 2016 IEEE 11th International Symposium on Applied Computational Intelligence and Informatics (SACI), Timisoara, Romania, 12–14 May 2016; pp. 13–18. [Google Scholar]
- Gupta, S.; Sharma, A.; Abubakar, A. Artificial intelligence–driven asset optimizer. In Proceedings of the SPE Annual Technical Conference and Exhibition, Dallas, TX, USA, 24–26 September 2018. [Google Scholar]
- De Swarte, T.; Boufous, O.; Escalle, P. Artificial intelligence, ethics and human values: The cases of military drones and companion robots. Artif. Life Robot. 2019, 24, 291–296. [Google Scholar] [CrossRef]
- Olson, C.; Levy, J. Transforming marketing with artificial intelligence. Appl. Mark. Anal. 2018, 3, 291–297. [Google Scholar]
- Zadeh, L.A.; Tadayon, S.; Tadayon, B. System and Method for Extremely Efficient Image and Pattern Recognition and Artificial Intelligence Platform. U.S. Patent App. 15/919,170, 3 December 2018. [Google Scholar]
- Cave, S.; Dihal, K. Ancient dreams of intelligent machines: 3,000 years of robots. Nature 2018, 559, 473–475. [Google Scholar] [CrossRef]
- MAYOR, A. Gods and Robotss: Myths, Machines, and Ancient Dreams of Technology; Princeton University Press: Princeton, NJ, USA, 2018. [Google Scholar] [CrossRef]
- Dimopoulos, T.; Bakas, N. An artificial intelligence algorithm analyzing 30 years of research in mass appraisals. Reland Int. J. Real Estate & Land Plan. 2019, 2, 10–27. [Google Scholar]
- Dimopoulos, T.; Tyralis, H.; Bakas, N.P.; Hadjimitsis, D. Accuracy measurement of Random Forests and Linear Regression for mass appraisal models that estimate the prices of residential apartments in Nicosia, Cyprus. Adv. Geosci. 2018, 45, 377–382. [Google Scholar] [CrossRef] [Green Version]
- Merriam Webster; Merriam Webster: Miami, FL, USA, 2016.
- Worzala, E.; Lenk, M.; Silva, A. An exploration of neural networks and its application to real estate valuation. J. Real Estate Res. 1995, 10, 185–201. [Google Scholar]
- Brynjolfsson, E.; Mitchell, T.; Rock, D. What Can Machines Learn, and What Does It Mean for Occupations and the Economy? Aea Pap. Proc. 2018, 108, 43–47. [Google Scholar] [CrossRef] [Green Version]
- Pagano, D. Machine Learning Will Replace Tasks, Not Jobs, Say MIT Researchers. MIT News, 26 June 2018. [Google Scholar]
- Bryson, J.J. Robots should be slaves. In Close Engagements with Artificial Companions: Key Social, Psychological, Ethical and Design Issues; University of Bath: Bath, UK, 2010; pp. 63–74. [Google Scholar]
- Agrawal, S.; Agrawal, J. Survey on anomaly detection using data mining techniques. Procedia Comput. Sci. 2015, 60, 708–713. [Google Scholar] [CrossRef] [Green Version]
- Dimopoulos, T.; Moulas, A. A proposal of a mass appraisal system in Greece with CAMA system: Evaluating GWR and MRA techniques in Thessaloniki Municipality. Open Geosci. 2016, 8, 675–693. [Google Scholar] [CrossRef]
- Chan, A.P.; Abidoye, R.B. Advanced property valuation techniques and valuation accuracy: Deciphering the artificial neural network technique. Reland Int. J. Real Estate & Land Plan. 2019, 2, 1–9. [Google Scholar]
- Arribas, I.; García, F.; Guijarro, F.; Oliver, J.; Tamošiūnienė, R. Mass appraisal of residential real estate using multilevel modelling. Int. J. Strateg. Prop. Manag. 2016, 20, 77–87. [Google Scholar] [CrossRef] [Green Version]
- Ciuna, M.; Milazzo, L.; Salvo, F. A mass appraisal model based on market segment parameters. Building 2017, 7, 34. [Google Scholar] [CrossRef]
- Chica-Olmo, J.; Cano-Guervos, R.; Chica-Rivas, M. Estimation of housing price variations using spatio-temporal data. Sustainability 2019, 11, 1551. [Google Scholar] [CrossRef] [Green Version]
- Cyprus New General Valuation 2013. 2013. Available online: https://portal.dls.moi.gov.cy/en-us/Pages/New-General-Valuation-as-at-1-1-2013.aspx (accessed on 1 June 2019).
- Lelo, K.; Tomassi, S.M.F. Urban inequalities in Italy: A comparison between Rome, Milan and Naples. Entrep. Sustain. Issues 2018, 6, 939–957. [Google Scholar] [CrossRef]
- NCSS Statistical Software. Appraisal Ratio Studies; NCSS: Kaysville, UT, USA, 2015. [Google Scholar]
- Breiman, L. Random forests. Mach. Learn. 2001, 45, 5–32. [Google Scholar] [CrossRef] [Green Version]
- Sadeghi, B. DecisionTree.jl. 2013. Available online: https://github.com/bensadeghi/DecisionTree.jl (accessed on 1 June 2019).
- Xu, B.; Chen, T. XGBoost.jl. 2014. Available online: https://arxiv.org/abs/1603.02754 (accessed on 1 June 2019).
- Bezanson, J.; Edelman, A.; Karpinski, S.; Shah, V.B. Julia: A fresh approach to numerical computing. Siam Rev. 2017, 59, 65–98. [Google Scholar] [CrossRef] [Green Version]
- Gevrey, M.; Dimopoulos, I.; Lek, S. Review and comparison of methods to study the contribution of variables in artificial neural network models. Ecol. Model. 2003. [Google Scholar] [CrossRef]
- Olden, J.D.; Jackson, D.A. Illuminating the “black box”: A randomization approach for understanding variable contributions in artificial neural networks. Ecol. Model. 2002. [Google Scholar] [CrossRef]
- Sagi, O.; Rokach, L. Ensemble learning: A survey. Wiley Interdiscip. Rev. Data Min. Knowl. Discov. 2018, 8, e1249. [Google Scholar] [CrossRef]
- Oreskes, N.; Shrader-Frechette, K.; Belitz, K. Verification, validation, and confirmation of numerical models in the earth sciences. Science 1994. [Google Scholar] [CrossRef] [PubMed] [Green Version]
- Lybeck, E. The black swan: The impact of the highly improbable. arXiv 2017, arXiv:1011.1669v3. [Google Scholar]
- Bird, R.; Slack, E.; Guevara, M. Real Property Taxation in the Philippines. In International Handbook of Land and Property Taxation; Edward Elgar Publishing: Cheltenham, UK, 2013. [Google Scholar] [CrossRef]
- Autor, D.H. Why Are There Still So Many Jobs? The History and Future of Workplace Automation. J. Econ. Perspect. 2015. [Google Scholar] [CrossRef] [Green Version]
- Ismail, S.; Buyong, T. Residential Property Valuation Using Geographic Information System; Bulgarian Geoinformation Company: Ovcha Kupel, Bulgaria, 1998. [Google Scholar]
- Frey, C.B.; Osborne, M.A. The future of employment: How susceptible are jobs to computerisation? Technol. Forecast. Soc. Chang. 2017. [Google Scholar] [CrossRef]
- Dimopoulos, T.; Labropoulos, T.; Hadjimitsis, D.G. Comparative analysis of property taxation policies within Greece and Cyprus evaluating the use of GIS, CAMA, and remote sensing techniques. Proc. SPIE Int. Soc. Opt. Eng. 2014, 9229, 92290O. [Google Scholar]
- Nayak, S.; Zlatanova, S. Remote Sensing and GIS Technologies for Monitoring and Prediction of Disasters; Springer: Berlin, Germnay, 2008. [Google Scholar]
- LIU, X.S.; Zhe, D.; WANG, T.L. Real estate appraisal system based on GIS and BP neural network. Trans. Nonferrous Met. Soc. China 2011, 21, s626–s630. [Google Scholar] [CrossRef]
- Lindgren, D. Land Use Planning and Remote Sensing; Taylor & Francis: New York, NY, USA, 1984; Volume 2. [Google Scholar]
Sample Availability: The dataset was provided from the Department of Lands and Surveys. |
Figure 1.
Accepted Price vs. Simulated for the test-set data.

Figure 2.
Sensitivity Analysis for Unit Enclosed Extent

Figure 3.
Sensitivity Analysis for Unit Built Years.

Figure 4.
Number of data importance


Table 1.
Regression Results for the four methods studied, and error metrics.
| Methods | MAE | RMSE | MAPE | MAXAPE | SR | COD | ||
|---|---|---|---|---|---|---|---|---|
| Train Set | ||||||||
| Random Forests | 0.914 | 17931.100 | 28854.237 | 0.111 | 1.307 | 1.031 | 0.739 | 10.778 |
| Gradient Boosting | 0.992 | 2630.784 | 8923.668 | 0.016 | 0.441 | 1.002 | 0.983 | 1.753 |
| Linear Regression | 0.863 | 24546.300 | 34745.422 | 0.151 | 0.550 | 1.027 | 0.746 | 14.703 |
| Non-Linear Regression | 0.880 | 23520.570 | 32700.793 | 0.146 | 1.100 | 1.032 | 0.775 | 14.197 |
| Test Set | ||||||||
| Random Forests | 0.877 | 20817.165 | 27950.722 | 0.134 | 0.802 | 1.040 | 0.753 | 12.950 |
| Gradient Boosting | 0.803 | 24485.519 | 35946.437 | 0.151 | 1.092 | 1.009 | 0.776 | 15.017 |
| Linear Regression | 0.858 | 22977.825 | 30047.707 | 0.146 | 0.506 | 1.025 | 0.789 | 14.279 |
| Non-Linear Regression | 0.862 | 22525.779 | 29500.974 | 0.144 | 0.552 | 1.032 | 0.761 | 13.984 |
© 2019 by the authors. Licensee MDPI, Basel, Switzerland. This article is an open access article distributed under the terms and conditions of the Creative Commons Attribution (CC BY) license (http://creativecommons.org/licenses/by/4.0/).
Share and Cite
MDPI and ACS Style
Dimopoulos, T.; Bakas, N. Sensitivity Analysis of Machine Learning Models for the Mass Appraisal of Real Estate. Case Study of Residential Units in Nicosia, Cyprus. Remote Sens. 2019, 11, 3047. https://doi.org/10.3390/rs11243047
AMA Style
Dimopoulos T, Bakas N. Sensitivity Analysis of Machine Learning Models for the Mass Appraisal of Real Estate. Case Study of Residential Units in Nicosia, Cyprus. Remote Sensing. 2019; 11(24):3047. https://doi.org/10.3390/rs11243047
Chicago/Turabian StyleDimopoulos, Thomas, and Nikolaos Bakas. 2019. "Sensitivity Analysis of Machine Learning Models for the Mass Appraisal of Real Estate. Case Study of Residential Units in Nicosia, Cyprus" Remote Sensing 11, no. 24: 3047. https://doi.org/10.3390/rs11243047
Note that from the first issue of 2016, this journal uses article numbers instead of page numbers. See further details here.