Finer Classification of Crops by Fusing UAV Images and Sentinel-2A Data


1
Institute of Agricultural Resources and Regional Planning, Chinese Academy of Agricultural Sciences, Beijing 100081, China
2
Key Laboratory of Agricultural Remote Sensing, Ministry of Agriculture, Beijing 100081, China
3
Center for Systems Integration and Sustainability, Michigan State University, East Lansing, MI 48823, USA
4
Department of Restoration Ecology and Built Environment, Faculty of Environmental Studies, Tokyo City University, 3-3-1 Ushikubo-nishi, Tsuzuki-ku, yokohama, Kanagawa 224-8551, Japan
*
Author to whom correspondence should be addressed.
Remote Sens. 2019, 11(24), 3012; https://doi.org/10.3390/rs11243012
Submission received: 19 October 2019
/
Revised: 4 December 2019
/
Accepted: 11 December 2019
/
Published: 14 December 2019
(This article belongs to the Special Issue Remote Sensing for Crop Mapping)
Abstract
:Accurate crop distribution maps provide important information for crop censuses, yield monitoring and agricultural insurance assessments. Most existing studies apply low spatial resolution satellite images for crop distribution mapping, even in areas with a fragmented landscape. Unmanned aerial vehicle (UAV) imagery provides an alternative imagery source for crop mapping, yet its spectral resolution is usually lower than satellite images. In order to produce more accurate maps without losing any spatial heterogeneity (e.g., the physical boundary of land parcel), this study fuses Sentinel-2A and UAV images to map crop distribution at a finer spatial scale (i.e., land parcel scale) in an experimental site with various cropping patterns in Heilongjiang Province, Northeast China. Using a random forest algorithm, the original, as well as the fused images, are classified into 10 categories: rice, corn, soybean, buckwheat, other vegetations, greenhouses, bare land, water, roads and houses. In addition, we test the effect of UAV image choice by fusing Sentinel-2A with different UAV images at multiples spatial resolutions: 0.03 m, 0.10 m, 0.50 m, 1.00 m and 3.00 m. Overall, the fused images achieved higher classification accuracies, ranging between 10.58% and 16.39%, than the original images. However, the fused image based on the finest UAV image (i.e., 0.03 m) does not result in the highest accuracy. Instead, the 0.10 m spatial resolution UAV image produced the most accurate map. When the spatial resolution is less than 0.10 m, accuracy decreases gradually as spatial resolution decreases. The results of this paper not only indicate the possibility of combining satellite images and UAV images for land parcel level crop mapping for fragmented landscapes, but it also implies a potential scheme to exploit optimal choice of spatial resolution in fusing UAV images and Sentinel-2A, with little to no adverse side-effects.
1. Introduction
Crop classification and identification is one of the classic research topics in the scientific community of remote sensing. Over the past decades, great efforts have been taken to develop multiple methods for crop classification using different remotely sensed data. These studies are generally focused on crop composition surveys and the classifications are conducted with the low (MODIS, AVHRR) and medium (Landsat, Sentinel, HJ, GF) spatial resolution data. In these instances, the crop distribution maps produced are at relatively large scales, ranging from global [1,2,3], national [4,5,6] and provincial [7,8,9] scales. These crop distribution maps have been widely used not only for crop growth monitoring [10,11], yield estimation [12,13] and water resources management [14,15] but also for decision-makers to develop policies to adjust the agricultural structure and ensure national food security [16].
Currently, as precision agriculture (e.g., site-specific crop management based on remote sensing) is gaining much more attention, there is an increasing need to produce highly accurate crop distribution maps. The recent development of satellite sensors and the improvement of computation power enable the classification of individual crops at the plot scale. Some studies have implemented crop classification based on high spatial resolution satellite images, such as QuickBird [17,18] and Google Earth [19]. However, satellites with high spatial resolution normally have long revisit periods. The effects of clouds and rain also make it difficult to collect clear satellite data for specific growth periods at the appropriate time point for crop identification. The rapid development of UAV technology provides an alternative to data acquisition. This aviation platform can quickly acquire data with high spatial resolution, short revisit period and minimal atmospheric effects. Most commercial UAV are equipped with digital cameras and can be relatively inexpensive. Yet, crop identification often requires multiple spectral data. Although a wide range of sensors, ranging from cameras over multispectral sensors to imaging spectrometers, are available for UAVs (unmanned aerial vehicles) today, their spectral calibration for sophisticated higher-level products requires additional effort. In addition to the needing to calibrate the sensors for operation (e.g., by deploying a standard (white) reference in the field), the exact spectral behaviour of the sensor spectral bands must be known to derive physical quantities eventually [20]. In this regard, the fusion of satellite and UAV data could potentially make full use of the advantages of these two platforms.
Some work has been done regarding the fusion of UAV and satellite data. In one study [21], the authors compared the methods of criteria-based fusion algorithm, Gram–Schmidt, FuzeGo, High-Pass Filtering, Ehlers, Hyperspherical Colour Space, Modified IHS and Adaptive Wavelet-Based algorithms in fusing a WorldView-2 MS (1.85 m) and a UAV image (0.10 m). The results showed that the criteria-based algorithm was very successful in keeping the colour content and gave satisfactory spatial detail enhancement compared to other algorithms. However, the high price of Worldview-2 data limits its applications. Landsat and UAV data fusion have also been found to help crop identification results [22]. In this study, the authors compared the methods of Gram–Schmidt and PCA method in fusing Landsat 8 OLI MS (30 m) and UAV (0.04 m). The results showed that the methods used in this study were fast and easy to implement and generated fused images with high integration quality colour (the Gram- Schmidt method) and spatial detail. The visual assessment revealed that the worst results were obtained from the PCA method, but the spatial resolution of Landsat is relatively low in the case of smaller-scale agriculture. The recently launched Sentinel-2A provides an important data source for crop classification due to its free availability, stable data quality and high spatial resolution [23]. Yet, few studies exist on fusing Sentinel-2A data with UAV for finer crop classification. Moreover, although studies show that UAV and satellite data fusion can improve data quality, determining the optimal UAV resolution is not a clear process. The spatial resolution of a UAV depends on the flight height and the sensors. In practice, higher spatial resolutions require a longer data acquisition time and generate large amounts of data, implying the need for more data storage space, transmission time and computation resources. Rather than blindly selecting the highest spatial resolution, choosing appropriate flight parameters to obtain the optimal spatial resolution for crop identification classification will result in more accurate and efficient results.
The objective of this study is to fuse the Sentinel-2A with UAV imagery to explore the appropriate spectral, spatial and temporal information for finer crop classification. Five different resolution UAV images (0.03 m, 0.10 m, 0.50 m, 1.00 m and 3.00 m) were fused with Sentinel-2A (10 bands of 10 m and 20 m spatial resolution) using Gram–Schmidt (GS) transformation. Landcover types were classified using a random forest (RF) classifier. We then discuss the classification accuracies of the fused images and the impact of varying UAV spatial resolution. In summary, we propose a systematic process that classifies individual crops at the plot scale with a fusing image of UAV and Sentinel-2A, which is more comprehensive and systematic, and explored the optimal choice of spatial resolution in fusing UAV images and Sentinel-2A, which has not been studied in previous work.
2. Study Area and Data
2.1. Study Area
The research site is in Heilongjiang Province in northeast China, located at the National Modern Agriculture Demonstration Park of Heilongjiang Academy of Agricultural Sciences, Harbin (45.73°N, 126.66°E) (Figure 1). The demonstration park has an area of 3 km × 2.5 km, covering 750 ha. The average elevation of Harbin is 151 m above sea level. Its climate is a typical mid-temperate continental monsoon climate, and the winter is long and cold, while summer is short and hot. Its annual precipitation and mean temperature are 524 mm and 3.5 °C, respectively. The precipitation is mainly concentrated in June-September, with the summer precipitation accounting for 60% of total annual precipitation. The snowfall period is from November to January of each year. The four seasons are distinct with an average temperature of −19 °C in January and an average temperature of approximately 23 °C in July [24,25,26].
2.2. Data Sources
The UAV images were acquired with a lightweight (4.4 kg), commercial, model Agristrong fixed-wing drone (Agristrong Corporation, Beijing, China, Figure 2) [27]. The camera equipped in fixed-wing drone is Sony α7R (Sony Corporation, Tokyo, Japan). This model is composed of a 35 mm full-frame (35.9 × 24 mm) Exmor CMOS sensor and capable of acquiring 36.4 megapixel (7360 × 4912 pixels) spatial resolution images.
The UAV images have a spatial resolution of 0.03 m, 0.10 m, 0.50 m, 1.00 m and 3.00 m and include three bands for red, green and blue (RGB) wavelengths (Figure 5a). We captured the UAV images (0.03 m) at 2:00 pm, September 14th, 2018. In order to avoid the effects of environment and camera configurations on imagery acquisition (e.g., light condition, shutter speed and white balance), we focused on the impacts of pixel size [28] by sub-sampling the highest resolution images (0.03 m) to produce lower resolution images (0.10 m, 0.50 m, 1.00 m and 3.00 m). Access to the study area (The National Modern Agriculture Demonstration Park) was limited due government activities on September 15–16, 2018, so all of the UAV images were collected on September 14th, 2018. We confirmed that no change in planting structure occurred in the following two days.
The Sentinel-2A MSI image (processing level 1C) used in this study was acquired on September 16, 2018, and was downloaded from the ESA Sentinels Scientific Data Hub. The processing level 1C includes radiometric and geometric corrections with sub-pixel accuracy. The revisit frequency of each single satellite is 10 days and the combined constellation revisit is five days. Sentinel-2 data are acquired on 13 spectral bands in the VNIR and SWIR with spatial resolutions ranging from 10 to 60 m [29]. These spectral channels include [30]:
- Four bands at 10 m spatial resolution: blue (490 nm), green (560 nm), red (665 nm) and near infrared (842 nm).
- Six bands at 20 m spatial resolution: four narrow bands are mainly used for vegetation characterization in the red edge (705 nm, 740 nm, 783 nm and 865 nm) and two wider SWIR bands (1610 nm and 2190 nm) for applications such as snow/ice/cloud detection or vegetation moisture stress assessment.
- Three bands at 60 m spatial resolution for applications such as cloud screening and atmospheric corrections (443 nm for aerosols, 945 nm for water vapour and 1375 nm for cirrus detection).
Ten bands (four bands at 10 m and six bands at 20 m) of the Sentinel-2A data were used in this study (Figure 5b). Additionally, we did a field survey to collect ground truth data (points observation) of land cover classes at the plot scale. We created a GIS layer of parcels in ShapeFile format to digitize complete fields for the study area (Figure 7a) and validation area (Figure 8a). Our classification scheme included rice, corn, soybean, buckwheat, other vegetations, greenhouses, bare land, waters, roads and houses. The number and area of these plots are listed in Table 1. Validation area included rice, corn, sorghum, green onions, vegetables and others. The UAV (0.03 m) and Sentinel-2A images for the validation area are shown in Figure 6a,b.
3. Methodology
We utilized a robust image fusion, classification and accuracy assessment workflow to our analysis (Figure 3). First, we acquired the UAV, Sentinel-2A images and truth data. All data were preprocessed (camera calibration, photos aligning, dense point clouds generation (based on the estimated camera positions we can calculate depth information for each camera to be combined into a single dense point cloud which can be used to generate the orthomosaic) and orthomosaic generation). For the image fusion, we used a Gram–Schmidt (GS) transformation, having been widely used in previous studies and successfully applied [31,32]. For crop classification, we used an Random Forest (RF) approach, a widely-used machine learning ensemble algorithm method [33]. We also explored the impact of the choice of UAV spatial resolution on crop classification. The individual steps of our approach are described in detail in Figure 3.
3.1. Data Fusion
From the Jenerowicz’s study [22] (fusing Landsat 8 OLI MS (30 m) and UAV (0.04 m), which is similar to Sentinel-2A (10 and 20 m) and UAV (0.03 m) used in our study), the Gram–Schmidt transformation is fast and easy to implement and generates fused images with high integration quality colour and spatial detail. The Gram–Schmidt (GS) transformation, introduced by Laben [34]. It is a commonly used method in multivariate statistics and linear algebra. Similar to the principal component transformation, it can transform a multidimensional image or matrix by orthogonal transformation to eliminate correlations between the bands of multispectral data. There are essential differences between the Gram–Schmidt transformation and the principal component analysis. In the Gram–Schmidt transformation, the components are only orthogonal, with the amount of information contained in each component being like avoiding excessive concentration of information in a single component. While in the principal component, the information between the principal components is redistributed so the first principal component contains the most information. A diagram of the Gram–Schmidt transform pan-sharpening technique is shown in Figure 4.
- (1)
- The UAV panchromatic band used in this study is produced by taking the mean value of all bands of UAV images [21].
- (2)
- Calculate the mean and standard deviation of UAV panchromatic band.
- (3)
- The Sentinel-2A data are combined into a single, simulated lower resolution panchromatic band. The simulated low-resolution panchromatic band is used as the first band of the low-resolution multispectral data as input of the original multispectral band to Gram–Schmidt (GS) transform.
- (4)
- Calculate the mean and standard deviation of the first band (GS1) of the images obtained by Gram–Schmidt (GS) transform.
- (5)
- The UAV panchromatic band (UAV-PAN) is then stretched so that its mean digital count (μUAV-PAN) and standard deviation (σUAV) match the mean (μGS1) and standard deviation (σGS1) of the first GS band.
- (6)
- The stretched high-resolution panchromatic band is then swapped for the first GS band, and the data is transformed back into original multispectral band space producing N+1 higher resolution multispectral bands.
For our analysis, the Sentinel-2A data were fused with five different UAV datasets at varying resolutions (0.03 m, 0.10 m, 0.50 m, 1.00 m and 3.00 m).
3.2. Crop Classification
We tested multiple classification methods with the 0.10 m fused imagery: Random Forest, Support Vector Machine and Neural Net. The results showed that Random Forest produced the most accurate result (Overall Accuracy = 88.32%, Kappa Coefficient = 0.84), followed by Support Vector Machine (Overall Accuracy = 86.75%, Kappa Coefficient = 0.82) and Neural Net classification (Overall Accuracy = 85.34%, Kappa Coefficient = 0.81). There is little difference among the results of three classification algorithms, but since the Random Forest performed slightly better in our study area that was the method we chose for classification. More details can be found in Appendix A.
Random forest is a widely-used machine learning method which can be used for classification and regression. The advantages of using a random forest classifier are that they produce extremely high accuracies, are unlikely to over-fit, are less affected by noise, can process high dimensional data and require no feature selection. Our random forest classifier was trained using a 0.01% subset of our ground truth data which included the following land cover classes: rice, corn, soybean, buckwheat, other vegetations, greenhouse, bare land, water, road and houses. We used ENVI RF module to do perform the classification, inputting all bands. In addition to the five fused datasets, we also conducted classifications on the original UAV and Sentinel-2A images, separately.
3.3. Accuracy Assessment
Based on verification samples (all truth data, Figure 7a) and classification results, we generated the confusion matrix (Table 2) of all categories and calculated the overall accuracy, kappa coefficient, user accuracy and producer accuracy.
The kappa coefficient [35], a statistical measure of inter-rater reliability, is calculated as follows:
Kappa = 1 shows that the raters are in complete agreement; Kappa = 0 indicates no agreement among raters.
Overall accuracy represents the classification quality of entire map.
The user accuracy is the proportion of a predicted class on a map, which matches the corresponding class on the reference ground.
Producer accuracy is the proportion of a predicted class on the reference class that is classified correctly in the field.
We also calculated the average of every class’s user and producer accuracy to refer to the classification quality of every class.
In order to verify the reliability and universality of the study area results, we repeated the experiment in the verification area using the same methodology as 3.1., 3.2., and 3.3. to classify the validation area images to rice, corn, sorghum, green onions, vegetables and others.
3.4. Influence of Different Resolution
The Sentinel-2A image was fused with different resolution UAV images (0.03 m, 0.10 m, 0.50 m, 1.00 m and 3.00 m) respectively. The fusion images were trained and classified. After classification, we compared the influence of different resolution UAV images.
4. Results and Analysis
4.1. UAV and Sentinel-2A Images Fusion
Fusing UAV images at 0.03 m (Figure 5a) with Sentinel-2A (Figure 5b) resulted in the image in Figure 5c. For the original UAV (0.03 m) and Sentinel-2A images, in terms of spatial resolution, the UAV images have high levels of textural and boundary information with clear, visual distinctions between image objects (Figure 5a). Conversely, the Sentinel-2A image displays objects much less distinctly with many pixels likely containing more than one land type (i.e., mixed pixels (Figure 5b)).
In terms of spectral resolution, the UAV images contain only three bands (RGB), making it difficult to distinguish features (e.g., fields) with high spectral similarity (e.g., corn and soybean, Figure 5a). The Sentinel-2A data contains 10 spectral bands including near-infrared and red-edge bands at 10-m and 20-m resolution, which allows for the differentiation of similar features. The data fusion of the two data sources results in images with the same spatial resolution as the UAV images with 10 spectral bands (Figure 5). Visually, the fused images have the characteristics of high resolution, high texture and multi-spectral information, ideal for fine-scale classification of cropland.
4.2. Classification after Images Fusion
The classification results using the 0.03 m resolution UAV original image, Sentinel-2A original data and the fusion image are shown in Figure 7. For the UAV image, the ultra-high resolution of 0.03 m results in very clear class boundaries and rich texture information with an overall classification accuracy of 76.77% and Kappa coefficient of 0.68 (Figure 7b, Table 3). The field boundaries obtained from the classification of the Sentinel-2A image (Figure 7c) are relatively vague and limits its usefulness for applications such as estimated crop area and yield forecast. However, due to its multiple spectral bands, the recognition of large-area crops (i.e., rice, corn, soybean) is relatively good. The overall classification accuracy for the Sentinel-2A image is 71.93% with a Kappa coefficient of 0.65 (Table 3).
The fused images’ classification results are substantially better than those obtained from the separate UAV and Sentinel-2A images. Regarding the highest spatial resolution, the overall accuracy of the classification is improved by 10% compared to the UAV and the Sentinel-2A data on their own with a value of 85.41% and Kappa coefficient of 0.80 (Figure 7d, Table 3).
The classification accuracy (average of user and producer average) of each image for the various land cover classes is shown in Table 4. Based on the overall accuracy and Kappa, the fusion image is better than that of the original UAV and Sentinel-2A images. Within the fusion classification, each class has an accuracy better than original images, except for soybean and road. This low accuracy of soybean may be due to the data collection time being mid-September when soybeans are typically harvested, resulting in more background noise (i.e., soil, also considered to be soybean). Under these circumstances, a higher resolution image may get a poorer result. For the road, the fused image does not get a better result than a UAV image. Future studies should keep the time period of data collection and crop growth period in mind to improve the classification.
The result for the verification area classification is shown in Figure 8. For the UAV image result, the classification scale is fine. However, because of the low spectral resolution, the salt and pepper effects are substantial. The sorghum and green onion classes do not have a good result using the RGB bands alone (Figure 8b). For Sentinel-2A image, the classification result is not bad, but the scale is rather coarse, with borders being difficult to discern (Figure 8c). The fused image gets a better result of fine-scale and accuracy.
The classification results in the verification area again show that the classification of the fused images with 0.03 m resolution are significantly better than both the original UAV and Sentinel-2A images. The UAV image’s classification accuracy is the lowest at 77.70% with a Kappa coefficient of 0.67 (Table 5). The Sentinel-2A image classification has a slightly better accuracy of 86.51% and a Kappa coefficient of 0.81 (Table 5). Moreover, the fused image (0.03 m) achieved an even higher accuracy of 91.54%, with a Kappa coefficient of 0.87 (Table 5).
4.3. Classification at Different Resolutions
The classification results using each resolution of the fusion images are shown in Figure 9. The highest level of accuracy was achieved using a spatial resolution of 0.10 m (88.32%, Kappa=0.84) followed by 0.50 m (87.3%, Kappa=0.83), 1.00 m (85.8%, Kappa=0.80) and 0.03 m (85.43%, Kappa=0.80, Table 6). The largest spatial resolution of 3.00 m had the lowest accuracy level of the fused images (82.51%, Kappa=0.77, Table 6). Somewhat counterintuitively, these results show that classification accuracy does not always improve with higher image resolution.
Based on the accuracy values, the 0.10 m fusion image is better than that of 0.03 m fusion image, 0.50 m fusion image, 1.00 m fusion image and 3.00 m fusion image (Table 6). Within the 0.10 m fusion classification, each class has an accuracy >=0.70, except for soybean (Table 7). This low accuracy holds for all the images and may be due to the data collection time being mid-September when soybeans are typically harvested. Regardless, the 0.10 m fusion image has the highest accuracy for all classes (Table 7).
For the verification area, the classification results using each resolution of the fusion images are shown in Figure 10. Similar to the original area’s results, the overall accuracy and the Kappa coefficient of the 0.10 m fusion data the highest of the fused classification results (92.03%, Kappa = 0.88, Table 8).
5. Discussion
Our study provides a method of crop classification for medium to small field sizes. Our crop classification method combines the high spatial resolution and high texture information of UAV imagery with the spectral information of Sentinel-2A. Ultimately, using this method allows for accurate plot classification of crops in complex agricultural landscapes. UAV and Sentinel-2A data can be obtained in a relatively cheap way, which is important for future agricultural research. Our research methods provide basic data for precision agriculture, which is the key and fundamental work of smart agriculture.
Crop classification using the results of the fusion of UAV and satellite data enables better crop classification results than a single data source [21,22]. The free access to Sentinel-2A data with a spatial resolution of up to 10 meters and high spectral resolution will undoubtedly provide great help for agricultural research in the future. Previous studies have determined the role of UAV and satellite data fusion, but no further discussion in crop classification and UAV data selection has been conducted. The UAV data choice will also affect the final classification results of crops. Choosing suitable UAV data will not only save resource consumption but also help obtain reliable classification results. Our study identified that the optimal spatial resolution for UAV imagery to fuse with Sentinel-2A images for plot-level crop classification was not the highest resolution tested (0.03 m), but the next highest, 0.10 m.
Our study does have some limitations. We classify crops in a heterogeneous arable landscape using a fused image. While the main crops are corn, soybean, and rice, areas with different crop types (such as wheat), may differ in terms of optimal UAV spatial resolution. The extent to which one can generalize optimal resolutions across crop types requires more study. However, our study provides an excellent starting point for the process of choosing a suitable spatial resolution when using UAV images. We have a GIS layer with the boundaries of agricultural parcels. However, we chose not to mask out the non-agricultural areas in order to verify the reliability and applicability of this crop classification method (fusing UAV and Sentinel-2A) despite the noise due to non-agricultural landcover. In our study, even with the interference of the non-agricultural landcover, our result was relatively accurate using the fused images. We believe that masking the non-agricultural, would achieve an even higher accuracy. Future work should also test the benefits of including textural features as they are often useful for high-resolution image classification. Due to the logistical constraints of our field data collection (e.g. acquisition time, data storage), we were not able to use time-series data for our UAV imagery. Although our study achieved a relatively good accuracy when using UAV images from a single date, repeat measurements at multiple dates may have yielded better results.
Our study highlights the feasibility of fusing UAV with Sentinel-2A images for crop classification and tests the optimal resolution of UAV for fusing. By this method, Sentinal-2A’s spectral information could be added to UAV images to improve the classification result. In addition, UAV can get the height of crops which will be an important differentiating factor for classification.
6. Conclusions
Our results show that the images obtained by the fusion of Sentinel-2A data and UAV images combine the advantages of both data sources with little to no discernible disadvantages. In this study, the unification of Sentinel-2A’s rich spectral information with the ultra-high spatial resolution and texture information from the low-cost, UAV-obtained images yielded superior classification results than using the data separately. Fusing UAV with Sentinel-2A images can improve the accuracy of the classification and classify individual crops at the scale of the plot.
When comparing the different resolutions of the fused imagery, we found that the highest spatial resolution did not necessarily achieve the most accurate results. In our study, 0.10 m resolution UAV images fused with Sentinel-2A can generate good results with less input. Thus, one should consider the context and goal of the classification when choosing the spatial resolution.
Author Contributions
Conceptualization, L.Z. and Y.S.; methodology, L.Z. and B.L.; validation, L.Z., Y.D. and Z.S.; formal analysis, L.Z.; writing—original draft preparation, L.Z.; writing—review and editing, L.Z. and C.H.
Funding
This research was supported by the National Key Research and Development Program (2016YFD0300602) and by the Fundamental Research Funds for the Central Universities (CCNU18XJ032).
Acknowledgments
Sincere thanks are given for the comments and contributions of anonymous reviewers and members of the editorial team. The authors would like to thank the fellows at the Remote Sensing Technology Center, Heilongjiang Academy of Agriculture Sciences, for supporting the essential field investigation.
Conflicts of Interest
The authors declare no conflict of interest.
Appendix A
In order to select the suitable method to classify the crops at the plot scale. We made a test to classify the crops with 0.10 m fused image using Random Forest, Support Vector Machine and Neural Net. All training samples used in three methods were 0.01% points of our ground truth data (Figure A1a). The results are shown in Figure A1 and Table A1.
Figure A1.
Crop classification results of different methods. (a) Truth; (b) Random Forest; (c) Support Vector Machine; (d) Neural Net. The white areas in figure (a) are the uncertain classes, which are not taken into account for training and verification.
Figure A1.
Crop classification results of different methods. (a) Truth; (b) Random Forest; (c) Support Vector Machine; (d) Neural Net. The white areas in figure (a) are the uncertain classes, which are not taken into account for training and verification.


Table A1.
Overall Accuracy and Kappa Coefficient of different methods (the underlined numbers are the best results).
Table A1.
Overall Accuracy and Kappa Coefficient of different methods (the underlined numbers are the best results).
| Methods | Random Forest | Support Vector Machine | Neural Net |
|---|---|---|---|
| Overall accuracy | 88.32% | 86.75% | 85.34% |
| Kappa Coefficient | 0.84 | 0.82 | 0.81 |
From the test, Random Forest gets the best result with an overall accuracy of 88.32% and Kappa coefficient of 0.84, followed by Support Vector Machine (overall accuracy of 86.75% and Kappa coefficient of 0.82) and Neural Net (overall accuracy of 85.34% and Kappa coefficient of 0.81). There is little difference among the results of three classification algorithms, but since the Random Forest performed slightly better in our study area that was the method we chose for classification.
References
- Wu, W.-B.; Yu, Q.-Y.; Peter, V.H.; You, L.-Z.; Yang, P.; Tang, H.-J. How Could Agricultural Land Systems Contribute to Raise Food Production Under Global Change? J Integr. Agric. 2014, 13, 1432–1442. [Google Scholar] [CrossRef]
- Sun, J.; Mooney, H.; Wu, W.; Tang, H.; Tong, Y.; Xu, Z.; Huang, B.; Cheng, Y.; Yang, X.; Wei, D.; et al. Importing food damages domestic environment: Evidence from global soybean trade. Proc. Natl. Acad. Sci. USA 2018, 115, 5415–5419. [Google Scholar] [CrossRef] [PubMed] [Green Version]
- Jin, Z.; Azzari, G.; You, C.; Di Tommaso, S.; Aston, S.; Burke, M.; Lobell, D.B. Smallholder maize area and yield mapping at national scales with Google Earth Engine. Remote Sens. Environ. 2019, 228, 115–128. [Google Scholar] [CrossRef]
- Xie, Y.; Lark, T.J.; Brown, J.F.; Gibbs, H.K. Mapping irrigated cropland extent across the conterminous United States at 30 m resolution using a semi-automatic training approach on Google Earth Engine. ISPRS J. Photogramm. Remote Sens. 2019, 155, 136–149. [Google Scholar] [CrossRef]
- Fan, L.; Liang, S.; Chen, H.; Hu, Y.; Zhang, X.; Liu, Z.; Wu, W.; Yang, P. Spatio-temporal analysis of the geographical centroids for three major crops in China from 1949 to 2014. J. Geogr. Sci. 2018, 28, 1672–1684. [Google Scholar] [CrossRef] [Green Version]
- Li, Z.; Liu, Z.; Anderson, W.; Yang, P.; Wu, W.; Tang, H.; You, L. Chinese rice production area adaptations to climate changes, 1949–2010. Env. Sci. Technol. 2015, 49, 2032–2037. [Google Scholar] [CrossRef] [PubMed]
- Hu, Q.; Ma, Y.; Xu, B.; Song, Q.; Tang, H.; Wu, W. Estimating Sub-Pixel Soybean Fraction from Time-Series MODIS Data Using an Optimized Geographically Weighted Regression Model. Remote Sens. 2018, 10, 491. [Google Scholar] [CrossRef] [Green Version]
- Yang, P.; Wu, W.-B.; Tang, H.-J.; Zhou, Q.-B.; Zou, J.-Q.; Zhang, L. Mapping Spatial and Temporal Variations of Leaf Area Index for Winter Wheat in North China. Agric. Sci. China 2007, 6, 1437–1443. [Google Scholar] [CrossRef]
- Zhang, G.; Zhang, Y.; Dong, J.; Xiao, X. Green-up dates in the Tibetan Plateau have continuously advanced from 1982 to 2011. Proc. Natl. Acad. Sci. USA 2013, 110, 4309–4314. [Google Scholar] [CrossRef] [Green Version]
- Wang, L.A.; Zhou, X.; Zhu, X.; Dong, Z.; Guo, W. Estimation of biomass in wheat using random forest regression algorithm and remote sensing data. Crop. J. 2016, 4, 212–219. [Google Scholar] [CrossRef] [Green Version]
- Guan, K.; Berry, J.A.; Zhang, Y.; Joiner, J.; Guanter, L.; Badgley, G.; Lobell, D.B. Improving the monitoring of crop productivity using spaceborne solar-induced fluorescence. Glob. Chang. Biol. 2016, 22, 716–726. [Google Scholar] [CrossRef] [PubMed]
- Battude, M.; Al Bitar, A.; Morin, D.; Cros, J.; Huc, M.; Marais Sicre, C.; Le Dantec, V.; Demarez, V. Estimating maize biomass and yield over large areas using high spatial and temporal resolution Sentinel-2 like remote sensing data. Remote Sens. Environ. 2016, 184, 668–681. [Google Scholar] [CrossRef]
- Huang, J.; Tian, L.; Liang, S.; Ma, H.; Becker-Reshef, I.; Huang, Y.; Su, W.; Zhang, X.; Zhu, D.; Wu, W. Improving winter wheat yield estimation by assimilation of the leaf area index from Landsat TM and MODIS data into the WOFOST model. Agric. For. Meteorol. 2015, 204, 106–121. [Google Scholar] [CrossRef] [Green Version]
- Toureiro, C.; Serralheiro, R.; Shahidian, S.; Sousa, A. Irrigation management with remote sensing: Evaluating irrigation requirement for maize under Mediterranean climate condition. Agric. Water Manag. 2017, 184, 211–220. [Google Scholar] [CrossRef]
- Pena-Arancibia, J.L.; Mainuddin, M.; Kirby, J.M.; Chiew, F.H.; McVicar, T.R.; Vaze, J. Assessing irrigated agricultur’s surface water and groundwater consumption by combining satellite remote sensing and hydrologic modelling. Sci. Total Environ. 2016, 542, 372–382. [Google Scholar] [CrossRef] [PubMed]
- Yu, Q.; Shi, Y.; Tang, H.; Yang, P.; Xie, A.; Liu, B.; Wu, W. eFarm: A Tool for Better Observing Agricultural Land Systems. Sensors 2017, 17, 453. [Google Scholar] [CrossRef] [Green Version]
- Castillejo-González, I. Mapping of Olive Trees Using Pansharpened QuickBird Images: An Evaluation of Pixel- and Object-Based Analyses. Agronomy 2018, 8, 288. [Google Scholar] [CrossRef] [Green Version]
- Ozdarici-Ok, A.; Ok, A.; Schindler, K. Mapping of Agricultural Crops from Single High-Resolution Multispectral Images—Data-Driven Smoothing vs. Parcel-Based Smoothing. Remote Sens. 2015, 7, 5611–5638. [Google Scholar] [CrossRef] [Green Version]
- Hu, Q.; Wu, W.; Xia, T.; Yu, Q.; Yang, P.; Li, Z.; Song, Q. Exploring the Use of Google Earth Imagery and Object-Based Methods in Land Use/Cover Mapping. Remote Sens. 2013, 5, 6026–6042. [Google Scholar] [CrossRef] [Green Version]
- Böhler, J.; Schaepman, M.; Kneubühler, M. Crop Classification in a Heterogeneous Arable Landscape Using Uncalibrated UAV Data. Remote Sens. 2018, 10, 1282. [Google Scholar] [CrossRef] [Green Version]
- Yilmaz, V.; Gungor, O. Fusion of very high-resolution UAV images with criteria-based image fusion algorithm. Arab. J. Geosci. 2016, 9. [Google Scholar] [CrossRef]
- Jenerowicz, A.; Woroszkiewicz, M. The pan- sharpening of satellite and UAV imagery for agricultural applications. In Remote Sensing for Agriculture, Ecosystems, and Hydrology Xviii; Neale, C.M.U., Maltese, A., Eds.; Spie-Int Soc Optical Engineering: Bellingham, DC, USA, 2016; Volume 9998. [Google Scholar]
- Belgiu, M.; Csillik, O. Sentinel-2 cropland mapping using pixel-based and object-based time-weighted dynamic time warping analysis. Remote Sens. Environ. 2018, 204, 509–523. [Google Scholar] [CrossRef]
- Shui, T.; Liu, J.; Xiao, Y.; Shi, L. Effects of snow cover on urban surface energy exchange: Observations in Harbin, China during the winter season. Int. J. Climatol. 2019, 39, 1230–1242. [Google Scholar] [CrossRef]
- Wang, W.; Zhang, B.; Zhou, W.; Lv, H.; Xiao, L.; Wang, H.; Du, H.; He, X. The effect of urbanization gradients and forest types on microclimatic regulation by trees, in association with climate, tree sizes and species compositions in Harbin city, northeastern China. Urban Ecosyst. 2019, 22, 367–384. [Google Scholar] [CrossRef]
- Yu, J.; Jiang, Y.; Yan, Y. A simulation study on heat recovery of data center: A case study in Harbin, China. Renew. Energy 2019, 130, 154–173. [Google Scholar] [CrossRef]
- Agristrong Corporation. UAV. Available online: http://www.agristrong.cn/product/UAV01-cn.html (accessed on 4 December 2019).
- Hu, P.; Guo, W.; Chapman, S.C.; Guo, Y.; Zheng, B. Pixel size of aerial imagery constrains the applications of unmanned aerial vehicle in crop breeding. ISPRS J. Photogramm. Remote Sens. 2019, 154, 1–9. [Google Scholar] [CrossRef]
- ESA. Sentinel-2 user handbook. In ESA Standard Document; European Spatial Agency: Paris, France, 2015; pp. 52–54. [Google Scholar]
- Gascon, F.; Bouzinac, C.; Thépaut, O.; Jung, M.; Francesconi, B.; Louis, J.; Lonjou, V.; Lafrance, B.; Massera, S.; Gaudel-Vacaresse, A.; et al. Copernicus Sentinel-2A Calibration and Products Validation Status. Remote Sens. 2017, 9, 584. [Google Scholar] [CrossRef] [Green Version]
- Ni, N.N.; Chen, N.H.; Ernst, R.E.; Yang, S.F.; Chen, J.Y. Semi-automatic extraction and mapping of dyke swarms based on multi-resolution remote sensing images: Applied to the dykes in the Kuluketage region in the northeastern Tarim Block. Precambrian Res. 2019, 329, 262–272. [Google Scholar] [CrossRef]
- Yuan, L.; Zhu, G. Research on Remote Sensing Image Classification Based on Feature Level Fusion. ISPRS—Int. Arch. Photogramm. Remote Sens. Spat. Inf. Sci. 2018, XLII-3, 2185–2189. [Google Scholar] [CrossRef] [Green Version]
- Tatsumi, K.; Yamashiki, Y.; Canales Torres, M.A.; Ramos Taipe, C.L. Crop classification of upland fields using Random forest of time-series Landsat 7 ETM+ data. Comput. Electron. Agric. 2015, 115, 171–179. [Google Scholar] [CrossRef]
- Laben, C.A.; Brower, B.V. Process for Enhancing the Spatial Resolution of Multispectral Imagery Using Pan-Sharpening. U.S. Patent 6,011,875A, 1 April 2000. [Google Scholar]
- Cohen, J. A Coefficient of Agreement for Nominal Scales. Educ. Psychol. Meas. 1960, 20, 37–46. [Google Scholar] [CrossRef]
Figure 1.
The location of study area which is the National Modern Agriculture Demonstration. The landscape is dominated by small to mid-sized fields, which contain a wide range of crop types and varieties.
Figure 1.
The location of study area which is the National Modern Agriculture Demonstration. The landscape is dominated by small to mid-sized fields, which contain a wide range of crop types and varieties.

Figure 2.
The UAV (unmanned aerial vehicle) used in this study.

Figure 3.
Flowchart of the methodology.

Figure 4.
The process of Gram–Schmidt (GS) transformation with UAV and Sentinel-2A images.

Figure 5.
Sentinel-2A and UAV original and fusion images of study area. (a) UAV image (0.03 m); (b) Sentinel-2A image; (c) Fusion image from a and b.
Figure 5.
Sentinel-2A and UAV original and fusion images of study area. (a) UAV image (0.03 m); (b) Sentinel-2A image; (c) Fusion image from a and b.
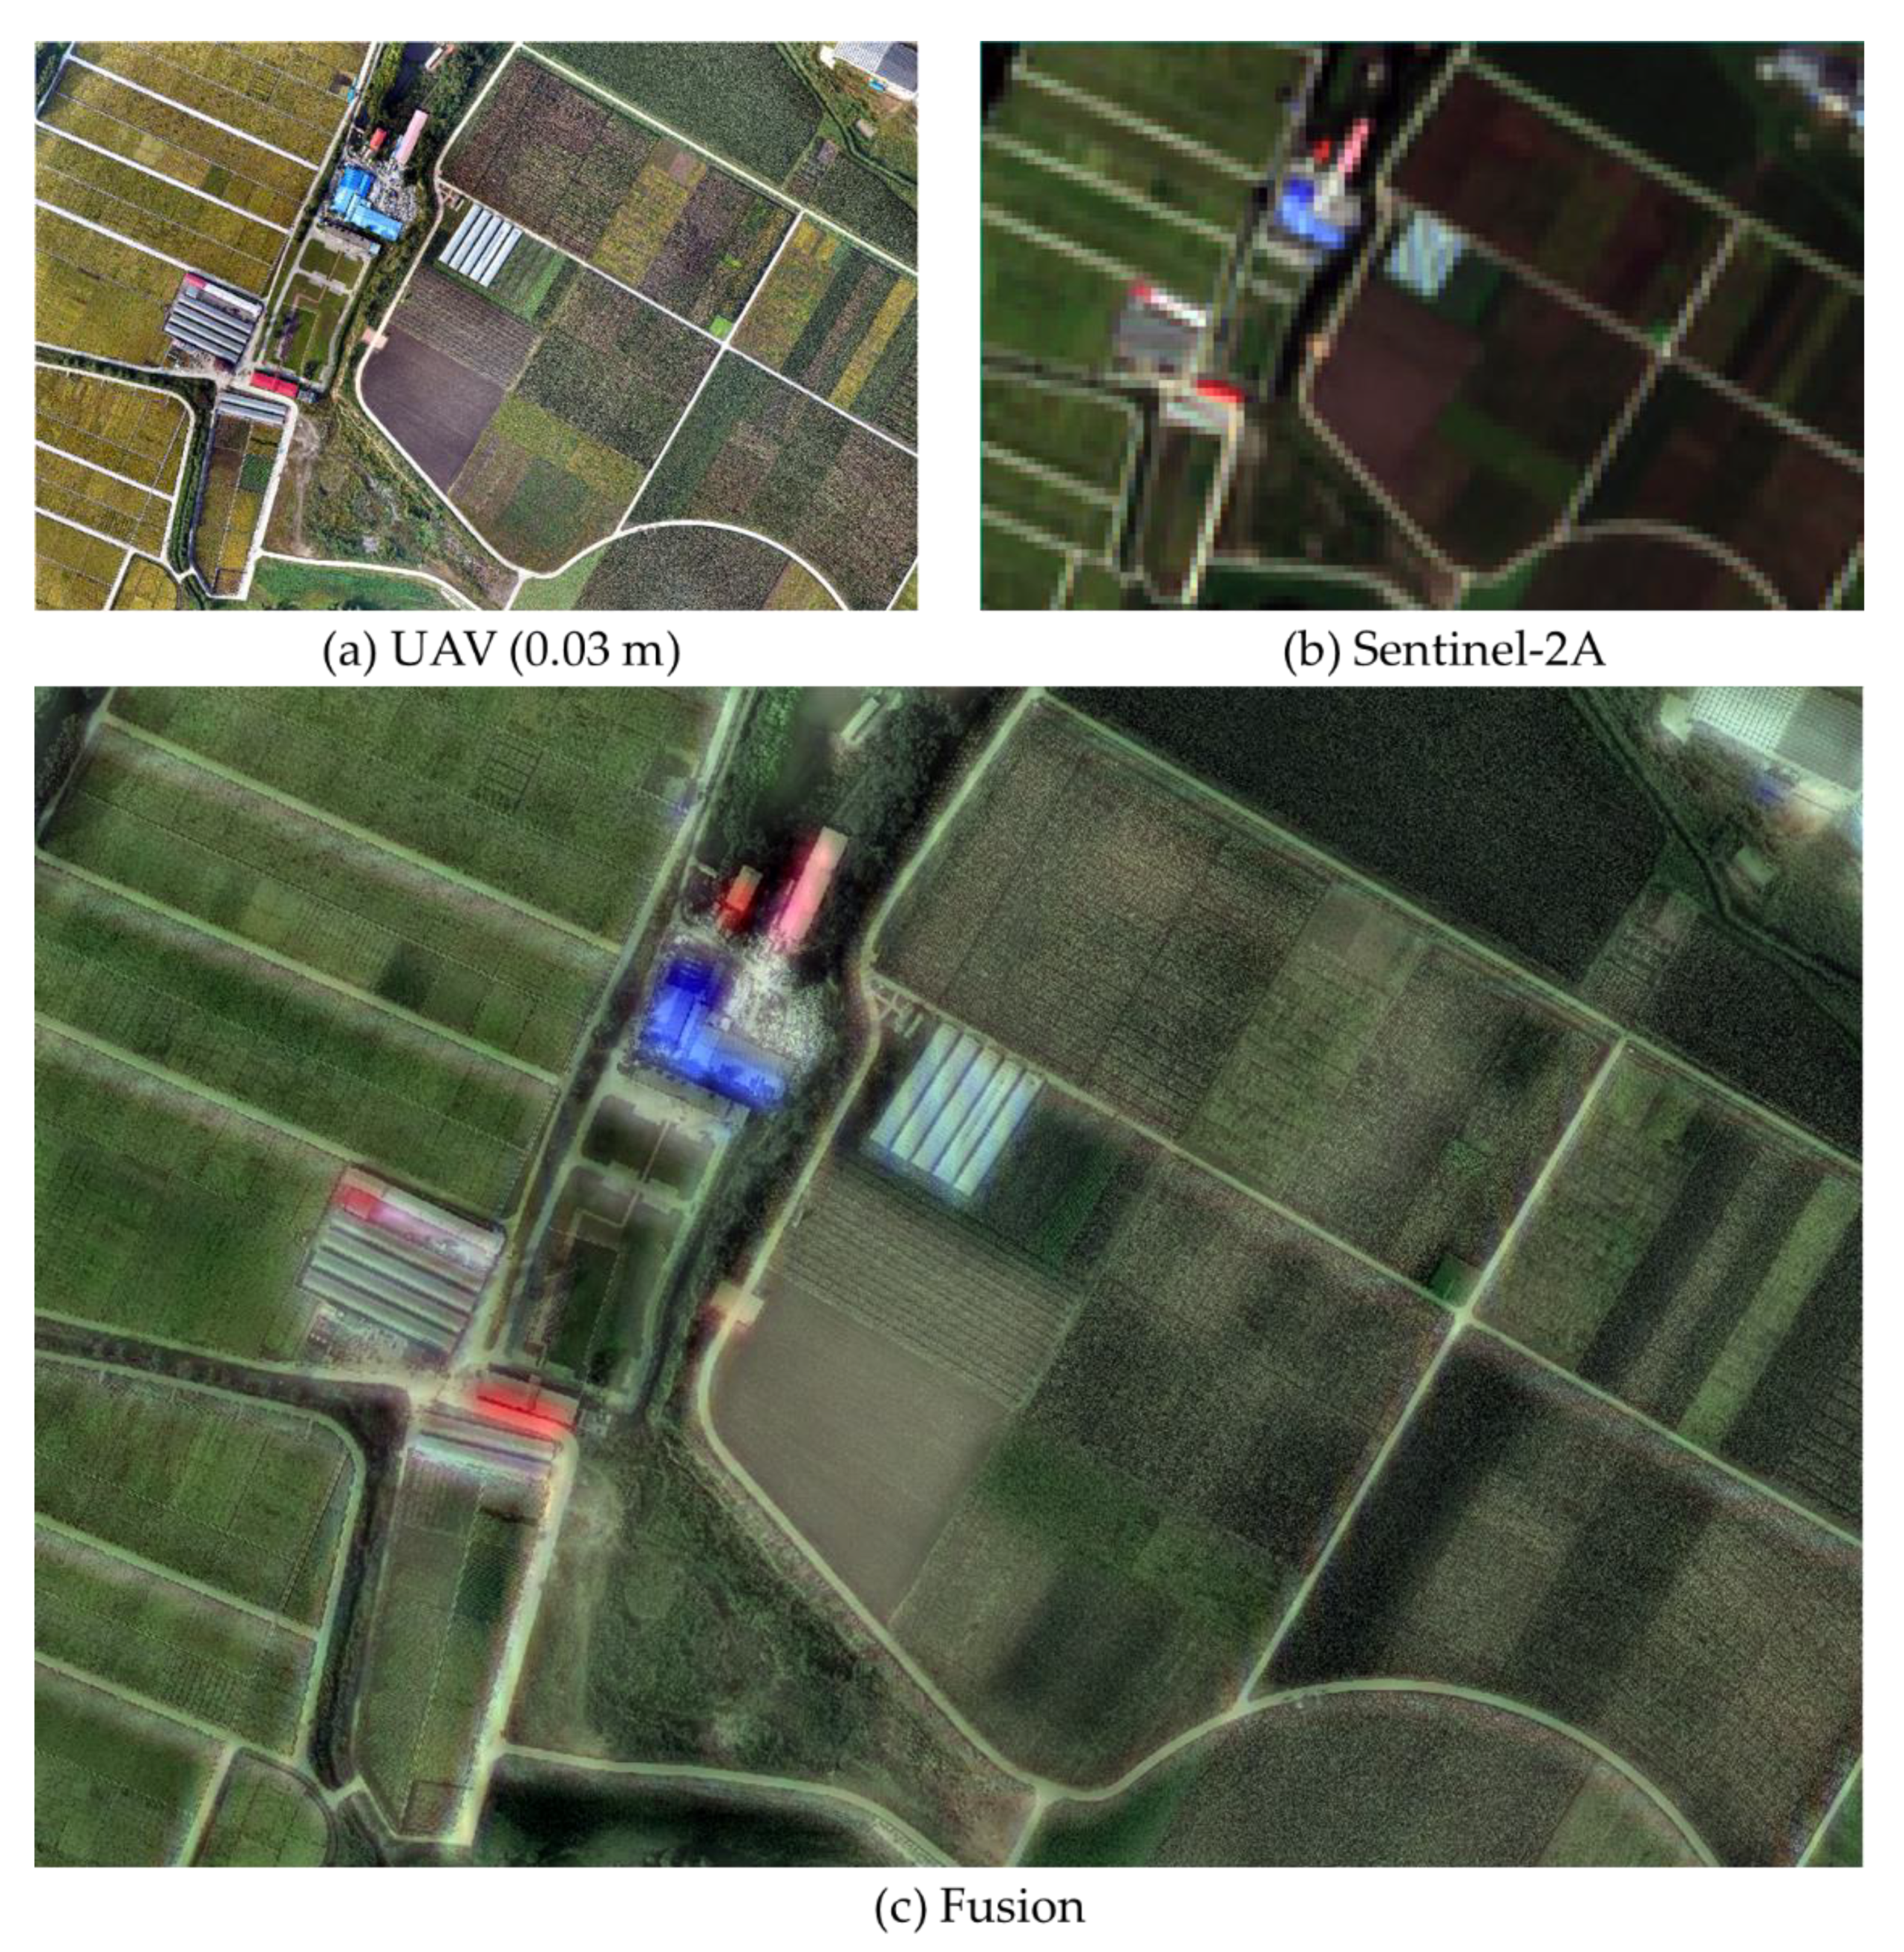
Figure 6.
Image fusion result of verification area. (a) UAV image (0.03 m); (b) Sentinel-2A image; (c) Fusion image from a and b.
Figure 6.
Image fusion result of verification area. (a) UAV image (0.03 m); (b) Sentinel-2A image; (c) Fusion image from a and b.

Figure 7.
Crop classification results. (a) Truth; (b) UAV image alone 0.03 m; (c) Sentinel-2A alone; (d) Fusion image 0.03 m. The white areas in figure (a) are the uncertain classes, which are not taken into account for training and verification.
Figure 7.
Crop classification results. (a) Truth; (b) UAV image alone 0.03 m; (c) Sentinel-2A alone; (d) Fusion image 0.03 m. The white areas in figure (a) are the uncertain classes, which are not taken into account for training and verification.

Figure 8.
Verification area classification results. (a) Truth; (b) UAV image alone 0.03 m; (c) Sentinel-2A alone; (d) Fusion image 0.03 m. The white areas in figure (a) are the uncertain classes, which are not taken into account for training and verification.
Figure 8.
Verification area classification results. (a) Truth; (b) UAV image alone 0.03 m; (c) Sentinel-2A alone; (d) Fusion image 0.03 m. The white areas in figure (a) are the uncertain classes, which are not taken into account for training and verification.

Figure 9.
Crop classification results of different resolution fused images. The white areas in figure (a) are the uncertain classes, which are not taken into account for training and verification.
Figure 9.
Crop classification results of different resolution fused images. The white areas in figure (a) are the uncertain classes, which are not taken into account for training and verification.

Figure 10.
Crop classification results of different resolution fused images for verification area. The white areas in figure (a) are the uncertain classes, which are not taken into account for training and verification.
Figure 10.
Crop classification results of different resolution fused images for verification area. The white areas in figure (a) are the uncertain classes, which are not taken into account for training and verification.

Table 1.
Plots numbers and area (m2).
| Rice | Soybean | Corn | Greenhouse | Bare Land | Houses | Roads | Other Crops | Waters | Buckwheat | |
|---|---|---|---|---|---|---|---|---|---|---|
| Number | 564 | 157 | 69 | 13 | 36 | 38 | 38 | 185 | 6 | 1 |
| Minimum | 2 | 3 | 2 | 26 | 4 | 2 | 6 | 4 | 51 | 3856 |
| Maximum | 3085 | 1964 | 9926 | 4031 | 2241 | 1440 | 6460 | 7546 | 668 | 3856 |
| Mean | 249.21 | 158.77 | 476.62 | 110.95 | 390.11 | 234.82 | 951.47 | 423.26 | 328.50 | 3856.00 |
Table 2.
Confusion matrix.
| Predicted Class | ||||||||
|---|---|---|---|---|---|---|---|---|
| Class 1 | Class 2 | … | … | … | Class n | Total | ||
| Actual class | Class 1 | P11 | P21 | … | … | … | Pn1 | P+1 |
| Class 2 | P12 | P22 | … | Pn2 | P+2 | |||
| … | … | … | … | … | … | … | … | |
| Class k | P1k | P2k | … | Pnk | P+k | |||
| … | … | … | … | … | … | … | … | |
| Class n | P1n | P2n | … | Pn+ | P+n | |||
| Total | P1+ | P2+ | … | Pnn | N | |||
1 N is the total number of pixels of the verification sample. 2 n is the number of categories of features. 3 Pij is the number of pixels in classification result that are classified into class i and the actual class belongs to class j.
Table 3.
Classification Overall Accuracy and Kappa Coefficient (the underlined numbers are the best results).
Table 3.
Classification Overall Accuracy and Kappa Coefficient (the underlined numbers are the best results).
| Image | Sentinel-2A | UAV | Fusion 0.03 m |
|---|---|---|---|
| overall accuracy | 71.93% | 76.77% | 85.43% |
| kappa | 0.65 | 0.68 | 0.80 |
Table 4.
Classification accuracy of different crops (the underlined numbers are the best results).
| Rice | Soybean | Corn | Greenhouse | Bare Land | Houses | Road | Other Crops | |
|---|---|---|---|---|---|---|---|---|
| UAV | 0.89 | 0.16 | 0.83 | 0.69 | 0.78 | 0.76 | 0.80 | 0.49 |
| Sentinel-2A | 0.86 | 0.69 | 0.88 | 0.64 | 0.62 | 0.51 | 0.44 | 0.62 |
| Fusion | 0.92 | 0.57 | 0.91 | 0.82 | 0.82 | 0.79 | 0.77 | 0.74 |
Table 5.
Overall accuracies and Kappa coefficients of verification area classification (the underlined numbers are the best results).
Table 5.
Overall accuracies and Kappa coefficients of verification area classification (the underlined numbers are the best results).
| Image | Sentinel-2A | UAV | Fusion 0.03 m |
|---|---|---|---|
| Overall accuracy | 86.51% | 77.70% | 91.54% |
| Kappa | 0.81 | 0.67 | 0.87 |
Table 6.
Classification Overall Accuracy and Kappa Coefficient (the underlined numbers are the best results).
Table 6.
Classification Overall Accuracy and Kappa Coefficient (the underlined numbers are the best results).
| Image | Fusion 0.03 m | Fusion 0.10 m | Fusion 0.50 m | Fusion 1.00 m | Fusion 3.00 m |
|---|---|---|---|---|---|
| Overall accuracy | 85.43% | 88.32% | 87.30% | 85.80% | 82.51% |
| Kappa | 0.80 | 0.84 | 0.83 | 0.80 | 0.77 |
Table 7.
Classification accuracy of different crops with each resolution fusion images (the underlined numbers are the best results).
Table 7.
Classification accuracy of different crops with each resolution fusion images (the underlined numbers are the best results).
| Rice | Soya Bean | Corn | Greenhouse | Bare Land | Houses | Road | Other Crops | |
|---|---|---|---|---|---|---|---|---|
| 0.03 m | 0.92 | 0.57 | 0.91 | 0.82 | 0.82 | 0.79 | 0.77 | 0.74 |
| 0.10 m | 0.94 | 0.66 | 0.92 | 0.87 | 0.86 | 0.84 | 0.80 | 0.80 |
| 0.50 m | 0.94 | 0.65 | 0.92 | 0.86 | 0.84 | 0.79 | 0.78 | 0.78 |
| 1.00 m | 0.93 | 0.62 | 0.91 | 0.83 | 0.81 | 0.76 | 0.75 | 0.73 |
| 3.00 m | 0.91 | 0.63 | 0.91 | 0.70 | 0.73 | 0.63 | 0.71 | 0.71 |
Table 8.
Overall accuracies and Kappa coefficients of fusion images in verification area (the underlined numbers are the best results).
Table 8.
Overall accuracies and Kappa coefficients of fusion images in verification area (the underlined numbers are the best results).
| Image | 0.03 m | 0.10 m | 0.50 m | 1.00 m | 3.00 m |
|---|---|---|---|---|---|
| Overall accuracy | 91.54% | 92.03% | 83.17% | 78.41% | 76.98% |
| Kappa | 0.87 | 0.88 | 0.74 | 0.67 | 0.65 |
© 2019 by the authors. Licensee MDPI, Basel, Switzerland. This article is an open access article distributed under the terms and conditions of the Creative Commons Attribution (CC BY) license (http://creativecommons.org/licenses/by/4.0/).
Share and Cite
MDPI and ACS Style
Zhao, L.; Shi, Y.; Liu, B.; Hovis, C.; Duan, Y.; Shi, Z. Finer Classification of Crops by Fusing UAV Images and Sentinel-2A Data. Remote Sens. 2019, 11, 3012. https://doi.org/10.3390/rs11243012
AMA Style
Zhao L, Shi Y, Liu B, Hovis C, Duan Y, Shi Z. Finer Classification of Crops by Fusing UAV Images and Sentinel-2A Data. Remote Sensing. 2019; 11(24):3012. https://doi.org/10.3390/rs11243012
Chicago/Turabian StyleZhao, Licheng, Yun Shi, Bin Liu, Ciara Hovis, Yulin Duan, and Zhongchao Shi. 2019. "Finer Classification of Crops by Fusing UAV Images and Sentinel-2A Data" Remote Sensing 11, no. 24: 3012. https://doi.org/10.3390/rs11243012
Note that from the first issue of 2016, this journal uses article numbers instead of page numbers. See further details here.