Article

A Temporal Disaggregation Approach for TRMM Monthly Precipitation Products Using AMSR2 Soil Moisture Data

1
College of Resources and Environment, University of Chinese Academy of Sciences, Beijing 100049, China
2
State Key Laboratory of Resources and Environmental Information System, Institute of Geographical Sciences and Natural Resources Research, Chinese Academy of Sciences, Beijing 100101, China
3
Jiangsu Center for Collaborative Innovation in Geographical Information Resource Development and Application, Nanjing 210023, China
4
Heihe Water Resources and Ecological Protection Research Center, Lanzhou 730030, China
5
Key Laboratory of Quantitative Remote Sensing Information Technology, Academy of Opto-Electronics, Chinese Academy of Sciences, Beijing 100094, China
6
School of Surveying and Land Information Engineering, Henan Polytechnic University, Jiaozuo 454000, China
*
Author to whom correspondence should be addressed.
Remote Sens. 2019, 11(24), 2962; https://doi.org/10.3390/rs11242962
Submission received: 14 October 2019 / Revised: 4 December 2019 / Accepted: 9 December 2019 / Published: 11 December 2019
(This article belongs to the Special Issue Precipitation and Water Cycle Measurements Using Remote Sensing)

Abstract

:
Accurate and spatially-distributed precipitation information is vital to the study of the regional hydrological cycle and water resources, as well as for environmental management. To provide high spatio-temporal resolution precipitation estimates over insufficient rain-gauge areas, great efforts have been taken in using the Normalized Difference Vegetation Index (NDVI) and other land surface variables to improve the spatial resolution of satellite precipitation datasets. However, the strong spatio-temporal heterogeneity of precipitation and the “hysteresis phenomenon” of the relationship between precipitation and vegetation has limited the application of these downscaling methods to high temporal resolutions. To overcome this limitation, a new temporal downscaling method was proposed in this study by introducing daily soil moisture data to explore the relationship between precipitation and the soil moisture increment index. The performance of this proposed temporal downscaling was assessed by downscaling the Tropical Rainfall Measuring Mission (TRMM) precipitation data from a monthly scale to a daily scale over the Hekouzhen to Tongguan of the Yellow River in 2013, and the downscaled daily precipitation datasets were validated with in-situ measurement from 23 rainfall observation stations. The validation results indicate that the downscaled daily precipitation agrees with the rain gauge observations, with a correlation coefficient of 0.59, a mean error range of 1.70 mm, and a root mean square error of 5.93 mm. In general, the monthly precipitation decomposition method proposed in this paper has combined the advantage of both microwave remote sensing products. It has acceptable precision and can generate precipitation on a diurnal scale. It is an important development in the field of using auxiliary data to perform temporal downscaling. Furthermore, this method also provides a reference example for the temporal downscaling of other low temporal resolution datasets.

Graphical Abstract

1. Introduction

Rain, snow, and other forms of precipitation affect every part of life on Earth. As the most important driving factor of the water cycle, the magnitude and spatio–temporal distribution of precipitation directly affect the water exchange between the land and atmosphere and are closely related to vegetation growth, agricultural production, and human survival and development [1,2,3]. Accurate and quantitative study of precipitation, especially the distribution patterns of precipitation on spatio–temporal scales, is of great significance for regional hydrology analysis, water resource management, drought and flood disaster monitoring, and ecological environment management [4,5].
Traditional precipitation data are usually derived from ground-based measurements, such as rain gauges and meteorological stations, which offer the most direct and accurate way to measure precipitation, and can be considered the “true value” of precipitation. However, there are two disadvantages with this type of precipitation observation method. First, the quantity and location of meteorological stations is extremely irregular. Meteorological stations are usually built in flat regions and experience relatively dense human activities. There are few meteorological stations (in some cases, none) in areas with high altitudes, complex terrain conditions, and scarce human activities. Second, precipitation observed form ground-based rain gauges is usually represented by “point” scale rainfall conditions, while precipitation data on the “area” scale is often more desirable in applications. Generally, precipitation data from rain gauge observations need to be spatially interpolated to an area scale. Due to the influence of geographical location, prevailing winds, terrain, and other factors, precipitation has a strong spatial and temporal heterogeneity. It is difficult to obtain accurate area-scale precipitation data through conventional interpolation processes.
With the development of remote sensing technology and meteorological satellite technology, the detection, inversion, and assimilation of precipitation information by satellite remote sensing data provide new means for studying precipitation. Satellite-based precipitation observation data contain a wide range of observations, are not limited by terrain and weather conditions, and can intuitively reflect the temporal and spatial distribution characteristics of precipitation. Satellites have become an important source of precipitation data, especially in areas where rain gauges are scarce, such as oceans, deserts, rainforests, and so on.
As a joint project of the National Aeronautics and Space Administration (NASA) and Japan Aerospace Exploration Agency (JAXA), the Tropical Rainfall Measuring Mission (TRMM) was successfully launched in 1997, carrying with it the first satellite-borne precipitation radar, which could provide new insights into tropical storm structures and intensification, water vapor, cloud water, and rainfall intensity in the atmosphere [6]. TRMM precipitation data have been widely used in recent years and have afforded researchers a large amount of surface precipitation data [7,8,9], which compensate for the current insufficiency of ground rainfall measurement stations.
In order to improve the temporal and spatial resolution of the TRMM data, significant research has been carried out. Immerzeel, et al. [2] found that the normalized difference vegetation index (NDVI) is a good proxy for precipitation and proposed a spatial downscaling methodology that uses coarse scale TRMM precipitation estimates and fine scale NDVI patterns to increase the spatial resolution of TRMM data from 25 km to 1 km. Thereafter, Lloyd et al. [10], Duan et al. [11], Park et al. [12], and Fang et al. [13] established a linear or exponential regression model between precipitation, NDVI, and digital elevation model (DEM) to achieve the spatial downscaling of TRMM. Later, the wavelet [14], multifractal [15], Bayesian model [16], area-to-point kriging (ATPK) [17,18,19,20,21], geographic weight regression methods (GWR) [18,22,23,24,25,26], random forests (RF) method [5,27,28], support vector machine (SVM) [29], and artificial neural network method [30] were also introduced into the spatial downscaling of TRMM data by establishing a statistical relationship between TRMM data and environmental parameters, such as NDVI, DEM, latitude, longitude, slope, aspect, land surface temperature, and so on [31,32,33,34]. However, these spatial downscaling methods are only available on an annual scale, because environmental variables, such as vegetation and DEM, usually show a long-term distribution of precipitation. Moreover, the response of vegetation to precipitation has a hysteresis phenomenon [35], which cannot reflect the amount of precipitation in the short term. In order to improve the temporal resolution of satellite precipitation observation data, Wang et al. [9], Duan et al. [11], Zhang et al. [21], and Ma et al. [28] used the monthly ratio multiplied by the corresponding spatial downscaled annual datasets to obtain monthly downscaled data. However, because precipitation changes dramatically over time, it is difficult to use these precipitation downscaling methods at higher temporal resolutions.
The main objective of this study is to improve the temporal resolution of satellite-observed precipitation products through the synergetic use of precipitation and soil moisture data at regional and basin scales. Based on this temporal downscaling method, TRMM monthly precipitation products were downscaled to a daily scale. The final temporal downscaled result was validated based on 365 days of observations from 23 rain-gauge stations in the middle reaches of the Yellow River. These results show that this method is simple and feasible and could be used as a supplement for obtaining daily-scale precipitation data, thereby providing a new reference for the study of the temporal downscaling of satellite-based remote sensing datasets with low temporal resolutions. Moreover, this study could intensify our understanding of precipitation temporal downscaling methodology and will be useful for hydrology and water resource management in areas without sufficient ground rain gauges.
In Section 2 we describe the datasets used in this study and the downscaling method design, development, and procedures used for validation. The downscaled results are presented in Section 3, and we provide a brief synopsis of the results, implications, and methodological limitations in Section 4. In Section 5, the conclusion is made and future work is proposed.

2. Materials and Methods

2.1. Study Area

The study area, the Hekouzhen to Tongguan area of the Yellow River, is located in central China, with a latitude from 33°40′N to 40°35′N and a longitude from 103°57′E to 112°39′E, covering 2.5 million square kilometers. Figure 1 shows the spatial distribution of the elevation and geographical locations of the rain gauges in this study area. The terrain is high in the northwest and low in the southeast (mainly hilly with plateaus), with an altitude of 207 m to 3329 m. Because the study area is located in a transitional region from a humid to arid climate, the annual and inter-annual precipitation changes greatly, with an average annual precipitation of 466 mm/y [24]. The vegetation type of the study area is mainly warm temperate deciduous broad-leaved forest. Due to the obvious vertical-joint characteristics of loess and the strong spatio–temporal heterogeneity of precipitation, the problem of wind erosion and water erosion is prominent in this area, which is the main source of sediment in the lower reaches of the Yellow River [36].

2.2. Data Resources

TRMM monthly precipitation data (TRMM 3B43 version 7) were acquired from the NASA Precipitation Measurement Mission Center website (https://pmm.nasa.gov/TRMM). This is a multi-source monthly scale precipitation product integrated with TRMM dual-channel passive microwave radiometer (TMI) data, Special Sensor Microwave Imager (SMMI) data, Advanced Microwave Scanning Radiometer for Earth Observing System (AMSR-E) data, Advanced Microwave Sounding Unit (AMSU) data, and Global Precipitation Climatology Project (GPCP) and ground rain gauge observations, which seek to produce the best estimate of precipitation and minimal root-mean-square (RMS) precipitation-error estimates from satellite sensors and the rain gauge network [22,37]. Because of the availability of the in-situ data, the TRMM precipitation products used in this study cover the whole year of 2013 with a spatial resolution of 0.25° × 0.25°. In addition, as a widely used source of high temporal resolution precipitation data, the TRMM 3B42 precipitation product is also used as auxiliary data to verify the accuracy of the downscaling results. The TRMM 3B42 provides precipitation observations every 3 hours and has the same spatial resolution as TRMM 3B43.
The Advanced Microwave Scanning Radiometer 2 (AMSR2) level 3 soil moisture product (https://suzaku.eorc.jaxa.jp/GCOM_W/index.html) (for 2013), with a spatial resolution of 0.25° × 0.25°, was adopted in this study. This product uses the Land Parameter Retrieval Model (LPRM) to establish a functional relationship between C-band (6.9 GHz) bright temperatures and surface environmental parameters and inverts surface soil moisture and vegetation water content simultaneously through an energy radiation transfer model and the nonlinear circulation method [38,39].
The land use and land cover (LULC) data, MCD12A1 of the study in 2013, were obtained from the Moderate Resolution Imaging Spectroradiometer (MODIS). This product has a spatial resolution of 500 m and was derived from NASA’s earth data website (https://earthdata.nasa.gov/). MODIS provides five optional LULC classification systems: International Geosphere-Biosphere Programme (IGBP) classification, University of Maryland (UMD) classification, Leaf Area Index (LAI) classification, BIOME-Biogeochemical Cycle (BGC) classification, and Plant Functional Type classification. In this paper, IGBP classification was used to mark the underlying surface conditions around the rain gauges.
The DEM data were derived from NASA’s Shuttle Radar Topography Mission (SRTM, http://srtm.csi.cgiar.org/). The spatial coverage of the SRTM DEM is 56°S to 60°N, covering more than 80% of the global land surface and providing two spatial resolutions: SRTM1 (spatial resolution is 1′, about 30 m) and SRTM3 (spatial resolution is 3′, about 90 m). Since SRTM1 only covers North America, SRTM3 is used in this paper to obtain the slope layer of the study area, representing the topographic fluctuation around each meteorological station.
The ground observations used in this study were provided by the National Meteorological Information Center of China (http://data.cma.cn/). The daily precipitations of 23 rain gauges were provided in this study area. The spatial distribution and basic attribute information for all the ground observation stations are shown in Figure 1 and Table 1.

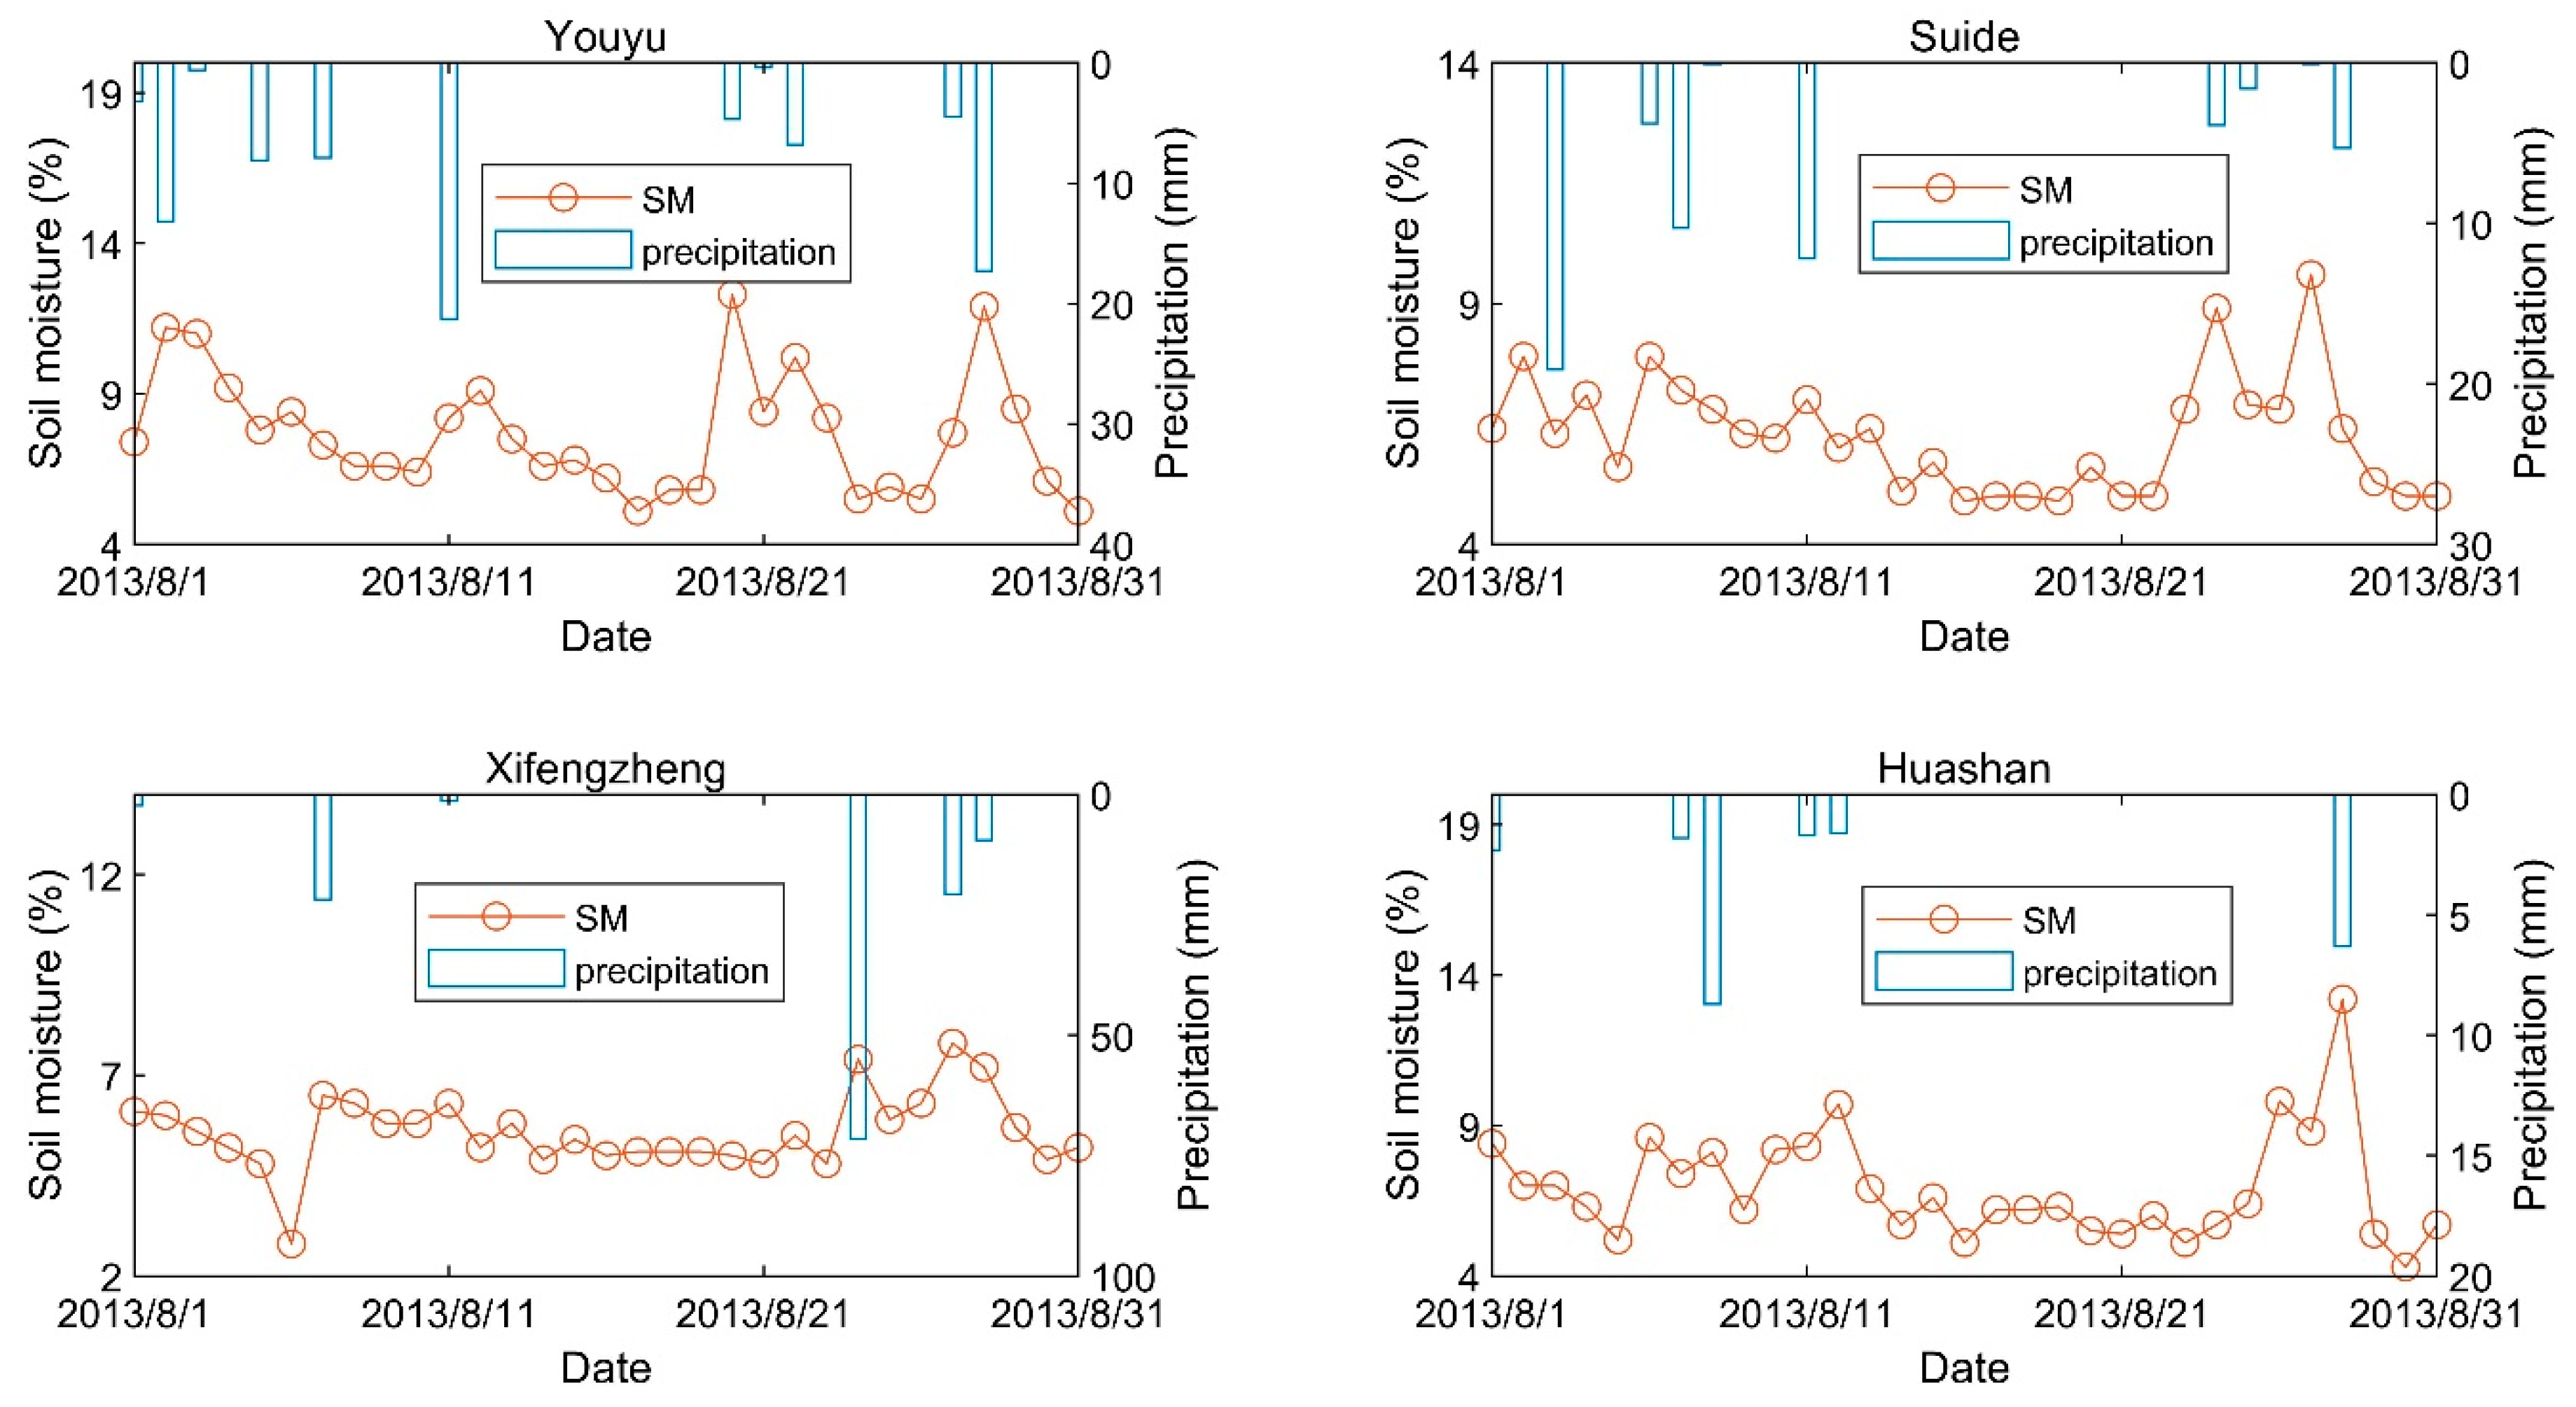
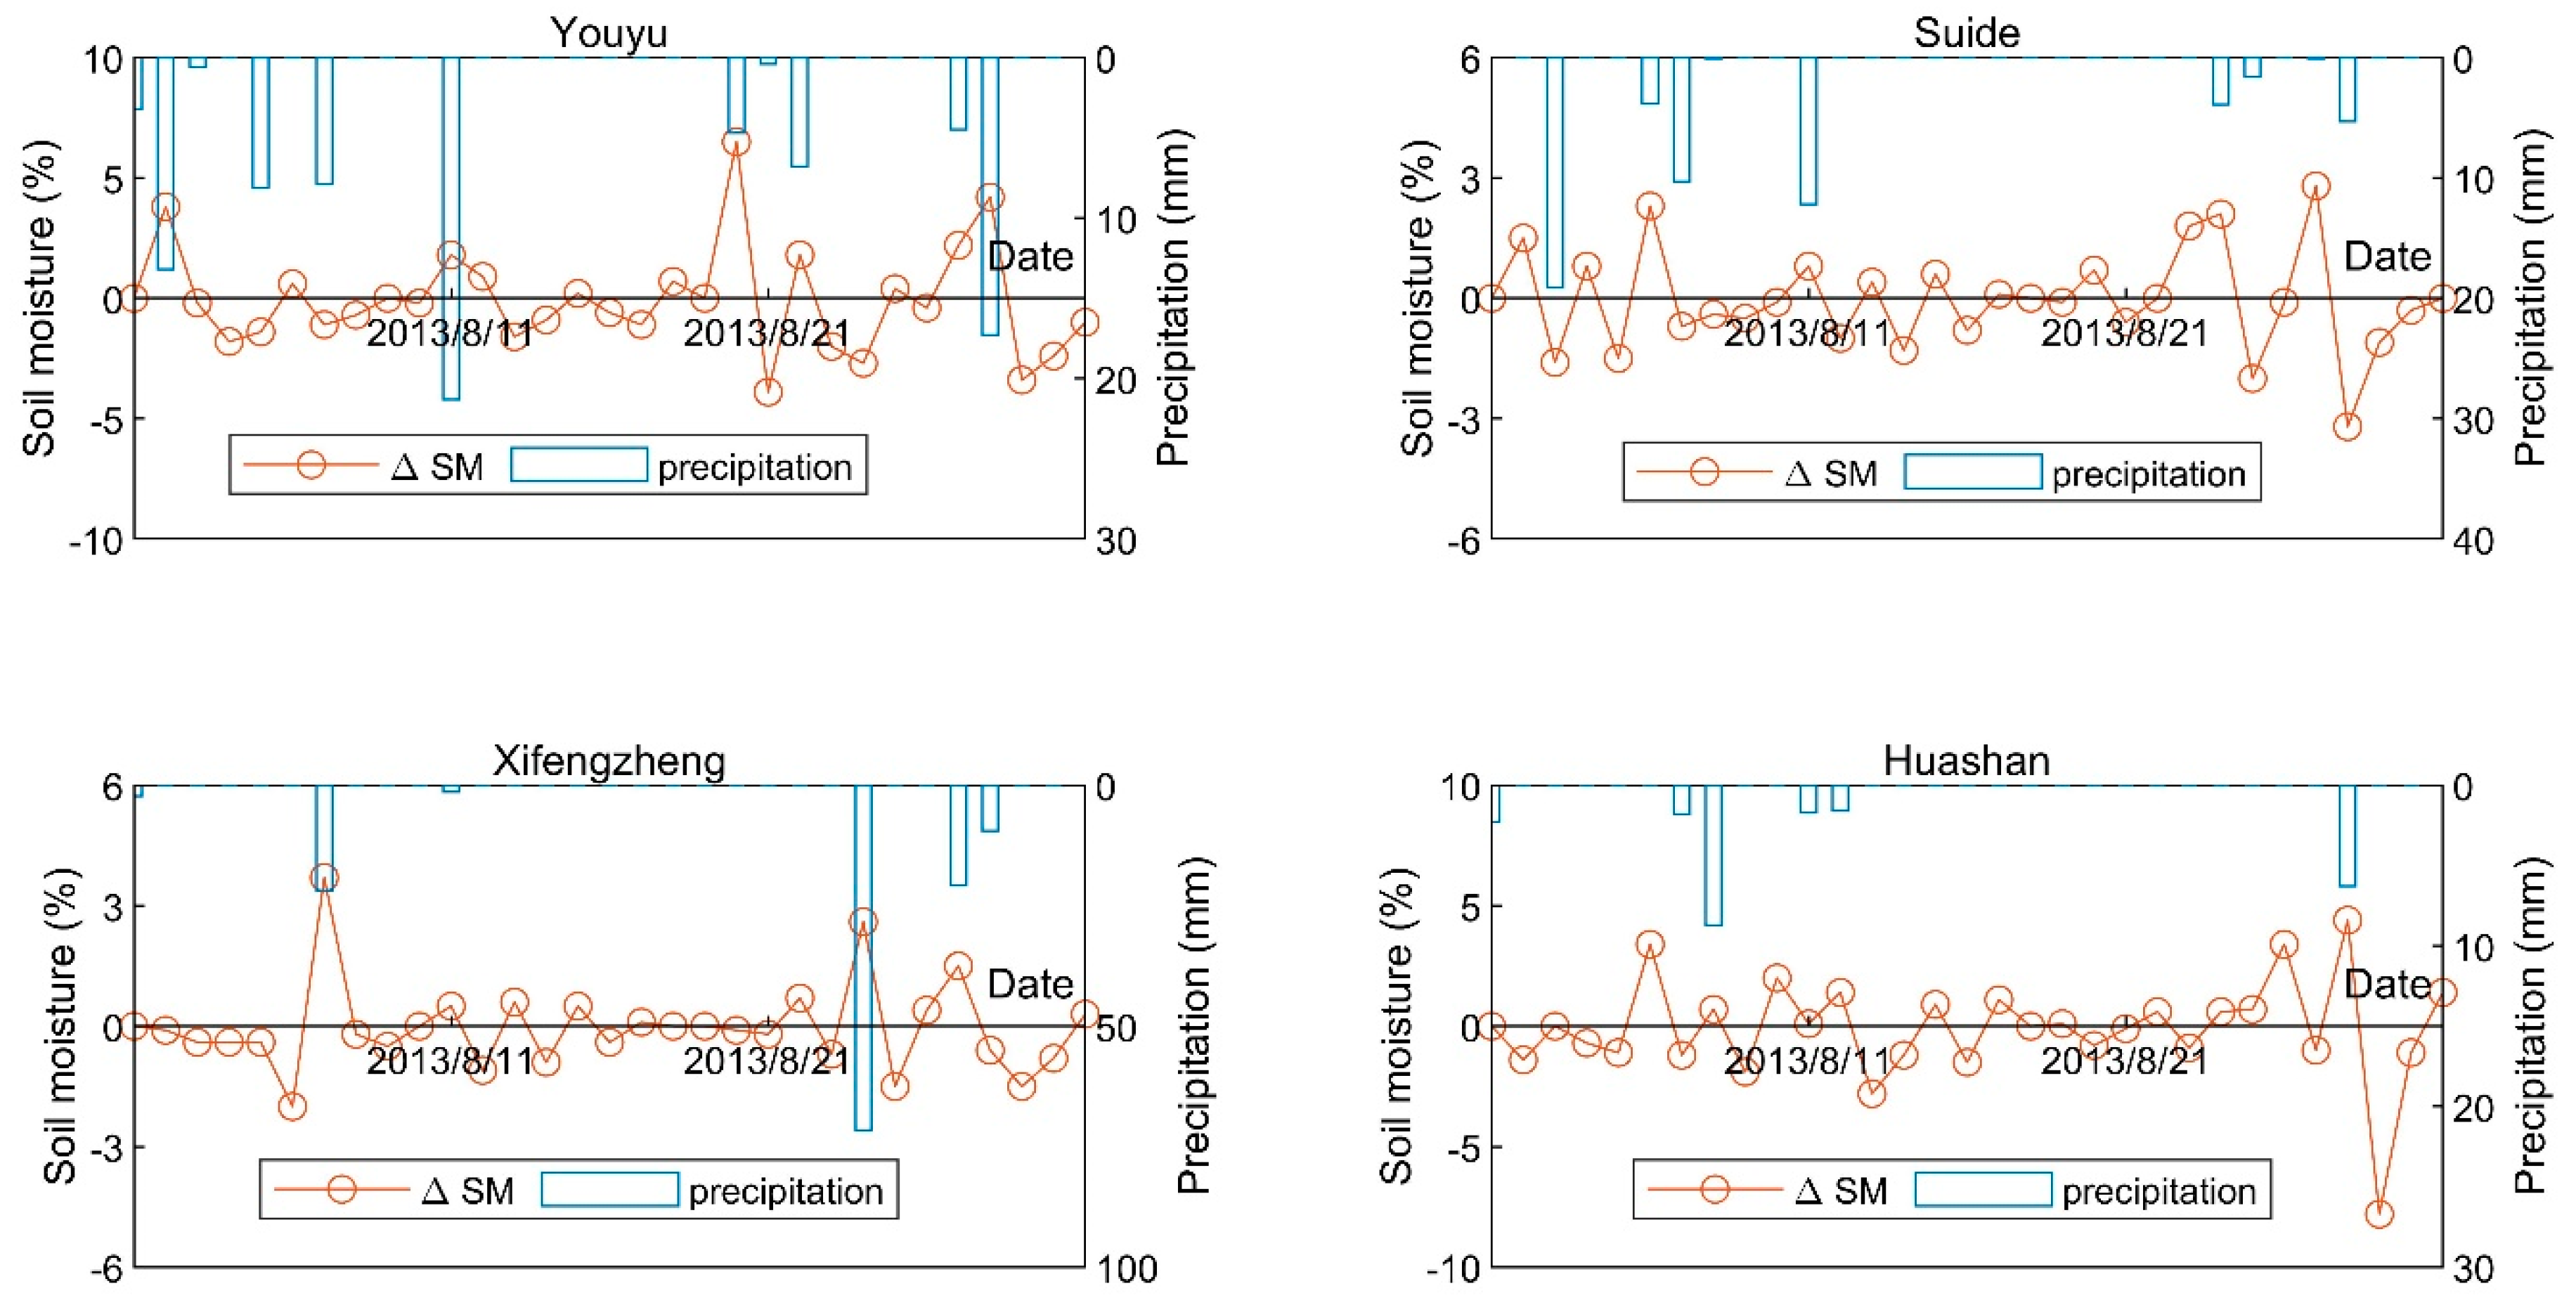
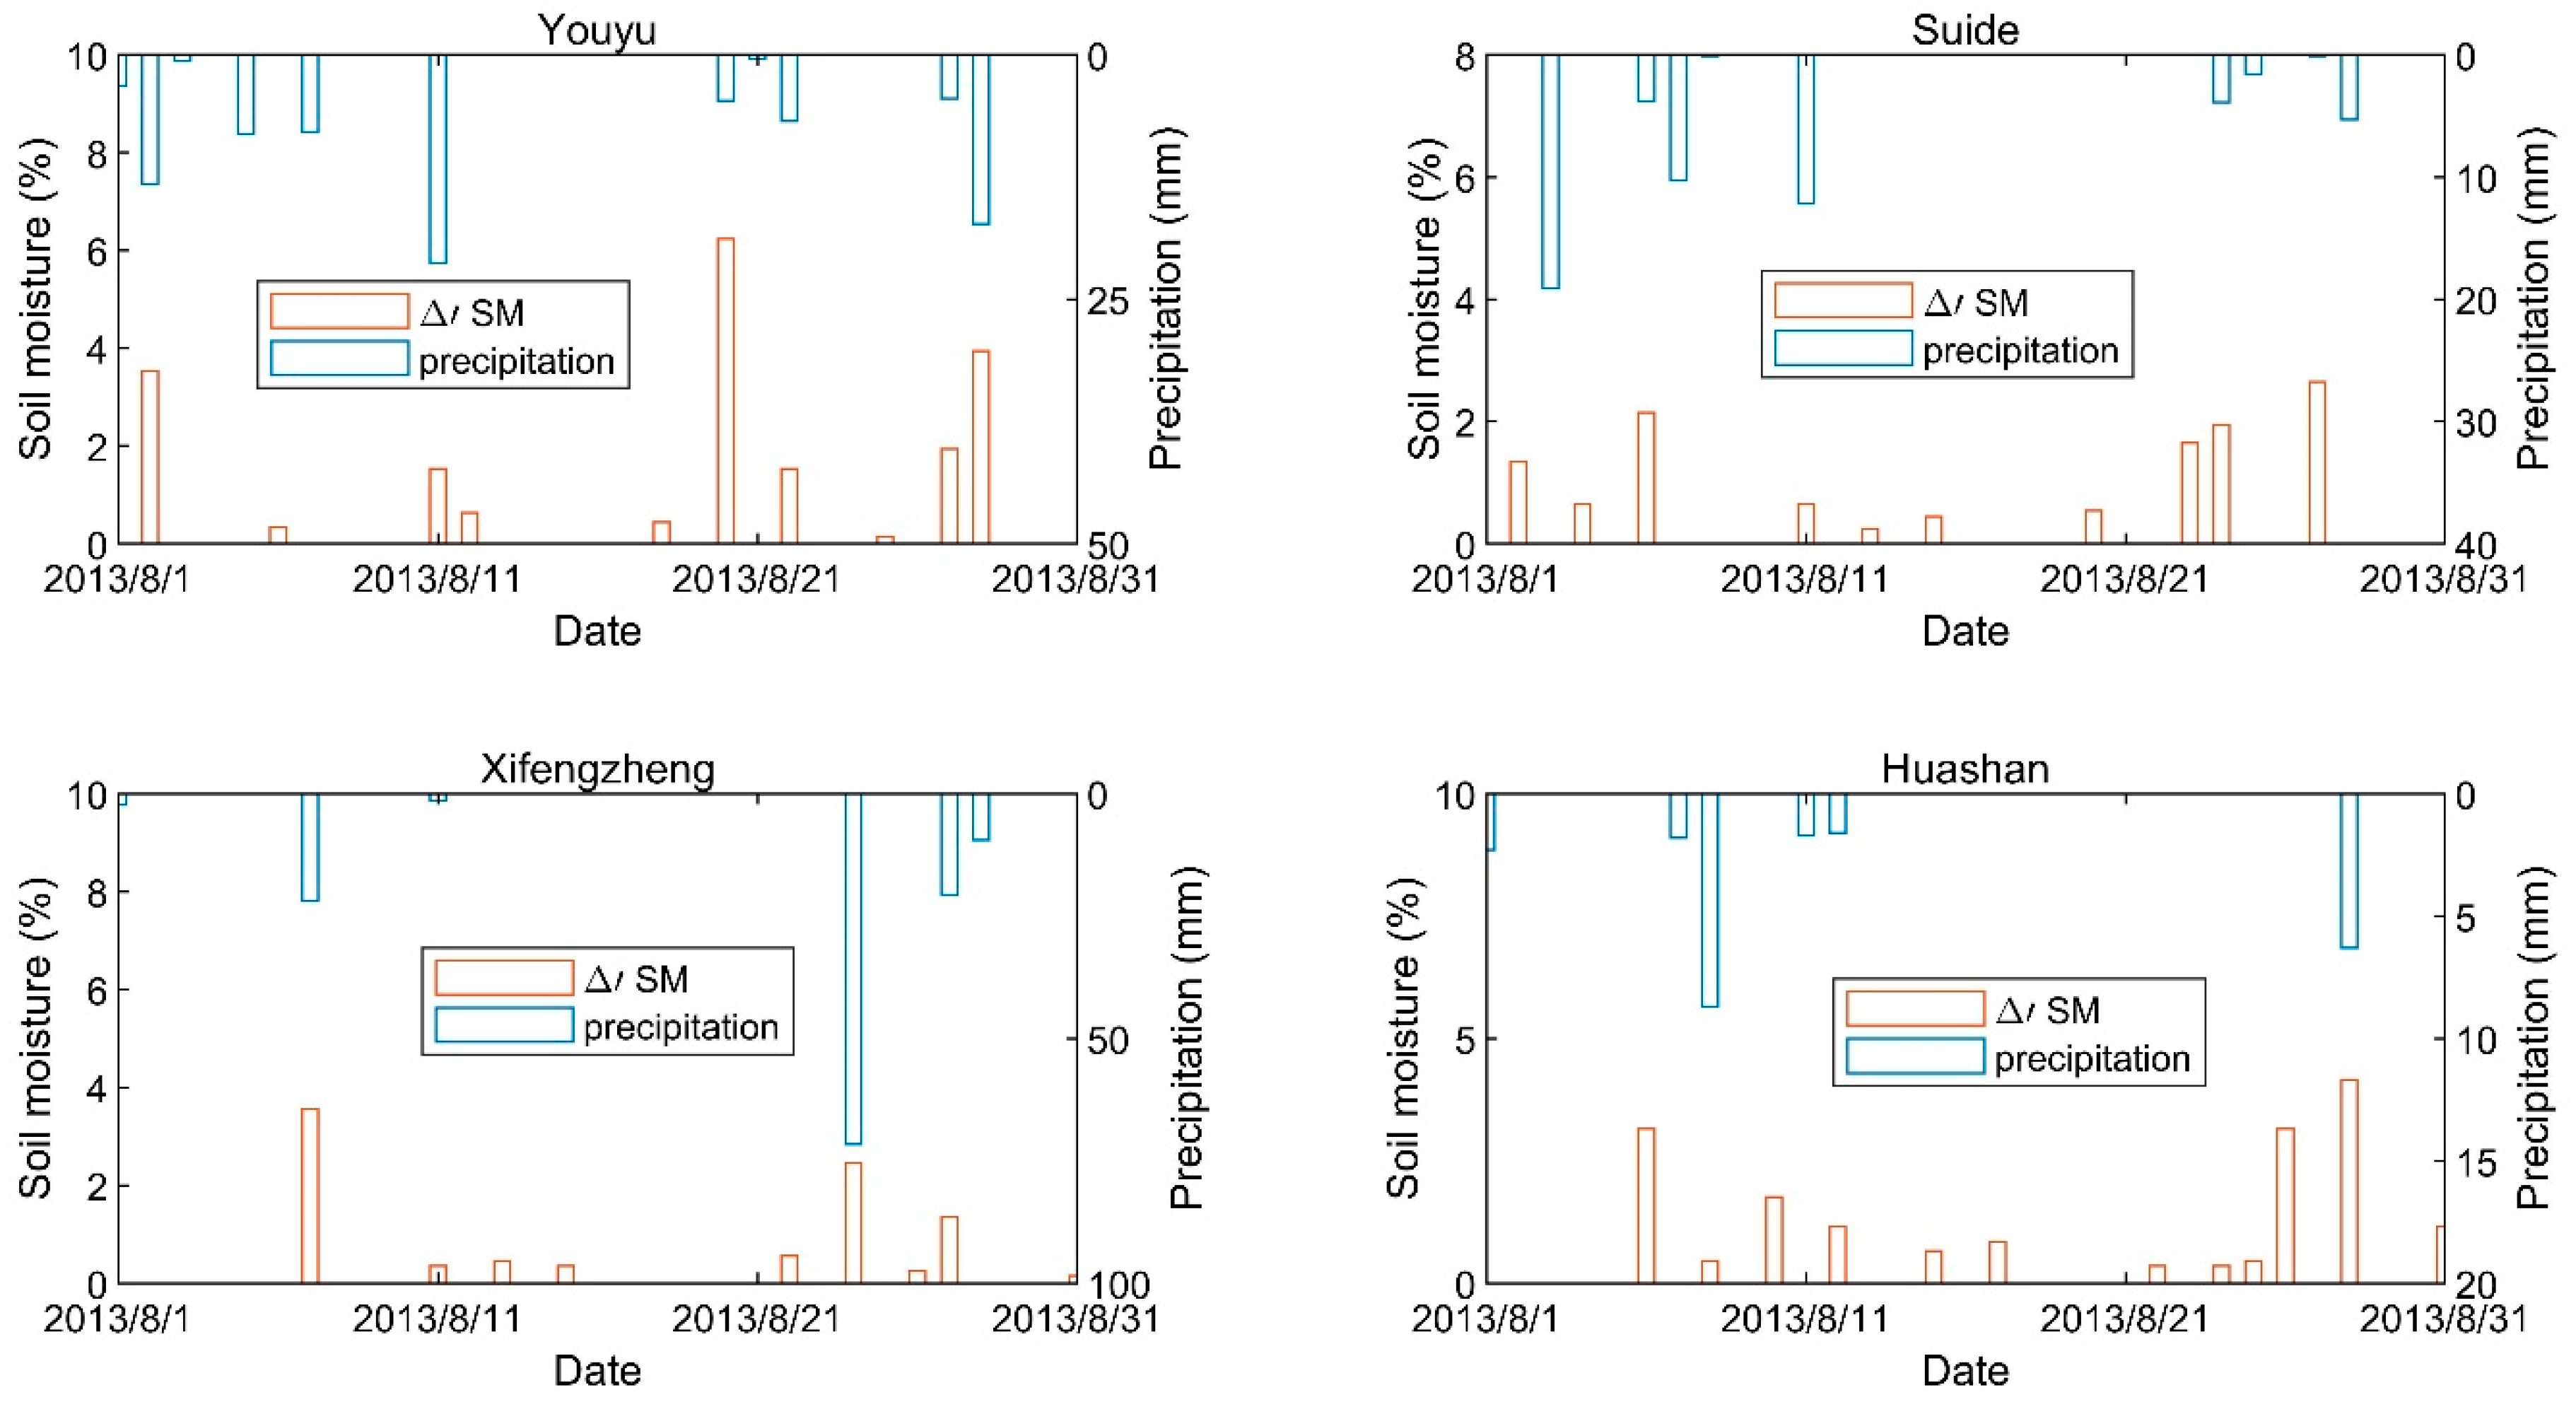
2.3. The Relationship between Precipitation and Soil Moisture

There have been many studies on the spatial downscaling of precipitation [18,19,40], soil moisture [35,41,42,43,44], land surface temperature [45,46,47,48], and so on. The basic idea of these methods is to use the spatial variation characteristics reflected by high-resolution auxiliary data to improve the spatial resolution of these surface parameters. Based on this methodology, for the surface parameters with low temporal resolution, auxiliary data with high temporal resolution can also be used to realize temporal downscaling and improve temporal resolution. Therefore, the daily precipitation and corresponding soil moisture data of each rain gauge station in August 2013 were analyzed. Due to the limitations of the frame, only the four stations of Youyu, Suiude, Xifengzheng and Huashan are listed here. These four stations are discretely distributed in the study area, and their annual precipitation and soil water values vary greatly. The average annual precipitation of the four stations from 2000 to 2013 is 426 mm, 433.1 mm, 555.5 mm, and 735.4 mm, respectively. The annual precipitation is ranked 6th, 8th, 18th, and 23rd among the 23 stations, from low to high. The relationship between precipitation and soil moisture (SM), soil moisture differences between the day and the previous day ( Δ S M = S M i S M i 1 ), and the soil moisture index ( Δ S M in Equation (1)), which is a proxy of daily precipitation, were analyzed to find the most suitable parameter for the temporal downscaling of monthly precipitation.
Figure 2 shows that soil moisture is increased more noticeably on days with precipitation than on days without precipitation. For one station, the higher the precipitation, the higher the soil moisture will be. There is, then, a “positive correlation” between precipitation and soil moisture. Therefore, the magnitude of soil moisture can illustrate the temporal distribution of precipitation to some extent. However, soil moisture also showed slight fluctuations when it was not raining. Moreover, the initial soil moisture varies from station to station, and the sensitivity of soil moisture to the response of precipitation is also different. As a result, using soil moisture directly will not reveal the precipitation very accurately.
In order to reduce the impact of different initial moisture levels, a soil moisture increment ( Δ S M ), defined as the soil moisture of a day minus the soil moisture of the previous day, is used. The relationship between Δ S M and precipitation is shown in Figure 3. When there is no rainfall, the fluctuation of the Δ S M curve is gentle—almost close to zero. When precipitation occurs, Δ S M shows a large fluctuation. This step can effectively eliminate the influence caused by different initial moisture contents. However, soil moisture on non-precipitation days may still show some changes due to day and night alternations or the inherent errors of soil moisture data. Therefore, Δ S M cannot be used to represent the amount of precipitation directly.
In order to further exclude the irregular changes of soil moisture caused by non-precipitation factors, the following assumptions were made:
(1) The monthly Δ S M obeys t distribution.
(2) The small fluctuation of soil moisture increments within a confidence interval of 0.8 (one-sided) is caused by non-rainfall factors.
Due to the high spatiotemporal heterogeneity of precipitation, the above hypotheses, although not completely consistent with reality, were allowed for exploration. Based on these assumptions, a date with a confidence level less than 0.8 is considered as “a day without precipitation”. Conversely, marked as “the raining day”, Δ S M retains the original value. The discrimination criterion was established as follows:
Δ S M = { 0 Δ S M < X ¯ + S n t α ( n 1 ) Δ S M Δ S M X ¯ + S n t α ( n 1 )
where Δ S M is the soil moisture index, X ¯ is the mean of Δ S M , S is the standard deviation of Δ S M , n is the total number of days in a month, and 1 α is the confidence level.
Figure 4 shows that the Δ S M and precipitation have a strong positive correlation. The larger Δ S M is, the greater the daily precipitation will be. Therefore, Δ S M could describe the distribution of precipitation very well and is suitable for the temporal downscaling of monthly precipitation data in a long time series.

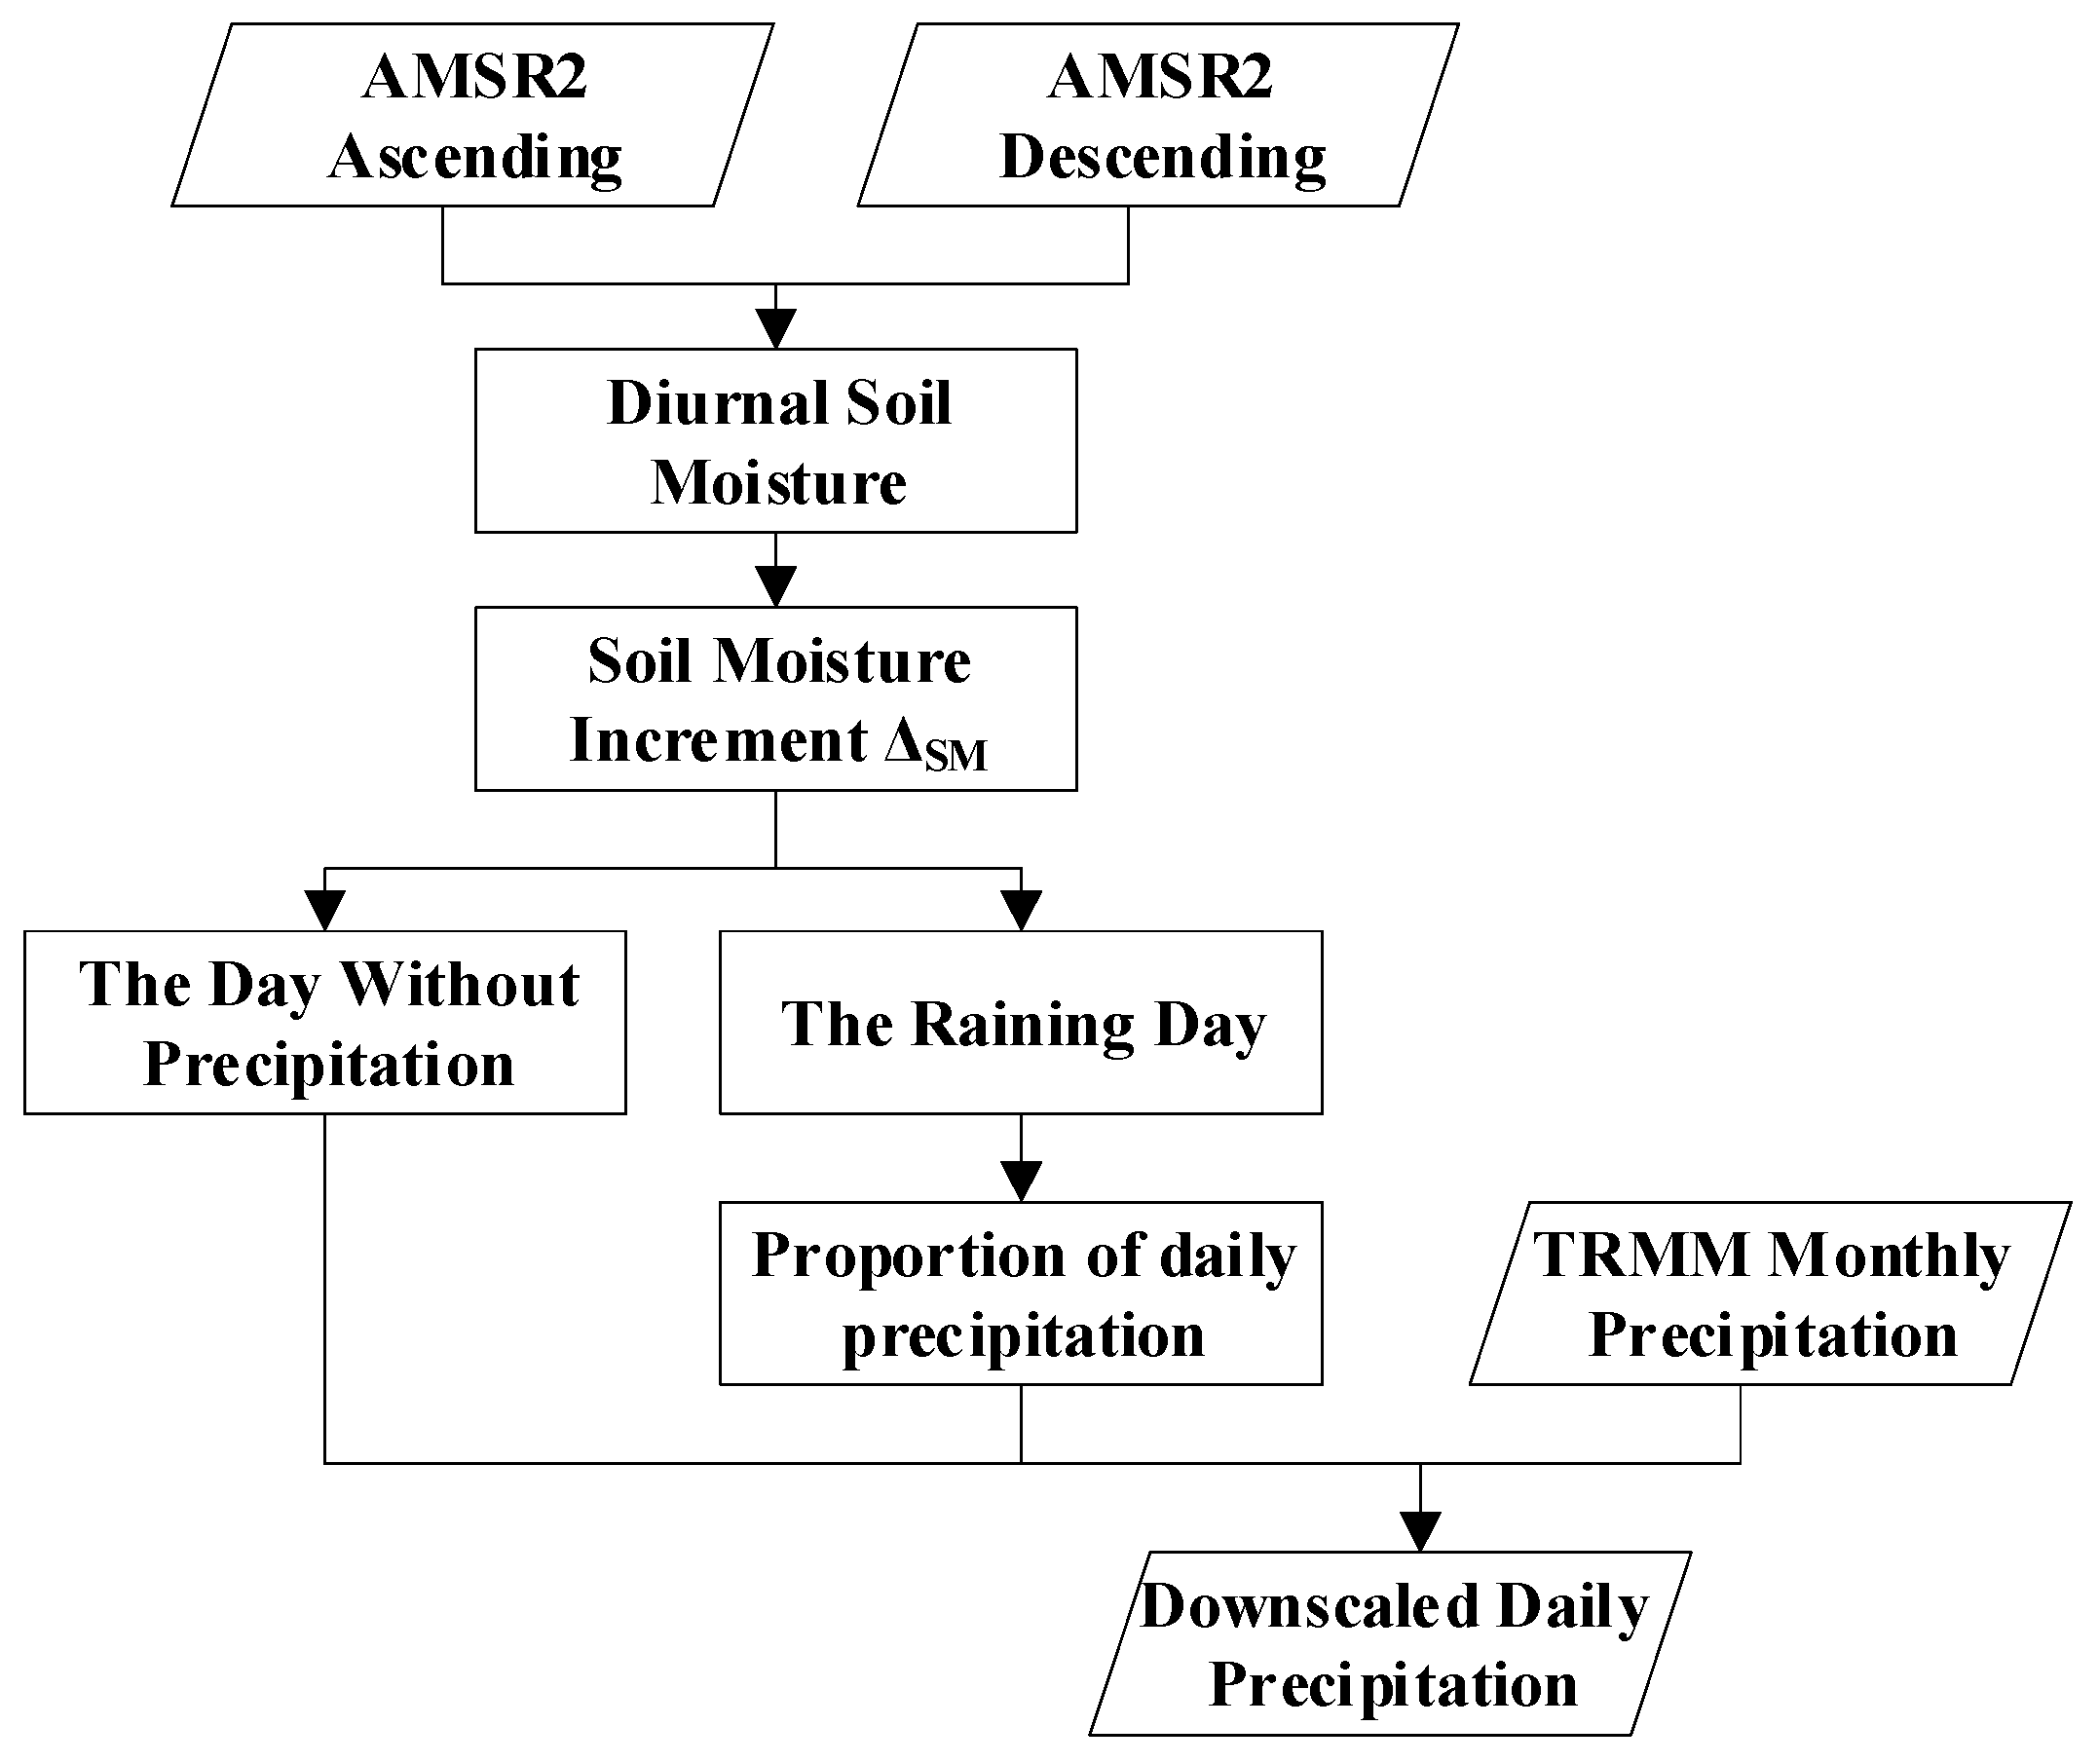
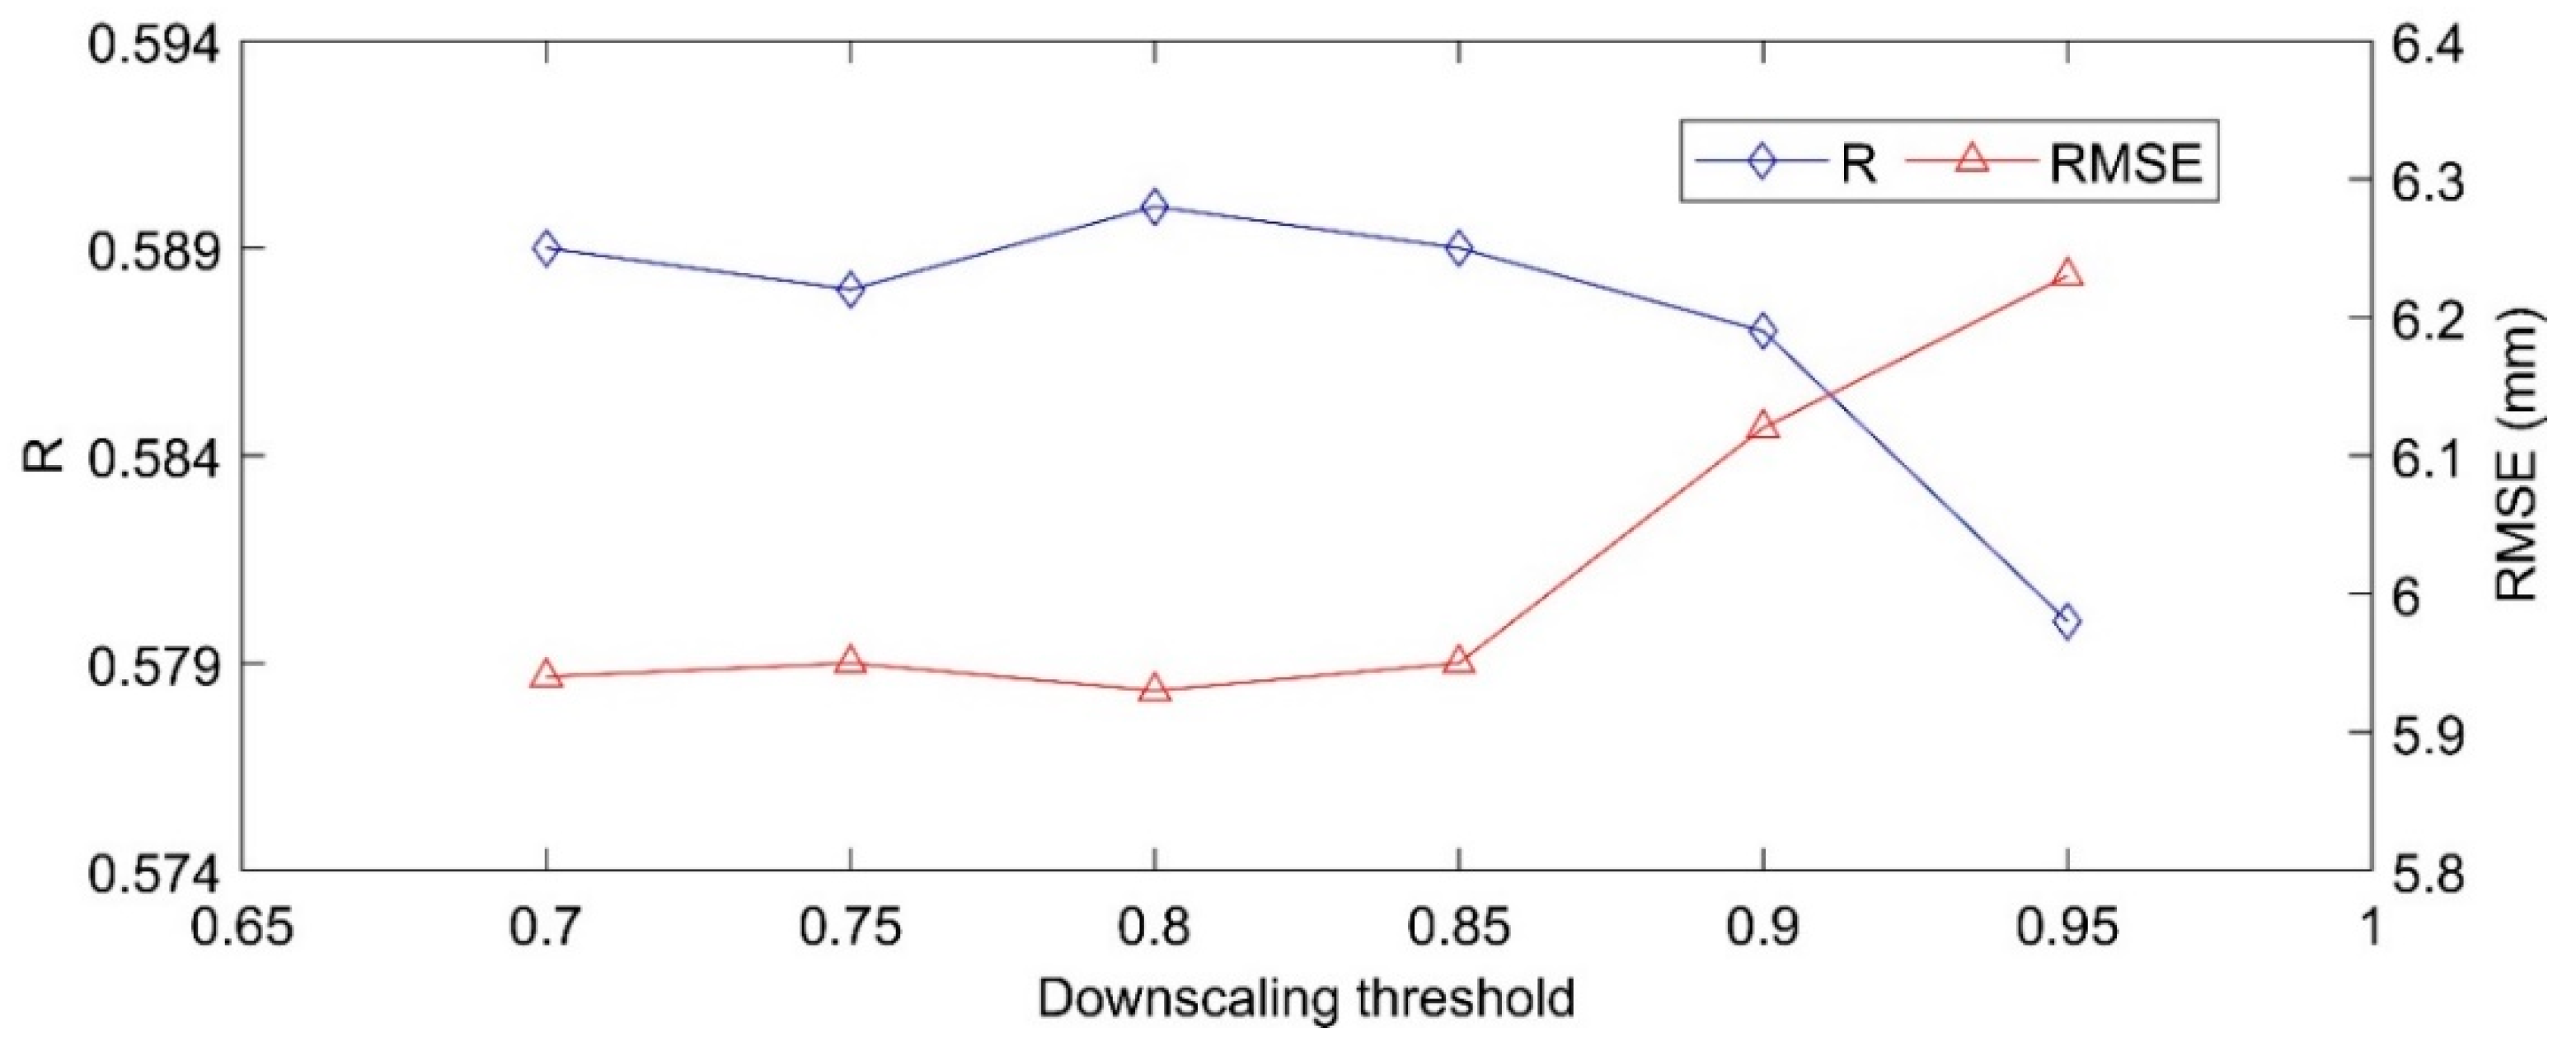
2.4. Temporal Downscaling Method

According to the results of analysis of the daily precipitation and soil moisture data collected, there is a relatively stable relationship between the soil moisture increment and precipitation in a long time series and in different regions. Therefore, in this paper, the soil moisture index was calculated by AMSR2 soil moisture products to temporally downscale the TRMM monthly precipitation data. This downscaling process is shown in Figure 5.
(1) To address the data gaps caused by satellite orbit and scan width and to ensure that the daily soil moisture data can completely cover the whole study area, AMSR2 ascending and descending data was filled by the mean of the adjacent periodic data. The gap-filled ascending and descending data were used for the maximum value composite (MVC) to obtain the daily soil moisture.
(2) The soil moisture increment ( Δ S M ) can be obtained by subtracting the soil moisture of the previous day.
(3) Equation (1) was used to adjust Δ S M to obtain the soil moisture index ( Δ S M ).
(4) It is believed that the soil moisture index can reflect the temporal variation characteristics of precipitation within one month. According to this index, the total precipitation of the month is disaggregated to obtain the daily precipitation. The following equation can be used:
P i = P m o n t h × Δ S M i / i = 1 n Δ S M i
where P i is the daily precipitation, P m o n t h is total precipitation of the month, Δ S M is the soil moisture index on day i , and n is the amount of days in that month.
In order to evaluate the effectiveness of the proposed temporal downscaling method, the estimated daily precipitation was verified by using the ground observation data from rain gauges in the study area. According to the location of the rain gauges, the corresponding pixel of the downscaled daily precipitation was extracted, and the Pearson correlation coefficient (R), mean error (ME), and root mean square error (RMSE) were calculated.
R = i = 1 n ( x i x ¯ ) ( y i y ¯ ) i = 1 n ( x i x ¯ ) 2 i = 1 n ( y i y ¯ ) 2
M E = i = 1 n ( x i y i ) / n
R M S E = i = 1 n ( x i y i ) 2 / n
where i is the date mark, n is the total number of days, x i is the daily precipitation obtained by temporal downscaling, and y i is the ground observation; x ¯ and y ¯ are the average of the precipitation derived from temporal downscaling and ground observations.

3. Results

3.1. Spatial Estimation of Daily Precipitation

According to the temporal downscaling method proposed in Section 2, the TRMM monthly precipitation is decomposed by the change of soil moisture to obtain the daily precipitation. Figure 6 presents the spatial distribution of the downscaled precipitation and the ground observed precipitation in the Hekouzhen to Tongguan of the Yellow river on 30 October and 23 November 2013. Because there were only a few discrete “points” of measured precipitation, this study used the inverse distance weighted (IDW) spatial interpolation method to interpolate the ground observed precipitation to the “regional” scale. We used the IDW interpolation tool in ArcGIS software and adopted the default parameters. As Figure 6 shows, the downscaled precipitation effectively captures the spatial pattern and magnitude of the rain gauge observations corresponding to precipitation. The precipitation observed from the rain gauges and downscaling showed the same distribution, where precipitation decreased form south to north. In addition, the precipitation obtained by the interpolation method is relatively smooth, and the precipitation information in the pixels without rain gauges may not be accurate enough. However, the downscaling method is performed on a per-pixel basis, so it can provide more detail.

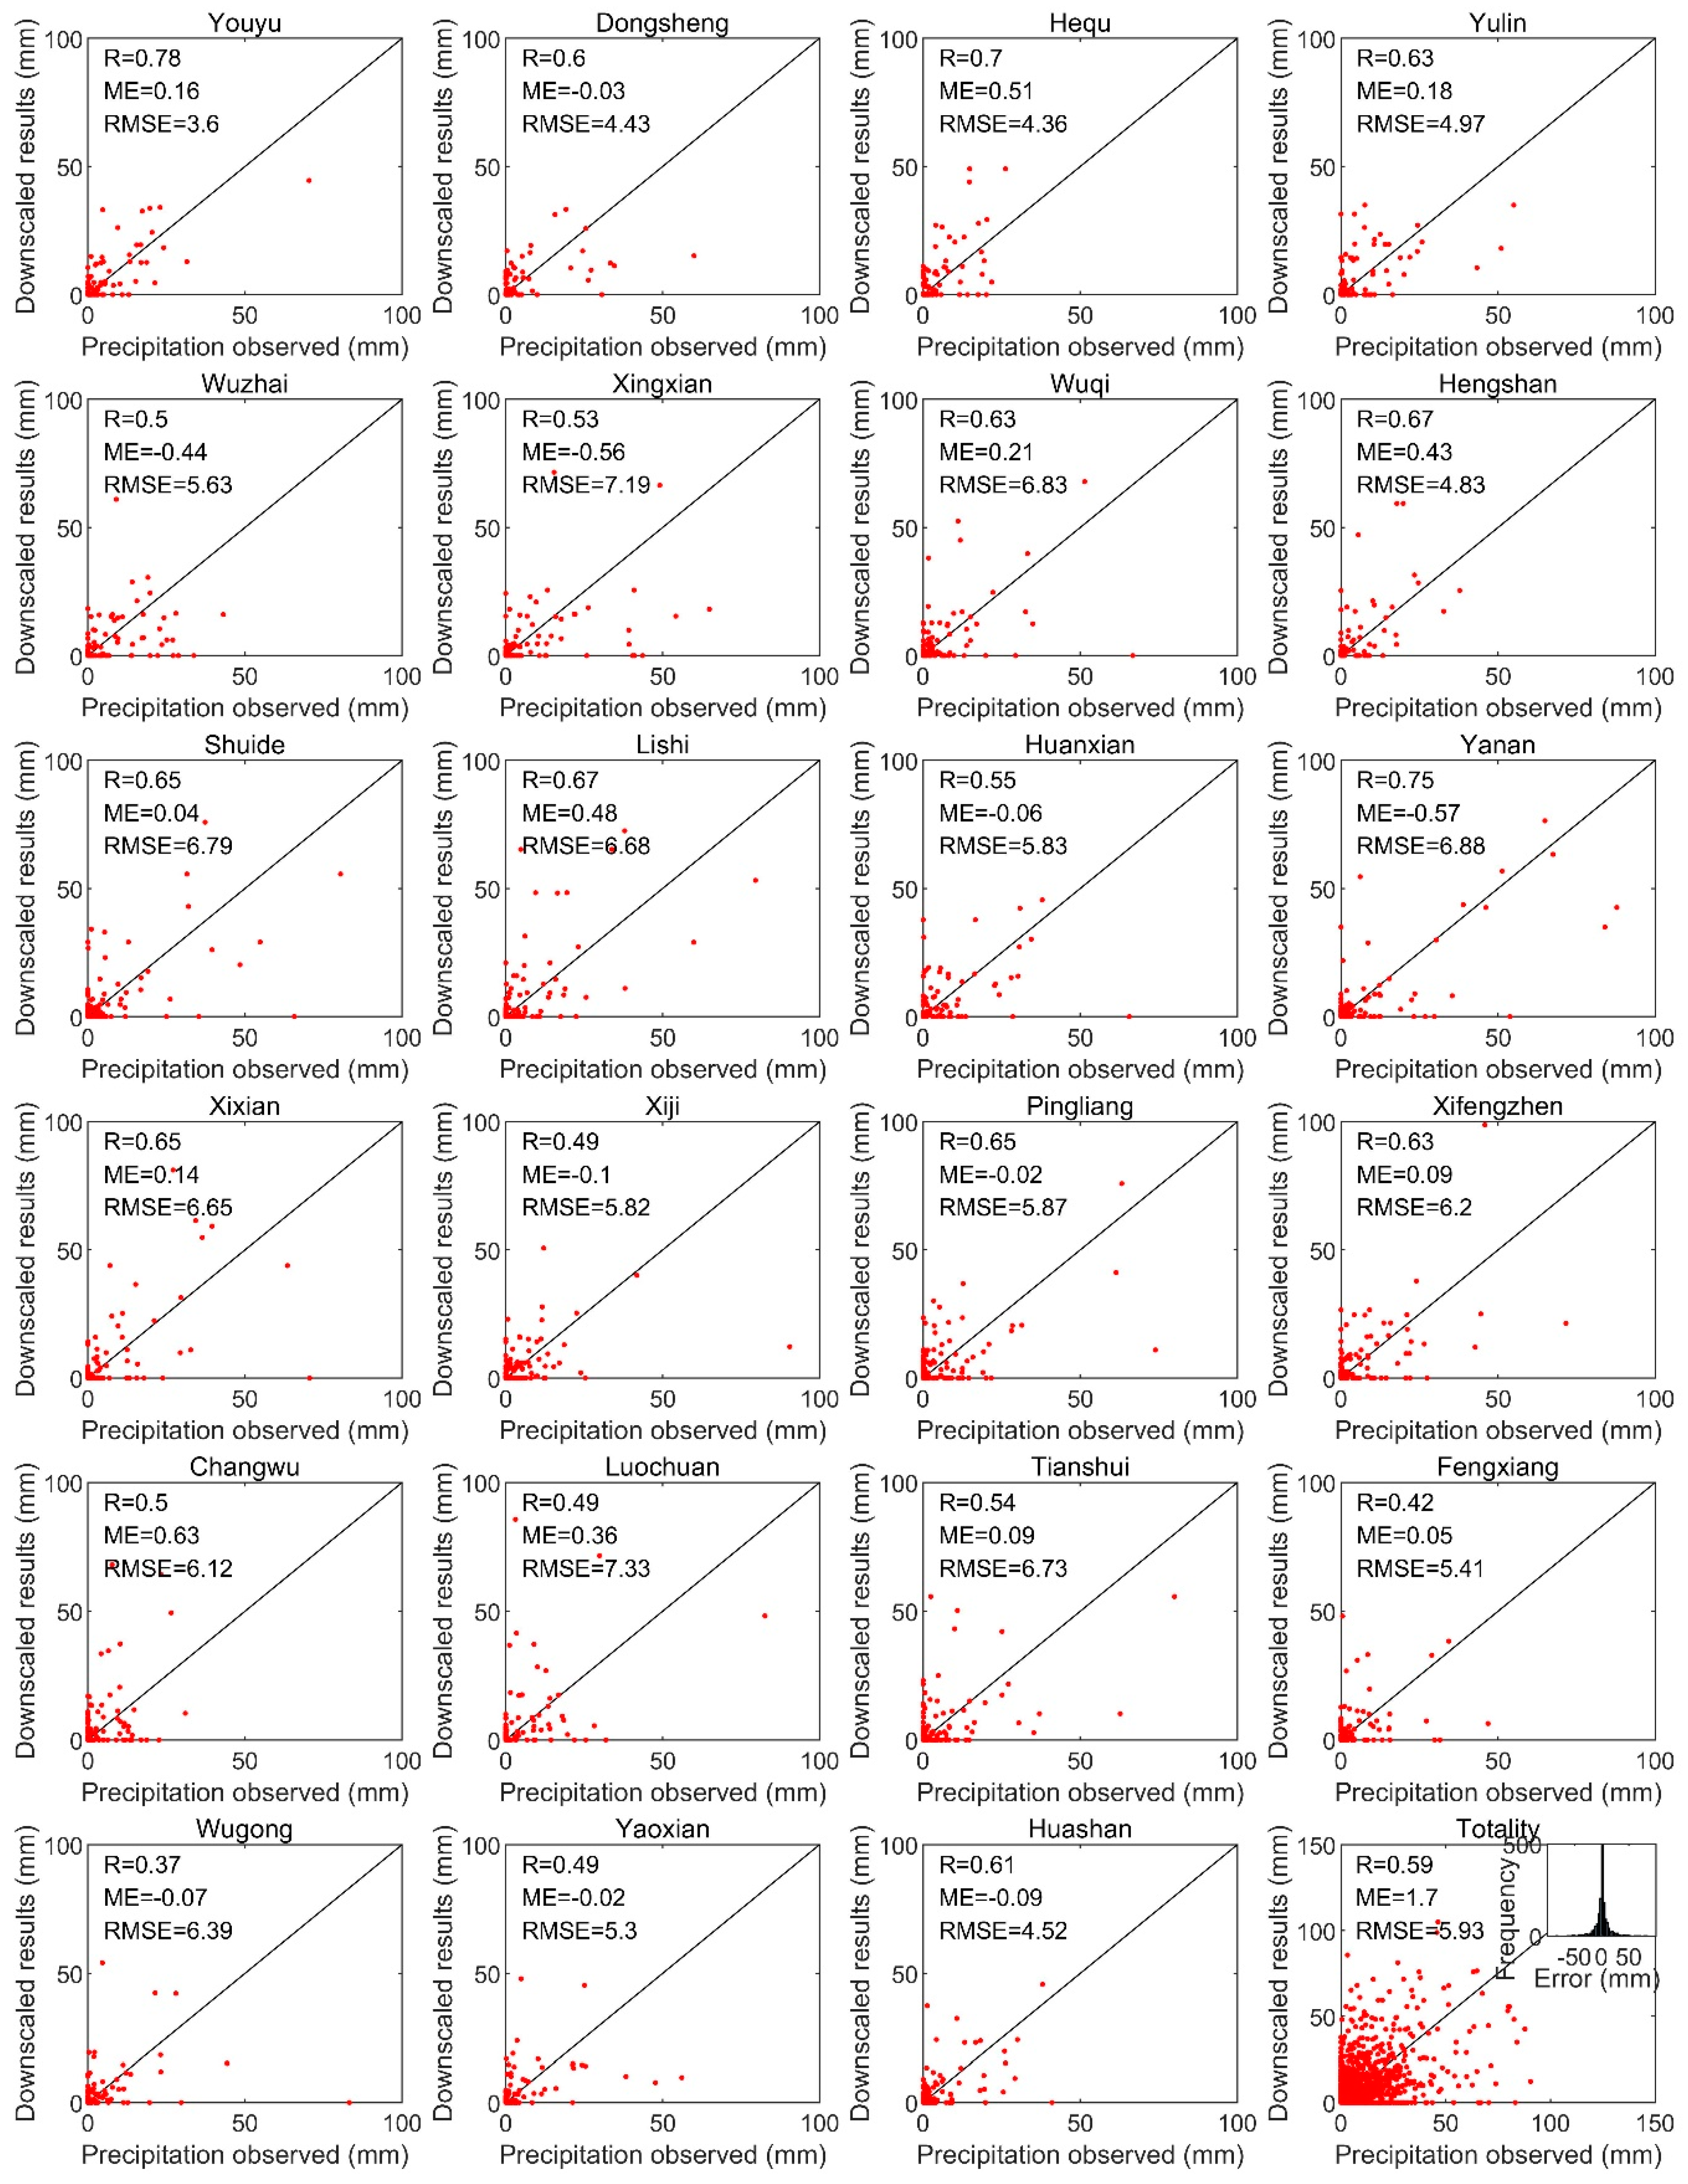
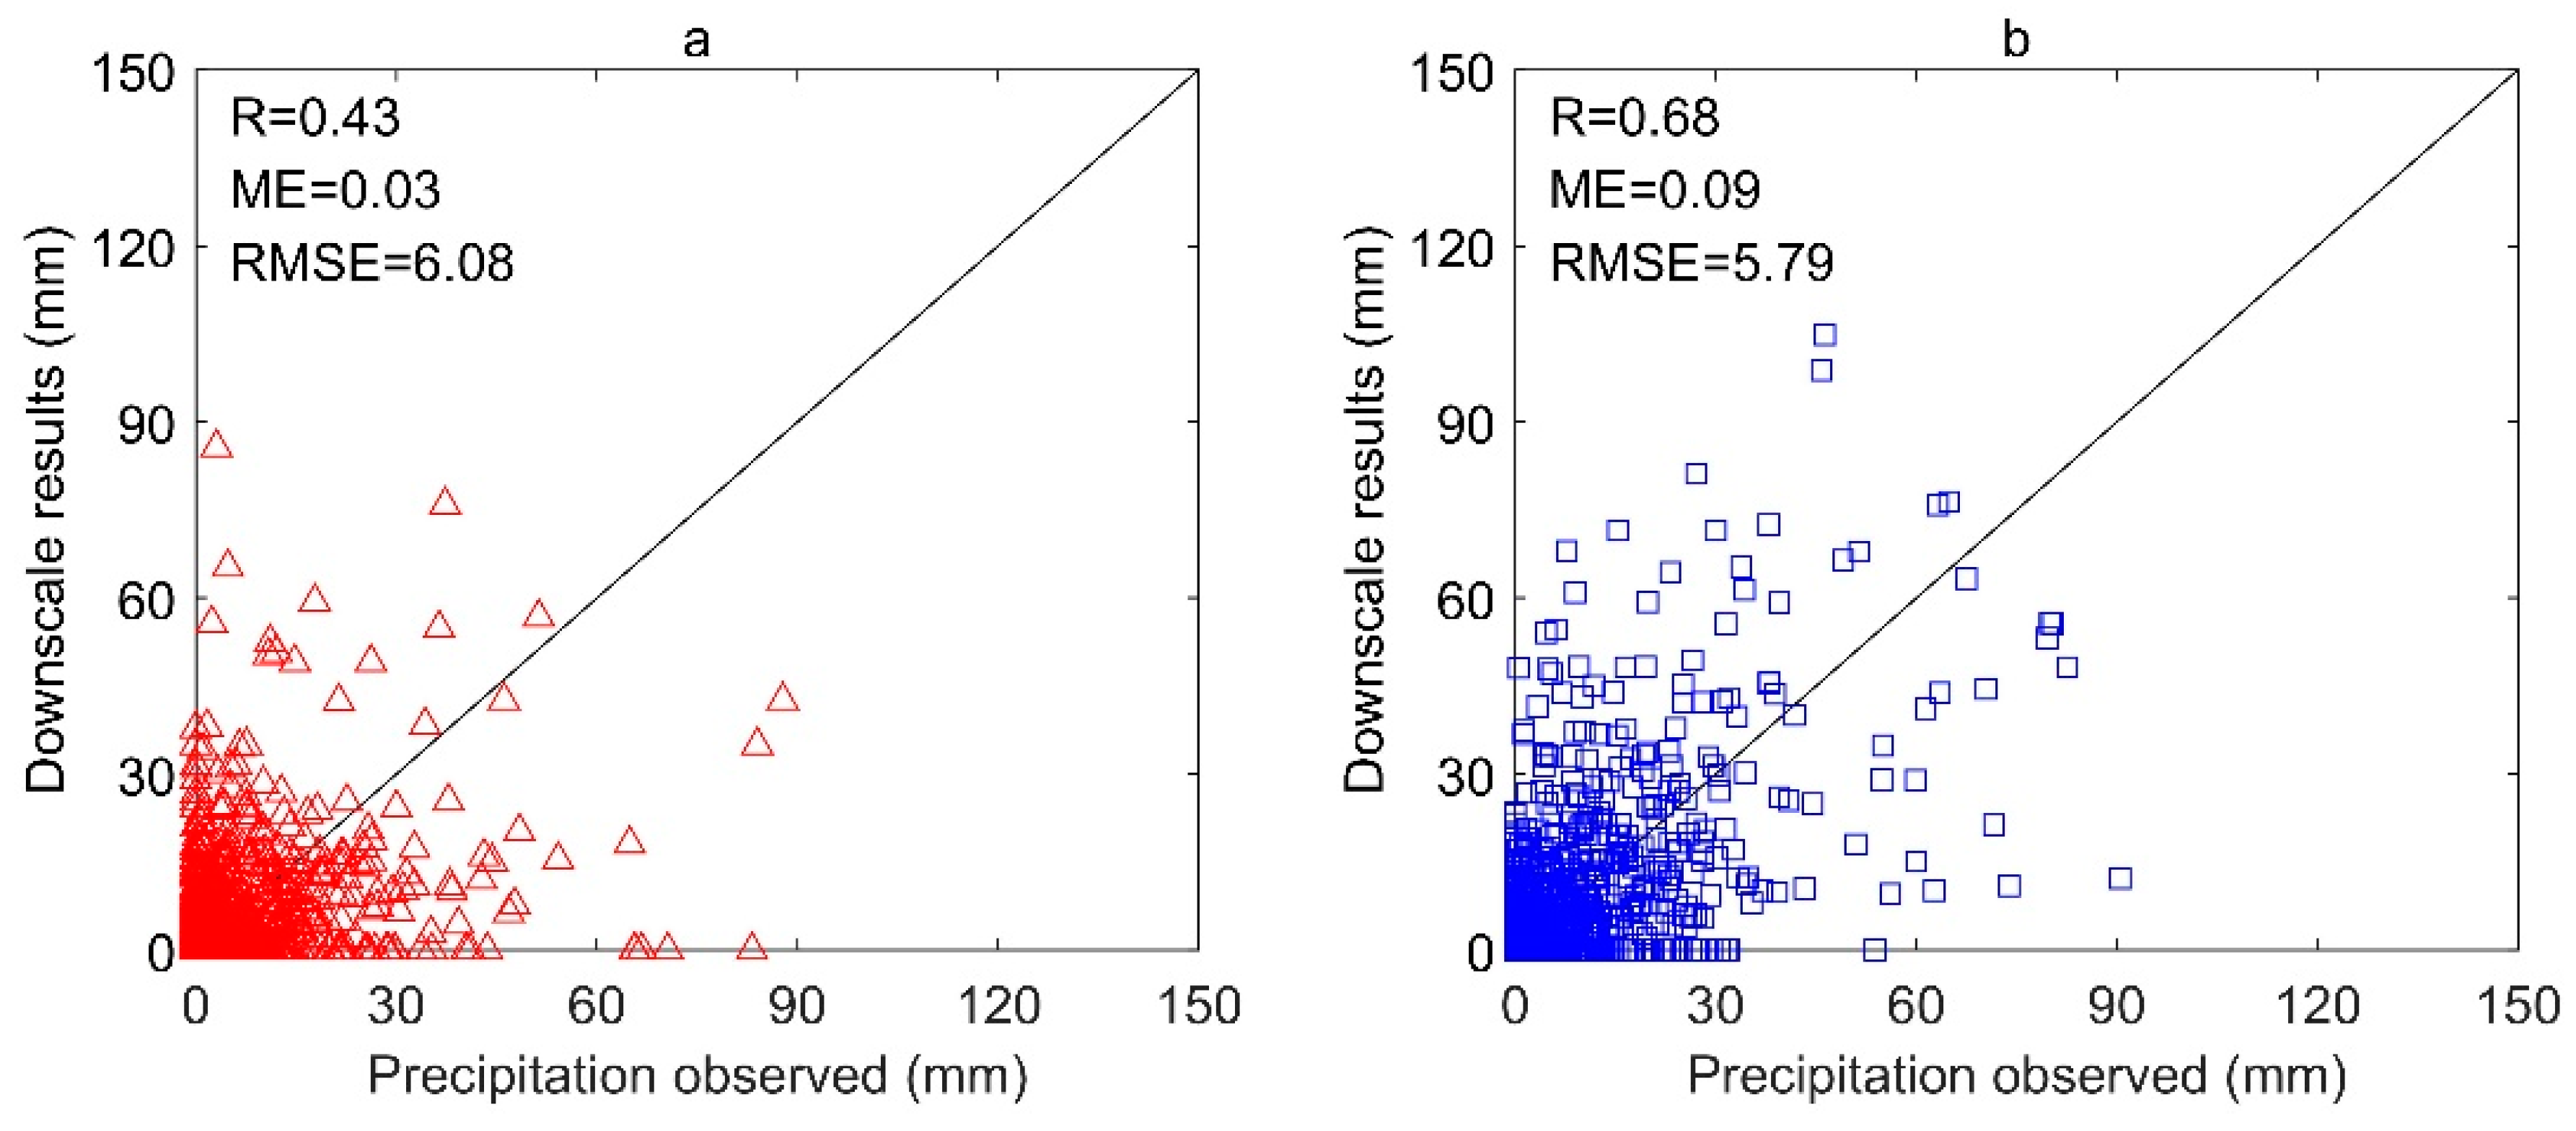
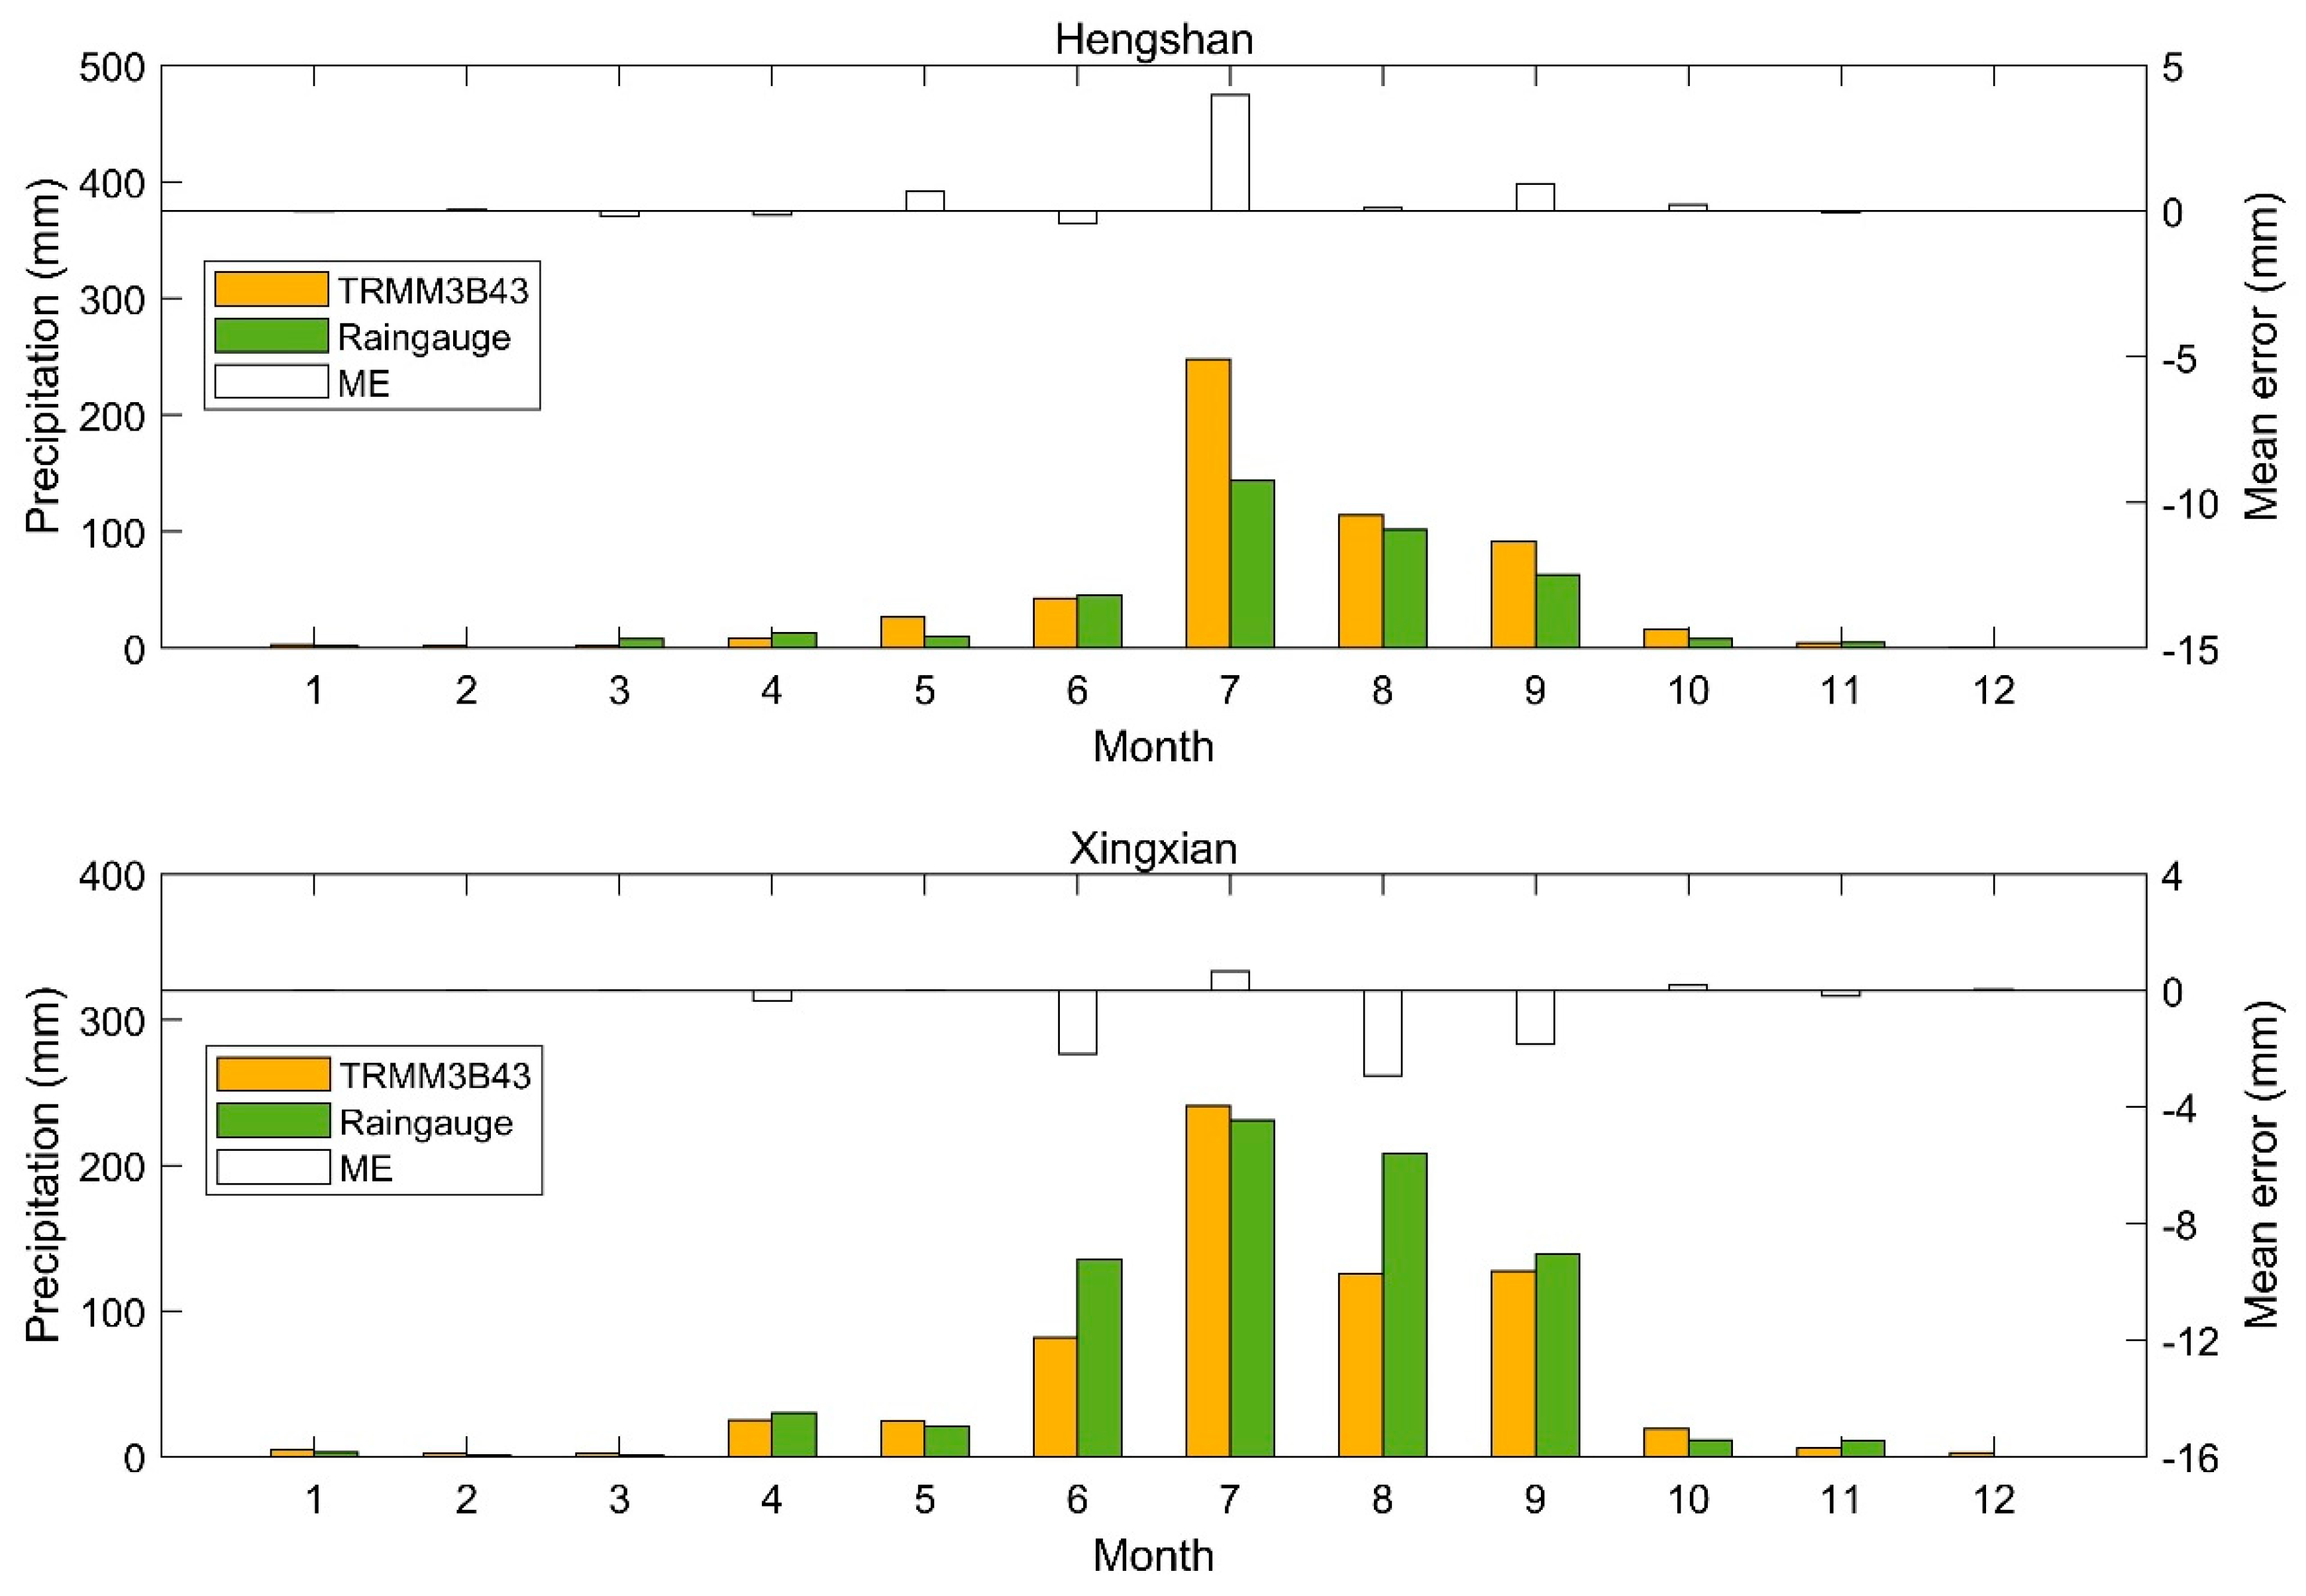
3.2. Comparison between Downscaling Results and Ground Observations

The proposed downscaling method was used to decompose the TRMM monthly precipitation products to a daily scale for 2013. Although the spatial distribution of the daily precipitation obtained using the downscaling method is in good agreement with the ground observations (Figure 6), the specific accuracy of the downscaled results at each rain gauge still needs further verification. Therefore, the daily precipitation from downscaling was extracted by the location of the rain gauges, and the R, ME, and RMSE were thus calculated. Figure 7 shows the scatterplots of the daily precipitation derived from ground observations and downscaling. As shown in Figure 7, the accuracy of the downscaling results varies among the different stations, with the R ranging from 0.37 to 0.78, the ME between 1.11 mm and 2.13 mm, and the RMSE between 3.60 mm and 7.33 mm. In addition, we calculated the frequency distribution of the errors, where the error was less than 5.86 mm (1 standard deviation), accounting for 91.7%. Overall, the daily downscaled precipitation is in reasonable agreement with the data measured with an R of 0.59, an ME of 1.70 mm, and an RMSE of 5.93 mm.
Taking the Wugong station as an example, we plotted the time-varying curve of the downscaled and measured precipitation, which had the lowest correlation coefficient among all 23 sits. In Figure 8, the dotted line represents the daily precipitation in 2013 obtained by the temporal downscaling of TRMM 4B43, and the solid line is the measured rainfall from the ground rain gauges. It can be seen in Figure 8 that the downscaled results are close to the ground observations, which could reflect the temporal variation characteristics of precipitation. In most cases, the downscaling results are in a good agreement with the rain gauge observations, though there are time lags for some days. For example, the ground observations showed heavy rainfall on 17 July, while the downscaled results showed heavy rainfall on 18 July. A similar situation also appeared on 10 July and 25 May.
Through analysis, it was found that the time mismatch of ground and satellite observations is one of the most important reasons for the differences between the downscaled results and the measured precipitation at some rain-gauge stations. The overpass local times of the AMSR2 satellite are 1:30 (descending) and 13:30 (ascending), respectively, while the ground measurements were observed at 8:00 each day. If the rainfall occurs from 13:30 to 1:30 (the day after), the soil moisture changes caused by the precipitation cannot be observed until the next overpass of AMSR2. This temporal mismatch reduces the correlation between the downscaled results and ground-based rainfall observations. In order to reduce the impact of time mismatch, the downscaled precipitations were corrected by moving the downscaled data to match the ground-based observations (within one day before and after). The R and RMSE of each station after correction are shown in Figure 9. As shown in Figure 9, the R between the measured precipitation and the time-matched downscaling results was increased, and the RMSE was also reduced to varying degrees.
In order to analyze the influence of confidence level (Equation 1) on the accuracy of the downscaling results, we use different confidence levels to downscale the TRMM data, and the results of this process are shown in Figure 10. In Figure 10, the greater the confidence level, the less sensitive the response of soil water to precipitation. Therefore, if the confidence level is set too high, it is easy to miss the precipitation information and increase the RMSE. On the other hand, if the confidence level is set too low, the determination criterion will be too sensitive to random fluctuations of soil moisture, and it will be easy to judge a day without precipitation as having a light rainfall, leading to a slightly reduction in the correlation coefficient and a slight increase in the root mean square error. Therefore, 0.8 was selected as the threshold for the confidence level in this study area.

4. Discussion

The downscaling method can obtain relatively reliable daily-scale precipitation through monthly-scale precipitation and daily-scale soil moisture changes. At the same time, as a widely used high temporal resolution precipitation product, the TRMM 3B42 provides the grid-based precipitation every 3 h between 50°S and 50°N. In this study, the TRMM 3B42 precipitation rate was converted into total daily precipitation, and then the corresponding pixel value was extracted from the location of the rain gauges. Finally, the R, ME and RMSE of TRMM 3B42 and ground measured precipitation were calculated (Table 2). It can be seen that the accuracy of downscaled precipitation obtained from daily-scale precipitation by our proposed method was slightly lower than that of 3B42 products at some sites and there is still space for improvement. However, as a trial method for temporal downscaling of satellite-based precipitation data, it still has great potential in many aspects. It can be used as a method for providing grid precipitation data with high temporal resolution when TRMM 3B42 data are missing or with bad quality. In addition, combined with other high-spatiotemporal resolution soil moisture products, such as SMAP 9 km soil moisture data, another possible application of this downscaling method is to achieve a spatiotemporal downscaling simultaneously.
Land use and land cover are some of the important factors affecting the accuracy of the downscaled precipitation. On one hand, land use and land cover influence the relationship between precipitation and soil moisture. Land cover types are mostly cultivated land, urban areas, and construction land around the stations of Changwu, Fengxiang, and Wugong (Table 1), where the downscaled results are different for the ground measurements. Conversely, the land cover of Youyu, Hequ, Hengshan, Yan’an, and other stations with relatively high accuracies are mainly grassland. The difference in land cover affects the accuracy of AMSR2 soil moisture products [38,39], which will also affect the accuracy of the downscaling results.
Differences in vegetation coverage also have an impact on the accuracy of the downscaling results. The characteristics of changes in soil moisture will show a difference between bare soil and vegetation cover. The vegetation canopy has an “intercepting effect” on rainwater, which reduces the amount of rainwater falling [49]. In addition, an understory, such as Bryophyta and the litter layer, will increase the amount of water infiltration and reduce evaporation [33,50]. Due the influences of these two aspects, the temporal variation of the soil moisture of the vegetation cover surface is less than that of bare soil, and the soil moisture change is moderate [51].
For each pixel, due to satellite orbital parameters and AMSR2 sensor scanning width, the AMSR2 passes overhead one or two times per day. To investigate the impact of the satellite overpass on the downscaling results, we separately calculated the downscaling results for 23 sites over 365 days with different frequencies of satellite overpass (Figure 11). It can be seen in Figure 11 that if there are two overpasses within a day, the accuracy of the downscaling results is better than that with only one overpass. On the one hand, the more overpass, the more easily the soil moisture reflects precipitation information. Moreover, compared to only one overpass, by synthesizing two scans of soil moisture data, the random errors of the AMSR2 product can be reduced to some extent. In this way, the true soil moisture information of the day with two observations can be expressed more accurately.
The accuracy of the original TRMM 3B43 monthly scale precipitation data is also an important reason for the accuracy of the downscaled results. Due to the high heterogeneity of precipitation and the uncertainty of the retrieval algorithm, the TRMM 3B43 monthly product also has certain errors, which will be transmitted during the downscaling process. Figure 12 shows comparisons between the TRMM 3B43 monthly-scale products with the ground observation precipitation for two stations that have large downscaling errors, Hengshan and Xingxian. At the Hengshan station, the precipitation obtained from TRMM 3B43 products in most months overestimates the precipitation, which also makes the daily precipitation obtained by the downscaled method higher than that for ground observations (Figure 7). Similarly, the monthly scale data of the TRMM at Xingxian Station in 2013 was slightly smaller than the measured value, resulting in an underestimation of the precipitation at a daily scale of precipitation after downscaling.
To further explore the effect of the inherent error of TRMM monthly precipitation data on the accuracy of downscaled results, the downscaling method was directly applied to the ground-measured monthly precipitation data and AMSR2 daily soil moisture products, and the R, ME, and RMSE were also calculated. As can be seen in Table 3, the accuracy of the downscaled results of almost all stations has been improved by using the ground measured monthly precipitation. The maximum increases of R, ME, and RMSE are 0.07, 0.6 mm and 1.62 mm, respectively. This shows that the proposed downscaling method is more sensitive to the accuracy of the input monthly precipitation data than the selection of the confidence level parameter (Figure 10). Similarly, comparing Table 3 and Figure 11, it can be seen that the impact of the accuracy of input monthly scale precipitation on the downscaling method is smaller than that of the frequency of AMSR2 satellite overpasses.
The initial water content of the soil can affect the response of soil moisture to precipitation. In areas with similar soil textures, the total porosity in the soil is approximately the same and has a similar saturated soil water content. The smaller the initial water content, the harder it is for the soil to reach saturation, and the greater its potential to be used to reflect the influence of precipitation on soil moisture and the sensitivity of soil moisture to precipitation. Therefore, for very dry soils and very moist soils, the actual precipitation may vary greatly with the same soil moisture index.
The ups and downs of the terrain increase the spatial heterogeneity of land surface moisture. Figure 13 shows the RMSE of the downscaled results and the mean slop, derived from the SRTM DEM, within 0.25° × 0.25° (corresponding to one of TRMM and AMSR2 pixel) around the meteorological stations. It can be seen in Figure 13 that except for the Yulin, Tianshui, and Huashan stations, the slope and RMSEs near most stations have similar distribution characteristics: the greater the slope around the station, the lower the accuracy of the downscaled results. As the slope increases, the spatial and temporal heterogeneity of the precipitation and soil moisture increases, making the response of soil water to precipitation more complex. At the same time, a larger slope also reduces the retrieval accuracies of precipitation and soil moisture [52,53]. In addition, the soil moisture contents at different locations on the slope of the mountain have different response characteristics for rainfall. For example, when rainfall occurs, the soil moisture growth in the upper part of the slope is higher than that in the middle and lower sections of the slope. After rainfall, soil moisture in the upper part of the mountain also decreases faster than that in the lower part [54].
Finally, the basic assumption of the proposed method in this paper is that there is a positive correlation between soil moisture and rainfall in a time series. If the AMSR2 soil moisture product has an abnormally high value, the curve of Δ S M will also have a strong fluctuation. Thus, the day may be misjudged as having precipitation. Analogously, there may be some precipitation that is missed when the precipitation is too small to cause soil moisture to rise significantly. In addition, given the limited data available for precipitation observations, the “point scale” measured precipitation was used to evaluate the downscaled results at a “pixel scale”. Therefore, the “scale effect”, neglected in the evaluation process, was also a source of error.

5. Conclusions

Based on an analysis of daily precipitation and soil moisture data, a method for the temporal downscaling of satellite-based precipitation using the soil moisture index was proposed. AMSR2 daily soil moisture products were used to calculate the soil moisture index. The “raining day” and “the day with no rainfall” were determined based on the discriminant criteria. As a result, the TRMM monthly precipitation was decomposed according to the changes in soil moisture, and spatial precipitation data at the daily scale were obtained. The temporal downscaled results were evaluated by observing the precipitation data from ground rain gauges. The result shows that the daily rainfall derived from downscaling method can reflect the occurrence of rainfall effectively, with an R of 0.59, an ME of 1.70 mm, and an RMSE of 5.93 mm.
Obtaining high-resolution precipitation data is of great significance in hydrology and water resource analysis, drought and flood disaster prediction, and ecological environment management. In this paper, the temporal downscaling of TRMM 3B43 monthly precipitation was achieved by using the surface soil moisture variation characteristics derived from AMSR2 with a high temporal resolution. However, this temporal downscaling method is based on the relationship between precipitation and soil moisture to redistribute total precipitation during the month. Therefore, the accuracy of the original precipitation and soil moisture data will greatly affect the accuracy of the downscaling results. At the same time, this method only uses soil moisture as the auxiliary data to downscale and does not consider other factors, such as soil texture, vegetation fraction, terrain characteristics, and so on, which may affect the accuracy of the downscaling results. In addition, this paper uses the global optimal soil moisture confidence level to determine the presence or absence of precipitation. However, the relationship between soil moisture and precipitation characteristics will change according to different land cover types, soil texture characteristics, and topographical features. Therefore, in future research, improvements can be made from these three perspectives: first, try to use higher quality precipitation products to improve the accuracy of the monthly precipitation input; second, obtain high-spatiotemporal resolution soil moisture to achieve spatiotemporal downscaling; and third, introduce other auxiliary factors, such as soil texture and temperature differences between day and night, to improve the robustness of the downscaling method.

Author Contributions

Conceptualization, D.F.; Formal analysis, G.D.; Funding acquisition, H.W.; Methodology, H.X.; Project administration, H.W.; Resources, H.X.; Software, G.D.; Supervision, X.J.; Validation, H.X.; Writing—original draft, D.F.; Writing—review and editing, H.W.

Funding

This research was funded partially by the Strategic Priority Research Program of Chinese Academy of Sciences, grant Nos. XDA19040403 and XDA20030302, partially by the National Natural Science Foundation of China, grant Nos. 41871267 and 41971319, partially by the Key Scientific and Technological Project of Henan Province, grant Nos. 172102110268, and partially by the Fundamental Research Funds for the Universities of Henan Province, grant Nos. NSFRF170907.

Acknowledgments

Thanks to the measured precipitation data provided by National Meteorological Information Center of China, thanks to NASA/JAXA for providing TRMM satellite rainfall data, MODIS surface coverage data, AMSR2 soil moisture data and SRTM DEM data.

Conflicts of Interest

The authors declare no conflict of interest.

References

  1. Jia, S.; Zhu, W.; Lű, A.; Yan, T. A statistical spatial downscaling algorithm of TRMM precipitation based on NDVI and DEM in the Qaidam Basin of China. Remote Sens. Environ. 2011, 115, 3069–3079. [Google Scholar] [CrossRef]
  2. Immerzeel, W.W.; Rutten, M.M.; Droogers, P. Spatial downscaling of TRMM precipitation using vegetative response on the Iberian Peninsula. Remote Sens. Environ. 2009, 113, 362–370. [Google Scholar] [CrossRef]
  3. Sun, R.; Yuan, H.; Liu, X.; Jiang, X. Evaluation of the latest satellite-gauge precipitation products and their hydrologic applications over the Huaihe River basin. J. Hydrol. 2016, 536, 302–319. [Google Scholar] [CrossRef]
  4. Mahmud, M.R.; Numata, S.; Matsuyama, H.; Hosaka, T.; Hashim, M. Assessment of Effective Seasonal Downscaling of TRMM Precipitation Data in Peninsular Malaysia. Remote Sens. 2015, 7, 4092–4111. [Google Scholar] [CrossRef] [Green Version]
  5. Shi, Y.; Song, L.; Xia, Z.; Lin, Y.; Myneni, R.B.; Choi, S.; Wang, L.; Ni, X.; Lao, C.; Yang, F. Mapping Annual Precipitation across Mainland China in the Period 2001–2010 from TRMM3B43 Product Using Spatial Downscaling Approach. Remote Sens. 2015, 7, 5849–5878. [Google Scholar] [CrossRef] [Green Version]
  6. Chen, Y.; Huang, J.; Sheng, S.; Mansaray, L.R.; Liu, Z.; Wu, H.; Wang, X. A new downscaling-integration framework for high-resolution monthly precipitation estimates: Combining rain gauge observations, satellite-derived precipitation data and geographical ancillary data. Remote Sens. Environ. 2018, 214, 154–172. [Google Scholar] [CrossRef]
  7. Zhang, J.; Fan, H.; He, D.; Chen, J. Integrating precipitation zoning with random forest regression for the spatial downscaling of satellite-based precipitation: A case study of the Lancang-Mekong River basin. Int. J. Climatol. 2019, 39, 3947–3961. [Google Scholar] [CrossRef]
  8. Zhang, T.; Li, B.; Yuan, Y.; Gao, X.; Sun, Q.; Xu, L.; Jiang, Y. Spatial downscaling of TRMM precipitation data considering the impacts of macro-geographical factors and local elevation in the Three-River Check for updates Headwaters Region. Remote Sens. Environ. 2018, 215, 109–127. [Google Scholar] [CrossRef]
  9. Wang, L.; Chen, R.; Han, C.; Yang, Y.; Liu, J.; Liu, Z.; Wang, X.; Liu, G.; Guo, S. An Improved Spatial-Temporal Downscaling Method for TRMM Precipitation Datasets in Alpine Regions: A Case Study in Northwestern China’s Qilian Mountains. Remote Sens. 2019, 11, 870. [Google Scholar] [CrossRef] [Green Version]
  10. Lloyd, C.D. Assessing the effect of integrating elevation data into the estimation of monthly precipitation in Great Britain. J. Hydrol. 2005, 308, 128–150. [Google Scholar] [CrossRef]
  11. Duan, Z.; Bastiaanssen, W.G.M. First results from Version 7 TRMM 3B43 precipitation product in combination with a new downscaling-calibration procedure. Remote Sens. Environ. 2013, 131, 1–13. [Google Scholar] [CrossRef]
  12. Park, N.; Kyriakidis, P.; Hong, S. Geostatistical Integration of Coarse Resolution Satellite Precipitation Products and Rain Gauge Data to Map Precipitation at Fine Spatial Resolutions. Remote Sens. 2017, 9, 255. [Google Scholar] [CrossRef] [Green Version]
  13. Fang, J.; Du, J.; Xu, W.; Shi, P.; Li, M.; Ming, X. Spatial downscaling of TRMM precipitation data based on the orographical effect and meteorological conditions in a mountainous area. Adv. Water Resour. 2013, 61, 42–50. [Google Scholar] [CrossRef]
  14. He, K.; Ma, Z.; Zhao, R.; Biswas, A.; Teng, H.; Xu, J.; Yu, W.; Shi, Z. A Methodological Framework to Retrospectively Obtain Downscaled Precipitation Estimates over the Tibetan Plateau. Remote Sens. 2018, 10, 1974. [Google Scholar] [CrossRef] [Green Version]
  15. Xu, G.; Xu, X.; Liu, M.; Sun, A.; Wang, K. Spatial downscaling of TRMM precipitation product using a combined multifractal and regression approach: Demonstration for south China. Water 2015, 7, 3083–3102. [Google Scholar] [CrossRef] [Green Version]
  16. Zhang, X.; Yan, X. A new statistical precipitation downscaling method with Bayesian model averaging: A case study in China. Clim. Dyn. 2015, 45, 2541–2555. [Google Scholar] [CrossRef]
  17. Park, N. Spatial Downscaling of TRMM Precipitation Using Geostatistics and Fine Scale Environmental Variables. Adv. Meteorol. 2013, 2013, 187–190. [Google Scholar] [CrossRef]
  18. Ceccherini, G.; Ameztoy, I.; Hernández, C.; Moreno, C. High-Resolution Precipitation Datasets in South America and West Africa based on Satellite-Derived Rainfall, Enhanced Vegetation Index and Digital Elevation Model. Remote Sens. 2015, 7, 6454–6488. [Google Scholar] [CrossRef] [Green Version]
  19. Tang, Y.; Atkinson, P.M.; Zhang, J. Downscaling remotely sensed imagery using area-to-point cokriging and multiple-point geostatistical simulation. ISPRS J. Photogramm. Remote Sens. 2015, 101, 174–185. [Google Scholar] [CrossRef]
  20. Teng, H.; Shi, Z.; Ma, Z.; Li, Y. Estimating spatially downscaled rainfall by regression kriging using TRMM precipitation and elevation in Zhejiang Province, southeast China. Int. J. Remote Sens. 2014, 35, 7775–7794. [Google Scholar] [CrossRef]
  21. Zhang, Y.; Li, Y.; Ji, X.; Luo, X.; Li, X. Fine-Resolution Precipitation Mapping in a Mountainous Watershed: Geostatistical Downscaling of TRMM Products Based on Environmental Variables. Remote Sens. 2018, 10, 119. [Google Scholar] [CrossRef] [Green Version]
  22. Xu, S.; Wu, C.; Wang, L.; Gonsamo, A.; Shen, Y.; Niu, Z. A new satellite-based monthly precipitation downscaling algorithm with non-stationary relationship between precipitation and land surface characteristics. Remote Sens. Environ. 2015, 162, 119–140. [Google Scholar] [CrossRef]
  23. Chen, F.; Liu, Y.; Liu, Q.; Li, X. Spatial downscaling of TRMM 3B43 precipitation considering spatial heterogeneity. Int. J. Remote Sens. 2014, 35, 3074–3093. [Google Scholar] [CrossRef]
  24. Zhao, N.; Yue, T.; Zhou, X.; Zhao, M.; Liu, Y.; Du, Z.; Zhang, L. Statistical downscaling of precipitation using local regression and high accuracy surface modeling method. Theor. Appl. Climatol. 2016, 129, 281–292. [Google Scholar] [CrossRef]
  25. Lv, A.; Zhou, L. A rainfall model based on a geographically weighted regression algorithm for rainfall estimations over the arid Qaidam basin in China. Remote Sens. 2016, 8, 310–323. [Google Scholar] [CrossRef] [Green Version]
  26. Chen, C.; Zhao, S.; Duan, Z.; Qin, Z. An Improved Spatial Downscaling Procedure for TRMM 3B43 Precipitation Product Using Geographically Weighted Regression. IEEE J.-Stars. 2015, 8, 4592–4604. [Google Scholar] [CrossRef]
  27. Jing, W.; Yang, Y.; Yue, X.; Zhao, X. A Spatial Downscaling Algorithm for Satellite-Based Precipitation over the Tibetan Plateau Based on NDVI, DEM, and Land Surface Temperature. Remote Sens. 2016, 8, 655. [Google Scholar] [CrossRef] [Green Version]
  28. Ma, Z.; He, K.; Tan, X.; Xu, J.; Fang, W.; He, Y.; Hong, Y. Comparisons of Spatially Downscaling TMPA and IMERG over the Tibetan Plateau. Remote Sens. 2018, 10, 1883. [Google Scholar] [CrossRef] [Green Version]
  29. Jing, W.; Yang, Y.; Yue, X.; Zhao, X. A Comparison of Different Regression Algorithms for Downscaling Monthly Satellite-Based Precipitation over North China. Remote Sens. 2016, 8, 835. [Google Scholar] [CrossRef] [Green Version]
  30. Alexakis, D.D.; Tsanis, I.K. Comparison of multiple linear regression and artificial neural network models for downscaling TRMM precipitation products using MODIS data. Environ. Earth Sci. 2016, 75, 1077. [Google Scholar] [CrossRef]
  31. Chaudhuri, C.; Srivastava, R. A novel approach for statistical downscaling of future precipitation over the Indo-Gangetic Basin. J. Hydrol. 2017, 547, 21–38. [Google Scholar] [CrossRef]
  32. Zheng, X.; Zhu, J.J. A methodological approach for spatial downscaling of TRMM precipitation data in North China. Int. J. Remote Sens. 2015, 36, 144–169. [Google Scholar] [CrossRef]
  33. Sharifi, E.; Saghafian, B.; Steinacker, R. Downscaling Satellite Precipitation Estimates with Multiple Linear Regression, Artificial Neural Networks, and Spline Interpolation Techniques. J. Geophys. Res. Atmos. 2019, 124, 789–805. [Google Scholar] [CrossRef] [Green Version]
  34. Ulloa, J.; Ballari, D.; Campozano, L.; Samaniego, E. Two-Step Downscaling of Trmm 3b43 V7 Precipitation in Contrasting Climatic Regions with Sparse Monitoring: The Case of Ecuador in Tropical South America. Remote Sens. 2017, 9, 758. [Google Scholar] [CrossRef] [Green Version]
  35. Fang, B.; Lakshmi, V.; Bindlish, R.; Jackson, T.J. AMSR2 Soil Moisture Downscaling Using Temperature and Vegetation Data. Remote Sens. 2018, 10, 1575. [Google Scholar] [CrossRef] [Green Version]
  36. Luo, Y.; Yang, S.; Liu, X.; Liu, C.; Song, W.; Dong, G.; Zhao, H.; Lou, H. Land use change in the reach from Hekouzhen to Tongguan of the Yellow River during 1998–2010. Acta Geogr. Sin. 2014, 69, 42–53. [Google Scholar]
  37. Huffman, G.J.; Bolvin, D.T.; Nelkin, E.J.; Wolff, D.B.; Adler, R.F.; Gu, G.; Hong, Y.; Bowman, K.P.; Stocker, E.F. The TRMM multi-satellite precipitation analysis: Quasi-global, multi-year, combined-sensor precipitation estimates at fine scale. J. Hydrometeorol. 2007, 8, 38–55. [Google Scholar] [CrossRef]
  38. Cho, E.; Su, C.H.; Ryu, D.; Kim, H.; Choi, M. Does AMSR2 produce better soil moisture retrievals than AMSR-E over Australia? Remote Sens. Environ. 2017, 188, 95–105. [Google Scholar] [CrossRef]
  39. Wu, Q.; Liu, H.; Wang, L.; Deng, C. Evaluation of AMSR2 soil moisture products over the contiguous United States using in situ data from the International Soil Moisture Network. Int. J. Appl. Earth Obs. Geoinf. 2016, 45, 187–199. [Google Scholar] [CrossRef]
  40. Walters, R.D.; Watson, K.A.; Marshall, H.; McNamara, J.P.; Flores, A.N. A physiographic approach to downscaling fractional snow cover data in mountainous regions. Remote Sens. Environ. 2014, 152, 413–425. [Google Scholar] [CrossRef]
  41. Wei, Z.; Meng, Y.; Zhang, W.; Peng, J.; Meng, L. Downscaling SMAP soil moisture estimation with gradient boosting decision tree regression over the Tibetan Plateau. Remote Sens. Environ. 2019, 225, 30–44. [Google Scholar] [CrossRef]
  42. Jin, Y.; Ge, Y.; Wang, J.; Chen, Y.; Heuvelink, G.B.M.; Atkinson, P.M. Downscaling AMSR-2 Soil Moisture Data with Geographically Weighted Area-to-Area Regression Kriging. IEEE Trans. Geosci. Remote Sens. 2018, 56, 2362–2376. [Google Scholar] [CrossRef] [Green Version]
  43. Peng, J.; Loew, A.; Merlin, O.; Verhoest, N.E.C. A review of spatial downscaling of satellite remotely sensed soil moisture. Rev. Geophys. 2017, 55, 341–366. [Google Scholar] [CrossRef]
  44. Sun, H.; Cai, C.; Liu, H.; Yang, B. Microwave and Meteorological Fusion: A method of Spatial Downscaling of Remotely Sensed Soil Moisture. IEEE J.-Stars. 2019, 12, 1107–1119. [Google Scholar] [CrossRef]
  45. Li, W.; Ni, L.; Li, Z.; Duan, S.; Wu, H. Evaluation of Machine Learning Algorithms in Spatial Downscaling of MODIS Land Surface Temperature. IEEE J.-Stars. 2019, 12, 1107–1119. [Google Scholar] [CrossRef]
  46. Gao, L.; Zhan, W.; Huang, F.; Zhu, X.; Zhou, J.; Quan, J.; Du, P.; Li, M. Disaggregation of remotely sensed land surface temperature: A simple yet flexible index (SIFI) to assess method performances. Remote Sens. Environ. 2017, 200, 206–219. [Google Scholar] [CrossRef]
  47. Hutengs, C.; Vohland, M. Downscaling land surface temperatures at regional scales with random forest regression. Remote Sens. Environ. 2016, 178, 127–141. [Google Scholar] [CrossRef]
  48. Duan, S.B.; Li, Z.L. Spatial downscaling of MODIS land surface temperatures using geographically weighted regression: Case study in northern China. IEEE Trans. Geosci. Remote Sens. 2016, 54, 6458–6469. [Google Scholar] [CrossRef]
  49. Chen, F.; Gao, Y.; Wang, Y.; Qin, F.; Li, X. Downscaling satellite-derived daily precipitation products with an integrated framework. Int. J. Climatol. 2019, 39, 1287–1304. [Google Scholar] [CrossRef]
  50. Shi, Z.H.; Yue, B.J.; Wang, L.; Fang, N.F.; Wang, D.; Wu, F.Z. Effects of Mulch Cover Rate on Interrill Erosion Processes and the Size Selectivity of Eroded Sediment on Steep Slopes. Soil Sci. Soc. Am. J. 2013, 77, 257–267. [Google Scholar] [CrossRef] [Green Version]
  51. Feng, H.H.; Liu, Y.B. Combined effects of precipitation and air temperature on soil moisture in different land covers in a humid basin. J. Hydrol. 2015, 531, 1129–1140. [Google Scholar] [CrossRef]
  52. Chen, C.; Chen, Q.; Zheng, D.; Zhang, J.; Mo, K.; Li, Z.; Tang, G. Multiscale Comparative Evaluation of the GPM IMERG v5 and TRMM 3B42 v7 Precipitation Products from 2015 to 2017 over a Climate Transition Area of China. Remote Sens. 2018, 10, 944. [Google Scholar] [CrossRef] [Green Version]
  53. Sawada, Y.; Tsutsui, H.; Koike, T.; Rasmy, M.; Fujii, H. A Field Verification of an Algorithm for Retrieving Vegetation Water Content from Passive Microwave Observations. IEEE Trans. Geosci. Remote Sens. 2016, 54, 2082–2095. [Google Scholar] [CrossRef]
  54. Wang, Z.W.; Wu, X.D.; Yue, G.Y.; Zhao, L.; Wang, Q.; Nan, Z.T.; Qin, Y.; Wu, T.H.; Shi, J.Z.; Zou, D.F. Spatial and Temporal Variations in Spectrum-Derived Vegetation Growth Trend in Qinghai-Tibetan Plateau from 1982 to 2014. Spectrosc. Spect. Anal. 2016, 36, 471–477. [Google Scholar]
Figure 1. Geographical locations and distribution of the rain gauges in the Hekouzhen to Tongguan of the Yellow River.
Remotesensing 11 02962 g001
Figure 2. Relationship between precipitation and soil moisture in August 2013.
Remotesensing 11 02962 g002
Figure 3. Relationship between precipitation and the soil moisture increment in August 2013.
Remotesensing 11 02962 g003
Figure 4. Relationship between the precipitation and soil moisture index in August 2013.
Remotesensing 11 02962 g004
Figure 5. Flowchart of the monthly Tropical Rainfall Measuring Mission (TRMM) temporal downscaling method using the daily Advanced Microwave Scanning Radiometer 2 (AMSR2) soil moisture data.
Remotesensing 11 02962 g005
Figure 6. Spatial estimation of daily precipitation in the Hekouzhen to Tongguan of the Yellow River: the precipitation obtained by the rain gauges data interpolation on 30 October 2013 (a) and 23 November 2013 (c); the precipitation derived from downscaling method on 30 October 2013 (b) and 23 November 2013 (d).
Remotesensing 11 02962 g006
Figure 7. Scatter plots of the observed and downscaled precipitation at 23 stations in 2013; the last one is the result of the overall verification (the “error” indicates the downscaling results minus the measured ground precipitation).
Remotesensing 11 02962 g007
Figure 8. Time series of the downscaled and observed daily precipitation at the Wugong station in 2013.
Remotesensing 11 02962 g008
Figure 9. Validation results of the corrected downscaling precipitation at 23 rain gauges.
Remotesensing 11 02962 g009
Figure 10. Validation results of the downscaling precipitation at different confidence levels.
Remotesensing 11 02962 g010
Figure 11. Validation results of the AMSR2 satellite overpass once a day (a) and twice a day (b) at 23 rainfall measurement stations in 2013.
Remotesensing 11 02962 g011
Figure 12. Comparison of the TRMM 3B43 monthly precipitation product with ground measurements in Hengshan and Xingxian stations; ME is the mean error of the downscaling results for each month.
Remotesensing 11 02962 g012
Figure 13. Comparison of the Slope and the RMSE of the downscaled precipitation results at 23 meteorological stations.
Remotesensing 11 02962 g013
Table 1. Information on rain gauges in the Hekouzhen to Tongguan of the yellow river.
IDNameLongitude (°)Latitude (°)Altitude (m)Land Use and Land Cover (IGBP)
53478Youyu112.44539.9971348grasslands
53543Dongsheng109.98539.8271462grasslands
53564Hequ111.14739.383862grasslands
53646Yulin109.77938.2721156grasslands
53663Wuzai111.81838.9211401croplands
53664Xingxian111.13238.4631012grasslands
53738Wuqi108.16936.9241332grasslands
53740Hengshan109.23737.9201110grasslands
53754Suide110.21537.501929grasslands
53764Lishi111.09837.507951grasslands
53821Huanxian107.29536.5801256grasslands
53845Yan’an109.50036.600959grasslands
53853Xixian110.95136.6941053grasslands
53903Xiji105.71835.9641917grasslands
53915Pingliang106.66735.5481365croplands
53923Xifengzhen107.63135.7341420urban and built-up lands
53929Changwu107.79335.1991196croplands
53942Luochuan109.50635.8111159croplands
57014Tianshui105.86834.5671085urban and built-up lands
57025Fengxiang107.38434.514782urban and built-up lands
57034Wugong108.21434.258448urban and built-up lands
57037Yaoxian108.97734.932710croplands
57046Huashan110.08334.4681830grasslands
Table 2. Verification results of the TRMM 3B42 and downscaled daily precipitation based on ground measured data.
IDNameTRMM 3B42Downscaled Precipitation
RME (mm)RMSE (mm)RME (mm)RMSE (mm)
53478Youyu0.810.133.240.780.163.60
53543Dongsheng0.82−0.053.310.60−0.034.43
53564Hequ0.630.554.240.700.514.36
53646Yulin0.640.175.070.630.184.97
53663Wuzhai0.77−0.273.800.50−0.445.63
53664Xingxian0.76−0.385.230.53−0.567.19
53738Wuqi0.740.174.720.630.216.83
53740Hengshan0.640.333.960.670.434.83
53754Shuide0.60−0.066.850.650.046.79
53764Lishi0.600.266.360.670.486.68
53821Huanxian0.62−0.285.080.55−0.065.83
53845Yanan0.85−0.445.500.75−0.576.88
53853Xixian0.750.265.720.650.146.65
53903Xiji0.24−0.047.320.49−0.105.82
53915Pingliang0.59−0.116.450.65−0.025.87
53923Xifengzhen0.480.006.980.630.096.20
53929Changwu0.780.185.340.500.636.12
53942Luochuan0.560.177.340.490.367.33
57014Tianshui0.81−0.356.010.540.096.73
57025Fengxiang0.740.153.720.420.055.41
57034Wugong0.550.045.540.37−0.076.39
57037Yaoxian0.54−0.014.970.49−0.025.30
57046Huashan0.50−0.124.880.61−0.094.52
Table 3. Comparisons of downscaling results with different input monthly precipitation.
IDNameTRMM 3B43 DownscalingRain Gauge Data Downscaling
RME (mm)RMSE (mm)RME (mm)RMSE (mm)
53478Youyu0.780.163.600.81−0.043.25
53543Dongsheng0.60−0.034.430.62−0.034.34
53564Hequ0.700.514.360.70−0.092.92
53646Yulin0.630.184.970.63−0.084.67
53663Wuzhai0.50−0.445.630.53−0.315.61
53664Xingxian0.53−0.567.190.58−0.326.9
53738Wuqi0.630.216.830.62−0.046.43
53740Hengshan0.670.434.830.71−0.043.21
53754Shuide0.650.046.790.660.066.88
53764Lishi0.670.486.680.680.135.91
53821Huanxian0.55−0.065.830.550.066.11
53845Yanan0.75−0.576.880.76−0.247.1
53853Xixian0.650.146.650.65−0.216.3
53903Xiji0.49−0.105.820.56−0.15.41
53915Pingliang0.65−0.025.870.68−0.085.68
53923Xifengzhen0.630.096.200.69−0.025.68
53929Changwu0.500.636.120.490.315.86
53942Luochuan0.490.367.330.490.146.58
57014Tianshui0.540.096.730.540.297.16
57025Fengxiang0.420.055.410.41−0.205.00
57034Wugong0.37−0.076.390.34−0.167.08
57037Yaoxian0.49−0.025.300.52−0.095.05
57046Huashan0.61−0.094.520.63−0.084.39

