Article

Atomic Clock Performance Assessment of BeiDou-3 Basic System with the Noise Analysis of Orbit Determination and Time Synchronization

1
State Key Laboratory of Geo-Information Engineering, Xi’an 710054, China
2
Xi’an Research Institute of Surveying and Mapping, Xi’an 710054, China
3
Information Engineering University, Zhengzhou 450001, China
*
Author to whom correspondence should be addressed.
Remote Sens. 2019, 11(24), 2895; https://doi.org/10.3390/rs11242895
Submission received: 29 October 2019 / Revised: 28 November 2019 / Accepted: 2 December 2019 / Published: 4 December 2019

Abstract

:
The basic system of the BeiDou global navigation satellite system (BDS-3) with 18 satellites has been deployed since December 2018. As the primary frequency standard, BDS-3 satellites include two clock types with the passive hydrogen maser (PHM) and the rubidium atomic frequency standard (RAFS). Based on the final precise orbit and clock product from Xi’an Research Institute of Surveying and Mapping (XRS), the atomic clock performance of BDS-3 satellites is evaluated, including the frequency accuracy, frequency drift rate, and frequency stability, and compared with GPS block IIF satellites with RAFS, Galileo satellites with PHM, and BDS-2 satellites. A data auto-editing procedure to preprocess clock data and assess the clock performance is developed, where the assessed results are derived at each continuous data arc and the outliers are excluded properly. The stability of XRS product noise is given by using some stations equipped with high-precision active hydrogen masers (AHM). The best stability is 8.93 × 10⁻¹⁵ and 1.85 × 10⁻¹⁵ for the averaging time of 10,000 s and 1 day, which is basically comparable to one-third of the in-orbit PHM frequency stability. The assessed results show the average frequency accuracy and drift rate of BDS-3 with RAFS are slightly worse while the stability is better than BDS-2 medium earth orbit (MEO) satellites. The 10,000 s stability is better but the 1-day stability is worse than GPS, which may be related to the performance of the BDS-3 RAFS clock. As for BDS-3 with PHM, the frequency accuracy is slightly worse than Galileo PHM satellites; the drift rate, when excluding C34 and C35, is basically comparable to Galileo and significantly better than GPS satellites; the stability is comparable to Galileo, where the 10,000 s stability is slightly worse than Galileo and better than GPS. The 1-day stability among BDS-3 PHM, GPS IIF RAFS, and Galileo PHM satellites is basically comparable.

Graphical Abstract

1. Introduction

The BeiDou navigation satellite system (BDS) provides positioning, navigation, and timing (PNT) service with high continuity, reliability, and stability for global users. The high-precision and stable in-orbit atomic clock plays a key role in global satellite navigation system (GNSS) positioning and navigation. With increasing Beidou-3 satellites equipped with the passive hydrogen maser (PHM) and rubidium atomic frequency standard (RAFS) orbiting in space, the clock performance needs to be explored. Particularly, the clock stability has a significant influence on PNT service. By the end of December 2018, there were 18 medium earth orbit (MEO) satellites and 1 geostationary earth orbit (GEO) satellite in orbit, which form the BDS-3 basic system and mainly serve counties in the China-proposed Belt and Road Initiative. The public signals include B1C, B2a, B2b, and the old BDS-2 signals, B1I and B3I [1]. Table 1 lists the satellite information [2], where the GEO satellite C59 with RAFS is still under testing status.
BDS-2 has been studied by many scholars, including the precise orbit determination (POD) [3,4], modeling of solar radiation pressure [5], attitude mode [6], positioning performance [7,8], and signal characteristics [9]. In the initial period of BDS-2 providing service, Gong et al. [10] used four estimation strategies to analyze the short-term stability with the best satellite C09 located in inclined geosynchronous orbit (IGSO) being 4 × 10⁻¹³ and 1 × 10⁻¹³ at 100 s and 1000 s averaging time, respectively. Then, further studies of BDS-2 clock performance were analyzed by many researchers to assess the frequency stability [11,12,13,14,15,16]. The clock data were derived mainly by the orbit determination and time synchronization (ODTS) method. Montenbruck et al. [11] gave the initial result, and the stability of BDS-2 RAFS satellites with 1 and 1000 s averaging time was 0.1~7 × 10⁻¹² and 1~3 × 10⁻¹³, while for GPS IIF satellites it was 4~6 × 10⁻¹² and 1 × 10⁻¹³, respectively. Steigenberger et al. [12] used different POD strategies to assess the performance of BDS-2 clocks, and the stability at the averaging time of 1000 s for GEO and IGSO satellites was 8~12 × 10−14 and 8~17 × 10−14, respectively, which is better than the result of [11]. Then, Wang et al. [13] used the clock product from Wuhan University with 5 min sampling rate to assess the BDS-2 clock performance. The Allan deviation (ADEV) of GEO, IGSO, and MEO clocks was about 3~5 × 10⁻¹³, 3~8 × 10⁻¹³, and 2~4 × 10⁻¹³ at the averaging time of 300 s, which is comparable to the reference [14]. When the averaging time was 10,000 s, the ADEV was 8~11 × 10−14, 6~12 × 10−14, and 4~6× 10⁻¹⁴, correspondingly. Also, the two-way satellite time and frequency transfer (TWSTFT) data was analyzed by Zhou et al. [15]. Huang et al. [16] gave the detailed analysis of the long-term in-orbit situation of BDS-2 clocks with a length of about five years.
Two IGSO and two MEO experimental satellites of BeiDou-3 were launched between 2015 and 2016. Technologies of the signal system [17], intersatellite links [18], and POD [19] were validated and analyzed. The atomic clock performance was also assessed with the clock data derived by the TWSTFT [20] or ODTS method [21,22]. Wu et al. [20] analyzed the frequency stability, prediction accuracy, and clock rate variation, and the optimal stability at the averaging time of 86,400 s is 6.5 × 10⁻¹⁵ for the IGSO satellite C32 with the Ka-band measurement noise of 3 × 10⁻¹⁵. Zhao et al. [21] gave an initial result with the regional distribution of ground stations. The stability of IGSO satellite clocks at 1000 s averaging time is 2~4 × 10⁻¹⁴, which is 10 times better than that of BDS-2 satellites. Lv et al. [22] analyzed the stability, periodicity, and prediction precision of BDS-3e clocks. The 10,000 s stability of C32 with PHM is 2.6 × 10⁻¹⁴, which is comparable to Galileo PHM and GPS IIF RAFS. As for the BeiDou-3 full operational capability (FOC) satellites, Yan et al. [23] gave the early results with 11 BDS-3 MEO satellites during DOY 142–145 of 2018, which showed the 10,000 s stability is 2~5 × 10⁻¹⁴. Xu et al. [24] used 26 d observation data from about 100 Multi-GNSS Experiment (MGEX) and the international GNSS Monitoring and Assessment Service (iGMAS) stations [25] during DOY 030–059 in 2019 to assess the stability of BDS-3 satellite clocks. The POD adopted the one-step method with the arc of three days. The averaged 10,000 s and 86,400 s stability for BDS-3 satellite clocks was 2.43 × 10⁻¹⁴ and 2.51 × 10⁻¹⁵, respectively. However, the ODTS noise was not given quantitatively. Comparable stability of the PHM and RAFS seemed to be derived. Besides, Guo et al. [26] gave the Hadamard derivation (HDEV) results of BDS-3 clock stability directly.
This study analyzes the performance of BDS-3 satellite clocks with the ODTS noise given quantitatively. First, methodology is introduced. The ODTS product from Xi’an Research Institute of Surveying and Mapping (XRS) [27] is introduced and compared to the Wuhan University product (WUM) and the IGS final product. Then, the ODTS noise is calculated by a few ground stations which are attached to the high-precision active hydrogen masers (AHM). Afterwards, the performance of BDS-3 satellite clocks is assessed in terms of frequency accuracy, frequency drift rate, and frequency stability. Finally, the conclusion is given.

2. Methodology

The frequency accuracy of the atomic clock is defined as:
σ = f f 0 f 0
where σ denotes the frequency accuracy, f the actual frequency, and f 0 the nominal frequency. Equation (1) describes the absolute concept of the frequency accuracy, which is not derived directly in actual data processing. Generally, the frequency accuracy is calculated by the time difference method, that is, the phase difference between two consecutive epochs is obtained:
y i = x ( t 1 + υ ) x ( t 1 ) υ
where x is the clock (phase) data, υ the data sampling interval, and y i the frequency data at epoch t i . With the phase data in a long time series, the frequency accuracy can be obtained by calculating the mean value of the differenced data series. It should be noted here that Equation. (2) is also the formula of converting the phase data to frequency data. The frequency drift rate can be written as:
D = i = 1 N ( y i y ¯ ) · ( t i t ¯ ) i = 1 N ( t i t ¯ ) 2
where D denotes the frequency drift rate and N the number of y i . y ¯ and t ¯ denote the mean value of y i and t i , respectively. The evaluation of frequency stability usually uses the ADEV or HDEV method. The Allan deviation is the most common time domain measure of frequency stability [28], but it is sensitive to the linear drift of the frequency data. Hence, we choose the HDEV method to evaluate the frequency stability. The HDEV examines the second difference of the frequency data and is insensitive to the linear frequency drift. The formula reads:
σ y 2 ( τ ) = 1 6 ( M 2 ) i = 1 M 2 ( γ i + 2 2 γ i + 1 + γ i ) 2
where γ i denotes the ith of M fractional frequency values with the averaging time τ [28].
With the above formulas and the ODTS clock products, the frequency accuracy, drift rate, and stability of the atomic clock can be derived by a data processing procedure. For one clock data series, the steps are as follows:
  • The clock differenced data between the clock data of one station or one satellite and reference clock data (AHM station) are derived, named as phase data. The sampling interval is 300 s.
  • The preprocessing of data editing is completed on a daily basis. If the data loss rate on a given day (i.e., the percentage between the lost epochs and the sum of epochs (288)) is more than 20%, this day is flagged as an unavailable day. If the phase data on a given day are available, the linear interpolation method is used to fill the phase data for those lost data on a daily basis.
  • The phase data of one day are converted to the frequency data by the first-order time difference. Then, with the frequency data, the outliers, the phase jumps, and the frequency jumps are detected and removed by using the median absolute deviation (MAD) method:
    θ =   Median ( | y i Median ( y i ) | 0.6745 )
    where y i is the frequency value and the Median ( y i ) denotes the median value of the time series of y i . θ denotes the sigma of the median deviation under the condition of normal distribution. Five times θ is regarded as the threshold to reject the bad data (i.e., if | y i | > Median ( y i ) + 5 · θ , then y i is treated as an outlier) [28].
  • The lost days are counted and flagged, and then the data are fragmented. If the number of days in a continuous segment is less than seven, these data are deleted. There exists the day boundary value between two consecutive days. Thus, the connection point value is deleted and retrieved by using the linear interpolation method. Then, the clean frequency data can be derived.
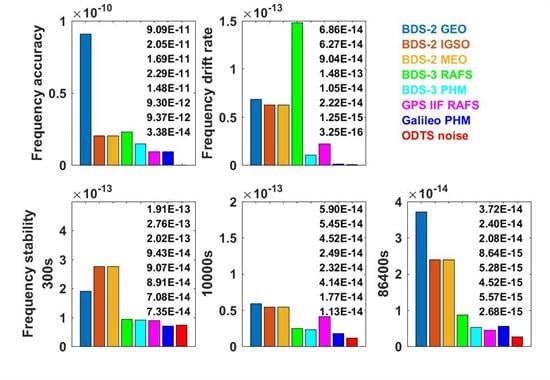
  • With the clean frequency data in a continuous arc, the performance of atomic clocks can be calculated, including the frequency accuracy, frequency drift rate (daily), and frequency stability (300 s, 9900 s, and 86,400 s). The HDEV is used to characterize the frequency stability. In the following text, the stability at the averaging time 9900 s is denoted as 10,000 stability.
  • Repeat step 5 for the next data arc, and then the clock assessed results can be derived in the next continuous arc. With the frequency accuracy, drift rate, and stability of each continuous arc, the average values of all arcs can be derived, which is the final assessed result of one atomic clock.

3. Precise Orbit and Clock Product Introduction and Analysis

In order to validate that the XRS product is competent to evaluate space clock stability, the XRS product precision is first analyzed. The multi-GNSS XRS precise orbit and clock product is calculated by the software Satellite Positioning and Orbit Determination System (SPODS) [27]. About 80 MGEX stations and 20 iGMAS stations with GPS, BDS, Galileo, and GLONASS satellite data are used to process precise orbit determination, including ultrarapid (XRU), rapid (XRR), and final (XRS) products in the daily routine. The BDS-3 observations are from B1I and B3I signals. Figure 1 shows the used ground stations, where there are about 50 stations tracking BDS-3 signals (i.e., the blue circles). With orbit and clock products from XRS, WUM, and IGS, the series of difference values between the orbits of two precise products on each day in radial (R), along-track (T), cross-track (N), and three-dimensional (3D) directions are computed. Then, the root mean square (RMS) of the difference values series is derived with the reference frame differences being eliminated by using Helmert transformation. As for the clocks, the RMS and STD are computed with the time series difference values between two precise products. Table 2 gives the averaged orbit RMS in R, T, N, and 3D directions and the RMS and STD of clocks over the processing time period. “GPS(XRS)” and “GPS(WUM)” denote the results of XRS and WUM compared with IGS products, respectively. The results of Galileo and BDS satellites are calculated by comparing XRS products with WUM products.
Figure 2 shows the daily averaged RMS of all GPS satellites in R, T, and N directions for XRS and WUM products compared with IGS products. The orbit accuracy of XRS and WUM is basically consistent, with the RMS in R and 3D directions being about 1.2 and 2.3 cm, respectively. The RMS of XRS products in radial direction is slightly better than that of WUM products, while in T and N directions, it is slightly worse. Figure 3 presents the RMS and STD of the clock comparison results. The STD of XRS products is slightly better than that of WUM products, while the RMS is slightly worse, with the RMS and STD for XRS products being about 0.24 and 0.05 ns, respectively. The GPS comparison results show the XRS product is excellent and comparable to the IGS analysis center.
Figure 4 presents the comparison results of Galileo satellites between XRS and WUM products. The accuracy of the two products is consistent, with the orbit RMS in R, T, N, and 3D directions being 1.8, 2.4, 3.0, and 4.3 cm, respectively, and the clock RMS and STD being 0.34 and 0.08 ns, respectively.
Figure 5 and Figure 6 show the orbit and clock comparison results of BDS-3 satellites between XRS and WUM products. The orbit 3D RMS of BDS-2 GEO satellites is at meter level, while for IGSO and MEO, it is at 3 and 4 decimeter levels, respectively. The STD of clocks is about 0.2 ns. The orbit RMS in R and 3D directions is 0.118 and 0.351 m for BDS-3 RAFS satellites and 0.119 and 0.322 m for BDS-3 PHM satellites, respectively. The clock STD of BDS-3 RAFS and PHM is 0.17 and 0.21 ns, respectively. The clock STD of C34 and C35 with PHM is 0.33 and 0.48 ns, respectively, while the mean value of other PHM satellites is 0.14 ns. Besides, the clock and orbit accuracy of C37 is relatively bad, with clock STD of 0.36 ns and orbit 3D RMS of 0.53 m. The specific reason needs to be further studied.
Compared with the results of GPS and Galileo, the orbit and clock of BDS satellites are worse, especially the RMS of clocks. Hence, the RMS of clocks is not listed in Table 1. The possible reasons are as follows. First, for BDS-2 satellites, the antenna phase center product is inconsistent, where XRS uses the reprocessed products [29] and WUM may use the products released by Wuhan University [30] or IGS product [31]. The antenna phase center offsets of BDS-3 satellites are also not absolutely equal. Then, the important reason may be the difference of POD strategies for the two products. The third reason is that BDS-3 satellites are running in orbit for only about half a year, and the work of error and model refinement is still being studied.

4. Noise Analysis of ODTS

The test assessment methods of GNSS satellite clocks include the phase comparison approach, the radio two-way method, the orbital inverse algorithm, and the prevailing ODTS method. The ODTS method uses the observation data from global ground stations with high-precision carrier phase measurements, and undoubtedly, a systematic noise exists in ODTS products. These errors include the measurement error, the ionospheric delay, the tropospheric delay, the multipath effect, the dynamic model, and the influence of ground station distribution. Hence, the systematic noise of ODTS needs to be quantified before assessing the performance of GNSS satellite clocks. The high-precision orbit and clock products of IGS, XRS, and WUM are derived by the ODTS method, where there are some ground stations attached to high-stability AHM. Therefore, we can calculate the frequency stability of ODTS noise by differencing receiver clocks of two stations attached to high-stability AHM. Table 3 shows some stations’ information used in XRS products.
The time period from July 9 to August 26 in 2019 was chosen to assess the ODTS noise. The differenced values between one receiver clock of three stations (PTBB, MGUE, and NOVM) and the KOUR station were derived. Figure 7 shows the frequency offsets of the differenced values after processing the data editing procedure. It can be seen that the outliers or jumps are basically removed.
Figure 8 shows the HDEV of one continuous arc frequency data as the function of averaging time. Results of three curves are comparable, though station NOVM is slightly worse than the other two stations. Table 4 gives the statistics of ODTS noise for the three stations. The tiny HDEVs at averaging time 10,000 s and 86,400 s show the consistency of receiver clocks between two ground stations attached to AHM. The average values are about 1.13 × 10⁻¹⁴ and 2.68 × 10⁻¹⁵ for 10,000 s and 86,400 s frequency stability, respectively.

5. Performance Assessment of BDS-3 Satellite Clocks

Based on the information of satellite table [32,33], Table 5 lists the pseudo-random noise (PRN) and the corresponding clock type of GNSS satellites. The processing period is from DOY 190 to 238 in 2019, which is consistent with the assessment period of ODTS noise. During this period, the BDS-2 included 5 GEO, 7 IGSO, and 3 MEO satellites, with the clock type being RAFS. The BDS-3 basic system included 10 MEO satellites with RAFS, 8 MEO satellites with PHM, and 1 GEO satellite with RAFS, where the GEO satellite was excluded due to the testing status during this period. We only chose the GPS block IIF satellites with RAFS and Galileo IOV and FOC satellites with PHM. Hence, there were 10 GPS satellites and 21 Galileo satellites.

5.1. Results

The differenced data between the clock data of one GNSS satellite and the receiver clock of the ground station KOUR attached to the high-precision AHM were derived. Then, the data editing procedures were completed, as described in Section 2. Figure 9 presents the clean frequency data of each BDS-3 satellite, where we see there are almost no jumps or outliers. Then, the BDS-3 atomic clock performance was derived. Figure 10 is the averaged frequency accuracy and frequency drift rate during the whole assessment period. It can be seen that the frequency accuracy of BDS-3 PHM is slightly better than BDS-3 RAFS, while the frequency drift rate is significantly superior. The frequency drift rate of BDS-3 with PHM when excluding C34 and C35 is 1.44 × 10⁻¹⁵, which is about two orders of magnitude better than that of BDS-3 RAFS satellites, showing the good performance of the PHM clock. Figure 11 gives the averaged frequency stability with the averaging time of 300 s, 10,000 s, and 86,400 s. The stability is basically comparable among BDS-3 satellites with the same clock type. The HDEV is basically comparable between BDS-3 RAFS and PHM satellites at the averaging time of 300 s, while the stability of 10,000 s and 86,400 s for BDS-3 PHM is better than BDS-3 RAFS, especially the 1 d stability.
Figure 12 summarizes the results of GNSS clock assessment in terms of the frequency accuracy, drift rate (daily), and stability at the averaging time 300 s, 10,000 s, and 86,400s, during the data processing period. The frequency accuracies of BDS-3 RAFS and PHM are 0.3~4 × 10⁻¹¹ and 0.5~3 × 10⁻¹¹, with the average values of 2.29 × 10⁻¹¹ and 1.48 × 10⁻¹¹, respectively, while for GPS satellites with RAFS, it is 0.2~1 × 10⁻¹¹ and the average value is 9.30 × 10⁻¹². Correspondingly, the frequency accuracy of Galileo satellites with PHM is 9.37 × 10⁻¹² with a large variation range of 3 × 10-14~4 × 10⁻¹¹. The averaged frequency accuracies of BDS-2 GEO, IGSO, and MEO satellites with RAFS are 9.09 × 10⁻¹¹, 2.05 × 10⁻¹¹, and 1.69 × 10⁻¹¹, respectively, which is comparable to the results of [34]. The average accuracy of BDS-3 with PHM is slightly worse than that of the GPS and Galileo satellites, while the accuracy of BDS-3 with RAFS is basically comparable to the BDS-2 IGSO and MEO satellites.
In terms of the daily frequency drift rate, the result of BDS-3 with RAFS is 0.1~2 × 10⁻¹³ with an average value of 1.48 × 10⁻¹³. Only C19 is in the order of 1 × 10-14, while other RAFS satellites are about 1~2 × 10⁻¹³ with a small variation. The range of BDS-3 with PHM is 3 × 10⁻¹⁶~4 × 10⁻¹⁴ with an average value of 1.05 × 10⁻¹⁴. C34 and C35 with PHM are relatively bad with the values of 3.01 × 10⁻¹⁴ and 4.49 × 10⁻¹⁴, respectively, which are worse by at least one order of magnitude than the other PHM satellites. The drift rate of GPS satellites is about 0.7~4 × 10⁻¹⁴ with an average value of 2.22 × 10⁻¹⁴, and the difference among GPS satellites is small. The drift rate of Galileo satellites is about 0.2~3 × 10⁻¹⁵ with an average value of 1.25 × 10⁻¹⁵, which presents the best result and is comparable to the result of [35]. The average drift rates of BDS-2 GEO, IGSO, and MEO satellites are 6.86 × 10⁻¹⁴, 6.27 × 10⁻¹⁴, and 9.04 × 10⁻¹⁴, respectively, which are comparable to the results of [34]. The results of C03, C04, C06, C16, and C14 are in the order of 1 × 10⁻¹³, which are relatively worse than the other satellites. The frequency drift rate of BDS-3 with RAFS is basically comparable to BDS-2 MEO satellites and worse than GPS IIF satellites, while that of BDS-3 with PHM, except C34 and C35, is slightly worse than Galileo PHM satellites.
In terms of the stability with the averaging time of 300 s, the result of BDS-3 RAFS is about 0.8~1 × 10⁻¹³ with an average value of 9.43 × 10⁻¹⁴, and similarly, the result of BDS-3 PHM is about 0.8-1 × 10⁻¹³ with an average value of 9.07 × 10⁻¹⁴. The stability of GPS satellites is about 8~9 × 10⁻¹⁴ with an average value of 8.91 × 10⁻¹⁴, and for Galileo satellites, it is 6~7 × 10⁻¹⁴ with an average value of 7.08 × 10⁻¹⁴. The average result of BDS-3 PHM satellites is slightly worse than GPS and Galileo. The stability of BDS-2 GEO, IGSO, and MEO satellites is 1.91 × 10⁻¹³, 2.76 × 10⁻¹³, and 2.02 × 10⁻¹³, respectively, showing BDS-3 RAFS is better than BDS-2 satellites. BDS-3 RAFS is slightly worse than GPS IIF RAFS satellites.
In terms of the stability of the averaging time of 10,000 s, the range of BDS-3 RAFS satellites is 2~3 × 10⁻¹⁴ with an average value of 2.49 × 10⁻¹⁴. Almost all satellites are smaller than 3 × 10⁻¹⁴, which is better than that of GPS satellites with an average value of 4.14 × 10⁻¹⁴ and variation range of 2~6 × 10⁻¹⁴. The stability of BDS-2 GEO, IGSO, and MEO satellites is 5.90 × 10⁻¹⁴, 5.45 × 10⁻¹⁴, and 4.52 × 10⁻¹⁴, respectively, which is better than the results of [13] with the 10,000 s stability being about 8~11 × 10−14, 6~12 × 10−14, and 4~6 × 10⁻¹⁴, respectively. It can be seen that the result of BDS-3 RAFS is better than that of BDS-2 satellites. The 10,000 s stability of BDS-3 PHM is 1~2 × 10⁻¹⁴ with an average value of 2.32 × 10⁻¹⁴, which is slightly worse than that of Galileo satellites with an average value of 1.77 × 10⁻¹⁴ and variation range of 1~2 × 10⁻¹⁴.
In terms of the stability with the averaging time of 86,400 s, the range of BDS-3 RAFS satellites is 0.2~1 × 10⁻¹⁴ with an average value of 8.64 × 10⁻¹⁵, which is worse than the stability of GPS satellites with an average value of 4.52 × 10⁻¹⁵ and variation range of 3~6 × 10⁻¹⁵. The stability of GPS is comparable to the result of [34] with an average value of 5 × 10-15. The variation range of 86,400 s stability for BDS-3 PHM satellites is 3~7 × 10⁻¹⁵ and the average value is 5.28 × 10⁻¹⁵, which is slightly better than the average value of 5.57 × 10⁻¹⁵ for Galileo satellites with the range of 0.2~1 × 10⁻¹⁴. The stability of BDS-2 GEO, IGSO, and MEO satellites is 3.72 × 10⁻¹⁴, 2.40 × 10⁻¹⁴, and 2.08 × 10⁻¹⁴, respectively, which is comparable to the results of [34].

5.2. Discussion

In order to analyze the specific characteristic of stability during the whole averaging time, Figure 13 gives the HDEV of one continuous arc for BDS-2 satellites. It can be seen that there are significant periodic signals at the time of about 2 cycles per revolution (cpr) with 12 h, while this phenomenon is not obvious for BDS-3, GPS, and Galileo satellites, as shown in Figure 14 and Figure 15. The stability of C16 is significantly better than other BDS-2 IGSO satellites, and the launch date of C16 was on 2018/07/09. From Figure 13 and Figure 14, we see the stability of BDS RAFS has a significant improvement from BDS-2 to BDS-3, and the BDS PHM presents the best clock stability. Figure 15 shows the stability of E07 and E08 is relatively worse than other Galileo satellites, with the average values being 0.76 × 10⁻¹⁴ and 1.91 × 10⁻¹⁴ for the averaging time of 86,400 s. The average value of other Galileo satellites is 4.67 × 10⁻¹⁵. In general, the stability at the averaging time of 86,400 s for BDS-3 PHM, GPS IIF RAFS, and Galileo PHM satellites is comparable.
The volume and weight of BDS-3 RAFS clocks are smaller than those of BDS-2. Besides, the very-high precision spaceborne RAFS was first carried on C36 and C37 satellites, which is the key for providing decimeter-magnitude positioning accuracy. From the results, it can be seen that the clock performance of the two satellites is basically comparable to other BDS-3 RAFS satellites, in spite of the 10,000 s and 1 d stability being slightly better. It should be noted that the number of visible stations (used in POD of XRS product) for C35, C36, and C37 satellites, with about a dozen stations, is fewer than other BDS-3 satellites with at least 30 visible stations. This may be also the reason that the clock STD of the three satellites between XRS and WUM products is bigger than other BDS-3 satellites. The clock performance between BDS-3 RAFS and GPS IIF RAFS has respective advantages in different aspects. The 10,000 s stability of BDS-3 RAFS is better than GPS, but for other indexes, the clock performance of GPS is superior.
More importantly, for the first time, there are eight BDS-3 satellites carrying PHM in the construction of BDS. Compared to RAFS, the key technical indexes (i.e., the frequency accuracy, drift rate, and stability) are superior, which has a significant influence on users’ positioning and timing accuracy, prediction performance, and autonomous navigation. The PHM includes a physical and electronics package and the working mechanism is different from RAFS. The specific work procedure can be found in [20]. The above results show the excellent performance of the PHM clock in terms of the three indexes, especially the frequency drift rate of PHM, which is basically two orders of magnitude smaller than RAFS satellites. On the whole, the clock performance of BDS-3 PHM is comparable to Galileo satellites, except C34 and C35 have large drift rates and the 10,000 s stability of BDS-3 is slightly worse than Galileo satellites.
Generally, when processing the stability analysis in the time domain, the reference frequency standard should be one-third smaller than that of the tested atomic clocks. The stability of 10,000 s and 86,400 s is 8.93 × 10⁻¹⁵ and 1.85 × 10⁻¹⁵, respectively, for the differenced values between receiver clocks of MGUE and KOUR with both attached to high-precision AHM. The threefold value of 8.93 × 10⁻¹⁵ is 2.68 × 10⁻¹⁴, which is basically comparable to the 10,000 s stability of BDS-3 PHM with the value 2.32 × 10⁻¹⁴. The threefold value of 1.85 × 10⁻¹⁵ is 5.55 × 10⁻¹⁴, which is basically comparable to the 10,000 s stability of BDS-3 PHM with the value 5.28 × 10⁻¹⁴. Therefore, the stability results at the averaging time of 10,000 s and 86,400 s are basically convincible.

6. Conclusions

This study assesses the clock performance for the BDS-3 basic system with 18 MEO satellites (8 with PHM and 10 with RAFS), in terms of frequency accuracy, daily drift rate, and stability at the averaging time of 300 s, 10,000 s, and 1 day. First orbits and clocks of XRS products are compared to WUM and IGS final products. The GPS result shows the accuracy of orbits and clocks is comparable to the WUM products. The BDS orbits comparison result of XRS products with respect to WUM products is in the order of decimeter magnitude and the clock STD is about 0.2 ns, which are worse than the results of GPS and Galileo satellites. We give the possible reason.
Then, we develop a data auto-editing procedure to preprocess clock data and assess the clock performance at each continuous arc. With the outliers excluded and day boundary problem solved using the specific strategy, the clean frequency data can be derived. The ODTS noise is derived by four stations attached to high-precision AHM. The average values of 10,000 s and 86,400 s stability are 1.13 × 10⁻¹⁴ and 2.68 × 10⁻¹⁵, respectively, where the best results are between MGUE and KOUR stations with the values being 8.93 × 10⁻¹⁵ and 1.85 × 10⁻¹⁵, respectively. These results indicate that the level of ODTS noise can be basically neglected when processing the performance assessment of GNSS clocks.
BDS-3 clock performance is compared with that of GPS BLOCK IIF RAFS, Galileo PHM, and BDS-2 RAFS satellites. In terms of frequency accuracy, the average values of BDS-3 RAFS and PHM are 2.29 × 10⁻¹¹ and 1.48 × 10⁻¹¹, respectively, where the RAFS is comparable to BDS-2, and the PHM is comparable to GPS with the value of 9.30 × 10⁻¹² and Galileo with the value of 9.37 × 10⁻¹². As for the frequency daily drift rate, the average value of BDS-3 RAFS is 1.48 × 10⁻¹³, which is slightly worse than BDS-2 MEO satellites with the value of 9.04 × 10⁻¹⁴. The mean value of BDS-3 PHM is 1.44 × 10⁻¹⁵ except C34 and C35, which is significantly better than the 2.22 × 10⁻¹⁴ of GPS and basically comparable to the 1.25 × 10⁻¹⁵ of Galileo. In terms of the stability at 300 s averaging time, the BDS-3 RAFS value is 9.43 × 10⁻¹⁴, which is better than BDS-2 satellites. The BDS-3 PHM value is 9.07 × 10⁻¹⁴, which is slightly better than the GPS value of 8.91 × 10⁻¹⁴ and slightly worse than the Galileo value of 7.08 × 10⁻¹⁴. The stability at 300 s averaging time among GPS IIF RAFS, Galileo PHM, and BDS-3 satellites is basically comparable. The 10,000 s stability of BDS-3 RAFS is 2.49 × 10⁻¹⁴, which is better than BDS-2 and GPS satellites. The BDS-3 PHM value is 2.32 × 10⁻¹⁴, which is better than the GPS value of 4.14 × 10⁻¹⁴ and slightly worse than the Galileo value of 1.77 × 10⁻¹⁴. As for the stability of 86,400 s, the BDS-3 RAFS is 8.64 × 10⁻¹⁵, which is better than BDS-2 satellites. The BDS-3 PHM is 5.28 × 10⁻¹⁵, which is slightly worse than the GPS value of 4.52 × 10⁻¹⁵ and better than the Galileo value of 5.57 × 10⁻¹⁵. Therefore, the clock performance of BDS-3 PHM is basically comparable to Galileo satellites and that of BDS-3 RAFS is better than BDS-2.

Author Contributions

X.J. proposed the initial idea of this study and supervised the experiments. T.Z. performed the experiments and wrote the paper. R.R. provided the XRS products. X.J., Y.M., and G.X. reviewed the paper.

Funding

This research was funded by National Natural Science Foundation of China (Grant Nos. 41874041, 41704035, 41904039) and by State Key Laboratory of Geo-Information Engineering, NO. SKLGIE2018-M-2-1.

Acknowledgments

The authors are grateful to iGMAS and MGEX for providing data and products for analysis.

Conflicts of Interest

The authors declare no conflict of interest.

References

  1. Yang, Y.; Gao, W.; Guo, S.; Mao, Y.; Yang, Y. Introduction to BeiDou-3 navigation satellite system. Navigation 2019, 66, 7–18. [Google Scholar] [CrossRef] [Green Version]
  2. IGS International GNSS Service BeiDou. Available online: http://mgex.igs.org/IGS_MGEX_Status_BDS.php (accessed on 16 October 2019).
  3. Zhao, Q.; Guo, J.; Li, M.; Qu, L.; Hu, Z.; Shi, C.; Liu, J. Initial results of precise orbit and clock determination for COMPASS navigation satellite system. J. Geod. 2013, 87, 475–486. [Google Scholar] [CrossRef]
  4. Lou, Y.; Liu, Y.; Shi, C.; Yao, X.; Zheng, F. Precise orbit determination of BeiDou constellation based on BETS and MGEX network. Sci. Rep. 2014, 4, 4692. [Google Scholar] [CrossRef] [PubMed] [Green Version]
  5. Guo, J.; Chen, G.; Zhao, Q.; Liu, J.; Liu, X. Comparison of solar radiation pressure models for BDS IGSO and MEO satellites with emphasis on improving orbit quality. GPS Solut. 2017, 21, 511–522. [Google Scholar] [CrossRef] [Green Version]
  6. Dai, X.; Ge, M.; Lou, Y.; Shi, C.; Wickert, J.; Schuh, H. Estimating the yaw-attitude of BDS IGSO and MEO satellites. J. Geod. 2015, 89, 1005–1018. [Google Scholar] [CrossRef]
  7. Yang, Y.; Li, J.; Wang, A.; Xu, J.; He, H.; Guo, H.; Shen, J.; Dai, X. Preliminary assessment of the navigation and positioning performance of BeiDou regional navigation satellite system. Sci. China Earth Sci. 2014, 57, 144–152. [Google Scholar] [CrossRef]
  8. Li, X.; Zhang, X.; Ren, X.; Fritsche, M.; Wickert, J.; Schuh, H. Precise positioning with current multi-constellation global navigation satellite systems: GPS, GLONASS, Galileo and BeiDou. Sci. Rep. 2015, 5, 8328. [Google Scholar] [CrossRef]
  9. Wanninger, L.; Beer, S. BeiDou satellite-induced code pseudorange variations: Diagnosis and therapy. GPS Solut. 2015, 19, 639–648. [Google Scholar] [CrossRef] [Green Version]
  10. Gong, H.; Yang, W.; Wang, Y.; Zhu, X.; Wang, F. Comparison of short-term stability estimation methods of GNSS on-board clock. In Proceedings of the China Satellite Navigation Conference (CSNC) 2012 Proceedings, Guanzhou, China, 15–19 May 2012; pp. 503–513. [Google Scholar]
  11. Montenbruck, O.; Hauschild, A.; Steigenberger, P.; Hugentobler, U.; Teunissen, P.; Nakamura, S. Initial assessment of the COMPASS/BeiDou-2 regional navigation satellite system. GPS Solut. 2013, 17, 211–222. [Google Scholar] [CrossRef]
  12. Steigenberger, P.; Hugentobler, U.; Hauschild, A.; Montenbruck, O. Orbit and clock analysis of Compass GEO and IGSO satellites. J. Geod. 2013, 87, 515–525. [Google Scholar] [CrossRef]
  13. Wang, B.; Lou, Y.; Liu, J.; Zhao, Q.; Su, X. Analysis of BDS satellite clocks in orbit. GPS Solut. 2016, 20, 783–794. [Google Scholar] [CrossRef]
  14. Hauschild, A.; Montenbruck, O.; Steigenberger, P. Short-term analysis of GNSS clocks. GPS Solut. 2013, 17, 295–307. [Google Scholar] [CrossRef]
  15. Zhou, S.; Hu, X.; Liu, L.; Guo, R.; Zhu, L.; Chang, Z.; Tang, C.; Gong, X.; Li, R.; Yu, Y. Applications of two-way satellite time and frequency transfer in the BeiDou navigation satellite system. Sci. China Phys. Mech. Astron. 2016, 59, 109511. [Google Scholar] [CrossRef]
  16. Huang, G.; Cui, B.; Zhang, Q.; Li, P.; Xie, W. Switching and performance variations of on-orbit BDS satellite clocks. Adv. Space Res. 2019, 63, 1681–1696. [Google Scholar]
  17. Zhang, X.; Wu, M.; Liu, W.; Li, X.; Yu, S.; Lu, C.; Wickert, J. Initial assessment of the COMPASS/BeiDou-3: New-generation navigation signals. J. Geod. 2017, 91, 1225–1240. [Google Scholar] [CrossRef]
  18. Pan, J.; Hu, X.; Zhou, S.; Tang, C.; Guo, R.; Zhu, L.; Tang, G.; Hu, G. Time synchronization of new-generation BDS satellites using inter-satellite link measurements. Adv. Space Res. 2018, 61, 145–153. [Google Scholar] [CrossRef]
  19. Li, X.; Yuan, Y.; Zhu, Y.; Huang, J.; Wu, J.; Xiong, Y.; Zhang, X.; Li, X. Precise orbit determination for BDS3 experimental satellites using iGMAS and MGEX tracking networks. J. Geod. 2019, 93, 103–117. [Google Scholar] [CrossRef]
  20. Wu, Z.; Zhou, S.; Hu, X.; Liu, L.; Shuai, T.; Xie, Y.; Tang, C.; Pan, J.; Zhu, L.; Chang, Z. Performance of the BDS3 experimental satellite passive hydrogen maser. GPS Solut. 2018, 22, 43. [Google Scholar] [CrossRef]
  21. Zhao, Q.; Wang, C.; Guo, J.; Wang, B.; Liu, J. Precise orbit and clock determination for BeiDou-3 experimental satellites with yaw attitude analysis. GPS Solut. 2018, 22, 4. [Google Scholar] [CrossRef] [Green Version]
  22. Lv, Y.; Geng, T.; Zhao, Q.; Liu, J. Characteristics of BeiDou-3 Experimental Satellite Clocks. Remote Sens. 2018, 10, 1847. [Google Scholar] [CrossRef] [Green Version]
  23. Yan, X.; Huang, G.; Zhang, Q.; Liu, C.; Wang, L.; Qin, Z. Early analysis of precise orbit and clock offset determination for the satellites of the global BeiDou-3 system. Adv. Space Res. 2019, 63, 1270–1279. [Google Scholar] [CrossRef]
  24. Xu, X.; Wang, X.; Liu, J.; Zhao, Q. Characteristics of BDS-3 Global Service Satellites: POD, Open Service Signal and Atomic Clock Performance. Remote Sens. 2019, 11, 1559. [Google Scholar] [CrossRef] [Green Version]
  25. International GNSS Monitoring & Assessment System. Available online: http://www.igmas.org/ (accessed on 16 October 2019).
  26. Guo, S.; Cai, H.; Meng, Y.; Geng, C.; Jia, X.; Mao, Y.; Geng, T.; Rao, Y.; Zhang, H.; Xie, X. BDS-3 RNSS technical characteristics and service performance. Acta Geod. Cartogr. Sin. 2019, 48, 810–821. [Google Scholar]
  27. Ruan, R.; Jia, X.; Wu, X.; Feng, L.; Zhu, Y. SPODS software and its result of precise orbit determination for GNSS satellites. In Proceedings of the China Satellite Navigation Conference (CSNC) 2014 Proceedings, Nanjing, China, 21–23 May 2014; Volume III, pp. 301–312. [Google Scholar]
  28. Riley, W. Handbook of Frequency Stability Analysis; NIST Special Publication: Gaithersburg, MD, USA, 2008.
  29. Ruan, R. Research on Key Technologies of Precise Data Processing for GNSS Networks. Ph.D. Thesis, Information Engineering University, Zhengzhou, China, 2018. [Google Scholar]
  30. Guo, J.; Xu, X.; Zhao, Q.; Liu, J. Precise orbit determination for quad-constellation satellites at Wuhan University: Strategy, result validation, and comparison. J. Geod. 2016, 90, 143–159. [Google Scholar] [CrossRef]
  31. IGSMAIL-7783. Format Issue in the igs14_2056 File. Available online: [email protected] (accessed on 16 October 2019).
  32. European Global Navigation Satellite Systems Agency. Available online: https://www.gsc-europa.eu/system-service-status/constellation-information (accessed on 16 October 2019).
  33. IGS International GNSS Service GPS. Available online: http://mgex.igs.org/IGS_MGEX_Status_GPS.php (accessed on 16 October 2019).
  34. Liu, S.; Jia, X.; Sun, D. Performance evaluation of GNSS on-board atomic clock. Geomat. Inf. Sci. Wuhan Univ. 2017, 42, 277–284. [Google Scholar] [CrossRef]
  35. Waller, P.; Gonzalez, F.; Binda, S.; Sesia, I.; Hidalgo, I.; Tobias, G.; Tavella, P. The in-orbit performances of GIOVE clocks. IEEE Trans. Ultrason. Ferroelectr. FrEquation. Control 2010, 57, 738–745. [Google Scholar] [CrossRef]
Figure 1. Ground station distribution of XRS POD products, where the blue circles denote stations that can track BDS-3 signals.
Remotesensing 11 02895 g001
Figure 2. GPS orbit results of XRS and WUM compared with IGS products.
Remotesensing 11 02895 g002
Figure 3. GPS clock offset results of XRS and WUM compared with IGS products.
Remotesensing 11 02895 g003
Figure 4. Galileo orbit and clock offset results of XRS products compared with those of WUM products.
Remotesensing 11 02895 g004
Figure 5. BDS-3 orbit results of XRS products compared with those of WUM products, where × indicates 10 BDS-3 satellites with RAFS and ○ indicates 8 BDS-3 satellites with PHM.
Remotesensing 11 02895 g005
Figure 6. BDS-3 clock offset results of XRS products compared with those of WUM products.
Remotesensing 11 02895 g006
Figure 7. Frequency offsets of the differenced values between one receiver clock of three stations and KOUR station.
Remotesensing 11 02895 g007
Figure 8. HDEV of the differenced frequency data for the three stations with respect to KOUR station.
Remotesensing 11 02895 g008
Figure 9. Frequency offsets of the differenced values between BDS-3 satellite clocks and KOUR station clocks.
Remotesensing 11 02895 g009aRemotesensing 11 02895 g009b
Figure 10. Averaged frequency accuracy and frequency drift rate during the whole assessment period for BDS-3 RAFS and PHM satellites. Note the y-axis of frequency drift rate for BDS-3 PHM is on the right side.
Remotesensing 11 02895 g010
Figure 11. Averaged frequency stability with the averaging time of 300 s, 10,000 s, and 86,400 s for BDS-3 RAFS and PHM satellites.
Remotesensing 11 02895 g011
Figure 12. Overall atomic clock performance for different types of GNSS satellites, including the frequency accuracy, drift rate, and stability.
Remotesensing 11 02895 g012
Figure 13. HDEV of the differenced frequency data for BDS-2 satellites with respect to KOUR station.
Remotesensing 11 02895 g013
Figure 14. HDEV of the differenced frequency data for BDS-3 MEO RAFS and GPS IIF RAFS satellites with respect to KOUR station.
Remotesensing 11 02895 g014
Figure 15. HDEV of the differenced frequency data for BDS-3 MEO PHM and Galileo PHM satellites with respect to KOUR station.
Remotesensing 11 02895 g015
Table 1. BDS-3 satellite information.
SVNPRNCommon NameSat. IDManuf. Launch DateStatus
C201C19MEO-12017-069ACAST5 November 2017USABLE
C202C20MEO-22017-069BCAST5 November 2017USABLE
C203C27MEO-72018-003ASECM11 January 2018USABLE
C204C28MEO-82018-003BSECM11 January 2018USABLE
C205C22MEO-42018-018ACAST12 February 2018USABLE
C206C21MEO-32018-018BCAST12 February 2018USABLE
C207C29MEO-92018-029ASECM29 March 2018USABLE
C208C30MEO-102018-029BSECM29 March 2018USABLE
C209C23MEO-52018-062ACAST29 July 2018USABLE
C210C24MEO-62018-062BCAST29 July 2018USABLE
C211C26MEO-122018-067ASECM24 August 2018USABLE
C212C25MEO-112018-067BSECM24 August 2018USABLE
C213C32MEO-132018-072ACAST19 September 2018USABLE
C214C33MEO-142018-072BCAST19 September 2018USABLE
C215C35MEO-162018-078ASECM15 October 2018USABLE
C216C34MEO-152018-078BSECM15 October 2018USABLE
C217C59GEO-12018-085ACAST1 November 2018TESTING
C218C36MEO-172018-093ACAST18 November 2018USABLE
C219C37MEO-182018-093BCAST18 November 2018USABLE
Table 2. Averaged values of comparison results of XRS and WUM products.
Orbit [m]Clock [ns]
RTN3DRMSSTD
GPS(XRS)0.01150.01320.01460.02330.2420.051
GPS(WUM)0.01270.01210.01320.02250.1980.052
Galileo0.01830.02410.02960.04310.3380.085
BDS-2-GEO0.3941.3531.0241.7421.31
BDS-2-IGSO0.1030.3400.3430.4940.16
BDS-2-MEO0.1150.2130.2300.3340.14
BDS-3-RAFS0.118 0.225 0.242 0.351 0.17
BDS-3-PHM0.119 0.209 0.215 0.322 0.21
Table 3. Some stations attached to high-stability AHM.
StationLocationCountryTypeInput FrequencyValid Period
PTBBBraunschweigGermanyAHM20 MHZ28 January 2010~
KOURKourouFrench GuianaAHM10 MHz20 November 2012~
MGUEMalargueArgentinaAHM10 MHz28 October 2013~
NOVMNovosibirskRussiaAHM5 MHz24 July 2001~
Table 4. Statistics of ODTS noise.
Station Diff.AccuracyDrift RateStability
300 s10,000 s1 Day
MGUE-KOUR5.66 × 10−144.70 × 10−165.26 × 10−148.93 × 10−151.85 × 10⁻¹⁵
NOVM-KOUR2.29 × 10−142.48 × 10−161.11 × 10−131.41 × 10−143.14 × 10⁻¹⁵
PTBB-KOUR2.18 × 10−142.56 × 10−165.69 × 10−141.09 × 10−143.04 × 10⁻¹⁵
Averaged value3.38 × 10−143.25 × 10−167.35 × 10−141.13 × 10−142.68 × 10⁻¹⁵
Table 5. GNSS satellite PRN and clock type used in the analysis.
GNSS Satellite TypePRNClock Type
BDS-2GEOC01 C02 C03 C04 C05RAFS
IGSOC06 C07 C08 C09 C10 C13 C16
MEOC11 C12 C14
BDS-3MEOC20 C21 C22 C23 C24 C32 C33 C36 C37RAFS
MEOC25 C26 C27 C28 C29 C30 C34 C35PHM
GPSIIFG01 G03 G06 G09 G10 G25 G26 G27 G30 G32RAFS
GalileoIOVE12 E19PHM
FOCE01 E02 E03 E04 E05 E07 E08 E09 E13 E15 E21 E24 E25 E26 E27 E30 E31 E33 E36

