Sequential InSAR Time Series Deformation Monitoring of Land Subsidence and Rebound in Xi’an, China


School of Geology Engineering and Geomatics, Chang’an University, Xi’an 710054, China
*
Author to whom correspondence should be addressed.
Remote Sens. 2019, 11(23), 2854; https://doi.org/10.3390/rs11232854
Submission received: 7 October 2019
/
Revised: 25 November 2019
/
Accepted: 29 November 2019
/
Published: 1 December 2019
(This article belongs to the Special Issue Remote Sensing of Natural Hazards)
Abstract
:Interferometric synthetic aperture radar (InSAR) time series deformation monitoring plays an important role in revealing historical displacement of the Earth’s surface. Xi’an, China, has suffered from severe land subsidence along with ground fissure development since the 1960s, which has threatened and will continue to threaten the stability of urban artificial constructions. In addition, some local areas in Xi’an suffered from uplifting for some specific period. Time series deformation derived from multi-temporal InSAR techniques makes it possible to obtain the temporal evolution of land subsidence and rebound in Xi’an. In this paper, we used the sequential InSAR time series estimation method to map the ground subsidence and rebound in Xi’an with Sentinel-1A data during 2015 to 2019, allowing estimation of surface deformation dynamically and quickly. From 20 June 2015 to 17 July 2019, two areas subsided continuously (Sanyaocun-Fengqiyuan and Qujiang New District), while Xi’an City Wall area uplifted with a maximum deformation rate of 12 mm/year. Furthermore, Yuhuazhai subsided from 20 June 2015 to 14 October 2018, and rebound occurred from 14 October 2018 to 17 July 2019, which can be explained as the response to artificial water injection. In the process of artificial water injection, the rebound pattern can be further divided into immediate elastic recovery deformation and time-dependent visco-elastic recovery deformation.
1. Introduction
The interferometric synthetic aperture radar (InSAR) is a remote sensing technique, which has been commonly used in the investigation of large-scale ground deformation. Land subsidence in urban areas has been investigated by the InSAR technique in Las Vegas, USA [1], Houston–Galveston, USA [2], Mexico City, Mexico [3], northeast Iran [4], West Thessaly Basin, Greece [5], Pisa urban area, Italy [6], Rome metropolitan area, Italy [7], Beijing [8], Tianjin [9], Taiyuan [10] and Datong, China [11].
Xi’an, China, has suffered from severe land subsidence and ground fissure hazards since the 1960s [12,13,14]. During the progress of economic development and urbanization, groundwater was over-exploited for more than 50 years [15]. Consequently, it caused the formation of fourteen ground fissures accompanying land subsidence throughout the city [14,15]. The maximum land subsidence rate reached 300 mm/year in 1996, and the maximum cumulative subsidence reached approximately 3 m over the past 60 years [16].
In order to alleviate the land subsidence and ground fissures caused by over-extraction of groundwater, artificial water injection and limitation of pumpage are two effective measures. In 1996, a policy of limiting the over-pumping of groundwater was issued, and the deformation rate began to decrease [17]. When an aquifer water level rises during artificial water injection, the rebound can be divided into short-term elastic recovery and time-dependent visco-elastic recovery [18]. Previous study revealed the uplift phenomena at Jixiangcun (point D in Figure 4) in Xi’an from 2012 to 2018 [19]. In this study, we used the sequential estimation method to map the surface deformation between 2015 and 2019 in Xi’an with 83 Sentinel-1A SAR images in terrain observation with progressive scans (TOPS) mode. Results show that some areas, such as Sanyaocun-Fengqiyuan and Qujiang New District, subsided continuously, areas such as Xi’an City Wall uplifted slowly, and areas such as Yuhuazhai rebounded after long-term subsidence, during the analyzed period.
This paper is organized as follows: Section 2 describes the sequential InSAR time series estimation method. Section 3 shows the study area and data. Section 4 shows three different surface deformation phenomena, including continuous land subsidence, uplift and rebound after long-term subsidence. Finally, a discussion on rebound deformation and conclusions are given in Section 5 and Section 6, respectively.
2. Methodology
The flow chart of data processing is shown in Figure 1, which includes three core steps: selection of coherent pixels, three-dimensional (3D) phase unwrapping and sequential estimation of deformation parameters.
2.1. Selection of Coherent Pixels
To mitigate the effects of decorrelation and retrieve large-gradient deformation, the small baseline subset (SBAS) InSAR method was proposed based on the interferograms with short spatial and temporal baselines [20]. In this paper, we use the temporal coherence to select coherent pixels [21,22], which is defined in Equation (1) for one generic pixel x:
where N is the number of interferograms, represents the flattened and topographically corrected interferogram, represents the spatially correlated phase component, and represents the spatially uncorrelated phase component (look-angle error phase). A more detailed introduction is provided in [21,22].
Followed by the phase unwrapping, the 3D phase unwrapping method was employed to mitigate the closed-loop discontinuities error in two-dimensional (2D) phase unwrapping [23]. It was used to explore the spatial and temporal relationships within the multi-interferograms, i.e., involving the computation of two Delaunay triangulations, which are usually referred to as “temporal” and “spatial” triangulations, respectively [24,25].
2.2. Sequential InSAR Time Series Estimation
After the atmospheric phase, orbital and digital elevation model (DEM) errors were removed from the interferograms, and we estimated the time series deformation phases by using the following function model:
where denotes the deformation phase at the different synthetic aperture radar (SAR) acquisition date and is the number of SAR images. Note the deformation at the first SAR acquisition date is set to zero, i.e., . To estimate the deformation time series, the archived SAR data are modeled as:
where is archived SAR data with design matrix and weight matrix . indicates the first estimation of parameter , and is its cofactor matrix. The superscript T stands for the transposition of a matrix.
When we acquire a new SAR image, unlike conventional SBAS InSAR, to estimate deformation time series for all SAR images again we use the sequential estimation to update dynamically the deformation time series by only considering the unwrapped interferograms related to the new SAR image. Assuming the new measurements are the unwrapped interferograms related to the new SAR acquisition, the weight matrix is , the design matrixes are and , and parameters are and , we can write its observational equation as follows:
According to the principle of least squares (LS) Bayesian estimation [26], it holds that:
Then, we can deduce Equation (6) through Equations (3), (4) and (5) [26,27] as follows:
where is the updated deformation time series, in which Y is the cumulative deformation at the new SAR acquisition date, and represents their cofactor matrixes. is the gain matrix, in which is the updated cofactor matrix with the new SAR image. Therefore, we can update the deformation parameters as quickly as possible, once a new SAR image is presented. For a more detailed discussion of sequential estimation of SBAS-InSAR dynamic deformation parameter methods, readers can refer to [28].
3. Study Area and Data
3.1. Study Area
Xi’an, the capital of Shaanxi province, China, is bounded by the Chan River and Ba River to the east, the Feng River to the west, the Wei River to the north, and the Qinling mountains to the south. The elevation of the study area varies from 360 to 750 m. Figure 2 shows the quaternary geology map of the study area, where the Chang’an-Lintong fault (CAF hereinafter) and 14 ground fissures are superimposed, and loess ridge areas are labeled with white blocks. The terrain of Xi’an gradually inclines from the north-west to the south-east, and the landform gradually transforms from a flood plain to loess tableland terraces. Loess ridges and depressions are interchangeably distributed in central urban areas, where land subsidence and 14 ground fissures occurred [19]. CAF fault (mainly in the ENE direction) is the most active fault to the south of Xi’an city, which controls the activities of the 14 ground fissures occurring on the hanging wall of CAF. On the other hand, the ground fissures have impacts on the land subsidence area, constraining the subsidence areas to develop into elliptical shapes with their long axes parallel to the fissure direction, i.e., in the north-east (NE) direction [14,16,17].
As to the hydrogeological conditions of Xi’an City, three main aquifers are present in Xi’an stratum: the phreatic aquifer, the first artesian aquifer, and the second artesian aquifer. The bottom of the phreatic aquifer varies from 30 to 80 m below the ground surface. The primary constituents for this phreatic aquifer are fine sand and clay, and its water quality is poor. The bottom of the first artesian aquifer ranges from 140 to 180 m below the ground surface. This aquifer consists of sand, loess, gravel, and mudstone, and its water quality is good. The bottom of the second artesian aquifer varies from 170 to 300 m below the surface. This aquifer has good water quality, and mainly includes fine-medium sand and medium-coarse sand [14,17]. Xi’an belongs to a temperate, semi-humid continental monsoon climate, with an annual precipitation of about 585 mm, so it suffers from a shortage of water resources with an urban population of 7 million. The volume of groundwater withdrawal from 1980 to 1994 increased annually, amounting to 1388 million m3/year in 1994 [17]. Owing to the restriction of groundwater exploitation in Xi’an since 1996, Heihe water has become the main water supply, leading to a decrease of groundwater withdrawal from 1996 to 2010 [17,29]. Moreover, a cumulative volume of 1,552,800 m3 had been recharged in Xi’an from 2009 to 2014.
Yuhuazhai is one of the severest deformation areas in Xi’an after 1996. The localized hydrogeological conditions belong to a loose multi-layer porous aquifer system, where the groundwater is composed of porous phreatic water, shallow confined aquifer and deep confined aquifer. The deep confined aquifer was mainly pumped at a depth of 100 to 300 m below the surface until 2018 [30]. With the decline of the water level in pumping wells, a pressure difference between the aquifer pressure in pumping wells and the surrounding aquifer occurred, which drove the water in the surrounding soil to move toward pumping wells [31]. Under this situation, land subsidence accelerated and a subsided funnel was formed in the aquifer system. Over-exploitation of groundwater leads to a decrease of groundwater level. Although the confined aquifer is elastic, the continuous over-exploitation of groundwater leads to irrecoverable confined aquifer deformation, which further leads to land subsidence [18].
In order to study the spatiotemporal characteristics of subsidence and ground fissures, both global positioning system (GPS) and InSAR observations between 2005 and 2007 were employed [32,33]. Then, Envisat, advanced land observation satellite (ALOS) and TerraSAR SAR datasets were also used to investigate the two-dimensional deformation in Xi’an from 2005 to 2012 [34]. Furthermore, European remote sensing satellite (ERS), Envisat and Sentinel SAR datasets were also used to investigate the long-term deformation evolution and causative factors of land subsidence and ground fissures in Xi’an from 2003 to 2017 [35]. Recently, multi-sensor SAR datasets (ALOS, TerraSAR and Sentinel) were used to investigate spatiotemporal land deformation from 2012 to 2018 over Xi’an, where the surface deformation along three Xi’an subway lines was first analyzed [19]. Previous studies show that there has been a close spatiotemporal relationship between land subsidence and the formation of earth fissures. The degradation of the aquifer system led to these typical deformations and threatened urban infrastructure.
3.2. Data
In total, 83 Sentinel-1A images from 20 June 2015 to 17 July 2019 in Xi’an, China were employed to generate 365 differential interferograms by setting the spatial and temporal baseline thresholds. For the sequential InSAR time series deformation processing, we divided SAR data into two groups. As shown in Figure 3, the first group is archived SAR data to generate interferograms (indicated in blue lines) with SBAS technology for parameter initialization, while the second group is newly received SAR images (i.e., a new SAR acquisition) to connect older archived SAR images and generate new interferograms (indicated with green lines) with SBAS technology to update new deformation parameters. Specifically, we used estimated deformation parameters and their cofactor matrixes to update dynamically the deformation parameters one by one, including time series, deformation rate and DEM error, by only considering the newly generated interferograms. As estimated results from conventional SBAS and sequential SBAS estimation inversion are exactly consistent in terms of deformation rate, DEM error and deformation time series [17], without a loss of generality, we took the first 70 SAR images from 20 June 2015 to 18 January 2019 as the first group to initiate the parameters. For the first group data, we used the conventional SBAS-InSAR method, including the selection of coherent pixels, phase unwrapping, DEM error correction, and atmospheric and orbital error correction, followed by the inversion of deformation parameters and their cofactor matrixes.
To update the time series deformation on the new SAR acquisition date, there are usually two ways to generate interferograms among newly received SAR images and the archived SAR images: single-link configuration to unwrap interferograms in the spatial domain, as shown in Figure 3A, and network-link configuration, shown in Figure 3B, where interferograms can be unwrapped in both spatial and time domains, i.e., 3D phase unwrapping [23,24,25]. We used the latter method to update the deformation time series.
The selected coherent pixels in the first group of SAR data were used to extract the phase for the interferograms and connect to the newly received SAR images. After 3D phase unwrapping, followed by the correction of DEM, atmospheric and orbital errors, the deformation rate and time series were updated by sequential estimation.
4. Results
4.1. Deformation Rate Map
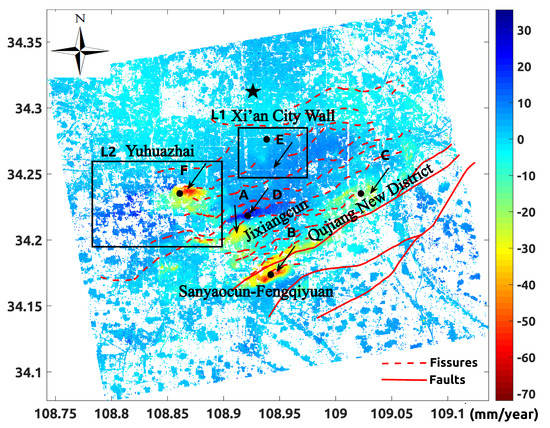
Figure 4 presents the annual deformation rate map in the vertical direction over the main Xi’an region from 20 June 2015 to 17 July 2019. We chose the stable area indicated with a black pentagram as the reference point, as has been verified by previous studies [19,34,35].
Figure 5 shows the cumulative deformation time series for six typical points from 20 June 2015 to 17 July 2019, where the points A to C show continuous land subsidence with approximately linear deformation, and points D and E show continuous uplift with linear deformation. However, point F shows a fast rebound after long-term subsidence.
4.2. Land Subsidence
The Xi’an area has suffered from severe land subsidence and ground fissure hazards since the 1960s [12,13,14]. Historical leveling measurements indicate that the area of land subsidence reached about 300 km2 in Xi’an from 1959 to 2018 [29]. Multi-temporal SAR observations and GPS measurements were used to study the spatiotemporal evolution and mechanism of land subsidence and ground fissure activities from 1992 to 2006 [32,33]. InSAR results from 2005 to 2018 uncovered the three land subsiding areas, namely, Yuhuazhai, Sanyaocun-Fengqiyuan and Qujiang New District [19,31,32,33,34,35]. As shown in Figure 4 and Figure 5, two areas in Xi’an, namely, Sanyaocun-Fengqiyuan and Qujiang New District, continuously subsided from 20 June 2015 to 17 July 2019.
4.3. Uplift of Xi’an City Wall
Xi’an City Wall (Figure 6), as long as 13.74 kilometers, is famous globally for its complete preservation over its long history since the Ming Dynasty. As shown in Figure 6, the deformation rate from 20 June 2015 to 17 July 2019 showed that the north-west section of Xi’an City Wall was basically stable, with the deformation rate as small as 1 mm/year. However, the uplift rate in the south-east section reached 12 mm/year. The average uplift rate was 7 mm/year. Further, as shown in Figure 7, the cumulative deformation time series for four points, i.e., A–D at the south-east section of downtown Xi’an, showed a continuous uplift with different rates from 20 June 2015 to 17 July 2019.
4.4. Rebound of Yuhuazhai
Yuhuazhai is one of the severest land subsidence areas in Xi’an. Cumulative deformation time series over L2 (Yuhuazhai) in Figure 4 are calculated in Figure 8 from 20 June 2015 to 17 July 2019, and from 5 April 2018 to 17 July 2019 in Figure 9.
In Figure 9, the onset rebound date on 14 October 2018 can be visually detected, and the center of the rebound can be determined. The maximum rebound area was located in the settlement center and the rebound area diffused around the previous maximum land subsidence center, in particular, the area towards the south. The maximum rebound magnitude was 130 mm from 14 October 2018 to 17 July 2019. Figure 10 shows the enlarged deformation map on 13 December 2018, where a ground fissure (F4) is superimposed. We can see that the deformation, including subsidence and rebound, is restricted on the hanging wall (i.e., the south side) of ground fissure F4. Four points localized at A–D show different surface deformation processes. The deformation evolution can be divided into three stages, i.e., (i) a sustained land subsidence from 20 June 2015 to 14 October 2018; (ii) a quick rebound from 14 October 2018 to 1 December 2018; and (iii) a slower rebound from 1 December 2018 to 17 July 2019.
5. Discussion
The land subsidence in Xi’an can be divided into three stages; i) preliminary stage (1959 to 1971), ii) rapid development stage (1972 to 1990), and iii) slow development stage (1991 to present) [17]. As investigated, the localized groundwater withdrawal was the main factor for the long-term land subsidence [15,33,34,35]. The degradation of the aquifer system led to these typical deformations, and threatened infrastructure assets. The land subsidence occurring in Sanyaocun-Fengqiyuan and Qujiang New District areas shows the same deformation characteristics as in previous studies [19,34,35]. The artificial water injection and restricted exploitation of groundwater are effective measures to alleviate the imbalance of groundwater and land subsidence.
Geo-mechanisms of subsurface water withdrawal and injection were discussed in [36,37]. Artificial recharge after long-term groundwater extraction causes land uplift, which consists of elastic, plastic, visco-elastic, and visco-plastic components. In reality, the recoverable elastic and visco-elastic deformation accounts for a very small proportion of total deformation [18]. When the water level of a confined aquifer rises in the process of artificial water injection, the elastic deformation can recover quickly, while the recovery of visco-elastic deformation is time-dependent. On the contrary, the plastic and visco-plastic deformation is irrecoverable [18].
Due to the restriction of groundwater exploitation in Xi’an since 1996, the groundwater level began to recover [29]. The Heihe water supply facility (a large-scale water conservancy project of water diversion and comprehensive utilization across river basins), has become the main source of domestic water, instead of groundwater, which has largely alleviated the imbalance of the water table in Xi’an. The exploitation of deep groundwater significantly reduced, and the confined water level in many areas increased from 2002 to 2017 [34], which led to the surface uplift as shown in Figure 4, including at the Xi’an City Wall. Therefore, the uplift of Xi’an City Wall is an example of recovery of visco-elastic deformation, which is time-dependent.
Yuhuazhai has experienced a severe surface deformation since 1996. The cumulative land subsidence was up to 1.8–2 m from 1996 to 2016 [30]. In order to alleviate the land subsidence caused by over-extraction of groundwater, the cessation of groundwater withdrawal and a water injection strategy were adopted by Xi’an Municipal Government since October 2018 [38]. For the water injection strategy, conventionally daily water was injected into the pumping well to avoid pollution of groundwater. The result shows that Yuhuazhai continuously subsided from 20 June 2015 to 14 October 2018, then rebounded from 14 October 2018 to 17 July 2019, owing to the artificial water injection operation.
Owing to the high water quality of the deep confined aquifer, it was used as the main source of residential water supply. However, long-term over-exploitation of groundwater led to the decline of the groundwater level. The cumulative decline of the water level was nearly 70 m in Yuhuazhai areas [29]. Approximately 85% of the pumping wells were located to the south of the ground fissure F4 [30], where serious land subsidence occurred; the existence of ground fissure F4 hindered the flow of groundwater and limited the expansion of the surface deformation. For the phreatic aquifer head, the south of ground fissure F4 was 13.0–13.52 m in depth, while the north of ground fissure F4 was 14.15–16.48 m in depth [30]. For the confined aquifer head, the south of the ground fissure F4 was 103–106.4 m in depth, while the north of the ground fissure F4 was 49.57 m in depth [30]. Therefore, during the water injection, the groundwater to the south of the ground fissure recovered rapidly. After long-term land subsidence of Yuhuazhai (i.e., 1.8–2 m land subsidence from 1996 to 2016), a rapid rebound with a magnitude of about 130 mm occurred from 14 October 2018 to 1 December 2018, as a recoverable elastic deformation. Then, the time-dependent rebound of visco-elastic deformation continued from 1 December 2018 to 17 July 2019, which will likely continue for some time.
Moreover, there are 45 deep wells in the whole Yuhuazhai area, i.e., approximately 1 well per 1.7 km2 [30]. We show the optical image of the largest rebound center in Figure 12, where we visually identify seven pumping wells. Figure 13 shows three images and photos corresponding to pumping wells 1, 2, and 3 of Figure 12.
6. Conclusions
In the process of urbanization, over-exploitation of groundwater in the Xi’an area since 1960s has led to land subsidence. Artificial water injection has alleviated the land subsidence effectively. We employed the sequential estimation method to update the surface time series deformation dynamically, which is an efficient InSAR tool to monitor surface deformation as quickly as possible, when SAR images are acquired one by one.
Our contribution is to reveal the surface subsidence, uplift and rebound in the Xi’an area with 83 Sentinel SAR images from 20 June 2015 to 17 July 2019. The land subsidence occurred in Sanyaocun-Fengqiyuan and Qujiang New District areas. Meanwhile, the uplift and sudden rebound deformation were revealed in Xi’an City Wall and Yuhuazhai, respectively.
Owing to the restriction of groundwater exploitation in the Xi’an area since 1996, the declined groundwater level began to recover, and the confined water level increased accordingly. In addition, we find that the sudden rebound deformation located in Yuhuazhai was mainly due to artificial water injection, which was carried out in the pumping well of Yuhuazhai around October 2018. The rebound pattern comprises two stages: the elastic deformation and visco-elastic deformation. The former can recover immediately, while the latter is time-dependent. The complex surface deformation in Xi’an reflects the changes in the aquifer system. Therefore, the control of groundwater balance can alleviate surface deformation.
Author Contributions
B.W. and C.Z. performed the experiments and produced the results. B.W. drafted the manuscript and C.Z. finalized the manuscript. Q.Z., and M.P. contributed to the discussion of the results. All authors conceived the study, and reviewed and approved the manuscript.
Funding
This research was funded by the Natural Science Foundation of China (Grant No. 41874005), and the Fundamental Research Funds for the Central Universities (Grant Nos. 300102269303 and 300102269719).
Acknowledgments
We are grateful to the European Space Agency for providing Sentinel-1A data.
Conflicts of Interest
The authors declare no conflicts of interest.
References
- Amelung, F.; Galloway, D.L.; Bell, J.W.; Zebker, H.A.; Laczniak, R.J. Sensing the ups and downs of lasvegas: InSAR reveals structural control of land subsidence and aquifer-system deformation. Geology 1999, 27, 483. [Google Scholar] [CrossRef]
- Qu, F.; Lu, Z.; Zhang, Q.; Bawden, G.W.; Kim, J.; Zhao, C.; Qu, W. Mapping ground deformation over Houston–Galveston, Texas using multi-temporal InSAR. Remote Sens. Environ. 2015, 169, 290–306. [Google Scholar] [CrossRef]
- Cabral-Cano, E.; Dixon, T.H.; Miralles-Wilhelm, F.; Diaz-Molina, O.; Sanchez-Zamora, O.; Carande, R.E. Space geodetic imaging of rapid ground subsidence in Mexico city. Geol. Soci. Am. Bull. 2008, 120, 1556–1566. [Google Scholar] [CrossRef]
- Motagh, M.; Djamour, Y.; Walter, T.R.; Wetzel, H.U.; Arabi, S. Land subsidence in Mashhad Valley, northeast Iran: Results from InSAR, levelling and GPS. Geophys. J. Int. 2007, 168, 518–526. [Google Scholar] [CrossRef]
- Sideri, D.; Modis, K. Spatiotemporal estimation of land subsidence and ground water level decline in West Thessaly basin, Greece. Nat. Hazards 2014, 76, 1–16. [Google Scholar]
- Solari, L.; Ciampalini, A.; Raspini, F.; Bianchini, S.; Moretti, S. PSInSAR Analysis in the Pisa Urban Area (Italy): A Case Study of Subsidence Related to Stratigraphical Factors and Urbanization. Remote Sens. 2016, 8, 120. [Google Scholar] [CrossRef]
- Delgado Blasco, J.M.; Foumelis, M.; Stewart, C.; Hooper, A. Measuring Urban Subsidence in the Rome Metropolitan Area (Italy) with Sentinel-1 SNAP-StaMPS Persistent Scatterer Interferometry. Remote Sens. 2019, 11, 129. [Google Scholar] [CrossRef]
- Zhou, C.; Gong, H.; Zhang, Y.; Warner, T.A.; Wang, C. Spatiotemporal Evolution of Land Subsidence in the Beijing Plain 2003–2015 Using Persistent Scatterer Interferometry (PSI) with Multi-Source SAR Data. Remote Sens. 2018, 10, 552. [Google Scholar] [CrossRef]
- Zhang, T.; Shen, W.-B.; Wu, W.; Zhang, B.; Pan, Y. Recent Surface Deformation in the Tianjin Area Revealed by Sentinel-1A Data. Remote Sens. 2019, 11, 130. [Google Scholar] [CrossRef]
- Liu, Y.; Zhao, C.; Zhang, Q.; Yang, C.; Zhang, J. Land subsidence in Taiyuan, China, monitored by InSAR technique with multisensor SAR datasets from 1992 to 2015. IEEE J. Sel. Top. Appl. Earth Obs. Remote Sens. 2018, 11, 1–11. [Google Scholar] [CrossRef]
- Yang, C.; Lu, Z.; Zhang, Q.; Liu, R.; Ji, L. Ground deformation and fissure activity in Datong basin, China 2007–2010 revealed by multi-track InSAR. Geomat. Nat. Hazards Risk 2019, 10, 465–482. [Google Scholar] [CrossRef]
- Zhang, J.M. The structural features and the genetic mechanism of the surface crack belt in Xi’an, Shaanxi Province. Geol. Shaanxi 1986, 4, 11–20. (In Chinese) [Google Scholar]
- Peng, J.B.; Fan, W.; Li, X.A.; Wang, Q.L.; Feng, X.J.; Zhang, J.; Li, X.S.; Lu, Q.Z.; Huang, Q.B.; Ma, R.Y. Some key questions in the formation of ground fissures in the Fen-Wei Basin. J. Eng. Geol. 2007, 15, 433–440. (In Chinese) [Google Scholar]
- Peng, J.B. Geohazards of Xi’an Ground Fissures; Science Press: Beijing, China, 2012; pp. 267–316. (In Chinese) [Google Scholar]
- Peng, J.B.; Sun, X.H.; Wang, W.; Sun, G.C. Characteristics of land subsidence, earth fissures and related disaster chain effects with respect to urban hazards in Xi’an, China. Environ. Earth Sci. 2016, 75, 1190. [Google Scholar] [CrossRef]
- Peng, J.; Qu, W.; Ren, J.; Zhang, Q.; Wang, F. Geological factors for the formation of Xi’an ground fractures. J. Earth Sci. 2018, 29, 468–478. [Google Scholar] [CrossRef]
- Wang, Y.Q.; Wang, Z.F.; Cheng, W.C. A review on land subsidence caused by groundwater withdrawal in Xi’an, China. Bull. Eng. Geol. Environ. 2018, 78, 2851–2863. [Google Scholar] [CrossRef]
- Zhang, Y.; Wu, J.; Xue, Y.; Wang, Z.; Yao, Y.; Yan, X. Land subsidence and uplift due to long-term groundwater extraction and artificial recharge in Shanghai, China. Hydrogeol. J. 2015, 23, 1851–1866. [Google Scholar] [CrossRef]
- Peng, M.; Zhao, C.; Zhang, Q.; Lu, Z.; Li, Z. Research on Spatiotemporal Land Deformation (2012–2018) over Xi’an, China, with Multi-Sensor SAR Datasets. Remote Sens. 2019, 11, 664. [Google Scholar] [CrossRef]
- Berardino, P.; Fornaro, G.; Lanari, R.; Sansosti, E. A New Algorithm for Surface Deformation Monitoring Based on Small Baseline Differential SAR Interferograms. IEEE Trans. Geosci. Remote Sens. 2002, 40, 2375–2383. [Google Scholar] [CrossRef]
- Hooper, A.; Segall, P.; Zebker, H. Persistent scatterer interferometric synthetic aperture radar for crustal deformation analysis, with application to Volcán Alcedo, Galápagos. J. Geophys. Res. Solid Earth 2007, 112, 1978–2012. [Google Scholar] [CrossRef]
- Hooper, A. A multi-temporal InSAR method incorporating both persistent scatterer and small baseline approaches. Geophys. Res. Lett. 2008, 35, 96–106. [Google Scholar] [CrossRef]
- Hooper, A.; Zebker, H.A. Phase unwrapping in three dimensions with application to InSAR time series. J. Opt. Soc. Am. A 2007, 24, 2737–2747. [Google Scholar] [CrossRef] [PubMed]
- Pepe, A.; Lanari, R. On the extension of the minimum cost flow algorithm for phase unwrapping of multitemporal differential SAR interferograms. IEEE Trans. Geosci. Remote Sens. 2006, 44, 2374–2383. [Google Scholar] [CrossRef]
- Pepe, A.; Euillades, L.D.; Manunta, M.; Lanari, R. “New advances of the extended minimum cost flow phase unwrapping algorithm for SBAS-DInSAR analysis at full spatial resolution. ” EEE Trans. Geosci. Remote Sens. 2011, 49, 4062–4079. [Google Scholar] [CrossRef]
- Yang, Y. Robust Bayesian estimation. J. Geod. 1991, 65, 145–150. [Google Scholar]
- Huang, W.B. Modern Adjustment Theory and Its Application; PLA Press: China, Beijing, 1992. (In Chinese) [Google Scholar]
- Wang, B.H.; Zhao, C.Y.; Zhang, Q.; Lu, Z.; Li, Z.H.; Liu, Y.Y. Sequential Estimation of SBAS-InSAR Dynamic Deformation Parameters. IEEE Geosci. Remote Sens. Lett. 2019. [Google Scholar] [CrossRef]
- Dong, Y.; Zhang, M.S.; Liu, J.; Zhang, X.L.; Feng, L. Coupling Relationship between Groundwater and Ground Fissures of Land Subsidence in Xi’an City and Risk Prevention and Control Technology. J. Geol. Hazards Environ. Preserv. 2019, 2, 95–102. (In Chinese) [Google Scholar]
- Jun, Z.J.; Xin, Z.H.; Sheng, Z.M.; Yong, L.I.; Yin, D.; Gui, Z.Q. Preliminary study of land subsidence in the f4 ground fissure, Yuhuazhai area, Xi’an, China. J. Geol. Hazards Environ. Preserv. 2017, 4, 31–37. (In Chinese) [Google Scholar]
- Zhang, J.J.; Zhan, H.X.; Zhang, M.S.; Tao, H.; Dong, Y.; Xu, C.M. Study on the Seepage Deformation Induce Ground Fissures Caused and Land Subsidence in Xi’an. J. Eng. Geol. 2018, 26, 301–309. (In Chinese) [Google Scholar]
- Zhao, C.Y.; Zhang, Q.; Ding, X.L.; Lu, Z.; Yang, C.S.; Qi, X.M. Monitoring of land subsidence and ground fissures in Xi’an, China 2005–2006: Mapped by SAR interferometry. Environ. Geol. Berlin 2009, 58, 1533–1540. [Google Scholar] [CrossRef]
- Zhang, Q.; Zhao, C.Y.; Ding, X.L. Research on recent characteristics of spatiotemporal evolution and mechanism of Xi’an land subsidence and ground fissure by using GPS and InSAR techniques. Chin. J. Geophys. 2009, 52, 1214–1222. (In Chinese) [Google Scholar]
- Qu, F.; Zhang, Q.; Lu, Z.; Zhao, C.; Yang, C.; Zhang, J. Land subsidence and ground fissures in Xi’an, China 2005–2012 revealed by multi-band InSAR time-series analysis. Remote Sens. Environ. 2015, 155, 366–376. [Google Scholar] [CrossRef]
- Li, M.; Ge, D.; Liu, B.; Zhang, L.; Wang, Y.; Guo, X. Research on development characteristics and failure mechanism of land subsidence and ground fissure in Xi’an, monitored by using time-series SAR interferometry. Geomat. Nat. Hazards Risk 2019, 10, 699–718. [Google Scholar] [CrossRef]
- Teatini, P.; Gambolati, G.; Ferronato, M.; Settari, A.; Walters, D. Land uplift due to subsurface fluid injection. J. Geodyn. 2011, 51, 1–16. [Google Scholar] [CrossRef]
- Gambolati, G.; Teatini, P. Geomechanics of subsurface water withdrawal and injection. Water Resour. Res. 2015, 51, 3922–3955. [Google Scholar] [CrossRef]
- Chinese Government Procurement Website. Available online: http://www.ccgp.gov.cn/cggg/dfgg/cjgg/201811/t20181108_11064072.htm (accessed on 8 November 2018).
Figure 1.
Flow chart of sequential InSAR time series estimation.

Figure 2.
Quaternary geology map of Xi’an, where Chang’an-Lintong fault (CAF) and 14 ground fissures are superimposed, and loess ridge areas are labeled with white blocks.
Figure 2.
Quaternary geology map of Xi’an, where Chang’an-Lintong fault (CAF) and 14 ground fissures are superimposed, and loess ridge areas are labeled with white blocks.

Figure 3.
The illustration of interferogram configuration between the first group of SAR data (i.e., archived SAR data) and the newly received SAR images (i.e., new observation data from SAR satellites). (A) Single-link interferogram configuration; (B) network-link interferogram configuration. The blue lines indicate interferograms generated between archived SAR images in the first group by SBAS technology and the green lines show the new interferograms generated between newly received SAR images and older archived SAR images by SBAS technology.

Figure 4.
Annual deformation rate map in the vertical direction over the study area from 20 June 2015 to 17 July 2019. The deformation time series for six points indicated by A–F are shown in Figure 5. Rectangular boxes L1 and L2 are enlarged and shown in Figures 6 and 8, respectively. Red dotted line indicates ground fissures, and the red line indicates CAF faults. The black pentagram indicates the location of the reference point.

Figure 5.
Deformation time series at six typical points (A–F), which are located in Figure 4. The six points show different deformation magnitude.
Figure 5.
Deformation time series at six typical points (A–F), which are located in Figure 4. The six points show different deformation magnitude.

Figure 6.
The deformation and optical image of Xi’an City Wall; (A) deformation rate map from 20 June 2015 to 17 July 2019, which is an enlargement of L1 in Figure 4; (B) an optical image of Xi’an City Wall; (C) a photo of Xi’an City Wall.
Figure 6.
The deformation and optical image of Xi’an City Wall; (A) deformation rate map from 20 June 2015 to 17 July 2019, which is an enlargement of L1 in Figure 4; (B) an optical image of Xi’an City Wall; (C) a photo of Xi’an City Wall.

Figure 7.
Deformation time series at points (A–D); their locations are indicated in Figure 6A.
Figure 7.
Deformation time series at points (A–D); their locations are indicated in Figure 6A.

Figure 8.
Cumulative deformation time series of Yuhuazhai from 20 June 2015 to 17 July 2019.

Figure 9.
Cumulative rebound deformation time series of Yuhuazhai from 5 April 2018 to 17 July 2019. The black rectangular box is enlarged in Figure 10.
Figure 9.
Cumulative rebound deformation time series of Yuhuazhai from 5 April 2018 to 17 July 2019. The black rectangular box is enlarged in Figure 10.

Figure 10.
Enlarged deformation map of the area in the rectangle in Figure 9, with indication of the ground fissure F4. The time series deformation of four points localized at A–D are shown in Figure 11. The Yuhuazhai area indicated in the rectangle is shown in Figure 12.

Figure 11.
Deformation time series at four points A–D in Figure 10. Red lines divide time series deformation into three stages.
Figure 11.
Deformation time series at four points A–D in Figure 10. Red lines divide time series deformation into three stages.

Figure 12.
Optical image of Yuhuazhai (rectangular box in Figure 10). Seven pumping wells are identified. This area experienced large rebound deformation after artificial water injection.
Figure 12.
Optical image of Yuhuazhai (rectangular box in Figure 10). Seven pumping wells are identified. This area experienced large rebound deformation after artificial water injection.

Figure 13.
Recognition of pumping wells 1, 2, and 3 in Figure 12 from optical image (A–C), and by photo of the scene (D–F), respectively.
Figure 13.
Recognition of pumping wells 1, 2, and 3 in Figure 12 from optical image (A–C), and by photo of the scene (D–F), respectively.

© 2019 by the authors. Licensee MDPI, Basel, Switzerland. This article is an open access article distributed under the terms and conditions of the Creative Commons Attribution (CC BY) license (http://creativecommons.org/licenses/by/4.0/).
Share and Cite
MDPI and ACS Style
Wang, B.; Zhao, C.; Zhang, Q.; Peng, M. Sequential InSAR Time Series Deformation Monitoring of Land Subsidence and Rebound in Xi’an, China. Remote Sens. 2019, 11, 2854. https://doi.org/10.3390/rs11232854
AMA Style
Wang B, Zhao C, Zhang Q, Peng M. Sequential InSAR Time Series Deformation Monitoring of Land Subsidence and Rebound in Xi’an, China. Remote Sensing. 2019; 11(23):2854. https://doi.org/10.3390/rs11232854
Chicago/Turabian StyleWang, Baohang, Chaoying Zhao, Qin Zhang, and Mimi Peng. 2019. "Sequential InSAR Time Series Deformation Monitoring of Land Subsidence and Rebound in Xi’an, China" Remote Sensing 11, no. 23: 2854. https://doi.org/10.3390/rs11232854
Note that from the first issue of 2016, this journal uses article numbers instead of page numbers. See further details here.