Review

Remote Sensing of Human–Environment Interactions in Global Change Research: A Review of Advances, Challenges and Future Directions

Department of Earth and Ocean Sciences, University of North Carolina Wilmington, 601 S. College Rd., Wilmington, NC 28401, USA
*
Author to whom correspondence should be addressed.
Remote Sens. 2019, 11(23), 2783; https://doi.org/10.3390/rs11232783
Submission received: 1 October 2019 / Revised: 14 November 2019 / Accepted: 22 November 2019 / Published: 26 November 2019
(This article belongs to the Special Issue Remote Sensing of Human-Environment Interactions)

Abstract

:
The role of remote sensing and human–environment interactions (HEI) research in social and environmental decision-making has steadily increased along with numerous technological and methodological advances in the global environmental change field. Given the growing inter- and trans-disciplinary nature of studies focused on understanding the human dimensions of global change (HDGC), the need for a synchronization of agendas is evident. We conduct a bibliometric assessment and review of the last two decades of peer-reviewed literature to ascertain what the trends and current directions of integrating remote sensing into HEI research have been and discuss emerging themes, challenges, and opportunities. Despite advances in applying remote sensing to understanding ever more complex HEI fields such as land use/land cover change and landscape degradation, agricultural dynamics, urban geography and ecology, natural hazards, water resources, epidemiology, or paleo HEIs, challenges remain in acquiring and leveraging accurately georeferenced social data and establishing transferable protocols for data integration. However, recent advances in micro-satellite, unmanned aerial systems (UASs), and sensor technology are opening new avenues of integration of remotely sensed data into HEI research at scales relevant for decision-making purposes that simultaneously catalyze developments in HDGC research. Emerging or underutilized methodologies and technologies such as thermal sensing, digital soil mapping, citizen science, UASs, cloud computing, mobile mapping, or the use of “humans as sensors” will continue to enhance the relevance of HEI research in achieving sustainable development goals and driving the science of HDGC further.

Graphical Abstract

1. Introduction

Combined, the 1999 National Research Council (NRC) publication “Global Environmental Change: Understanding the Human Dimensions” [1] that followed closely on the heels of the 1998 NRC “People and Pixels: Linking Remote Sensing and Social Science” [2] publication, effectively launched a golden era in the integration of remote sensing technologies into the study of human–environment interactions under the broader umbrella of human dimensions of global change (HDGC) research. Over the last two decades since these landmark publications [1,2], significant progress has been made in understanding the complex socio-political, economic, cultural and technological driving forces behind global change through the lens of studies focused on qualifying and quantifying human–environment interactions (HEI) at a multitude of spatial and temporal scales. HEI research, typically considered a sub-branch of geography, concerns itself with describing, quantifying, modeling, and disentangling the interactions and feedbacks between human social systems and the environment or ecosystems in which they reside. With the heightened understanding of the coupled nature of human and natural systems and of the significant contributions humans have made to changes in the hydrologic, ecologic, geomorphologic, biologic, biogeochemical, and climatic cycles [3], increased effort has subsequently been given to integrating HEI studies and rapidly evolving remote sensing technologies predicated on this critical link between humans and the Earth systems they depend on for their livelihoods and well-bring. However, despite concerted efforts at integrating and better measuring the feedbacks and links between humans and their environments, there is still considerable progress to be made in connecting people to pixels. In this review article, we aim to systematically survey the HEI literature that advances the research on human dimensions of global change in order to ascertain past trends, future directions, and emerging research opportunities.
Remote sensing had been crucial to furthering scientific understanding of Earth’s land and water systems since the rapid advancement of satellite technology and digital image processing that occurred from the 1960′s to 1970′s. By the 1990′s, the development of global remote sensing systems (such as NASA’s Landsat series that was launched beginning in 1972 or Terra-1 that was launched in 1998) allowed for routine monitoring of changes in Earth’s environments and ecosystems, with studies largely focused in the Earth science disciplines. The intrinsic complexity and dynamic nature of Earth systems has historically made those systems difficult to study, especially over large spatial extents. Remotely sensed data from airplane, satellite, or recently, unmanned aerial systems (UASs), when collected repeatedly and systematically, are useful in characterizing landscape gradients or environmental changes over time by providing quantifiable proxies and biophysical measures of rates of changes in ecosystem functioning and structure. Remote sensing, or remote sensing coupled with geospatial technology such as geographic information systems (GIS), spatial analysis and modeling have been widely employed in diverse types of global change studies [3,4,5,6,7,8,9]. An area of research that has historically been at the forefront of quantifying various components of global environmental change through the use of remote sensing and geospatial modeling has been land use and land cover change (LUCC) geography. In LUCC research, the integration of human and social data initially as contextual, trend and pattern explanatory information and in more complex ways subsequently was a necessity from the outset. Hence, when surveying HEI research and its relationship to remote sensing applications, LUCC research emerges as a primary field of integration. Recent technological and computational advances make leveraging ‘big’ remotely sensed collected data with ever-increasing volumes, types and velocities possible in unprecedented ways, yet the collection, processing, and integration of data on human systems continues to lag behind.
The incorporation of human activities and the social sciences into human dimensions of global change studies has often proved to be a challenge primarily due to temporal and spatial inconsistencies between social, remotely sensed, and physical datasets [3], with questions arising over the proper protocols for linking social science data with remotely sensed data in HEI studies [10]. The incongruencies between spatial and temporal resolutions of collected data necessitates significant data formatting and interdisciplinary dialogue to identify attainable outcomes and produce meaningful analyses [3,11]. While the methods of comparing and analyzing such disparate datasets are unique to each particular study and its objectives, there are commonalities between the datasets, techniques and proxies employed by remote sensing practitioners in HEI studies working at the interface of human and environmental systems dynamics globally.
Regardless of the level of detail or technical complexity of remote sensing methods employed in an analysis, any study that utilizes passive or active satellite or airborne imagery, or other method of remotely detecting information about a location or phenomenon ultimately employs remote sensing to some degree. Image pre-processing tasks are the common first steps in most remote sensing workflows, and while most pre-processing tasks rarely warrant much discussion in remote sensing journals, socio-ecological researchers increasingly rely upon some of these fundamental remote sensing workflows to produce spatially explicit data [12]. In interdisciplinary HEI research, it is common for remote sensing analysis to stop at the pre-processing steps, as imagery is often used only for support and validation, such as to verify the geographic accuracy of other data [13]. Many studies employ complex assessments of land use and land cover change (LUCC) and its impacts on water, biodiversity, land processes, or climate due to the important role of LUCC on socio-ecologic and socio-economic systems and associated tradeoffs with sustainability, food security, biodiversity, and human and environmental vulnerability to global change [3,14]. Vegetation productivity indices, such as the Normalized Difference Vegetation Index (NDVI), remain some of the most commonly employed remote sensing proxies that pertain to ecosystem health and land productivity in HEI studies [15,16].
The accuracy of LUCC or vegetation dynamics remote sensing analyses as widely-utilized proxies for ecosystem health and productivity, and the credibility of data interpretation largely depends on the quality and detail of land use and other contextual information included or needed in a study and may limit the conclusions that can be obtained. Human land use information is derived from a variety of sources and methods that range in their level of detail, reliability, and level of community or stakeholder engagement. The methods used to derive LUCC data in a study will be partially dependent on the researchers’ scientific background, i.e., social scientists and remote sensing scientists may both be using remote sensing data, but the complexity of the remote sensing analyses will vary between the two studies. For example, a more quantitatively complex remote sensing study aimed at analyzing land cover patterns and their associated land uses may rely on land use maps provided by a government agency or non-government organization (NGO) [17]. By contrast, a study undertaken by social scientists may use a LUCC remote sensing analysis to validate an in-depth analysis of in-situ land use data and local perceptions of environmental change obtained from community interviews [13,18,19,20]. Integrated models, such as agent-based models (ABM), more accurately represents complex socio-environmental systems because they begin with the smallest component of the system (i.e., humans) and allow agents to make autonomous decisions and interact with each other within a set of simple rules informed by observed social data (such as surveys or focus groups). Integrative modeling recognizes the role of individual decision-makers in effecting change on their resources and technologies through their decision-making process, and their ability to respond to cues from their environments and social, cultural, and economic contexts [21] and is frequently employed in remote sensing-HEI studies.
Given the increase in the role of remote sensing-HEI studies in global social and environmental decision-making, numerous advances to technology and methodology in the field, and the growing interdisciplinary nature of these studies in HDGC, we conducted a review of the last two decades of peer-reviewed literature to ascertain what the trends, direction, and developments in the field have been. Our primary objects were to: (1) conduct a bibliometric assessment of the literature based on search terms common to the field and analyze the results, and (2) review the body of literature to look at emerging themes, remaining challenges in integration, and opportunities in remote sensing of HEI, while assessing which critical research questions have yet to be answered. While our literature search was not exhaustive, we established a methodological search and analysis to elucidate general trends in the publication of remote sensing of HEI literature that pertains to HDGC. In our discussion, we assess the degree to which human systems and social data have been integrated into these studies and identify opportunities for further, much needed integration.

2. Literature Search Strategy

We conducted a search of the literature from 1999 (the year following the publication of People and Pixels [2]) until the end of 2018 using Web of Science. The key terms used in the search strategy included broad categories such as “human environment interactions”, “coupled natural human systems”, “global environmental change”, “people and pixels”, “population vulnerability”, and “socio-ecologic systems”. These broad categories were further narrowed to those that applied a remote sensing methodology by the terms “remote sensing” and “satellite.” The category of “global environmental change” was further restricted by applying the term “human” in order to eliminate a large number of articles that did not focus on human components or human dimensions of environmental change. We also found it necessary to restrict the “coupled natural human systems” category by limiting the search to LUCC studies, due to numerous publications that did not use remote sensing datasets, whether primary or derived, in the methodology. “Coupled natural human systems” combined with “remote sensing” or “satellite” did not return any results. We also tested if adding specific satellites that are highly utilized in the HEI field, such as Landsat, MODIS or Shuttle Radar Topography Mission (SRTM) into the search criteria did not add a significant number of publications (ten or less total). We chose not to include specific satellites or other collection platforms because including some satellites but not others could introduce bias into the search with results that leaned more towards publications that used those specific satellites.
After some initial exploratory searches to identify the most relevant keyword combinations, we formed one complete search phrase using Boolean operators (S1). Publications were identified in the search if one of the keywords appeared in the publication title, abstract, or author-identified keywords. We then gathered information from the bibliographies of relevant publications including title, author name and affiliation, year published, type of publication, and source (i.e., journal or book name). A complete reference list of literature used in our analysis is included in S2.
Using the corpus obtained from the Web of Science search, we assessed criteria including type of publication, author-identified research area, year of publication, journal title, and geographic distribution of authorship to support our first objective. We restricted our assessment of journal titles to (1) those previously identified as publication type “journal article,” and (2) those journals that published a minimum of two articles. When addressing geographic distribution of authorship, we examined author-designated affiliations within the publication itself. Many authors indicated affiliations with more than one country, thus the number of affiliations is higher than the total level of authorship. Additionally, we reviewed the abstract and papers themselves to identify trends in the spatial scale at which studies were undertaken, the countries that were studied, the type of remote sensing platform (satellite, UAV, etc.) utilized, and the type of sensor used (radar, multispectral, etc.) to elucidate emerging themes, challenges, and opportunities in remote sensing of HEI to support our second objective.

3. Bibliometric Analysis

Based on our search of Web of Science, a total of 101 unique publications were returned and included in our bibliometric assessment (S1). These include multiple types of publications including journal articles (77), proceedings papers (13), literature reviews (5), book chapters (3), as well as book reviews (2) and one editorial (1). The journal articles were published across 73 unique journals, with 55 journals publishing only one article and 18 journals publishing two or more articles (Table 1). The journal titles span a variety of disciplines including remote sensing, ecology, environmental sciences, geography, and geology. The MDPI open source journal Remote Sensing published the highest relative number of publications that address the integration of remote sensing and social data in support of HEI research over the twenty years surveyed.
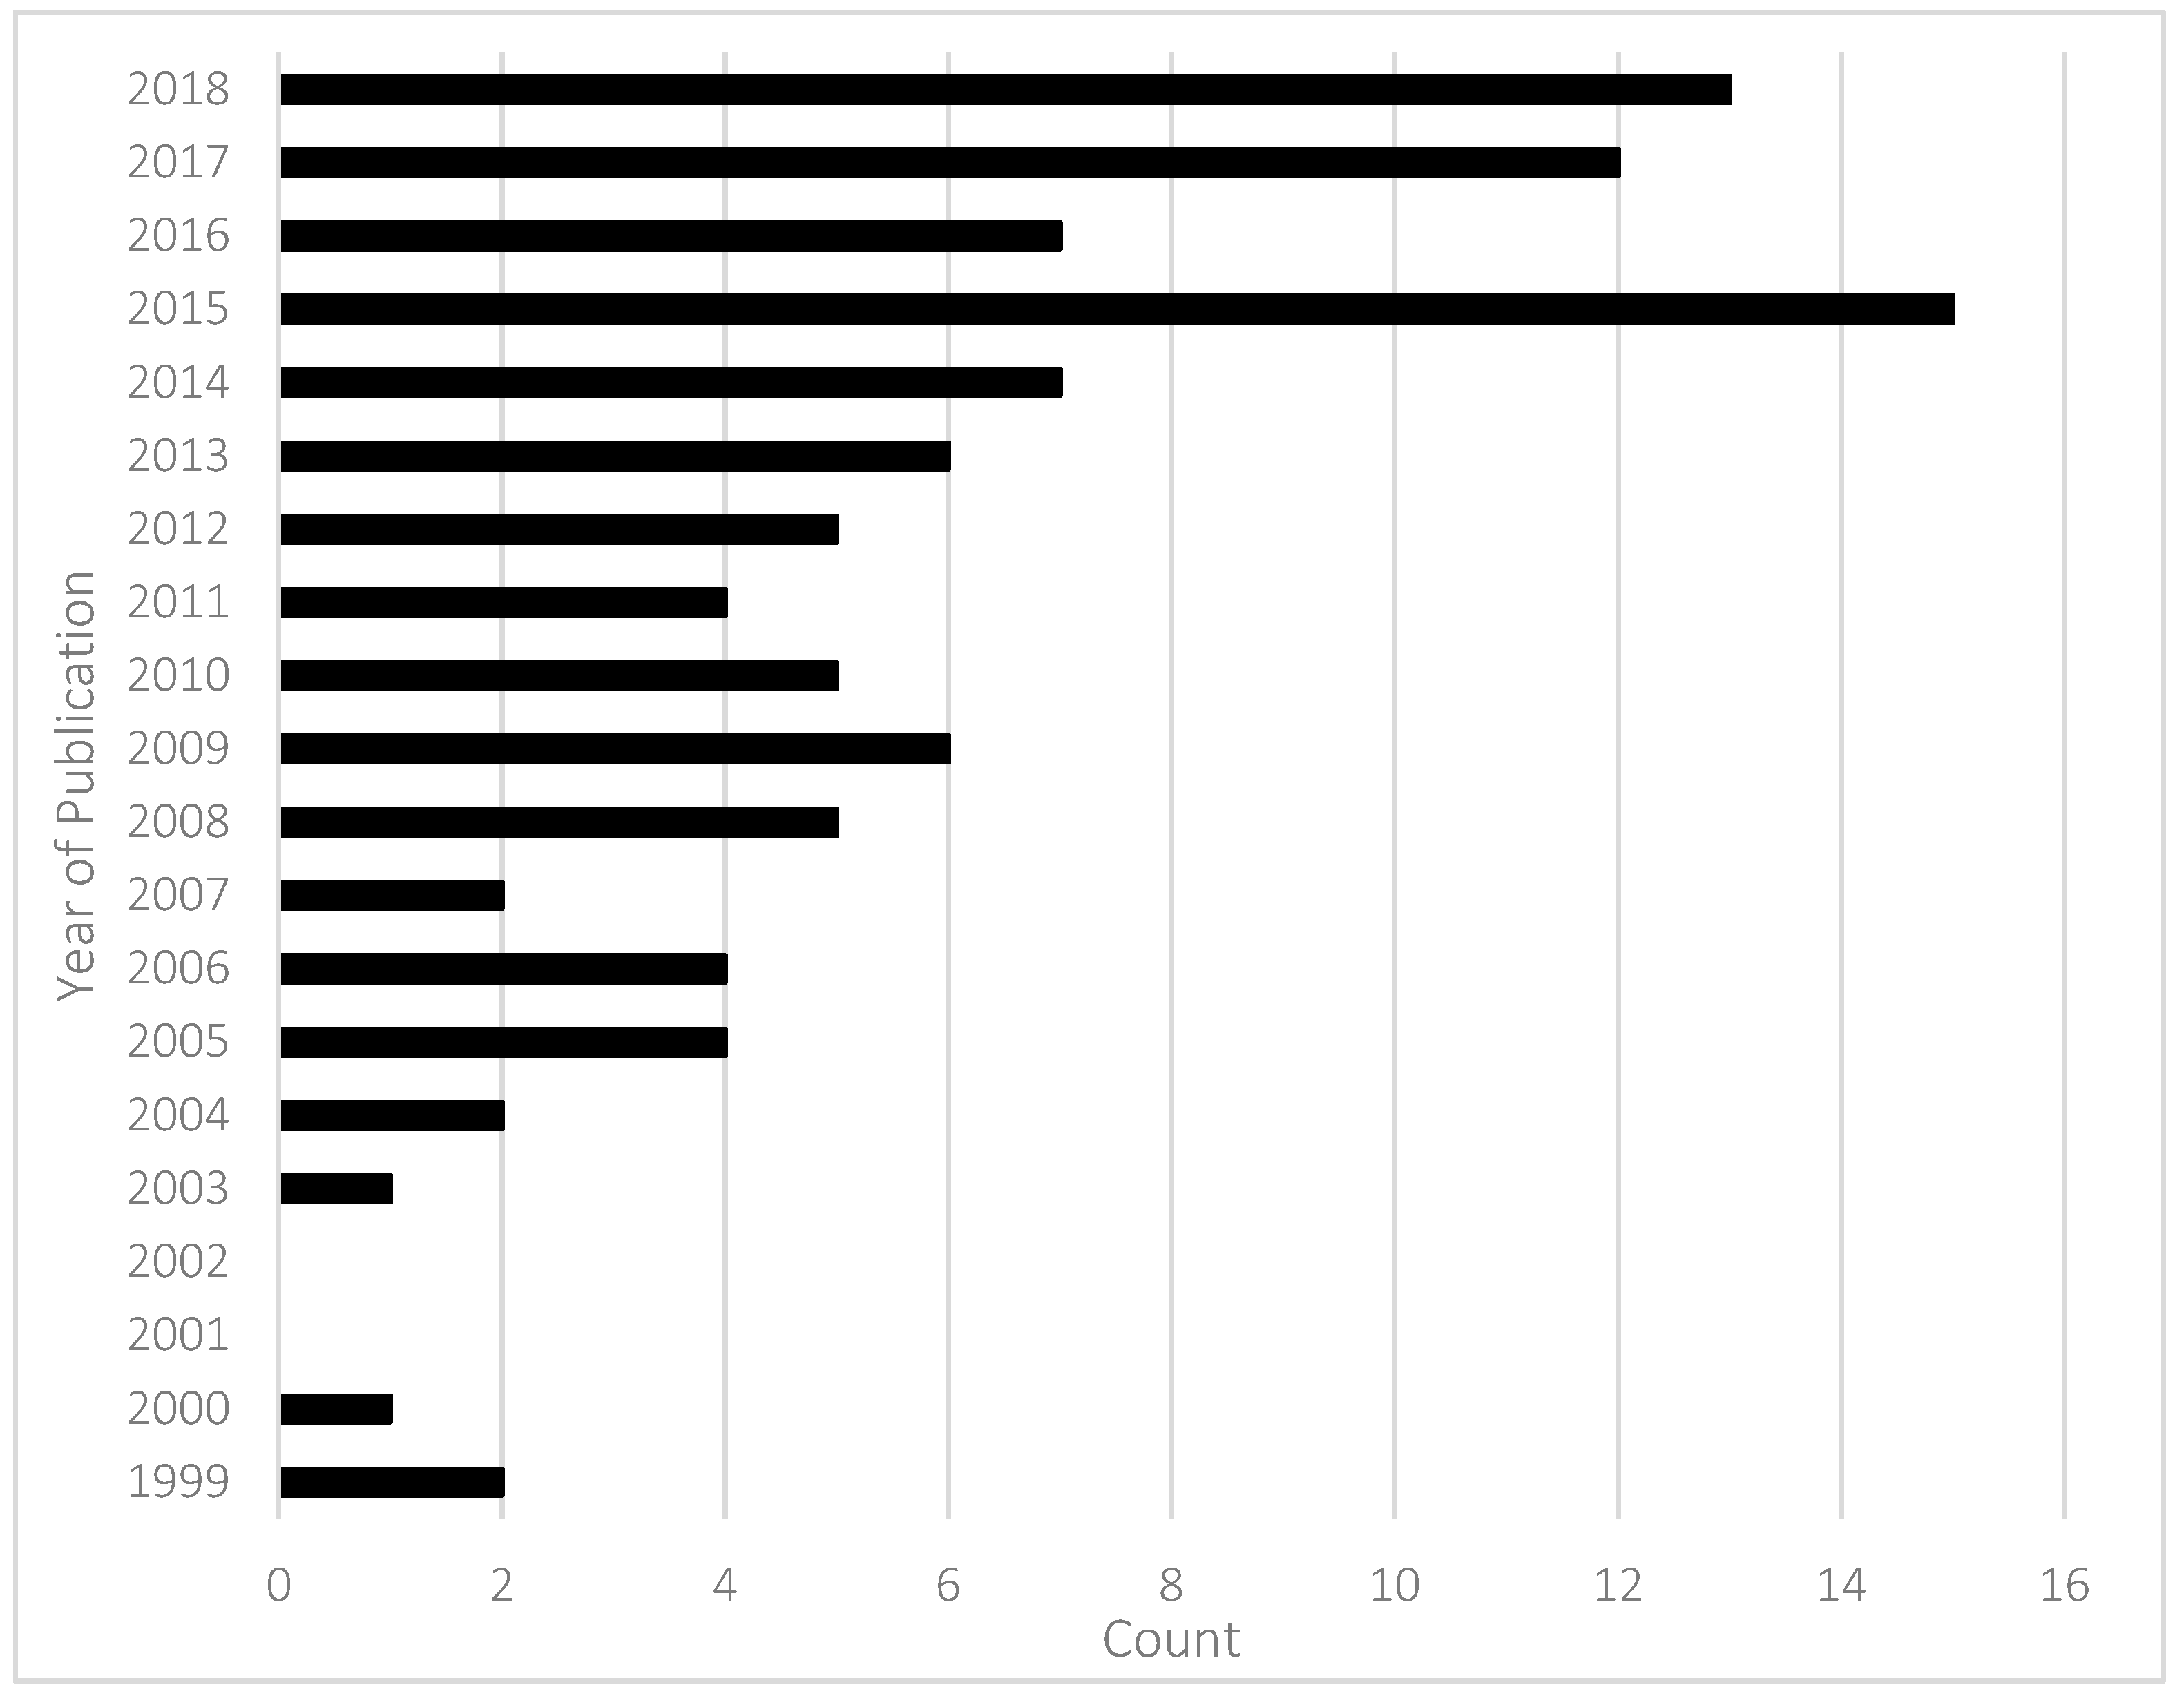
Temporally, there was an overall increase in the rate of publication in remote sensing-HEI studies from 1999 to 2018 (Figure 1) based on our results. The first six years (1999 to 2004) show only 6 total publications (6%), with the following year (2005) returning four publications (4%). Almost half of all total publications were published in just a four-year timespan (from 2015 to 2018). Years 2015 and 2018 show the highest number of publications at 15 and 13, respectively (28%), indicating a steadily growing interest from researchers (and possibly expanded funding opportunities that explicitly reward interdisciplinary and integrative studies) in undertaking interdisciplinary work that bridges remote sensing and HEI applications. The significantly increasing rate of publication of remote sensing of HEI research over the last four years may also attest to growing methodological, technological and computational advances that are able to propel this type of work forward at faster rates.
Thematically, the publications included in our search corpus spanned a wide range of research areas, with most identified by authors through inclusion in keywords as having to do with environmental science and ecology, remote sensing, geology, geography, engineering, or imaging technology (Table 2). Multiple studies focused on applications of remote sensing for past HEI (i.e., archaeology and anthropology categories) rather than modern HEI (Table 2). We chose not to remove these studies as the methodologies are potentially transferable to, employ similar methodologies as, or have implications for, models and applications pertinent to research on coupled populations and environments. Interestingly, the thematic area of ‘remote sensing’ is the second most prevalent which may indicate more overall interest and need from the remote sensing community to integrate social and human systems data in analyses. It is possible that given that much of the remote sensing community consists of broadly trained geographers and environmental scientists, integration of social data into HEI studies that utilize remote sensing is facilitated more than in the opposite direction.
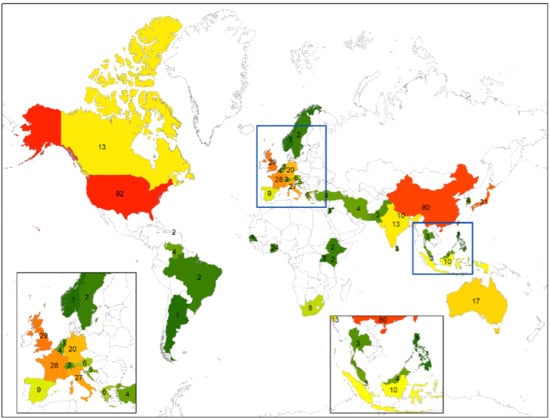
Geographically, most of the authors listed on the publications examined here are affiliated with countries in Europe, the United States, China, the United Kingdom, or Australia (Figure 2). Many times, authors indicated multiple country affiliations. Very few authors were affiliated with countries in Central and South America, Eastern Europe, the Middle East, or Africa. Overall, the world region with the most affiliations was Asia with 169 affiliations, followed by Europe (including Turkey) at 147, and North America (including Puerto Rico) with 107. There was a total of 63 publications where all authors were associated with only one country, 23 publications with authors associated with two countries, 11 publications having authors associated with three countries, four publications having authors associated with four countries, three publications having countries associated with five countries, and one publication having author affiliations in 13 countries.
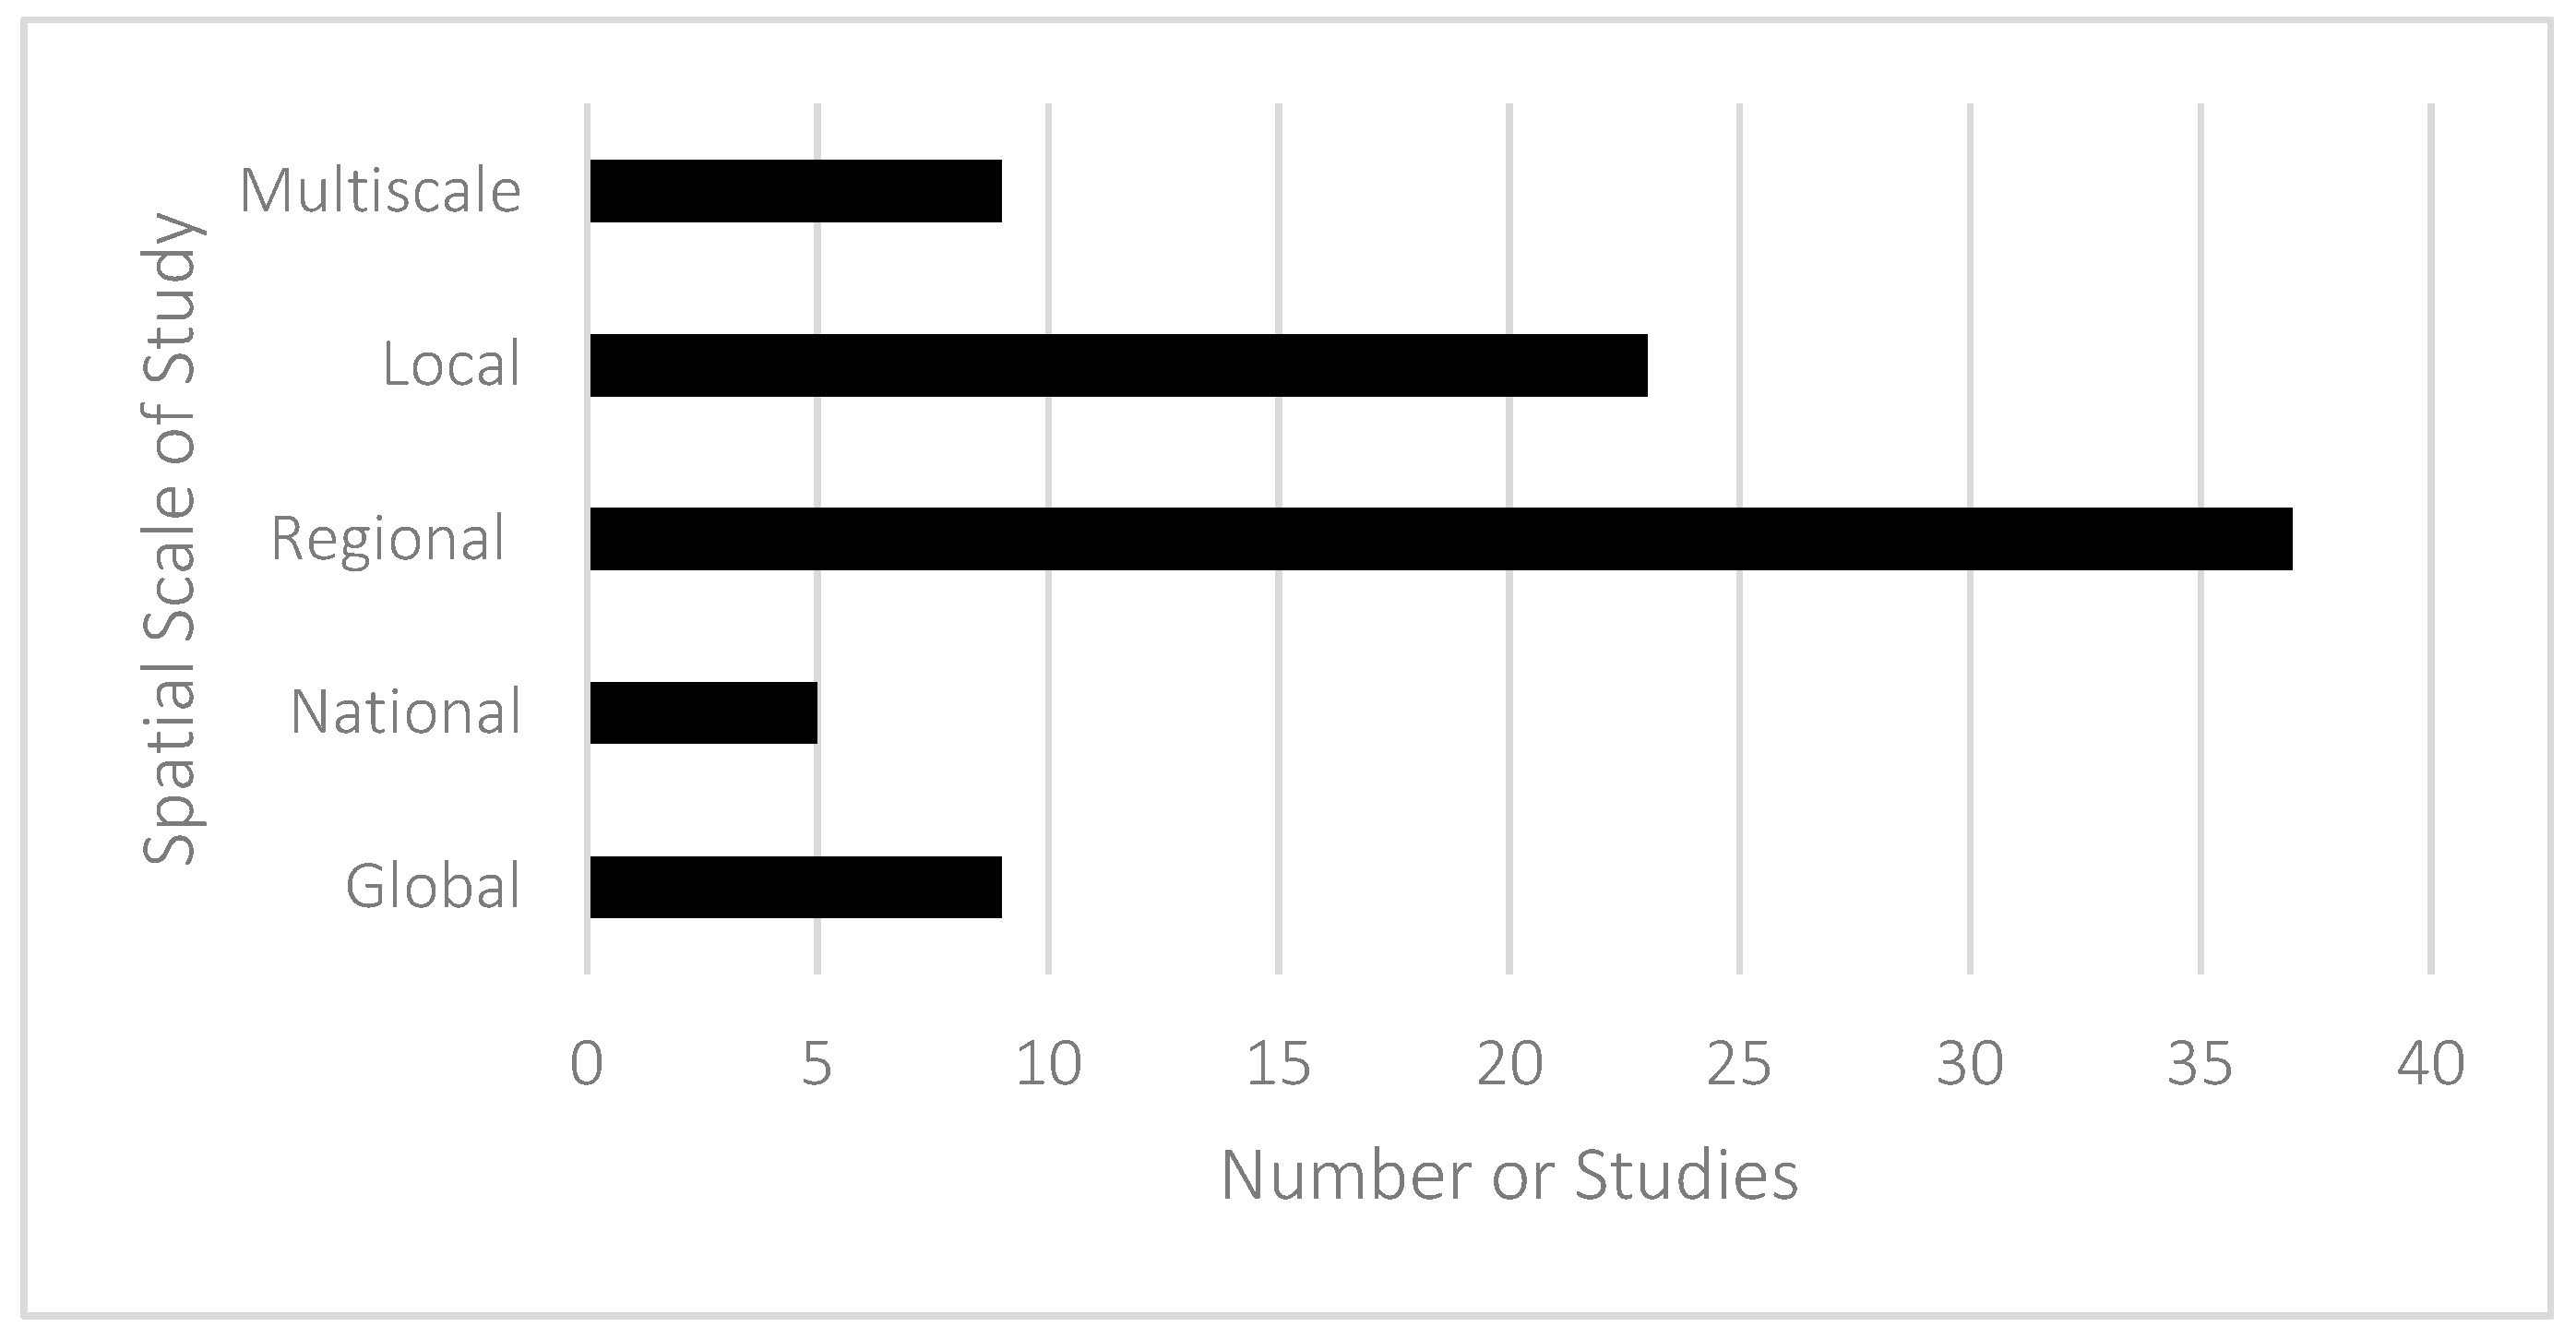
In terms of the spatial extent of the areas studied based on our search, most studies that identified a specific study area were either local or regional (Figure 3), with much fewer studies attempting to integrate at regional or national scales of analysis. There were nine studies conducted on a global level and five on a national level (Figure 3). Additionally, five studies were multi-level assessments, including local-national, local-regional, and regional-continental. These findings indirectly illustrate the relative ease of obtaining and integrating human and remote sensing data at sub-national (regional) and local scales compared to national or multi-scale assessments that require more comprehensive efforts at such integration.
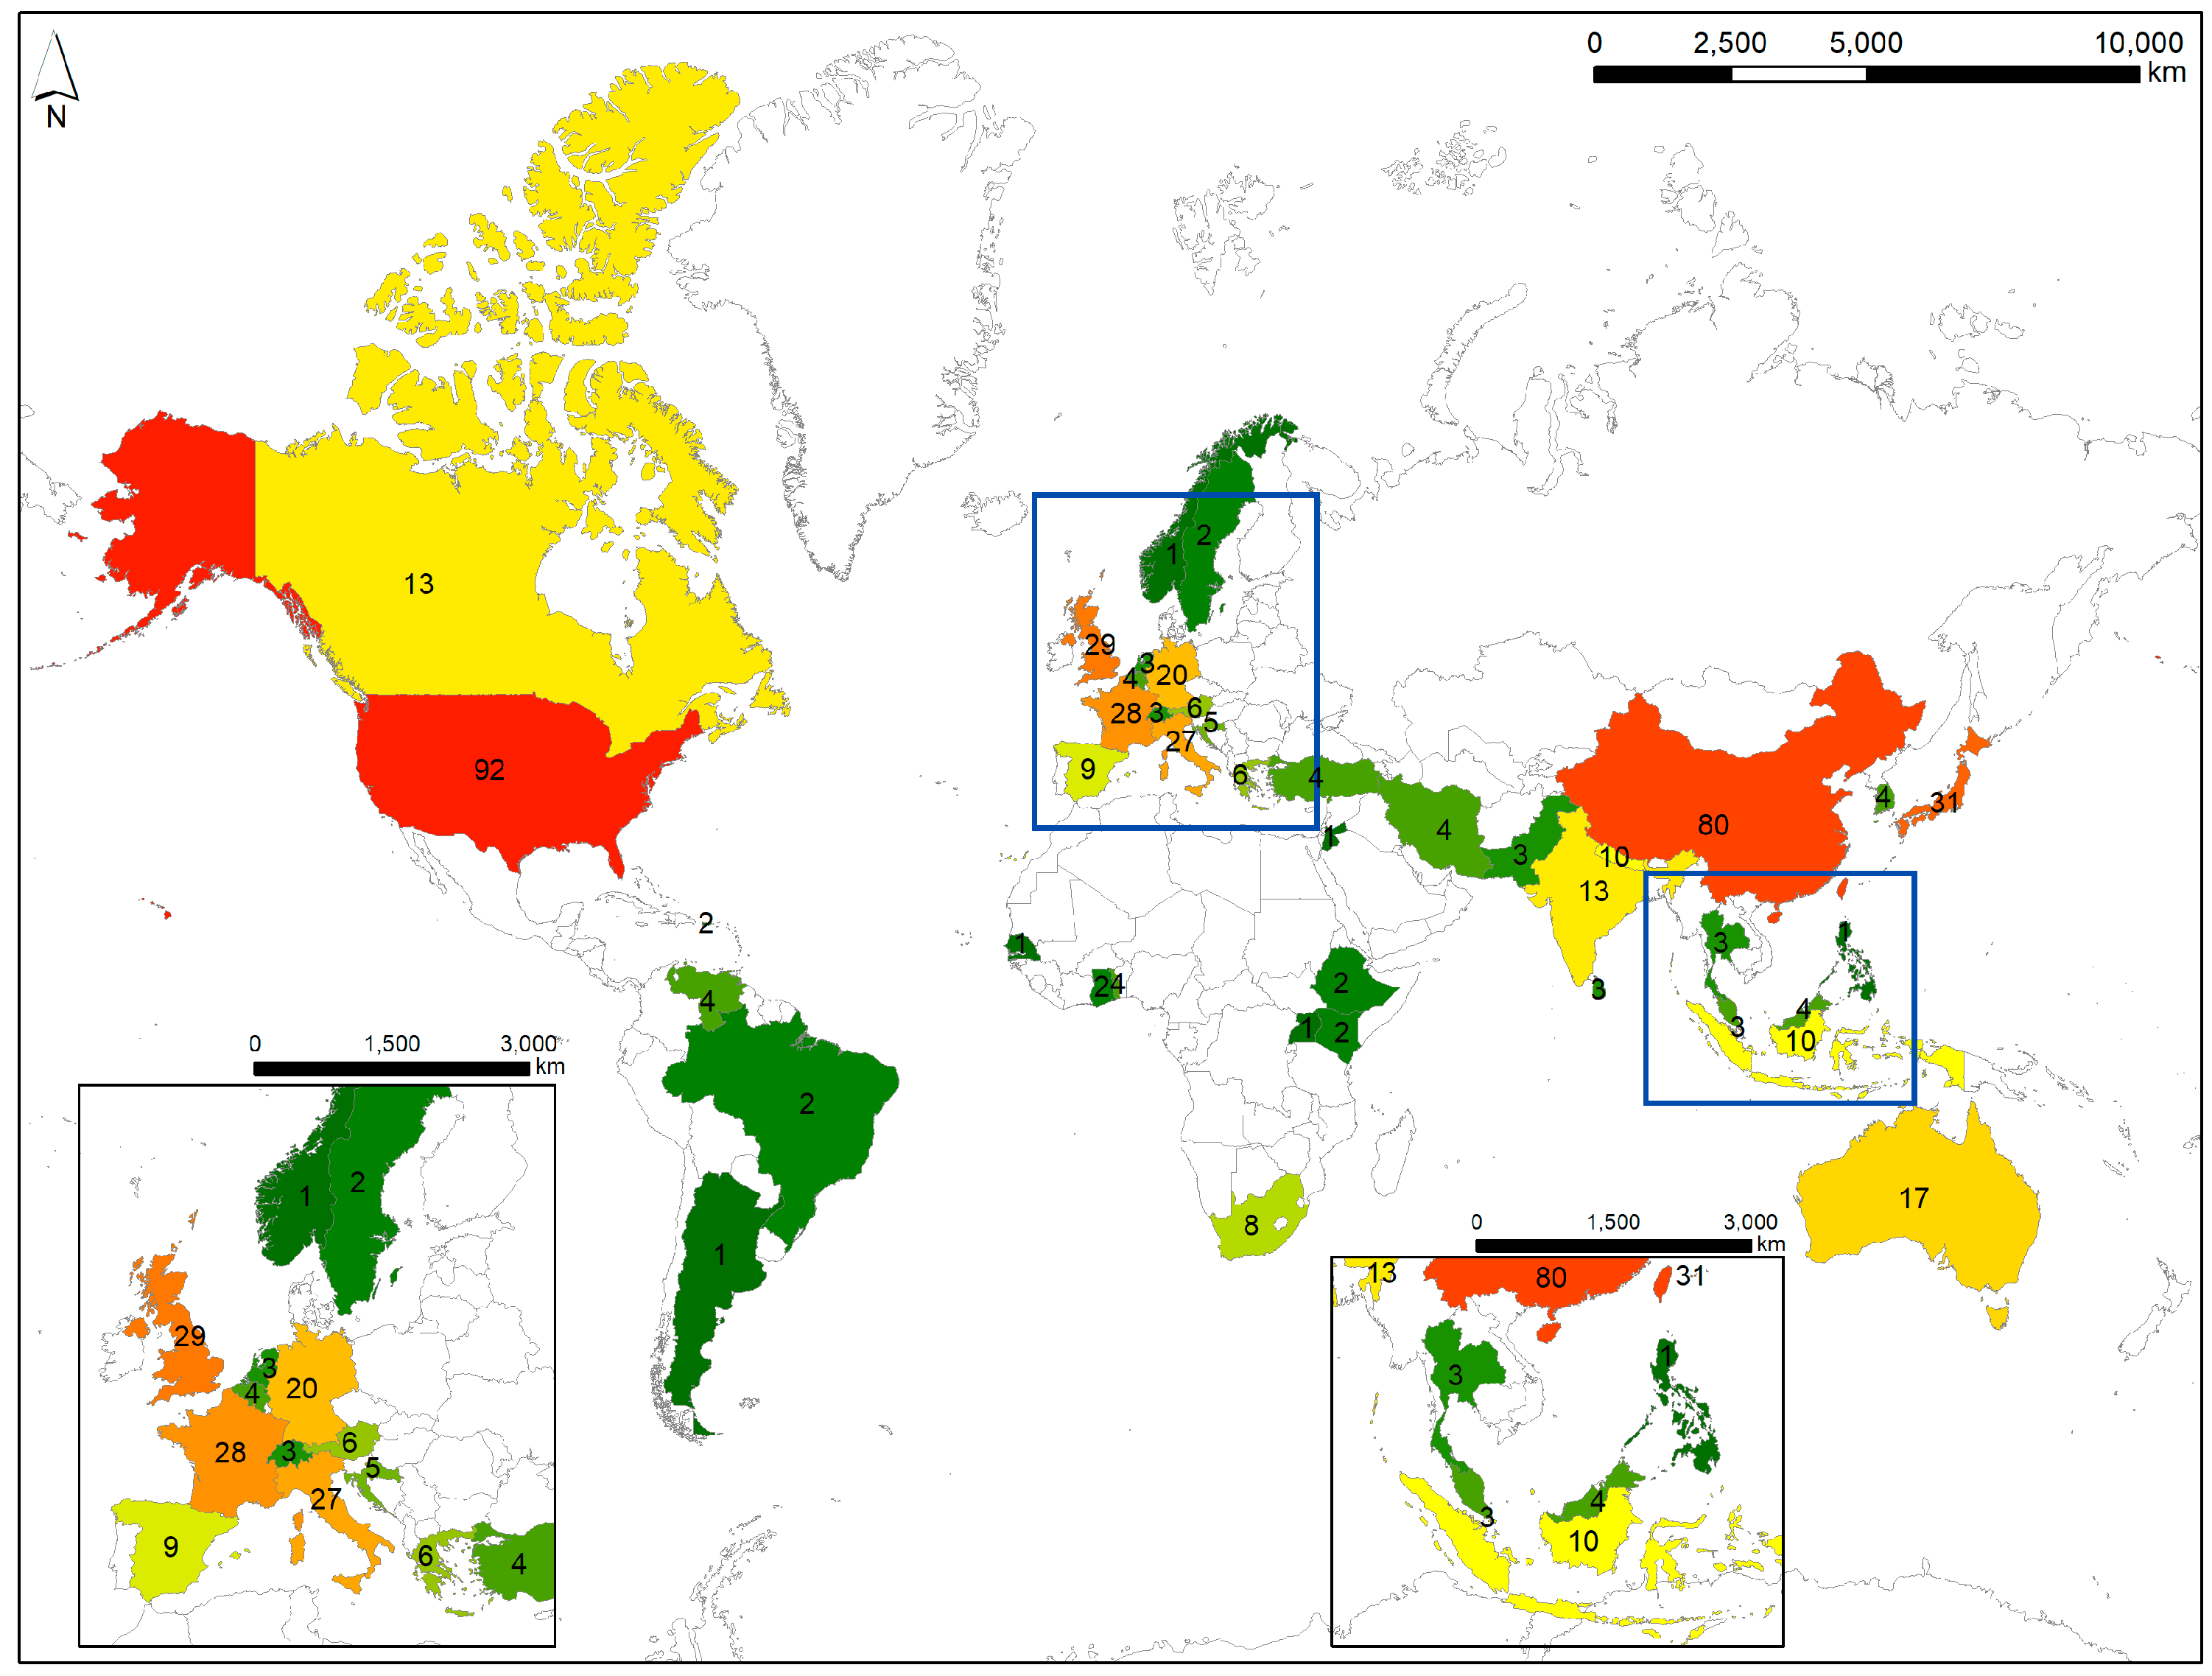
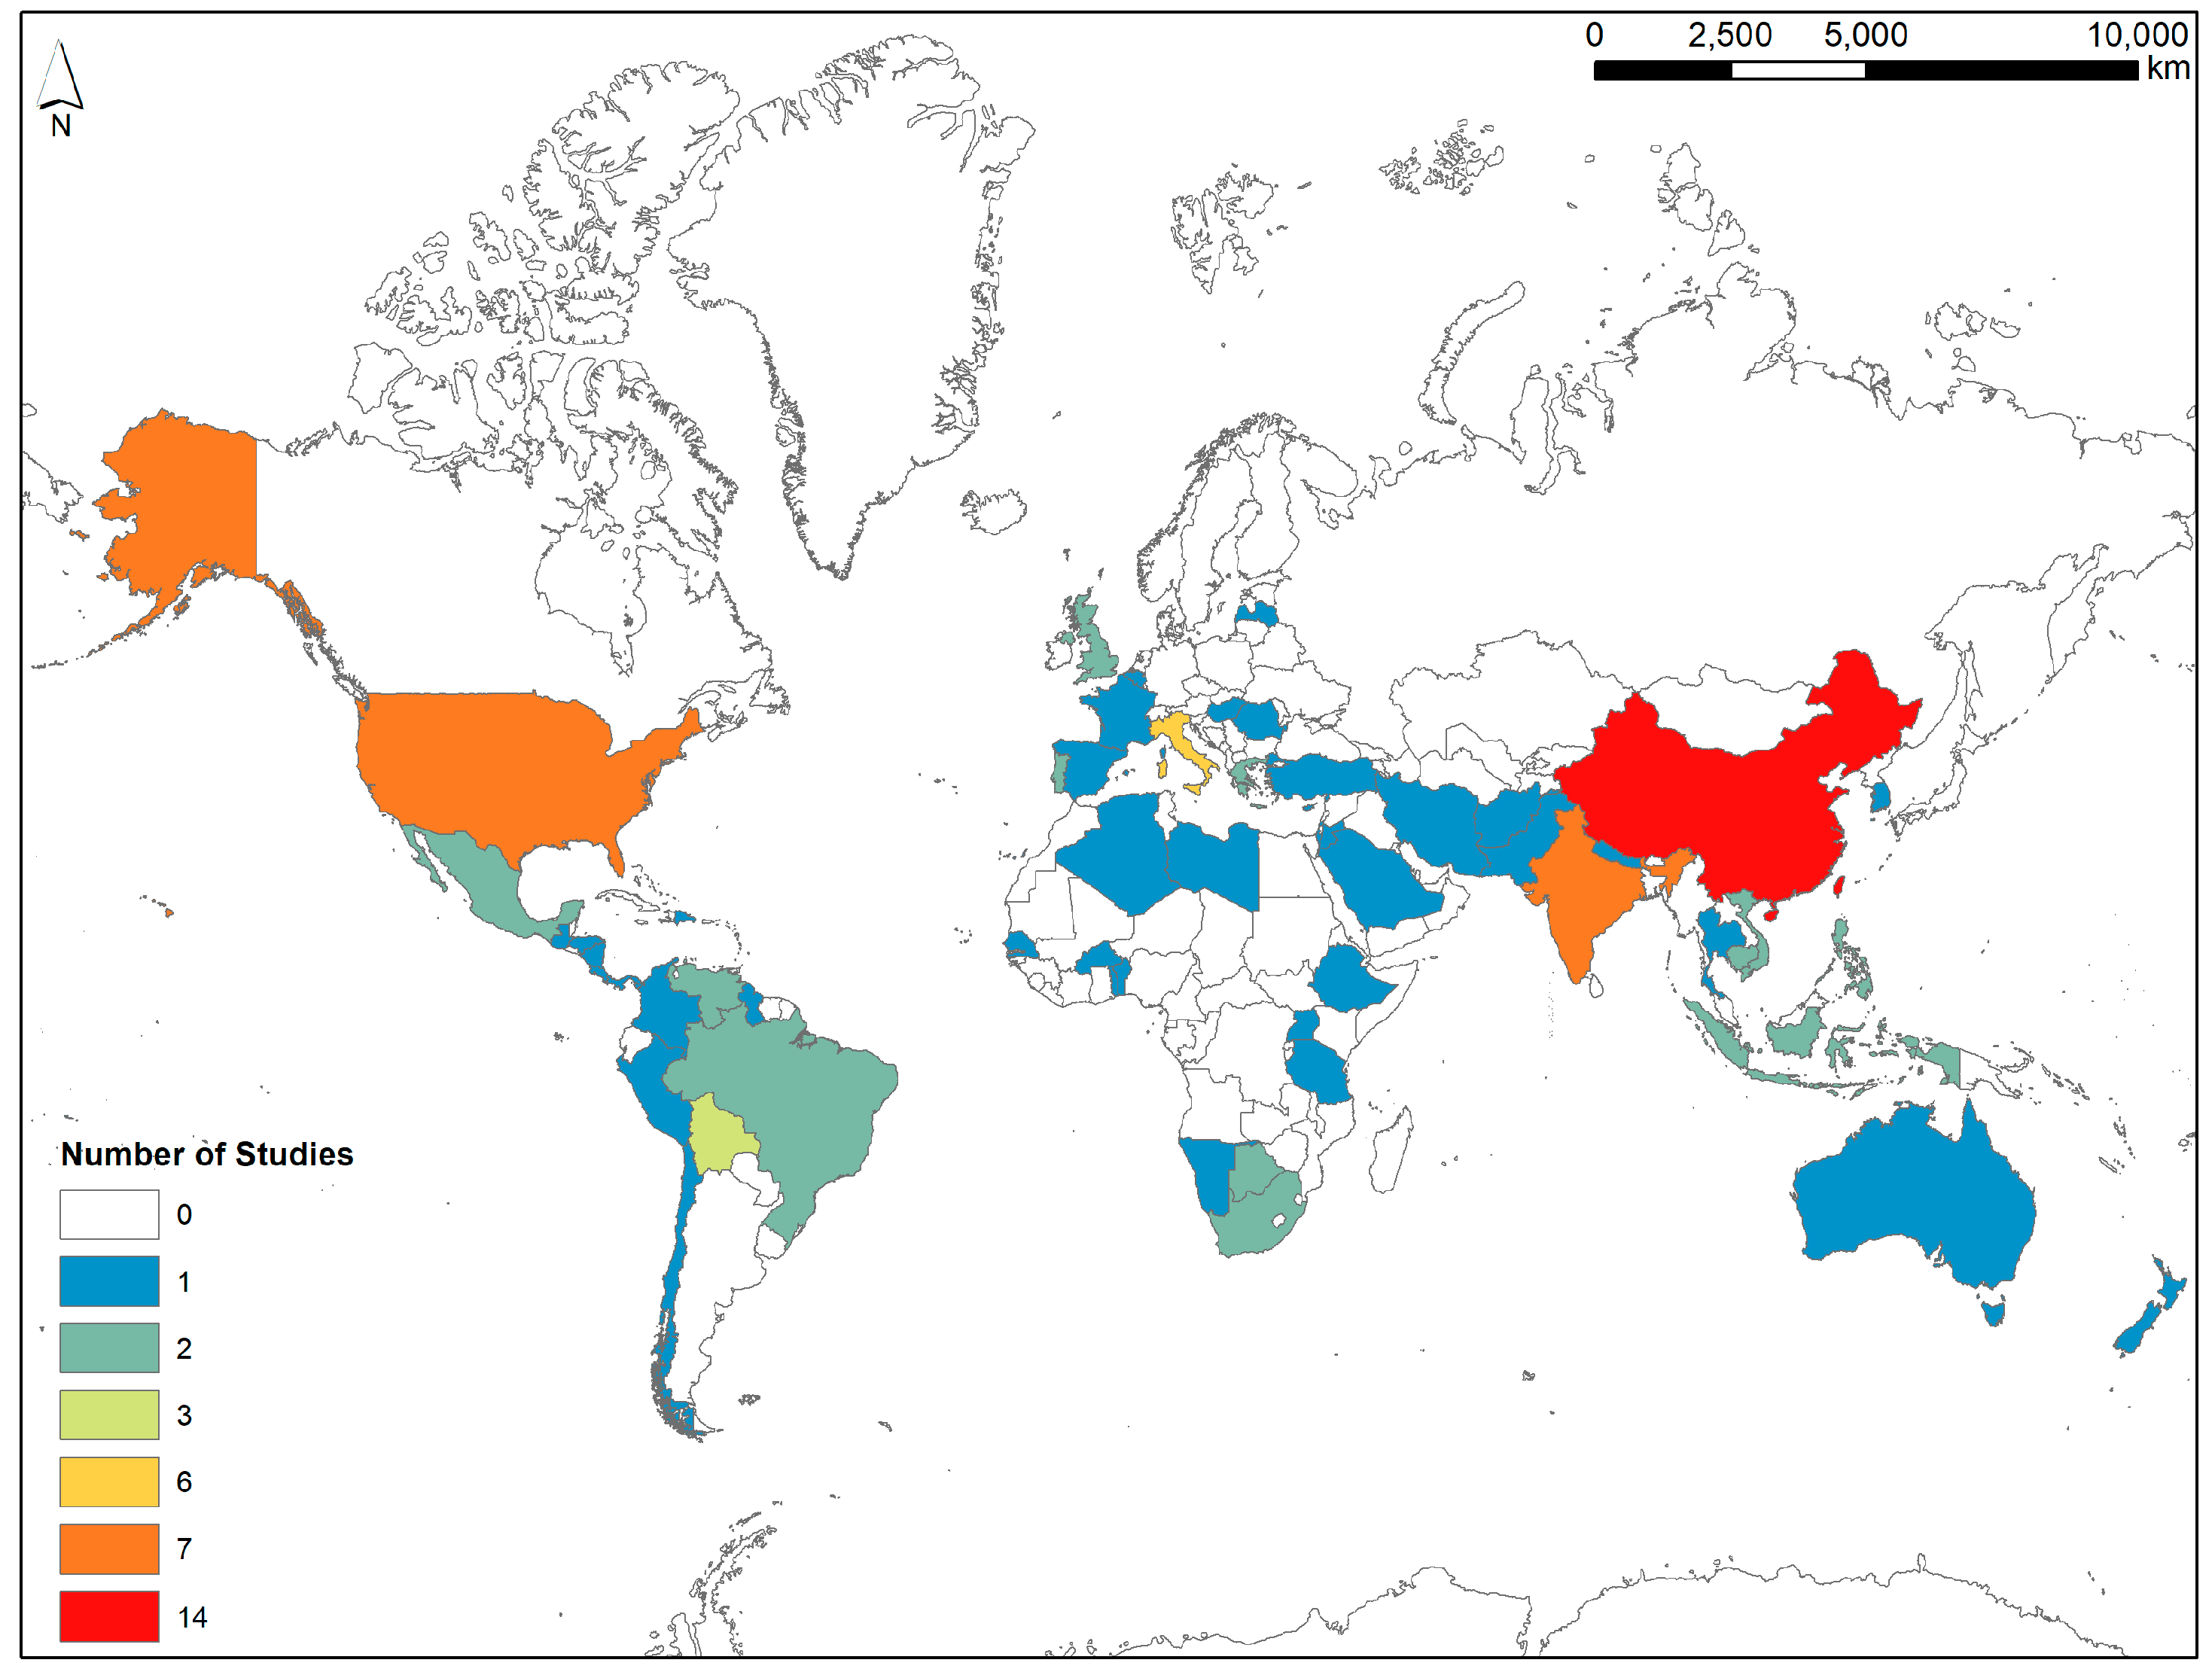
We are also interested in understanding where, spatially-speaking, most HEI research has been conducted over the last two decades, so we have mapped the countries in which the location of study was defined by country, excluding global assessments and one regional-continental assessment (Figure 4). Southeast Asia (China and India) and the United States were home to most HEI research reported upon in a publication. Interestingly, even though there were relatively few authors affiliated with countries in South America and Africa (Figure 2), a larger number of studies focused on these continents were published on. Overall, there are few studies that have been conducted in the Arctic regions including Canada, Scandinavia, and Russia. Other world regions that are severely underrepresented in HEI studies include Eastern Europe, the Middle East, and many parts of Africa (Figure 4).
Technically, our assessment of the various remote sensing platforms utilized show that satellite imagery or derived products (such as land cover or land use maps derived from multispectral data or elevation models derived from radar data) are the most highly utilized remotely sensed derived products, though other sources such as aerial platforms or UAVs may be used in conjunction (Table 3). Most often studies will use only satellite imagery (70% of the studies surveyed in this work), but when analyzing the corpus for the number of platforms used, those that have utilized two kinds of remote sensing products most often combine aerial imagery with satellite imagery [10,22,23,24,25,26,27,28,29,30,31,32], though two studies combine satellite imagery with aerial LiDAR. For example, Ossola & Hopton [33] discuss the use of multi-temporal LiDAR to quantify urban tree loss; Vermeulen et al. [34] incorporate a LiDAR DEM in a geoarcheological assessment, Ning et al. [35] combined satellite and UAV imagery to assess land use change in China, Vermeulen et al. [34] utilized a combination of satellite, aerial, and UAV imagery, as well as imagery obtained with a helikite. McCoy [36] discusses the use of satellite imagery in conjunction with airborne and terrestrial LiDAR to document archeological sites in Polynesia, pointing to the overall growth in data fusion between electro-optical or passive and active remote sensing platforms to extract variables that can be utilized in more complex modeling exercises.
For the 83 studies which utilized satellite imagery (Table 3), the majority used more than one source (51 studies, Table 4) but some used as many at ten. Abou Karaki et al. [22] used a total of ten different sources of satellite data to analyze subsidence near the Dead Sea, while Keramitsoglou et al. [37] analyzed eight satellite-derived products for characterizing the urban thermal environment. In Table 5 we present a detailed assessment of the specific satellite platform/sensor combinations utilized by the studies returned in our bibliometric search. Expectedly, for passive remote sensing platforms, multispectral sources of data from Landsat TM, ETM+ and OLI lead the way with most utilization, followed by the ASTER, MODIS Terra and Aqua platforms, and AVHRR, while for active platforms, radar data obtained from the STRM mission is the most widely utilized type. EO-1 Hperion is currently the only source of hyperspectral data that has been leveraged for HEI applications, indicating there still exist significant limiting factors and barriers to incorporating hyperspectral data into integrative studies in the HDGC arena. Finally, an emerging trend appears to be the inclusion of Google Earth data in HEI studies and this may be the result of the relative ease and readiness for use of the high spatial resolution base and historic imagery present in Google Earth. Increasingly, studies report utilizing Google Earth Engine to perform basic or more advanced computations on deep stacks of imagery without the need to locally download, store and process data and this will likely continue to expedite the use of remote sensing datasets in more integrative HEI applications.
Similarly to our exploration of datasets used on the remote sensing side of HEI research, a survey of our complete bibliometric corpus revealed household survey/interview data to be the most widely utilized type of socio-economic data in HEI studies, followed by census, population and individual interview data. In Table 6 we present the specific studies which have utilized some form of socio-economic data, including census, population, interview or survey, participatory mapping, or other types. Only 27 total studies specifically used human social or economic data in conjunction with remote sensing analyses of the total number of studies included in our analysis.

4. Current Directions and Emerging Trends in the Remote Sensing of HEI Research

The broad domain and scope of the studies that use remote sensing in HDGC-focused HEI research increases the difficulty of constructing a comprehensive, exhaustive search. Studies may use orthoimagery, land use maps, digital elevation models, or other products derived from satellite imagery but do not expressly use the term “remote sensing,” and are thus not returned in the search. Authors can use the most recently relevant search terms to increase their chances of appearing in search returns and thus increase the exposure of their research. Additionally, we acknowledge that database bias is a factor that may have limited our search return [38,39], where conducting the same search across multiple databases (such as Scopus) and combining the results, could produce additional relevant publications.
Based on our search, the most common remote sensing data type or methodology employed in HEI studies focused on HDGC remains land use/land cover (LULC) assessment or LULC products. Seventy studies returned in our search utilized land use or land cover assessments in some capacity, whether it be the main focus of the study or as a component of the overall methodology. Change detection is a widely utilized methodology [10,32,35,40,41,42,43,44,45,46,47,48,49,50,51,52] along with assessing drivers of LUCC [10,26,41,48,53,54,55,56,57,58,59]. All studies which integrated social data (Table 6) also used some form of LULC data or assessment in their study to establish linkages between changes in land use or land cover and various socio-economic and human wellbeing outcomes. As discussed in the introduction, integrating LULC/C data into HEI research almost by definition requires inclusion of human or socio-economic data and our work quantitatively underscores that argument.
Global-scale studies using LULC data or LUCC assessment include those by Li et al. [60], Song [49]; Verburg et al. [61] and Honda [62,63,64,65,66]. Two studies were specifically concerned with the creation of global LULC products [49,60]. Song et al. [49] discuss the creation of a global vegetation product between 1982 and 2016 that represents the vegetation composition at the time of local peak growing season. Li et al. [60] describes a global LUCC product for 2010 to 2100 based on HEI at a spatial resolution capable of identifying spatially heterogeneous patterns at a global scale. Verburg et al. [61] derived the first global high spatial resolution datasets on market influence indicators. Overall, global level environmental change analysis tends to be biased towards the monitoring and quantification of biophysical processes, rather than that of socio-economic processes and dynamics, understandably so [61]. While various institutions and centers such as Columbia University’s Center for International Earth Science Information Network (CIESIN) Socioeconomic Data and Applications Center (SEDAC) are proactively focusing on leveraging national and regional socio-economic datasets into globally available products that extend beyond national boundaries, socio-economic data availability and standardization continue to remain a remarkable challenge. There is a significant opportunity in furthering the HEI and HDGC research field by creating consortia and networks that can more effectively compile and standardize existing census, survey, and other locally available socio-economic datasets into products with relevance beyond localized scales.
Studies that assess vegetation dynamics or deforestation commonly use proxies for vegetation health such as the Normalized Difference Vegetation Index (NDVI) [27,50,51,52,54,57,58,59,67,68,69,70,71,72] or Disturbance Index [47], or through overall LUCC assessment to quantify changes in aerial extents of forest [32,40,56,73,74]. NDVI has been incorporated into studies for a variety of purposes. For example, Herrmann et al. [67] used monthly average NDVI to assess satellite-observed greening trends alongside the local population’s perception of vegetation degradation and rehabilitation in the Sahel. Dai et al. [58] calculated time-series NDVI as part of an assessment of climatic and human land use drivers of change in flooding and erosion regimes in the upper Hangbu River system, China. Gaughan et al. [50] used NDVI to assess deforestation due to tourism near the Angkor temple complex in Cambodia. Nel et al. [47] used a DI to detect disturbances from informal wood harvesting; the DI is based not only on Greenness but also Wetness and Brightness and assumes that highly disturbed have a higher reflectance of Brightness and a lower reflectance of Greenness and Wetness than undisturbed forests. The prevalence of the NDVI index in HEI literature rests on its proven ability to serve as a reliable proxy of ecosystem health in geographic locations not subject to known oversaturation issues. Furthermore, despite imperfections of the index, the existence of the AVHRR NDVI timeseries spanning back to 1981 (the GIMMS products), however spatially coarse, allows for longitudinal assessments of vegetation productivity dynamics unlike what is feasible using any other remotely sensed index.
While NDVI is the most widely employed index based on our search, other indices have been utilized to study changes in vegetation or vegetation condition including SAVI (soil adjusted vegetation index), NDWI (normalized difference water index), MCARI (modified chlorophyll absorption in reflectance index), CAI (cellulose adsorption index), LWVI2 (leaf water vegetation index), NDLI (normalized difference lignin index), NDNI (normalized difference nitrogen index), and MSI (moisture stress index) and others. Nursamsi & Komala [72] used both NDVI and NDWI to assess the success of mangrove forest rehabilitation because the NDWI is sensitive to changes in the water content of canopies and can help enhance the presence of vegetation in remotely sensed imagery. Leitao et al. [27] used NDVI in combination with MCARI, LWVI2, CAI, NDLI, and NDNI to characterize vegetation condition and cover at the sub-pixel level. These indices are used to quantify chlorophyll, leaf water content, cellulose, lignin, and nitrogen, respectively [27]. Davies et al. [75] used NDVI and MSI to assess temporal changes in vegetation cover, vigor, and moisture stress. Galletti et al. [76] opted to use SAVI, an alternative to NDVI that reduces the effects of soil reflectance in sparsely vegetated landscapes, to assess moisture retention by agricultural terraces in Cyprus. Studies may include supplementary data such as climate and precipitation to provide an in-depth assessment of drivers of vegetation change and contextualize systems dynamics and linkages with human or socio-economic factors of change [57]. Vegetation change or deforestation studies tend to benefit from the inclusion of social data because of its utility in examining and providing proxies or quantifiable drivers associated with human activities or mobility. Moon & Farmer [56] incorporate census data in their analysis to determine drivers of deforestation near public lands, while Gaughan et al. [50] incorporated limited census and key informant interview data to determine drivers of deforestation related to tourism. Tan et al. [74] identified psychological impacts of deforestation on humans through published media including scientific publications and news media with an eye towards future land management and planning. Wimberly & Ohmann [32] examined the effects of human influence on abundance and patterns of forest habitats and determined that differences in management regimes on public vs. private land created different pathways for forest landscape change.
Furthermore, LUCC data can be used to assess disturbance patterns across multiple geographical scales along with providing the opportunity to integrate human and biophysical factors responsible for changes and variability. Zaccarelli et al. [71] developed a multiscale framework to assess spatial patterns in LUCC disturbances that could be applied to nested jurisdictional socio-ecological landscapes (e.g., region, province, country). Zurlini et al. [51,52] describes a multi-scale framework to identify short-term anthropogenic disturbances from satellite imagery. A national-scale study by Yan et al. [77] described the methodology used to create a land use intensity map of China and noted the lack of similar studies that exist in comparison to LUCC studies. Commonly, LUCC studies address specific LULC types including forests, protected areas, agriculture or commodity crops, or urban areas.
Multiple studies specifically address agricultural land uses including pasture [78] commodity crops [42,44,79] or smallholder agricultural encroachment on a protected area [46]. He et al. [78] evaluated uncertainties in pasture data from historical land use datasets in China and found that there existed large contrasts between global and Chinese datasets due to differences in how pasture and grassland were defined, land use practices, and the spatial reconstruction method used to create the dataset. Studies that assess commodity crops were focused on cropland expansion and/or forestry decline [42,44], or net changes to major cash and food crops [79]. Furumo & Aide [44] incorporated economic trade data into their analysis to determine drivers of change through understanding flow patterns of commodity crops. Incorporating socio-economic data with remote sensing to understand complex agricultural transitions and teleconnections can lead to the creation of effective decision support tools that can guide informed decisions for a transition to sustainable agriculture by allowing us to examine future scenarios and consequences on environmental and socio-economic systems.
At the local or regional levels, the inclusion of social survey data provides a more detailed understanding of drivers of vegetation degradation, deforestation, or LUCC that are linked to human components of the socio-ecologic system and are beneficial in the contexts of resource management and conservation. Studies including participatory research methods such as surveys or focus groups have led researchers to challenge the assumptions that would have been derived from analyses of satellite imagery alone [67]. Jahel et al. [53] integrated social surveys into a model that used past land change information to predict future vegetation clearances and inform development scenarios. Smit et al. [70] “reverse engineered” monitoring intervention thresholds for megaherbivore impacts on vegetation based on stakeholder opinion of desired amount canopy cover. Hermann et al. [67] assessed the spatial association between local perceptions of vegetation changes over time and remote sensing-derived trends to fill voids in historical data that would allow them to interpret those changes. Dessie & Kinlund [42] and Koglo et al. [79] used social survey to assess extent and drivers of commodity crop expansion. However, the majority of these studies are constrained spatially and scope-wise to case studies that are currently not leveraged appropriately to develop transferable methodologies in spatio-temporal domains.
One highly integrative method for the study of HEI using remote sensing and social data is agent-based modeling (ABM). ABMs assess mutual feedbacks between human decisions and ecosystem processes in the context of coupled natural-human systems. Castella et al. [25] used ABM to validate household survey and remote sensing data of land use systems under shifting cultivation. The model was able to explain diversity in current land use systems through analysis of the interactions between land tenure policies and land use dynamics. Acevedo et al. [80] incorporated concepts of human–nature connectedness including satisfaction of basic needs, psycho-cultural connectedness and regulation of use of natural resources in a flexible modeling framework that is adaptable to a specific study site. The purpose was to determine crucial stakeholder values that drive land use decisions and land cover change to inform sustainable decision-making and policy. Iwamura et al. [81] examined interactions between demographic growth, hunting, subsistence agriculture, land cover change, and animal population to understand the conditions for sustainable subsistence agriculture and hunting in indigenous communities. The utility of ABMs lies in their ability to analyze existing feedback loops within a socio-ecological context, as well as predict future consequences of altered dynamics or external inputs on the human–environment system while accounting, to different degrees, for human decision-making.
Studies focusing on urban land use and human–environment dynamics in urban systems were also common during the last two decades and addressed a range of topics including quantification of impervious areas [82], vegetation cover or dynamics [33,83,84], urbanization or urban growth trends [29,85], or the use of thermal imaging for urbanization effects on land surface temperature [37,69,86]. The research by Tagil et al. [87] was framed in an ecological context and used remote sensing in conjunction with other methods to understand urban landscape dynamics and urban ecosystem changes [72]. There were several common themes among urban studies, including the utility of integrating remote sensing, GIS, and socio-economic data for sustainable urban planning and development [29,87,88,89]. In terms of predicting future changes, time series analyses are more powerful than static snapshots. While socio-economic data such as census data can be very useful in understanding things such as population growth, social survey data may have limited utility in urban environments due largely in part to the difficulty in designing and implementing a social survey at such a large scale and the cost-prohibitive nature of such very large surveys.
The use of remote sensing for the study of natural hazards such as flooding/inundation [57,58], fire [26,57], or coastal processes [30] within a HDGC context is similarly growing and while generally a well-established field, this review does not directly integrate that body of literature. Dennis et al. [26] integrated multispectral and radar satellite data, GIS, participatory mapping, and additional social research to determine causes and impacts of vegetation fires, which emphasized the importance of site-specific studies within a larger regional context. Purkis et al. [30] assessed threats to coastline stability, including human modification and sea level rise. Abou Karaki et al. [22] incorporated visible (photographic and satellite) and radar imagery to monitor geomorphologic environmental degradation near the Dead Sea. The power of natural hazards studies in the context of HDGC lies in the ability to forecast future socio-ecologic or socio-economic risks, which requires an interdisciplinary study design through the incorporation of social or survey data.
Water resources and hydrogeomorphology studies also benefit from the inclusion of remote sensing data. Remote sensing has been used to assess groundwater resources including monitor geomorphological environmental degradation caused by groundwater subsidence [22], changes in ecosystem services linked to groundwater [75], or modern climate and human impacts on hydrogeological processes in fluvial systems [58]. Remote sensing data with improved resolution can provide surrogate indicators of change in groundwater potential and thus support policy and local action in groundwater management priorities [75] or preservation of at-risk assets [22]. Maleki et al. [90] highlighted the importance of including remote sensing in multi-criteria tools to support decision-making related to wetland restoration prioritization and incorporated the BDT (brightness degree temperature) index in their assessment. Additionally, analysis of population and household vulnerability in regions with variable flood dynamics utilize remote sensing in the analysis [91]. The use of social surveys and livelihood mapping by King et al. [91] demonstrated that regional and global processes have significant implications for household vulnerability in socio-ecologic systems; thus, the inclusion of social data in these types of analyses can enhance our ability to assess vulnerability and guide informed decision-making.
Another emerging field where remote sensing is increasingly utilized to better understand human–environment dynamics is landscape epidemiology. Our search returned only one such paper, which reviews the use of remote sensing to predict risk of human infection at multiple spatial and temporal scales [92]. Remote sensing and other geospatial technologies allow researchers to explore in detail the landscape patterns that influence the transmission dynamics of an infectious disease at different spatiotemporal scales. Remote sensing will grow in importance in landscape epidemiology in the future, and this type of methodology is an effective decision-making tool to identify at-risk populations or disease-prone areas [92].
Eleven studies returned in our search focus on the use of remote sensing to analyze past human environmental interactions or for studying archeological sites [23,24,28,36,93,94,95,96,97]. Some studies use remote sensing and other methods for past human occupation and landscape reconstruction in deserts [24,97], for determining historical land use dynamics [96], for identifying trends in past urban growth [23,34], settlement distribution and seasonal flooding [95], or differentiating modern vs. ancient agricultural terraces [76]. A series of studies by Lombardo et al. [28,93,94] used satellite imagery to identify paleo-structures to assess how environmental conditions influenced human settlement and societal development [94] and how geoecology influenced social complexity [28] to help inform future conservation and development [93]. Dai et al. [58] studied past HEI in the 20th Century using a combination of sediment, hydrologic, meteorological, census, and satellite data to understand past climate and human impact on terrestrial and fluvial systems. Many of these studies have implications for, or methodology that is transferable to, modern human–environmental systems or HEI studies. Many of these studies incorporate satellite radar data alongside other satellite or aerial data types (Table 5) and the frequency of such applications has dramatically increased following the launch of SRTM data and more recently with the proliferation of UAS data [24,93,94,95,96,97]. Given the importance of archeological sites to a holistic understanding of past or long-term trends in HEI, it is important to plan for future impacts of sea level rise near archeological sites by using technologies such as remote sensing to document sites [36]. Additionally, Dearing et al. [98] note that the integration of data from such studies can be combined with instrumental monitoring records, official statistics, archival documents, and other data types to reconstruct integrated regional histories to address data gaps that hinder research relating to sustainable management of landscapes, ecosystems, and resources.
The importance of remote sensing in the fields of ecology, conservation, land management, urban planning, and water resources is highly apparent in the growing number of HEI studies that increasingly integrate remote sensing. Remote sensing is capable of providing key data because it provides repeatable, standardized, and verifiable information on long-term trends in ecologic functions and biodiversity [99], among other things, and allows us to characterize and interpret spatial patterns at multiple scales in socio-ecologic systems [52]. Multiple-scale analysis is required to derive a true understanding of socio-ecological systems, especially with regards to how humans, as a keystone species, shape their environment across a range of scales [51]. Remote sensing is also a cost-effective approach to understanding the relevancy and efficiency of management decisions within such systems [59] but the lack of multi-decadal records remains a barrier to many research agendas within the context of long-term functioning and sustainability of regional socio-ecologic systems [98]. Since patterns and relationships observed depend on both the scale at which HEI occur and the scale at which observations are made [100], there is a significant opportunity for researchers to conduct similar studies across multiple spatial and temporal scales to address gaps in knowledge (such as the lack of quantification of LUCC at a global scale as noted by Song et al. [49]) or so that decision-makers can prioritize where and how to intervene in multiscale socio-ecologic systems (Zaccarelli et al., 2009) [71]. Despite the usefulness of remote sensing for conservation planning and long-term monitoring, it is obvious that ground-level assessment is necessary to detect subtleties in human–environment systems [31]. Therefore, interdisciplinary approaches are crucial in addressing environmental challenges [101] and requires a synchronization of agendas between disciplines [102].
There are still several challenges within the remote sensing of HEI that will need to be addressed in coming years. Despite the broad advancements in technology since the landmark report People and Pixels was published, the lack of accurate and georeferenced social data remains a significant barrier to interdisciplinary approaches. For example, Verburg et al. [61] noted the lack of global data on human economic markets available for global environmental change studies, compared to data types such as land cover and soils, and created the first high-resolution dataset on global market influence. Despite efforts by CIESIN SEDAC and other international consortia and networks in furthering the reach and availability of georeferenced socio-economic data, progress is slow and integrative studies continue to have to rely on the collection of study-specific survey or interview data as primary sources of such data. Furthermore, there are still questions regarding what research protocols, if any, are needed when linking social data to remote sensing data [10]. Even where data exist, it is often difficult to integrate disparate datasets because they exist in different forms, formats, or are physically and geographically scattered [103]. The creation of standardized formats and metadata catalogs is proposed to be very important for the future of environmental security, information security, disaster forecast and prevention, and water and natural resources management [103] and has direct implications for advances within the HDGC and HEI fields.
Though current interpretations of the environment encompass the socio-spatial environment along urban to rural gradients, most public GIS (Geographic Information Science/Systems) resources tend to focus on mapping (in particular, tax mapping) [104]. The real power of remote sensing and GIS lie in the analytical and predictive power and potential to shape decision-making [104]. Integration of space-time dynamics, complexity of the landscape structure, current and historical land use, biophysical variability, and social data will continue to enhance the relevancy of HEI-HDGC studies in conservation management and decision-making. Regional and local processes have significant implications for household vulnerability [91], thus the study and management of socio-ecologic systems should be conducted with stakeholders in mind not only within the domains of HEI and HDGC. Emerging or underutilized methodologies and technologies such as thermal sensing [105,106], digital soil mapping [107], citizen science [72,108], UAVs, cloud computing, mobile mapping [108], or the use of “humans as sensors” [109,110] can guide informed decision-making in areas where data is hard to collect due to variability in socio-ecological settings [108] and will enhance the relevancy of future HDGC and HEI studies. The ability to run fast and complex computations based on long timeseries of remote sensing and environmental data in virtual or cloud-based environments such as Google Earth Engine or other National Aeronautical and Space Agency applications (Application for Extracting and Exploring Analysis Ready Samples—AppEEARS), for instance, will likely open up the specialized field of remote sensing to more social science applications and integrations. Along with an increased focus on citizen and participatory science and leveraging the incessant stream of georeferenced voluntary geographic information (VGI) produced from mobile and social media sources, analysis-ready remote sensing datasets can virtually revolutionize the field of human–environment interactions research at unprecedented rates over the ensuing decade. Catalyzing this human–natural systems data integration will not only advance our scientific understanding of the myriad of complex human dimensions of global change but also position HEI researchers to make important contributions at the science-policy interface and contribute to achieving sustainable development goals.

5. Conclusions

The interdisciplinary use of remote sensing to study human–environment interactions in the human dimensions of global change field and growing international spectrum of collaboration are immediately apparent in the wide range of research areas, types of questions being addressed, and ever more complex methods of integration utilized. Moreover, increased collaborations to address these complex issues at the interface of humans and the environment extend far beyond interdisciplinary academic collaborations to include stakeholders and decisions-makers as evidenced by the frequency with which studies are undertaken with stakeholders in mind or directly in support of decision-making tools. The inclusion of ground reference data, especially as it pertains to human stakeholders, is crucial to ensuring relevancy of remote sensing of HEI studies in the development of policy and as decision-making tools in HDGC. There are several new methodologies and technologies that have yet to be fully exploited within this discipline, including novel sensors such as thermal and LiDAR, agent-based modeling, cloud computing, citizen science, and humans as sensors. Researchers who wish to utilize remote sensing in HEI studies should strive to include these promising new technologies to further develop our collective capacity to accurately align human social data to remotely sensed data and further drive the cutting-edge advantage of human–environment work in helping address complex societal problems within a changing global environment.

Supplementary Materials

The following are available online at https://www.mdpi.com/2072-4292/11/23/2783/s1, S1: Boolean search phrase used in Web of Science search and S2: Corpus from Web of Science Search used in bibliometric assessment.

Funding

This research received no external funding.

Acknowledgments

We would like to thank the guest editors for this special issue for inviting our submission and organizing a timely and much needed special issue on remote sensing of human–environment interactions. We would also like to extend a warm thank you to our anonymous reviewers who helped improved this manuscript.

Conflicts of Interest

The authors declare no conflict of interest.

References

  1. National Research Council. Human Dimensions of Global Environmental Change: Research Pathways for the Next Decade; The National Academies Press: Washington, DC, USA, 1998. [Google Scholar] [CrossRef]
  2. National Research Council. People and Pixels: Linking Remote Sensing and Social Science; The National Academies Press: Washington, DC, USA, 1998. [Google Scholar] [CrossRef]
  3. Liverman, D.M.; Cuesta, R.M.R. Human interactions with the Earth system: People and pixels revisited. Earth Surf. Process. Landf. 2008, 33, 1458–1471. [Google Scholar] [CrossRef]
  4. Xian, G.; Crane, M. Assessment of urban growth in the Tampa Bay watershed using remote sensing data. Remote Sens. Environ. 2005, 97, 203–215. [Google Scholar] [CrossRef]
  5. Torgersen, C.E.; Faux, R.N.; McIntosh, B.A.; Poage, N.J.; Norton, D.J. Airborne thermal remote sensing for water temperature assessment of streams and rivers. Remote Sens. Environ. 2001, 76, 368–398. [Google Scholar] [CrossRef]
  6. White, M.A.; de Beurs, K.M.; Didan, K.; Inouyes, D.W.; Richardson, A.D.; Jensen, O.P.; O’Keefe, J.O.; Zhang, G.; Nemani, R.R.; van Leeuwen, W.J.D.; et al. Intercomparison, interpolation, and assessment of spring phenology in North America estimated from remote sensing for 1982–2006. Glob. Chang. Biol. 2009, 15, 2335–2359. [Google Scholar] [CrossRef]
  7. Nagendra, H. Using remote sensing to assess biodiversity. Int. J. Remote Sens. 2001, 22, 2377–2400. [Google Scholar] [CrossRef]
  8. Pettorelli, N.; Vik, J.O.; Mysterud, A.; Gaillard, J.; Tucker, C.J.; Stenseth, N.C. Using the satellite-derived NDVI to assess ecological responses to environmental change. Trends Ecol. Evol. 2005, 20, 503–510. [Google Scholar] [CrossRef] [PubMed]
  9. Wulder, M. Optical remote-sensing techniques for the assessment of forest inventory and biophysical parameters. Prog. Phys. Geogr. 1998, 22, 449–476. [Google Scholar] [CrossRef]
  10. Fox, J.; Vogler, J.B. Land-use and land-cover change in montane mainland southeast Asia. Environ. Manag. 2005, 36, 394–403. [Google Scholar] [CrossRef]
  11. Pricope, N.G.; Cassidy, L.; Gaughan, A.; Salerno, J.; Stevens, F.; Hartter, J.; Drake, M.; Mupeta-Muywama, P. Addressing integration challenges of interdisciplinary research in social-ecological systems. Soc. Nat. Resour. 2019, in press. [Google Scholar] [CrossRef]
  12. Gaughan, A.; Stevens, F.; Pricope, N.G.; Hartter, J.; Cassidy, L.; Salerno, J. Operationalizing vulnerability: Land systems dynamics in a transfrontier conservation area. Land 2019, 8, 111. [Google Scholar] [CrossRef]
  13. Wakie, T.T.; Laituri, M.; Evangelista, P.H. Assessing the distribution and impacts of Prosopis juliflora through participatory approaches. Appl. Geogr. 2016, 66, 132–143. [Google Scholar] [CrossRef]
  14. Lesschen, J.P.; Verburg, P.H.; Staal, S.J. Statistical Methods for Analyzing the Spatial Dimensions of Changes in Land Use and Farming Systems; LUCC Report Series No. 7; The International Livestock Research Institute: Nairobi, Kenya; LUCC Focus 3 Office, Wageningen University: Wageningen, The Netherlands, 2005; ISBN 9291461784-80. [Google Scholar]
  15. Eddy, I.M.S.; Gergel, S.E.; Coops, N.C.; Henebry, G.M.; Levine, J.; Zerriffi, H.; Shibkoz, E. Integrating remote sensing and ecological knowledge to monitor rangeland dynamics. Ecol. Indic. 2017, 82, 106–116. [Google Scholar] [CrossRef]
  16. Garcia, C.L.; Teich, I.; Gonzalez-Roglich, M.; Kindgard, A.F.; Ravelo, A.C.; Liniger, H. Land degradation assessment in the Angentinean Puna: Comparing expert knowledge with satellite-derived information. Environ. Sci. Policy 2019, 91, 70–80. [Google Scholar] [CrossRef]
  17. Mareya, H.T.; Tagwireyi, P.; Ndaimani, H.; Gara, T.W.; Gwenzi, D. Estimating tree crown area and aboveground biomass in miombo woodlands from high-resolution RGB-only imagery. IEEE J. Sel. Top. Appl. Earth Obs. Remote Sens. 2018, 11, 868–875. [Google Scholar] [CrossRef]
  18. Suyanto, S.; Applegate, G.; Permana, R.P.; Khusuiyah, N.; Kurniawan, I. The role of fire changing land use and livelihoods in Riau-Sumatra. Ecol. Soc. 2004, 9, 15. [Google Scholar] [CrossRef]
  19. Haag, F.; Hajdu, F. Perspectives on local environmental security exemplified by a rural South African Village. Environ. Manag. 2005, 36, 483–494. [Google Scholar] [CrossRef]
  20. Robiglio, V.; Mala, W.A. Integrating local and expert knowledge using participatory mapping and GIS to implement integrated forest management options in Akok, Cameroon. For. Chron. 2005, 81, 392–397. [Google Scholar] [CrossRef]
  21. Valbuena, D.; Verburg, P.H.; Bregt, A.K. A method to define a typology for agent-based analysis in regional land-use research. Agric. Ecosyst. Environ. 2008, 128, 27–36. [Google Scholar] [CrossRef]
  22. Abou Karaki, N.; Fiaschi, S.; Closson, D. Sustainable development and anthropogenic induced geomorphic hazards in subsiding areas. Earth Surf. Process. Landf. 2016, 41, 2282–2295. [Google Scholar] [CrossRef]
  23. Bini, M.; Rossi, V.; Amorosi, A.; Pappalardo, M.; Sarti, G.; Noti, V.; Capitani, M.; Fabiani, F.; Gualandi, M.L. Palaeoenvironments and palaeotopography of a multilayered city during the Etruscan and Roman periods: Early interaction of fluvial processes and urban growth at Pisa (Tuscany, Italy). J. Archaeol. Sci. 2015, 59, 197–210. [Google Scholar] [CrossRef]
  24. Breeze, P.S.; Groucutt, H.S.; Drake, N.A.; Louys, J.; Scerri, E.M.L.; Armitage, S.J.; Zalmout, I.S.A.; Memesh, A.M.; Haptari, M.A.; Soubhi, S.A.; et al. Prehistory and palaeoenvironments of the western Nefud Desert, Saudi Arabia. Archaeol. Res. Asia 2017, 10, 1–16. [Google Scholar] [CrossRef]
  25. Castella, J.C.; Boissau, S.; Trung, T.N.; Quang, D.D. Agrarian transition and lowland-upland interactions in mountain areas in northern Vietnam: Application of a multi-agent simulation model. Agric. Syst. 2005, 86, 312–332. [Google Scholar] [CrossRef]
  26. Dennis, R.A.; Mayer, J.; Applegate, G.; Chokkalingam, U.; Colfer, C.J.P.; Kurniawan, I.; Lachowski, H.; Maus, P.; Permana, R.P.; Ruchiat, Y.; et al. Fire, people and pixels: Linking social science and remote sensing to understand underlying causes and impacts of fires in Indonesia. Hum. Ecol. 2005, 33, 465–504. [Google Scholar] [CrossRef]
  27. Leitao, P.J.; Schwieder, M.; Suess, S.; Okujeni, A.; Galvao, L.S.; van der Linden, S.; Hostert, P. Monitoring Natural Ecosystem and Ecological Gradients: Perspectives with EnMAP. Remote Sens. 2015, 7, 13098–13119. [Google Scholar] [CrossRef]
  28. Lombardo, U.; Denier, S.; May, J.H.; Rodrigues, L.; Veit, H. Human-environment interactions in pre-Columbian Amazonia: The case of the Llanos de Moxos, Bolivia. Quat. Int. 2013, 312, 109–119. [Google Scholar] [CrossRef]
  29. MacLachlan, A.; Roberts, G.; Biggs, E.; Boruff, B. Subpixel land-cover classification for improved urban area estimates using Landsat. Int. J. Remote Sens. 2017, 38, 5763–5792. [Google Scholar] [CrossRef]
  30. Purkis, S.J.; Gardiner, R.; Johnston, M.W.; Sheppard, C.R.C. A half-century of coastline change in Diego Garcia: The largest atoll island in the Chagos. Geomorphology 2016, 261, 282–298. [Google Scholar] [CrossRef]
  31. Smith, W.; Meredith, T.C.; Johns, T. Exploring methods for rapid assessment of woody vegetation in the Batemi Valley, North-central Tanzania. Biodivers. Conserv. 1999, 8, 447–470. [Google Scholar] [CrossRef]
  32. Wimberly, M.C.; Ohmann, J.L. A multi-scale assessment of human and environmental constraints on forest land cover change on the Oregon (USA) coast range. Landsc. Ecol. 2004, 19, 631–646. [Google Scholar] [CrossRef]
  33. Ossola, A.; Hopton, M.E. Measuring urban tree loss dynamics across residential landscapes. Sci. Total Environ. 2018, 612, 940–949. [Google Scholar] [CrossRef] [PubMed]
  34. Vermeulen, F.; Pince, P.; Weekers, L.; De Dapper, M. Geoarchaeological study of abandoned Roman urban and suburban contexts from central Adriatic Italy. Geoarchaeology 2018, 33, 85–99. [Google Scholar] [CrossRef] [Green Version]
  35. Ning, J.; Liu, J.Y.; Kuang, W.H.; Xu, X.L.; Zhang, S.W.; Yan, C.Z.; Li, R.D.; Wu, S.X.; Hu, Y.F.; Du, G.M.; et al. Spatiotemporal patterns and characteristics of land-use change in China during 2010–2015. J. Geogr. Sci. 2018, 28, 547–562. [Google Scholar] [CrossRef] [Green Version]
  36. McCoy, M.D. The race to document archaeological sites ahead of rising sea levels: Recent applications of geospatial technologies in the archaeology of Polynesia. Sustainability 2018, 10, 22. [Google Scholar] [CrossRef] [Green Version]
  37. Keramitsoglou, I.; Daglis, I.A.; Amiridis, V.; Chrysoulakis, N.; Ceriola, G.; Manunta, P.; Maiheu, B.; De Ridder, K.; Lauwaet, D.; Paganini, M. Evaluation of satellite-derived products for the characterization of the urban thermal environment. J. Appl. Remote Sens. 2012, 6, 15. [Google Scholar] [CrossRef]
  38. Calver, M.C.; Goldman, B.; Hutchings, P.A.; Kingsford, R.T. Why discrepancies in searching the conservation biology literature matter. Biol. Conserv. 2013, 231, 19–26. [Google Scholar] [CrossRef] [Green Version]
  39. Pautasso, M. The jump in network ecology research between 1990 and 1991 is aweb of science artefact. Ecol. Model. 2014, 286, 11–12. [Google Scholar] [CrossRef]
  40. Nagendra, H.; Paul, S.; Pareeth, S.; Dutt, S. Landscapes of Protection: Forest Change and Fragmentation in Northern West Bengal, India. Environ. Manag. 2009, 44, 853–864. [Google Scholar] [CrossRef]
  41. Wu, W.C. Land use and cover changes in the critical areas in Northwestern China. In Remote Sensing for Agriculture, Ecosystems, and Hydrology; Owe, V.M., Durso, G., Moreno, J.F., Calera, A., Eds.; Spie-Int Soc Optical Engineering: Bellingham, WA, USA, 2004; Volume 5232, pp. 245–256. [Google Scholar]
  42. Dessie, G.; Kinlund, P. Khat expansion and forest decline in Wondo Genet, Ethiopia. Geogr. Ann. Ser. B-Hum. Geogr. 2008, 90, 187–203. [Google Scholar] [CrossRef]
  43. Fonji, S.F.; Taff, G.N. Using satellite data to monitor land-use land-cover change in North-eastern Latvia. Springerplus 2014, 3, 15. [Google Scholar] [CrossRef] [Green Version]
  44. Furumo, P.R.; Aide, T.M. Characterizing commercial oil palm expansion in Latin America: Land use change and trade. Environ. Res. Lett. 2017, 12, 12. [Google Scholar] [CrossRef]
  45. Ming, Y.; Chen, D.W.; Huang, R.H.; Ai, T.H. A dynamic analysis of regional land use and cover changing (LUCC) by remote sensing and GIS: Taking Fuzhou Area as example. In Advanced Environmental, Chemical, and Biological Sensing Technologies Vii; VoDinh, T., Lieberman, R.A., Gauglitz, G., Eds.; Spie-Int Soc Optical Engineering: Bellingham, WA, USA, 2010; Volume 7673. [Google Scholar]
  46. Southworth, J.; Hartter, J.; Binford, M.W.; Goldman, A.; Chapman, C.A.; Chapman, L.J.; Omeja, P.; Binford, E. Parks, people and pixels: Evaluating landscape effects of an East African national park on its surroundings. Trop. Conserv. Sci. 2010, 3, 122–142. [Google Scholar] [CrossRef]
  47. Nel, R.; Mearns, K.F.; Jordaan, M. Modelling informal Sand Forest harvesting using a Disturbance Index from Landsat, in Maputaland (South Africa). Ecol. Inform. 2017, 39, 1–9. [Google Scholar] [CrossRef]
  48. Wang, Z.M.; Liu, Z.M.; Song, K.S.; Zhang, B.; Zhang, S.M.; Liu, D.W.; Ren, C.Y.; Yang, F. Land use changes in Northeast China driven by human activities and climatic variation. Chin. Geogr. Sci. 2009, 19, 225–230. [Google Scholar] [CrossRef]
  49. Song, X.; Hansen, M.C.; Stehman, S.V.; Patapov, P.V.; Tyulavina, A.; Vermote, E.F.; Townshend, J.R. Global land change from 1982 to 2016. Nature 2018, 560, 639–643. [Google Scholar] [CrossRef]
  50. Gaughan, A.E.; Binford, M.W.; Southworth, J. Tourism, forest conversion, and land transformations in the Angkor basin, Cambodia. Appl. Geogr. 2009, 29, 212–223. [Google Scholar] [CrossRef]
  51. Zurlini, G.; Riitters, K.; Zaccarelli, N.; Petrosillo, I.; Jones, K.B.; Rossi, L. Disturbance patterns in a socio-ecological system at multiple scales. Ecol. Complex. 2006, 3, 119–128. [Google Scholar] [CrossRef]
  52. Zurlini, G.; Riitters, K.H.; Zaccarelli, N.; Petrosillo, I. Patterns of disturbance at multiple scales in real and simulated landscapes. Landsc. Ecol. 2007, 22, 705–721. [Google Scholar] [CrossRef]
  53. Jahel, C.; Vall, E.; Rodriguez, Z.; Begue, A.; Baron, C.; Augusseau, X.; Lo Seen, D. Analysing plausible futures from past patterns of land change in West Burkina Faso. Land Use Policy 2018, 71, 60–74. [Google Scholar] [CrossRef]
  54. Peng, J.; Liu, Y.H.; Shen, H.; Han, Y.; Pan, Y.J. Vegetation coverage change and associated driving forces in mountain areas of Northwestern Yunnan, China using RS and GIS. Environ. Monit. Assess. 2012, 184, 4787–4798. [Google Scholar] [CrossRef]
  55. Hu, G.Y.; Dong, Z.B.; Lu, J.F.; Yan, C.Z. The developmental trend and influencing factors of aeolian desertification in the Zoige Basin, eastern Qinghai-Tibet Plateau. Aeolian Res. 2015, 19, 275–281. [Google Scholar] [CrossRef]
  56. Moon, Z.K.; Farmer, F.L. Deforestation near public lands: An empirical examination of associated processes. Soc. Nat. Resour. 2013, 26, 605–621. [Google Scholar] [CrossRef]
  57. Pricope, N.G.; Gaughan, A.E.; All, J.D.; Binford, M.W.; Rutina, L.P. Spatio-temporal analysis of vegetation dynamics in relation to shifting inundation and fire regimes: Disentangling environmental variability from land management decisions in a southern African transboundary watershed. Land 2015, 4, 627–655. [Google Scholar] [CrossRef]
  58. Dai, X.R.; Dearing, J.A.; Yu, L.Z.; Zhang, W.G.; Shi, Y.X.; Zhang, F.R.; Gu, C.J.; Boyle, J.F.; Coulthard, T.J.; Foster, G.C. The recent history of hydro-geomorphological processes in the upper Hangbu river system, Anhui Province, China. Geomorphology 2009, 106, 363–375. [Google Scholar] [CrossRef]
  59. Pettorelli, N.; Chauvenet, A.L.M.; Duffy, J.P.; Cornforth, W.A.; Meillere, A.; Baillie, J.E.M. Tracking the effect of climate change on ecosystem functioning using protected areas: Africa as a case study. Ecol. Indic. 2012, 20, 269–276. [Google Scholar] [CrossRef]
  60. Li, X.; Chen, G.Z.; Liu, X.P.; Liang, X.; Wang, S.J.; Chen, Y.M.; Pei, F.S.; Xu, X.C. A New Global Land-Use and Land-Cover Change Product at a 1-km Resolution for 2010 to 2100 Based on Human-Environment Interactions. Ann. Am. Assoc. Geogr. 2017, 107, 1040–1059. [Google Scholar] [CrossRef]
  61. Verburg, P.H.; Ellis, E.C.; Letourneau, A. A global assessment of market accessibility and market influence for global environmental change studies. Environ. Res. Lett. 2011, 6, 12. [Google Scholar] [CrossRef]
  62. Honda, Y.; Moriyama, M.; Hori, M.; Murakami, M.; Ono, A.; Kajiwara, K. Possibility of Gcom-C1/SGLI for climate change impacts analyzing. In Networking the World with Remote Sensing; Kajiwara, K., Muramatsu, K., Soyama, N., Endo, T., Ono, A., Akatsuka, S., Eds.; Copernicus Gesellschaft Mbh: Gottingen, Germany, 2010; Volume 38, pp. 542–546. [Google Scholar]
  63. Honda, Y.; Moriyama, M.; Ono, A.; Kajiwara, K. A study on possibility of land vegetaflon obseirvation with SGLI/GCOM-C. In Sensors, Systems, and Next-Generation Satellites XI; Meynart, R., Neeck, S.P., Shimoda, H., Habib, S., Eds.; Spie-Int Soc Optical Engineering: Bellingham, WA, USA, 2007; Volume 6744. [Google Scholar]
  64. Honda, Y.; Moriyama, M.; Ono, Y.; Kajiwara, K.; Tanigawa, S. The Examination of Land products from GCOM-C1/SGLI. In Proceedings of the 2015 IEEE International Geoscience and Remote Sensing Symposium (IGARSS), Milan, Italy, 26–31 July 2015; IEEE: New York, NY, USA; pp. 5099–5102. [Google Scholar]
  65. Honda, Y.; Yamamoto, H.; Hori, M.; Murakami, H.; Kikuchi, N. The possibility of SGLI/GCOM-C for Global environment change monitoring. In Sensors, Systems, and Next-Generation Satellites X; Meynart, R., Neeck, S.P., Shimoda, H., Eds.; Spie-Int Soc Optical Engineering: Bellingham, WA, USA, 2006; Volume 6361. [Google Scholar]
  66. Honda, Y.; Yamamoto, H.; Hori, M.; Murakami, H.; Kikuchi, N. Global environment monitoring using the next generation satellite sensor, SGLI/GCOM-C. In Proceedings of the 2005 IEEE International Geoscience and Remote Sensing Symposium, 2005. IGARSS ’05, Seoul, Korea, 29–29 July 2005; IEEE: New York, NY, USA; pp. 4205–4207. [Google Scholar]
  67. Herrmann, S.M.; Sall, I.; Sy, O. People and pixels in the Sahel: A study linking coarse-resolution remote sensing observations to land users’ perceptions of their changing environment in Senegal. Ecol. Soc. 2014, 19, 18. [Google Scholar] [CrossRef] [Green Version]
  68. Judex, M.; Rohrig, J.; Linsoussi, C.; Thamm, H.P.; Menz, G. Vegetation Cover and Land Use Change in Benin; Springer-Verlag Berlin: Berlin, Germany, 2010; pp. 257–273. [Google Scholar]
  69. Kant, Y.; Bharath, B.D.; Mallick, J.; Atzberger, C.; Kerle, N. Satellite-based analysis of the role of land use/land cover and vegetation density on surface temperature regime of Delhi, India. J. Indian Soc. Remote Sens. 2009, 37, 201–214. [Google Scholar] [CrossRef]
  70. Smit, I.P.J.; Landman, M.; Cowling, R.M.; Gaylard, A. Expert-derived monitoring thresholds for impacts of megaherbivores on vegetation cover in a protected area. J. Environ. Manag. 2016, 177, 298–305. [Google Scholar] [CrossRef]
  71. Zaccarelli, N.; Petrosillo, I.; Zurlini, G.; Riitters, K.H. Source/Sink Patterns of Disturbance and Cross-Scale Mismatches in a Panarchy of Social-Ecological Landscapes. Ecol. Soc. 2008, 13, 19. [Google Scholar] [CrossRef]
  72. Nursamsi, I.; Komala, W.R. Assessment of the successfulness of mangrove plantation program through the use of open source software and freely available satellite images. Nusant. Biosci. 2017, 9, 251–259. [Google Scholar] [CrossRef]
  73. Griffiths, P.; Hostert, P. Forest Cover Dynamics during Massive Ownership Changes-Annual Disturbance Mapping Using Annual LANDSAT Time-Series; Springer: Dordrecht, The Netherlands, 2015; Volume 22, pp. 307–322. [Google Scholar]
  74. Tan, P.Y.; Feng, Y.Q.; Hwang, Y.H. Deforestation in a tropical compact city (Part A) Understanding its socio-ecological impacts. Smart Sustain. Built Environ. 2016, 5, 47–72. [Google Scholar] [CrossRef]
  75. Davies, T.; Everard, M.; Horswell, M. Community-based groundwater and ecosystem restoration in semi-arid north Rajasthan (3): Evidence from remote sensing. Ecosyst. Serv. 2016, 21, 20–30. [Google Scholar] [CrossRef]
  76. Galletti, C.S.; Ridder, E.; Falconer, S.E.; Fall, P.L. Maxent modeling of ancient and modern agricultural terraces in the Troodos foothills, Cyprus. Appl. Geogr. 2013, 39, 46–56. [Google Scholar] [CrossRef]
  77. Yan, H.M.; Liu, F.; Liu, J.Y.; Xiao, X.M.; Qin, Y.W. Status of land use intensity in China and its impacts on land carrying capacity. J. Geogr. Sci. 2017, 27, 387–402. [Google Scholar] [CrossRef] [Green Version]
  78. He, F.N.; Li, S.C.; Yang, F.; Li, M.J. Evaluating the accuracy of Chinese pasture data in global historical land use datasets. Sci. China-Earth Sci. 2018, 61, 1685–1696. [Google Scholar] [CrossRef]
  79. Koglo, Y.S.; Agyare, W.A.; Diwediga, B.; Sogbedji, J.M.; Adden, A.K.; Gaiser, T. Remote sensing-based and participatory analysis of forests, agricultural land dynamics, and potential land conservation measures in Kloto District (Togo, West Africa). Soil Syst. 2018, 2, 11. [Google Scholar] [CrossRef] [Green Version]
  80. Acevedo, M.F.; Callicott, J.B.; Monticino, M.; Lyons, D.; Palomino, J.; Rosales, J.; Delgado, L.; Ablan, M.; Davila, J.; Tonella, G.; et al. Models of natural and human dynamics in forest landscapes: Cross-site and cross-cultural synthesis. Geoforum 2008, 39, 846–866. [Google Scholar] [CrossRef]
  81. Iwamura, T.; Lambin, E.F.; Silvius, K.M.; Luzar, J.B.; Fragoso, J.M.V. Agent-based modeling of hunting and subsistence agriculture on indigenous lands: Understanding interactions between social and ecological systems. Environ. Model. Softw. 2014, 58, 109–127. [Google Scholar] [CrossRef]
  82. Weng, Q.H. Remote sensing of impervious surfaces in the urban areas: Requirements, methods, and trends. Remote Sens. Environ. 2012, 117, 34–49. [Google Scholar] [CrossRef]
  83. Georgopoulou, I.A.; Kalivas, D.P.; Petropoulos, G.P. Urban vegetation cover extraction from hyperspectral remote sensing imagery and GIS-based spatial analysis techniques: The case of Athens, Greece. In Proceedings of the 13th International Conference on Environmental Science and Technology, Athens, Greece, 5–7 September 2013; Lekkas, T.D., Ed.; Global NEST Secretariat: Athens, Greece, 2013. [Google Scholar]
  84. Yin, W.D.; Yang, J. Sub-pixel vs. super-pixel-based greenspace mapping along the urban-rural gradient using high spatial resolution Gaofen-2 satellite imagery: A case study of Haidian District, Beijing, China. Int. J. Remote Sens. 2017, 38, 6386–6406. [Google Scholar] [CrossRef]
  85. Ishtiaque, A.; Shrestha, M.; Chhetri, N. Rapid urban growth in the Kathmandu Valley, Nepal: Monitoring land use land cover dynamics of a Himalayan city with Landsat imageries. Environments 2017, 4, 16. [Google Scholar] [CrossRef]
  86. Mohan, M.; Kandya, A. Impact of urbanization and land-use/land-cover change on diurnal temperature range: A case study of tropical urban airshed of India using remote sensing data. Sci. Total Environ. 2015, 506, 453–465. [Google Scholar] [CrossRef] [PubMed]
  87. Tagil, S.; Gormus, S.; Cengiz, S. The relationship of urban expansion, landscape patterns and ecological processes in Denizli, Turkey. J. Indian Soc. Remote Sens. 2018, 46, 1285–1296. [Google Scholar] [CrossRef]
  88. Estoque, R.C.; Murayama, Y. Landscape pattern and ecosystem service value changes: Implications for environmental sustainability planning for the rapidly urbanizing summer capital of the Philippines. Landsc. Urban Plan. 2013, 116, 60–72. [Google Scholar] [CrossRef]
  89. Estoque, R.C.; Murayama, Y. Intensity and spatial pattern of urban land changes in the megacities of Southeast Asia. Land Use Policy 2015, 48, 213–222. [Google Scholar] [CrossRef]
  90. Maleki, S.; Soffianian, A.R.; Koupaei, S.S.; Pourmanafi, S.; Saatchi, S. Wetland restoration prioritizing, a tool to reduce negative effects of drought; An application of multicriteria-spatial decision support system (MC-SDSS). Ecol. Eng. 2018, 112, 132–139. [Google Scholar] [CrossRef]
  91. King, B.; Yurco, K.; Young, K.R.; Crews, K.A.; Shinn, J.E.; Eisenhart, A.C. Livelihood dynamics across a variable flooding regime. Hum. Ecol. 2018, 46, 865–874. [Google Scholar] [CrossRef]
  92. Restrepo, A.M.C.; Yang, Y.R.; McManus, D.P.; Gray, D.J.; Giraudoux, P.; Barnes, T.S.; Williams, G.M.; Magalhaes, R.J.S.; Hamm, N.A.S.; Clements, A.C.A. The landscape epidemiology of echinococcoses. Infect. Dis. Poverty 2016, 5, 13. [Google Scholar] [CrossRef] [Green Version]
  93. Lombardo, U.; Canal-Beeby, E.; Fehr, S.; Veit, H. Raised fields in the Bolivian Amazonia: A prehistoric green revolution or a flood risk mitigation strategy? J. Archaeol. Sci. 2011, 38, 502–512. [Google Scholar] [CrossRef]
  94. Lombardo, U.; May, J.H.; Veit, H. Mid- to late-Holocene fluvial activity behind pre-Columbian social complexity in the southwestern Amazon basin. Holocene 2012, 22, 1034–1045. [Google Scholar] [CrossRef]
  95. Conesa, F.C.; Devanthery, N.; Balbo, A.L.; Madella, M.; Monserrat, O. Use of satellite SAR for understanding long-term human occupation dynamics in the monsoonal semi-arid plains of North Gujarat, India. Remote Sens. 2014, 6, 11420–11443. [Google Scholar] [CrossRef] [Green Version]
  96. Conesa, F.C.; Madella, M.; Galiatsatos, N.; Balbo, A.L.; Rajesh, S.V.; Ajithprasad, P. CORONA photographs in monsoonal semi-arid environments: Addressing archaeological surveys and historic landscape dynamics over North Gujarat, India. Archaeol. Prospect. 2015, 22, 75–90. [Google Scholar] [CrossRef]
  97. Biagetti, S.; Merlo, S.; Adam, E.; Lobo, A.; Conesa, F.C.; Knight, J.; Bekrani, H.; Crema, E.R.; Alcaina-Mateos, J.; Madella, M. High and medium resolution satellite imagery to evaluate late Holocene human-environment interactions in arid lands: A case study from the Central Sahara. Remote Sens. 2017, 9, 21. [Google Scholar] [CrossRef] [Green Version]
  98. Dearing, J.A.; Acma, B.; Bub, S.; Chambers, F.M.; Chen, X.; Cooper, J.; Crook, D.; Dong, X.H.; Dotterweich, M.; Edwards, M.E.; et al. Social-ecological systems in the Anthropocene: The need for integrating social and biophysical records at regional scales. Anthr. Rev. 2015, 2, 220–246. [Google Scholar] [CrossRef]
  99. Pettorelli, N.; Laurance, W.F.; O’Brien, T.G.; Wegmann, M.; Nagendra, H.; Turner, W. Satellite remote sensing for applied ecologists: Opportunities and challenges. J. Appl. Ecol. 2014, 51, 839–848. [Google Scholar] [CrossRef]
  100. Brook, M.M. Seeing the forest and the trees: Human-environment interactions in forest ecosystems. Prof. Geogr. 2006, 58, 359–360. [Google Scholar] [CrossRef]
  101. Perring, M.P.; Standish, R.J.; Price, J.N.; Craig, M.D.; Erickson, T.E.; Ruthrof, K.X.; Whiteley, A.S.; Valentine, L.E.; Hobbs, R.J. Advances in restoration ecology: Rising to the challenges of the coming decades. Ecosphere 2015, 6, 25. [Google Scholar] [CrossRef] [Green Version]
  102. Pettorelli, N.; Safi, K.; Turner, W. Satellite remote sensing, biodiversity research and conservation of the future. Philos. Trans. R. Soc. B-Biol. Sci. 2014, 369, 5. [Google Scholar] [CrossRef]
  103. Coskun, H.G.; Alganci, U.; Usta, G. The role of remote sensing and GIS for security. In Integration of Information for Environmental Security; Coskun, H.G., Cigizoglu, H.K., Maktav, M.D., Eds.; Springer: Dordrecht, The Netherlands, 2008; pp. 337–351. [Google Scholar]
  104. Gatrell, J.D.; Jensen, R.R. Geotechnologies in Place and the Environment; Springer: Dordrecht, The Netherlands, 2009; Volume 1, pp. 1–3. [Google Scholar]
  105. Jin, H.S.; Han, D. Multisensor fusion of Landsat images for high-resolution thermal infrared images using sparse representations. Math. Probl. Eng. 2017, 10, 98. [Google Scholar] [CrossRef] [Green Version]
  106. Oguz, H. A software tool for retrieving land surface temperature from ASTER imagery. Tarim Bilimleri Derg. J. Agric. Sci. 2015, 21, 471–482. [Google Scholar]
  107. Grunwald, S.; Thompson, J.A.; Boettinger, J.L. Digital soil mapping and modeling at continental scales: Finding solutions for global issues. Soil Sci. Soc. Am. J. 2011, 75, 1201–1213. [Google Scholar] [CrossRef]
  108. Murthy, M.S.R.; Bajracharya, B.; Pradhan, S.; Shrestha, B.; Bajracharya, R.; Shakya, K.; Wesselman, S.; Ali, M.; Bajracharya, S. Adoption of geospatial systems towards evolving sustainable Himalyan Mountain development. In Isprs Technical Commission VIII Symposium; Dadhwal, V.K., Diwakar, P.G., Seshasai, M.V.R., Raju, P.L.N., Hakeem, A., Eds.; Copernicus Gesellschaft Mbh: Gottingen, Germany, 2014; Volume 40–48, pp. 1319–1324. [Google Scholar]
  109. Blaschke, T.; Hay, G.J.; Weng, Q.H.; Resch, B. Collective sensing: Integrating geospatial technologies to understand urban systems—An overview. Remote Sens. 2011, 3, 1743–1776. [Google Scholar] [CrossRef] [Green Version]
  110. Sagl, G.; Resch, B.; Blaschke, T. Contextual sensing: Integrating contextual information with human and technical geo-sensor information for smart cities. Sensors 2015, 15, 17013–17035. [Google Scholar] [CrossRef]
Figure 1. Publication trends by year based on Web of Science search results.
Remotesensing 11 02783 g001
Figure 2. Number of author affiliations by country. The number of affiliations is indicated by the label, with the color scale using shades of green for lower values, yellows for middle values, and oranges and reds for high values.
Remotesensing 11 02783 g002
Figure 3. Spatial scales at which studies were conducted. This excluded publications for which spatial scale was irrelevant or unidentifiable, such as literature reviews or those that described methodologies where no specific study area or spatial scale was identified.
Remotesensing 11 02783 g003
Figure 4. Number of publications by country studied. This map excludes one continental-regional level assessment of Africa and nine global-level studies, as well as studies that did not specify a study area such as methodological descriptions or literature reviews.
Remotesensing 11 02783 g004
Table 1. List of journals that have published two or more publications based on Web of Science search criteria.
Journal TitleNumber of Publications
Remote Sensing4
Applied Geography2
Earth Surface Processes and Landforms2
Ecological Indicators2
Ecology and Society2
Environmental Management2
Environmental Research Letters2
Geoforum2
Geomorphology2
Human Ecology2
International Journal of Remote Sensing2
Journal of Archeological Science2
Journal of Geographic Science2
Journal of the Indian Society of Remote Sensing2
Land Use Policy2
Landscape Ecology2
Science of the Total Environment2
Sensors, Systems, and Next-Generation Satellites X2
Table 2. Author-identified research areas of literature identified by Web of Science search results. Authors identified between one and five research areas; therefore, the total count is greater than the number of literature items identified in the search.
Research AreaCount
Environmental Sciences & Ecology47
Remote Sensing26
Geology25
Physical Geography17
Engineering10
Geography10
Imaging Science & Photographic Technology10
Sociology6
Agriculture5
Archaeology5
Biodiversity & Conservation5
Anthropology4
Public Administration4
Science & Technology—Other4
Urban Studies4
Computer Science3
Instruments & Instrumentation3
Water Resources3
Information Science & Library Science2
Life Sciences & Biomedicine—Other2
Meteorology & Atmospheric Sciences2
Optics2
Telecommunications2
Business & Economics1
Chemistry1
Construction & Building Technology1
Demography1
Development Studies1
Electrochemistry1
Energy & Fuels1
Geochemistry & Geophysics1
Infectious Diseases1
Social Issues1
Table 3. Remote sensing platform types utilized in studies. Studies may have used data from more than one remote sensing platform, thus the total number of studies in this table is greater than in the analysis.
Remote Sensing PlatformNo. StudiesNo. Platforms UsedNo. Studies
Satellite83One67
Aerial (plane)15Two14
UAV2Three1
Helikite1Four1
Not Specified1
Terrestrial1
N/A17
Table 4. Studies using multiple sources of satellite data.
No. Satellite SourcesNo. Studies
Ten1
Eight1
Six1
Five2
Four4
Three13
Two28
One33
Total83
Table 5. Frequency of satellites and sensors used in studies, with details on sensor type. Studies using Landsat (MSS, TM, ETM+, OLI) and LISS-111 are not listed due to the large number of studies utilizing this type of satellite imagery (with exception to a few studies indicated below). Refer to S2 for studies indicated in this table.
Satellite & Sensor NameSensor TypeNo. Times UtilizedStudies
ALOS AVNIR-2Multispectral3Bini et al., 2015; Estoque & Murayama, 2015; Griffiths & Hostert, 2015
ALOS PALSARRadar1Abou Karaki et al., 2016
ASTERMultispectral8Biagetti et al., 2017; Bini et al., 2015; Conesa et al., 2015; Galletti et al., 2013; Judex et al., 2010; Kant et al., 2009 *; Keramitsoglou et al., 2012 *; Oguz, 2015 *
AVHRRMultispectral6Bartlett et al., 2000; Dennis et al., 2005; Keramitsoglou et al., 2012 *; Pricope et al., 2015; Song, 2018; Wei et al., 2018
CORONAGreyscale4Abou Karaki et al., 2016; Conesa et al., 2015; McCoy, 2018; Wu, 2004
COSMO_SkyMedRadar1Abou Karaki et al., 2016
Envisat ASARRadar2Abou Karaki et al., 2016; Conesa et al., 2014
Envisat AATSRMultispectral1Keramitsoglou et al., 2012 *
EO-1 HyperionHyperspectral2Georgopoulou et al., 2013; Leitao et al., 2015
EO-1 ALIMultispectral1Leitao et al., 2015
ESR-1 ATSRRadar, Infrared2Abou Karaki et al., 2016; Keramitsoglou et al., 2012 *
ESR-2 ATSRRadar1Abou Karaki et al., 2016
Gaofen-2Multispectral, Panchromatic2Ning et al., 2018; Yin & Yan, 2017
ICESATLiDAR1Lombardo et al., 2011
IKONOSMultispectral, Panchromatic1Galletti et al., 2013
Landsat MSSMultispectral6Abou Karaki et al., 2016
Landsat TMMultispectral29Keramitsoglou et al., 2012 *
Landsat ETM+Multispectral, Panchromatic25Jin & Han, 2017*, Nursamsi & Komala, 2017 ***
Landsat OLIMultispectral, Panchromatic11Keramitsoglou et al., 2012 *, Nursamsi & Komala, 2017 ***
LISS-111Multispectral11
MODIS Aqua & TerraMultispectral7Furumo & Aide, 2017; Keramitsoglou et al., 2012 *; Li et al., 2017; Mohan & Kandya, 2015 *; Pricope et al., 2015; Song, 2018; Wei et al., 2018
MSG-SEVIRIMultispectral1Keramitsoglou et al., 2012 *
QuickbirdMultispectral, Panchromatic2Galletti et al., 2013; Yin et al., 2015
SARRadar1Dennis et al., 2005
Sentinel-1ARadar1Abou Karaki et al., 2016
SGLI/GCOM-CNear UV to TIR5Honda *, 2005; 2006; 2007; 2010; 2015
SPOT (not specified)Multispectral1Bini et al., 2015
SPOT 1Panchromatic1Abou Karaki et al., 2016
SPOT 5Multispectral, Panchromatic4Jahel et al.; 2018; Ming et al., 2010; Smit et al., 1999; Tan et al., 2016
SPOT XSMultispectral1Dennis et al., 2005
SRTMRadar8Biagetti et al., 2017; Breeze et al., 2017; Conesa et al., 2015; Conesa et al., 2014; Lombardo et al., 2011; 2012; Verburg et al., 2011; Yang et al., 2015
TRMM PRRadar1Pricope et al., 2015
WorldView 1Panchromatic1Biagetti et al., 2017
WorldView 2Multispectral, Panchromatic3Biagetti et al., 2017 ***; McCoy, 2018; Purkis et al.; 2016
WorldView 3Multispectral, Panchromatic1Biagetti et al., 2017
Not specified 8Acevedo et al., 2008; Castella et al., 2005; He, 2018; Herrmann et al., 2014; Liverman & Cuesta, 2008; Moon & Farmer, 2013; Pettorelli et al., 2012; Tanaka & Nishii, 2013
Google Earth 9Conesa et al., 2015; Furumo & Aide, 2017; Georgopoulou et al., 2013; Lombardo 2011; 2012; 2013; Nursamsi & Komala, 2017; Ossola & Hopton, 2018; Vermeulen et al., 2018
ESRI 2Breeze et al., 2017; Conesa et al., 2015;
Bing 2Breeze et al., 2017; Vermeulen et al., 2018
* indicates studies utilizing thermal infrared imagery; ** indicates studies utilizing thermal infrared/panchromatic fusion; *** indicates studies utilizing multispectral/panchromatic fusion.
Table 6. Frequency of use of socio-economic data in studies. Refer to Supplement 2 for studies indicated in this table.
Socio-Economic Data TypeNo. Times UtilizedStudies
Agricultural census1Liverman & Cuesta, 2008
Archival data1Dessie & Kinlund, 2008
Commodity trade data1Furumo & Aide, 2017
Economic data3Li et al., 2017; Verburg et al., 2011; Yan et al., 2017
Employment & labor data2Moon & Farmer, 2013; Wu, 2004
Field survey1Dennis et al., 2005
Focus group1Herrman et al., 2014
Group discussion/interview2Dennis et al., 2005; Dessie & Kinlund, 2008
Houshold survey/interview7Castella et al., 2005; Dessie & Kinlund, 2008; Dennis et al., 2005; Iwamura et al., 2014; King et al., 2018; Liverman & Cuesta, 2008; Fox & Vogler, 2005
Housing trend data2Moon & Farmer, 2013; Tanaka & Nishii, 2013
Individual interview6Dennis et al., 2005; Estoque & Murayama, 2013; Fox & Vogler, 2005; Iwamura et al., 2014; Jahel et al., 2018; Koglo et al., 2018
Key informant survey/interview5Dessie & Kinlund, 2008; Smit et al., 2016; Jahel et al., 2018; Castella et al., 2005; Fox & Vogler, 2005
Land use & production2Ossola & Hopton, 2018; Wu, 2004
Listing exercise1Dessie & Kinlund, 2008
Matrix scoring1Herrmann et al., 2014
Other population data6Li et al., 2017; Verburg et al., 2011; Yan et al., 2017; Moon & Farmer, 2013; Yin et al., 2015; Wu, 2004
Participatory mapping/livelihood mapping3Herrmann et al., 2014, Dennis et al., 2005; King et al., 2018
Population Census6Bartlett et al., 2000; Dai et al., 2009; Fonji & Taff, 2014; Ossola & Hopton, 2018; Tanaka & Nishii, 2013; Jahel et al., 2018
Ranking exercise1Dessie & Kinlund, 2008
Rural appraisal1Dennis et al., 2005
Socio-economic data (unspecified)1Iwamura et al., 2014
Transect walks1Dessie & Kinlund, 2008
Total studies using socio-economic data27

