A CNN-Based Pan-Sharpening Method for Integrating Panchromatic and Multispectral Images Using Landsat 8

1
Institute of Remote Sensing and Geographic Information System, Peking University, Beijing 100871, China
2
College of Engineering, Peking University, Beijing 100871, China
*
Author to whom correspondence should be addressed.
Remote Sens. 2019, 11(22), 2606; https://doi.org/10.3390/rs11222606
Submission received: 9 September 2019
/
Revised: 25 October 2019
/
Accepted: 5 November 2019
/
Published: 7 November 2019
Abstract
:The increasing availability of sensors enables the combination of a high-spatial-resolution panchromatic image and a low-spatial-resolution multispectral image, which has become a hotspot in recent years for many applications. To address the spectral and spatial distortions that adversely affect the conventional methods, a pan-sharpening method based on a convolutional neural network (CNN) architecture is proposed in this paper, where the low-spatial-resolution multispectral image is upgraded and integrated with the high-spatial-resolution panchromatic image to produce a new multispectral image with high spatial resolution. Based on the pyramid structure of the CNN architecture, the proposed method has high learning capacity to generate more representative and robust hierarchical features for construction tasks. Moreover, the highly nonlinear fusion process can be effectively simulated by stacking several linear filtering layers, which is suitable for learning the complex mapping relationship between a high-spatial-resolution panchromatic and low-spatial-resolution multispectral image. Both qualitative and quantitative experimental analyses were carried out on images captured from a Landsat 8 on-board operational land imager (LOI) sensor to demonstrate the method’s performance. The results regarding the sensitivity analysis of the involved parameters indicate the effects of parameters on the performance of our CNN-based pan-sharpening approach. Additionally, our CNN-based pan-sharpening approach outperforms other existing conventional pan-sharpening methods with a more promising fusion result for different landcovers, with differences in Erreur Relative Globale Adimensionnelle de Synthse (ERGAS), root-mean-squared error (RMSE), and spectral angle mapper (SAM) of 0.69, 0.0021, and 0.81 on average, respectively.

1. Introduction
High-resolution remote sensing imagery contains sufficient target details and dynamically offers global observation data for many military and civilian applications (such as aeronautics [1], astronautics [1], hazard monitoring [2], and military reconnaissance [3]). Currently, numerous optical remote sensing satellites, such as IKONOS, QuickBird, GeoEye, WorlView-2, Landsat, and so on, provide panchromatic images with high spatial resolution and multispectral images with low spatial resolution. However, it is well known that the design of satellite sensors has to make a tradeoff between spatial and spectral resolutions [4]. The pan-sharpening-based method [5] to combine multispectral and panchromatic images can effectively obtain high-spatial-resolution multispectral images such that the fused images have the characteristics of high spatial resolution and high spectral resolution at the same time. As a result, the fused image provides more accurate and reliable information as a better basis for artificial decision-making, which will be beneficial to the application of ground object classification, target detection, artificial visual interpretation, and so on. Therefore, a robust and efficient pan-sharpening method to achieve the automatic fusion task has been an active research topic.
Pan-sharpening reconstruction is a technique for reconstructing high-spatial-and-spectral-resolution multispectral imagery by processing one or more piece of low-spatial-resolution multispectral imagery with complementary information extracted from the high-spatial-resolution panchromatic imagery or obtaining high-spatial-and-spectral-resolution multispectral imagery sequences from multiple pieces of low-spatial-resolution observation imagery. At present, many pan-sharpening methods have been proposed from different perspectives and can be generally divided into the following three categories: Methods based on component substitution, methods based on multiresolution analysis, and methods based on model optimization. Each method type has its own advantages and disadvantages.
For the methods based on component substitution, the insight behind them is the use of projection transformation (e.g., Gram–Schmidt [6], intensity-hue-saturation (IHS) [7], principal component analysis (PCA) ([8,9]), Gram–Schmidt adaptive [10], and so on) to carry out one space transformation where the spatial element and spectral element within the low-spatial-resolution multispectral imagery are separated into different individual components. Subsequently, the spatial part derived from the panchromatic imagery is injected into the original multispectral imagery to generate upgraded multispectral imagery. Based on that idea, numerous relevant research studies have been presented. For example, Rahmani et al. [11] developed image-adaptive coefficients and an edge-adaptive HIS method to enhance the spectral quality of the upgraded multispectral imagery. Laben and Brower [6] used Gram–Schmidt transformation to produce an enhanced-spatial-resolution multispectral digital image. Aiazzi et al. [10] constructed a multivariate regression model to investigate and analyze the spectral quality without diminishing the spatial quality. Yang et al. [12] exploited ripplet transform and compressed sensing to improve the traditional HIS-based pan-sharpening method. Duran and Buades [13] used principal component analysis domain transformation to split up both geometry and chromaticity for imagery restoration, in which the geometry of panchromatic imagery conditionally filters the chromatic parts, and then locally histogram-matched panchromatic imagery is used as a substitution for the geometric part for spatial improvement. Although they can be easily conducted and the resulting multispectral imagery has adequate spatial sharpness [14], these methods based on component substitution usually exhibit the characteristic of remarkable spectral distortion because they cannot be well matched in between due to the differences of the spectral ranges [10].
In regard to the methods based on multiresolution analysis (e.g., modulation transfer functions (MTF)-generalized Laplacian pyramid [15], modulation transfer functions (MTF)-generalized Laplacian pyramid with high pass modulation [16], smoothing filter-based intensity modulation [17], and so on), the main purpose of the multiresolution decomposition is to detect the spatial component from the panchromatic imagery, which is then embedded into the multispectral imagery for the spatial enhancement after the multispectral imagery is interpolated. Aiazzi et al. [15] designed a multiscale and oversampled structure to combine multispectral imagery with panchromatic imagery and supported any input with an arbitrary number of bands. Kaplan and Erer [18] used an edge-preserving decomposition to decompose the high-spatial-resolution panchromatic imagery. Then, the absent high-frequency component was injected into low-spatial-resolution multispectral imagery while decreasing the abundant details. Unlike the methods based on component substitution, these methods based on multiresolution analysis are better adapted to maintain the spectral components in the multispectral imagery due to the absence of a transformation operation [19]. However, it should be noted that more serious spatial distortions derived from these methods based on multiresolution analysis, such as ringing artifacts, might occur, which results in deteriorated visual effects in the produced multispectral imagery.
Unlike the methods based on component substitution and the methods based on multiresolution analysis, the imagery pan-sharpening task is generally formulated into the imagery restoration issue through the methods based on model optimization, such as coupled nonnegative matrix factorization [20], Bayesian HySure [21], Bayesian-Naïve Gaussian prior [22] and sparse representation [23], based on the multispectral sensor observation models and the panchromatic sensor observation models, as well as their correlations in between. Zhang et al. [24] investigated the relationships between the observed low-spatial-resolution multispectral imagery and the corresponding high-spatial-resolution panchromatic imagery by using the established imagery observation models. On this basis, the inverse issue is solved by using the framework of maximum a posteriori probability, where the trade-off between spatial information enhancement and spectral information retainment from which the traditional pan-sharpening problem suffers is balanced. Li and Yang [25] formulated the pan-sharpening task into a signal restoration problem with sparsity regularization from the views of the compressed sensing problem, where the observation models from high- to low-resolution multispectral imagery and high-resolution panchromatic chromatic imagery were studied using a linear sampling approach. Li et al. [26] learned the dictionaries for high-spatial-resolution panchromatic imagery and low-spatial-resolution multispectral imagery and calculated the high-spatial-resolution multispectral imagery while retaining the spectral information by integrating the obtained sparse coefficients with the dictionary learning theory. As a matter of fact, these methods based on model optimization enable the fused multispectral imagery to enhance the spatial structures while retaining the spectral information. Nevertheless, although they have produced good and robust performances, these methods based on model optimization always rely on prior knowledge, such as the Laplacian [27] or sparsity [28] prior, which is limited for practical applications. Obviously, the restoration performances of these methods based on model optimization might degrade when the prior knowledge does not well match the practical problems. Additionally, the handcrafted features, such as dictionary learning, generally have the limitation of the representative capability, which is also one of disadvantages.
Recent studies have suggested that a convolutional neural network (CNN) has remarkable representation ability for hierarchical pyramid architectures and has demonstrated superior achievements in the computer vision field ([29,30,31,32,33]). The success of convolutional neural network architectures primarily depends on the hierarchical data representation because different representations can entangle and more or less hide the different explanatory factors of variation behind the data [34]. For example, the multi-layer perceptron (MLP) is applied to natural image denoising [35] and denoising after deblurring [36]. In addition, there have been several CNN-based imagery super-resolution reconstruction methods. Dong et al. [36] presented an end-to-end framework for imagery super-resolution reconstruction based on the proposed convolution neural network architecture. The main goal of their developed end-to-end framework is to define the complex mapping between the low-resolution imagery and the high-resolution imagery, and then the fused high-resolution imagery is obtained as the output of the framework. Kim et al. [37] optimized the imagery restoration performance using a developed recursive convolution network, which was deepened without new additional parameters. Similar to the typical encoding–decoding architecture, Mao et al. [38] investigated the relationships between low/high-resolution imagery in imagery restoration using a fully convolutional network to achieve an end-to-end super-restoration recovery task. Tai et al. [39] were devoted to defining a compact deep learning architecture without numerous parameters while increasing the depth, which achieved superior performance. Stimpel et al. [40] used a local linear guided filter to learn end-to-end super-resolution to reconstruct multimodal medical images. Molini et al. [41] fused multiple unregistered images for super-resolution by integrating both spatial and temporal information. Different from other studies, Liu et al. [42] incorporated non-local self-similarity operations, which many classical methods have used, into a recurrent neural network to achieve an image denoising and super-resolution task.
Although many studies regarding pan-sharpening have been conducted in recent years, the robust and efficient fusion of panchromatic and multispectral images is still challenging due to the following aspects. First, although sparse representation-based pan-sharpening methods have appeared and demonstrated superior performance, the handcrafted features are extracted as low-level visual features, which are limited by their representative capability. Second, the potential assumption behind the pan-sharpening methods is that remarkable spectral overlap exists between the corrupted and original imagery. Nevertheless, among a variety of sensors, it is challenging to ensure that the bandwidth range that both the panchromatic and multispectral channels cover is fully overlapped. For instance, for Landsat 8, the bandwidth range of the panchromatic channels is 500–680 nm, while that of multispectral channels covers 430–1380 nm. Hence, a complex fusion process is required to upgrade the spatial details while preserving the spectral information to generate a fused image with high fidelity, which needs to be defined and imitated using a learned highly nonlinear mapping.
To deal with the mentioned challenges from which the state-of-the-art pan-sharpening methods suffer, this study presents a CNN-based pan-sharpening approach for representing the mapping relationships such that a high-spatial-resolution multispectral imagery is produced while maintaining the spectral information. Unlike the hand-crafted features, the proposed CNN-based architecture, designed based on the previous work [43], relies on the hierarchical pyramid structure to combine the low-level visual features with high-level semantic features, thus deriving more representative and robust hierarchical features for reconstructing high-spatial-resolution multispectral images. Moreover, the highly nonlinear fusion process can be effectively simulated by stacking several linear filtering layers, where the loss function between the predicted output and the ground truth is minimized to find the optimal solutions related to all of the involved parameters. As a result, the learned highly nonlinear model can well match the complex mapping relationship [44] between high-spatial-resolution panchromatic and low-spatial-resolution multispectral images to reduce spectral distortion. The contributions of this paper are as follows: (1) To avoid annotating a large-scale dataset and training the network from scratch, the CNN-based pan-sharpening method based on a transfer learning strategy is proposed to produce high-spatial-resolution multispectral imagery while maintaining the spectral information; and (2) both qualitative and quantitative experimental analyses were carried out on images captured from Landsat 8’s on-board operational land imager (LOI) sensor to verify the effectiveness and robustness of the proposed CNN-based architecture. Sensitivity analysis of the involved parameters indicates the effects of parameters on the performance of our CNN-based pan-sharpening approach.
2. Proposed CNN-Based Pan-Sharpening Method
Targeting some problems from which the existing pan-sharpening methods suffer, such as the lack of prominent details and the presence of blurred edges, a pan-sharpening method based on a convolutional neural network model is proposed in this paper. By constructing the highly nonlinear mapping relationships from the convolutional neural network model, the proposed CNN-based architecture greatly enriches the feature dimension of high-resolution image aggregation and then improves the details of the reconstructed image. Unlike the semantic segmentation, where the ground truth can be provided to learn the super parameters in the CNN architectures, the required high-spatial-resolution multispectral imagery is not available. Thus, the important assumption behind the proposed CNN-based pan-sharpening method is that the complex mapping relationship to be learned is identical at a lower- and higher-resolution scale [45]. Before introducing the proposed CNN-based pan-sharpening method, a brief description of the symbols used in this paper is first given to better explain the idea. (size: H × W) denotes the panchromatic imagery, (size: ) denotes the multispectral imagery with S spectral bands, denotes the height of the image, denotes the width of the image, is the resolution ratio between the high-resolution band and the low-resolution band, and S denotes the number of bands.
Figure 1 shows the workflow of the proposed CNN-based pan-sharpening method, which consists of two main parts: The training stage and the testing stage. The training stage is to learn the super parameters in our architecture in a supervised manner, while the testing stage is to produce the high-spatial-resolution multispectral imagery through an average operator over the predicted overlapping image blocks. A more detailed description regarding the proposed CNN-based pan-sharpening method is provided in the following section.
2.1. Pan-Sharpening Structure
As said earlier, the targeted high-spatial-resolution multispectral imagery is unavailable. From the perspective of supervised learning tasks, it is considered as the ground truth for learning the super parameters in the architecture. In our implementation, the input imagery needs to be preprocessed, including low-pass filtering and downsampling, to consider the observed multispectral image as the targeted imagery. As shown in Figure 2, the overall structure of pan-sharpening consists of three parts: Feature extraction, nonlinear mapping relationship construction, and reconstruction. After inputting the low-spatial-resolution multispectral imagery, it is consequently mapped into the high-spatial-resolution one.
- (1)
- Feature extraction. The main task is to extract image blocks overlapping from low-resolution input images and express them with high-dimensional vectors, which is equivalent to convoluting image blocks with a set of filters.
- (2)
- Nonlinear mapping relationship construction. Nonlinear mapping transforms the feature vector of the previous layer from the low-resolution space to the high-resolution space.
- (3)
- Reconstruction. The overlapped high-resolution image blocks are averaged to produce the final image.
During the training procedure, the high-resolution panchromatic imagery is degraded into (size: ), which is the same as the multispectral imagery . Meanwhile, the original multispectral imagery is considered as the targeted imagery. Consequently, the degraded panchromatic imagery and the original multispectral imagery are stacked as the training input data . Both stochastic gradient descent (SGD) and backpropagation (BP) are utilized to iteratively learn all of the parameters (W, b) in the network for optimal allocation.
Indeed, it is a difficult task to train an entire CNN from scratch because annotating a sufficiently large training dataset is remarkably time-consuming and labor-intensive. Moreover, this process will also increase the training time and sometimes even cause the network to not converge for complex tasks. Hence, the idea of transfer learning, where a pretrained model is used as an initialization, is used during training due to its impressive performance. Afterwards, the involved super parameters in the proposed CNN-based pan-sharpening architecture can be finetuned using a stochastic gradient descent algorithm. As a matter of fact, the loss function determines the quality of the proposed CNN-based pan-sharpening architecture, which is usually described by the mean square error function. The optimal solution for the involved super parameter configurations can be automatically generated by minimizing the loss between the output of the network and the ground truth . When the MSE function between a reconstructed image and real image is the smallest, it is advantageous for obtaining not only a higher peak signal-to-noise ratio but also the optimal parameter configurations. Consequently, the loss function is defined as:
where (W, b) is the set of all involved super parameters of the proposed CNN-based pan-sharpening architecture and M represents the number of patches. In our implementation, randomness is alleviated by using a momentum parameter while performing the stochastic gradient descent algorithm. Therefore,
where denotes the momentum and denotes the learning rate. Referring to the previous work [43,46], the number of iterations is always , and we set and , except for the last layer, where we set .
2.2. Resnet-Based Architecture
As described above, nonlinear mapping refers to the process of mapping the extracted feature maps to other high-dimensional feature maps. Better reconstruction results can be achieved by deepening the network layers in the process of nonlinear mapping. However, with the increase of hidden layers, the information transmitted back to the lower layer will become less and less. That is, there will be a gradient explosion or disappearance, which results in the degradation of network performance. Therefore, in our implementation, we use deep residual networks (ResNets) [47] as the basic architecture because they take advantage of the skip connection to effectively address the gradient vanishing problem during training.
For a deeper architecture, a set of layers is directly stacked to learn the desired mapping H(x). As the number of layers increases, the gradient will gradually decrease during training because it is difficult to fit the desired mapping H(x) by allowing a stack of layers. We can use a nonlinear transform function to describe the input and output of a network; that is, the input is X, the output is , and usually includes convolution, activation, and other operations. Instead, it is replaced with F(x) + x by setting a skip connection between the disconnected layers. In this case, the problem is formulated into a residual function F(x) = H(x) − x. As long as F(x) = 0, the desired mapping H(x) is obtained. Figure 3 shows the typical schematic diagram of identify mapping. Consequently, if those layers behind the deep network are identical mappings, then the model degenerates into a shallow network.
Figure 4 presents a flowchart of pan-sharpening fusion through the skip connection during the training step. In our architecture, the total number of layers is L (experimentally set to 11), the lth layer is a combination of filters , where , and one bias vector . and are determined by the specific data, i.e., the input imagery. Note that the rest of the layers are experimentally 64 in quantity, and the size of the filter was set to throughout the network via multiple experiments.
3. Experimentation and Analysis
Both qualitative and quantitative experimental analyses were carried out on images captured from Landsat 8’s on-board operational land imager (OLI) sensor to demonstrate the method’s performance. In this section, a brief description of the experimental dataset and evaluation metric is first given. We investigated the effects of network parameters on the pan-sharpening results to determine the optimal configuration. Finally, quantitative evaluation was conducted on the simulated images, and it is compared with several typical existing pan-sharpening algorithms (i.e., Brovey transform (BT) [48], HIS [7], PCA [8], wavelet decomposition (WD) [49], P + XS [50], and guided filtering (GF) [51] methods) and the PNN method [43], both visually and numerically.
3.1. Experimental Dataset and Evaluation Metric
Landsat 8 orbits the Earth in a near-pole solar synchronous orbit with an altitude of 705 km and an inclination of 98.2 degrees. It circles the Earth every 98.9 minutes and covers it once every 16 days. The satellite is equipped with OLI and TIRS push-broom imagery, which can be used to acquire remote sensing images in visible, near-infrared, and shortwave infrared spectral ranges. The OLI imager follows the technology and experience of an advanced land imager and adopts the push-broom structure design, which grants the OLI imager better geometric stability and better image quality than Landsat 5/7’s imager with the swing-broom structure design. Compared with ETM + the imager of Landsat 7, the OLI imager can obtain 12-bit remote sensing images with higher geometric accuracy and higher signal-to-noise ratio. OLI collects image data from nine spectral bands (in this paper, used as experimental data), while TIRS acquires data for two longwave thermal bands. Table 1 shows the OLI spectral band information, primarily including wavelength and resolution. The OLI Land Imager consists of nine bands with a spatial resolution of 30 meters, including a 15-meter panchromatic band and an imaging width of 185 x 185 km. Moreover, OLI includes all bands of ETM + sensor and readjusts the bands to avoid atmospheric absorption characteristics. The larger adjustment is OLI Band 5 (0.845–0.885 um), which excludes the water vapor absorption characteristics at 0.825 µm. The OLI panchromatic Band 8 band has a narrower band, which can better distinguish vegetation from panchromatic images. In addition, there are two new bands: Blue and short-wave infrared. The former, covering 0.433–0.453 µm, is mainly used for coastal zone observation, while the latter, covering 1.360–1.390 µm, can be used for cloud detection because of the strong absorption of water vapor. Indeed, near-infrared (i.e., band 5) and shortwave infrared (i.e., band 9) are close to the corresponding bands of a moderate-resolution imaging spectroradiometer (MODIS).
Landsat 8 imagery can be easily searched and downloaded from the U.S. Geological service. Figure 5 shows the positions of the experimental data just for visualization from Google Maps (28 September 2016). All of the datasets we downloaded are from 2013–2018 with few clouds, and there are different landcovers in each scene, such as lakes, roads, farmlands, and so on, to demonstrate the effectiveness and robustness of the proposed method, especially at the junctions between landcovers.
For the objective quantitative evaluation of the fusion results in this paper, three evaluation metrics, including spectral angle mapper (SAM) [52], root-mean-square error (RMSE), and Erreur Relative Globale Adimension Nelle de Synthse (ERGAS) [53], are used for quantitative evaluation. More details regarding these evaluation metrics are given as follows:
(1) SAM reflects the similarity of spectral information between two vectors. If two vectors are and , SAM is defined as
where and denote the reference image and the fused image vector of band i, respectively. denotes the inner product, and denotes the vector l2-norm. The ideal value of SAM is 0, indicating that there is no spectral distortion.
(2) RMSE expresses the error between the fused image and the reference image; that is, the smaller the RMSE is, the closer the fused image is to the reference image (as defined in Equation (4)). Ideally, RMSE is 0 if and only if the fused image is identical to the reference image.
where denotes the mean of the image.
(3) Like RMSE, ERGAS is also used to reflect the integrity of spectral information preservation of fusion results, and it is defined as follows:
where the RMSE is defined in Equation (4), denotes the number of the band, denotes the resolution of panchromatic imagery, and denotes the resolution of multispectral imagery. The range of ERGAS values is [0,1]. The smaller the ERGAS value is, the more complete the spectral information of fusion results is, and the higher the quality of fusion results is.
3.2. Implementation
As described earlier, original images are from Landsat 8’s on-board operational land imager (LOI) sensor. In our experimentation, a set of small scenes from the original images are cropped and provided for training, validating, and testing our proposed method. Each scene consists of multispectral and panchromatic data. The multispectral imagery is stored at its original resolution (400 × 400), which needs to be scaled up to the panchromatic resolution (800 × 800) in our task. More specifically, 5000 scenes are cropped as our dataset, where 60% is for training, 30% is for validation, and 10% is for testing. All of the experiments in this paper are conducted on a standard PC with 32 GB of RAM and a quad-core Intel Core i7-4800MQ CPU at 2.70 GHz under Ubuntu 16.04 using TensorFlow [54] in Python. For the computational time, we spend approximately 15 h training our proposed CNN-based architecture, while it takes approximately 26 s on 400 × 400 imagery in the multispectral domain.
3.3. Effects of Network Parameters on the Pan-Sharpening Results
As mentioned earlier, there are numerous involved parameters in the proposed CNN-based architecture, which affects its performance. In this section, some of these primary parameters are studied. In our implementation, the other parameters are fixed when one parameter is investigated. The detailed experimental results are presented as follows.
3.3.1. Role of the Number of Training Epochs in the Pan-Sharpening Results
During training stages, one epoch represents that all samples in the training set have been repeated once. To measure the role of the training epoch number in the pan-sharpening results, in our implementation, it was set to 30, 60, 90, …, 270, and 300 with an increment of 30. Figure 6 shows the performance fluctuation in ERGAS, RMSE, and SAM, suggesting the role of the training epoch number. Note that, for each training epoch number value, we conducted the experiments 50 times, for each of which the associated mean and variance of elevation metrics were calculated to better demonstrate the performance and robustness of the proposed CNN-based pan-sharpening method. From the experimental results, we can first conclude that the performance of the proposed method became gradually better as the number of training epochs increased. Additionally, ERGAS, RMSE, and SAM reached a maximum result at approximately 150 or less training epochs. It should be noted that, after approximately 150 training epochs, all of the evaluation metrics, i.e., ERGAS, RMSE, and SAM, changed only slightly, which suggests that the growing number of training epochs boosts the performance of the proposed CNN-based pan-sharpening method to some extent but not perpetually.
3.3.2. Role of the Number of Training Patches in the Pan-Sharpening Results
Like the training epochs, the training patch number is another important factor during the training stage that affects the performance and robustness of the proposed CNN-based pan-sharpening method. To measure the role of the training patch number in the pan-sharpening result, in our experiments, it was set to 400, 800, 2800, and 3200, respectively, with an increment of 400. Figure 7 shows the performance fluctuation in ERGAS, RMSE, and SAM, suggesting the role of the training patch number. Note that, for each training epoch number value, we conducted the experiments 50 times, for each of which the associated mean and variance of elevation metrics were calculated to better demonstrate the performance and robustness of the proposed CNN-based pan-sharpening method. One conclusion can first be drawn that the robustness and performance of the proposed CNN-based pan-sharpening method are rarely affected by the training patch number. The reason might be that the training procedure only requires a few training samples and that the network hypermeters were just finetuned instead of from scratch (i.e., random initialization). Experiments demonstrated that, for all of the training patch numbers, the performance differences in ERGAS, RMSE, and SAM are less than 0.15, 0.00015, and 0.08, respectively. Moreover, the fluctuation curves of the three metrics go up to the peak value at approximately 1200, and similarly to the training epoch number, the result changes trivially when the number of training patches grows.
3.3.3. Role of the Size of Patches in the Pan-Sharpening Results
To evaluate the effect of the patch size on the proposed CNN-based pan-sharpening architecture, it was set in our implementation to , , , …, . The effect of the size of patches in ERGAS, RMSE, and SAM is summarized in Figure 8. Generally, the larger the size of patches is, the greater the computational complexity is. Therefore, the size of patches should be as small as possible on the premise of guaranteeing the performance. As shown in Figure 8, all of the evaluation metrics and the computational cost were optimal when the size of patches was set to .
3.4. Comparison with Other Existing Methods, Quantitatively and Qualitatively
To further measure and verify the proposed CNN-based architecture, it was compared with other typical existing pan-sharpening algorithms (i.e., Brovey transform (BT), HIS [7], PCA [8], wavelet decomposition (WD) [49], P + XS [50], and guided filtering (GF) [51] methods) and the PNN method [43]. For the traditional pan-sharpening algorithms, we chose them because they or their variations are typical and frequently used methods in the pan-sharpening task, while for the deep learning method, the previous work ([43]) is selected and used because it has a similar structure to ours, but lower than ours. Because the ground truth is absent, the original panchromatic image was spatially decimated, similar to the raw MS images. As a result, the raw multispectral images were used as the ground truth for quantitative comparisons between different methods. As mentioned in Section 3.2, 10% of our dataset was used for testing the proposed CNN-based method. For quantitative analysis, Table 2 summarizes the statistical results among different methods, which are the average values of all test scenes. The best performance is marked in bold font, and the second best is underlined. The experiments suggested that the proposed CNN-based pan-sharpening architecture outperforms other existing methods, with differences in ERGAS, RMSE, and SAM of 0.69, 0.0021, and 0.81 on average, respectively. We can conclude that both the PNN method and ours are superior to other existing traditional methods, which suggests that the CNN-based architecture can better represent the nonlinear mapping relationships between the high-resolution panchromatic imagery and the low-resolution multispectral imagery. Moreover, compared with the PNN method, our proposed method achieves more promising results due to its deeper network structure.
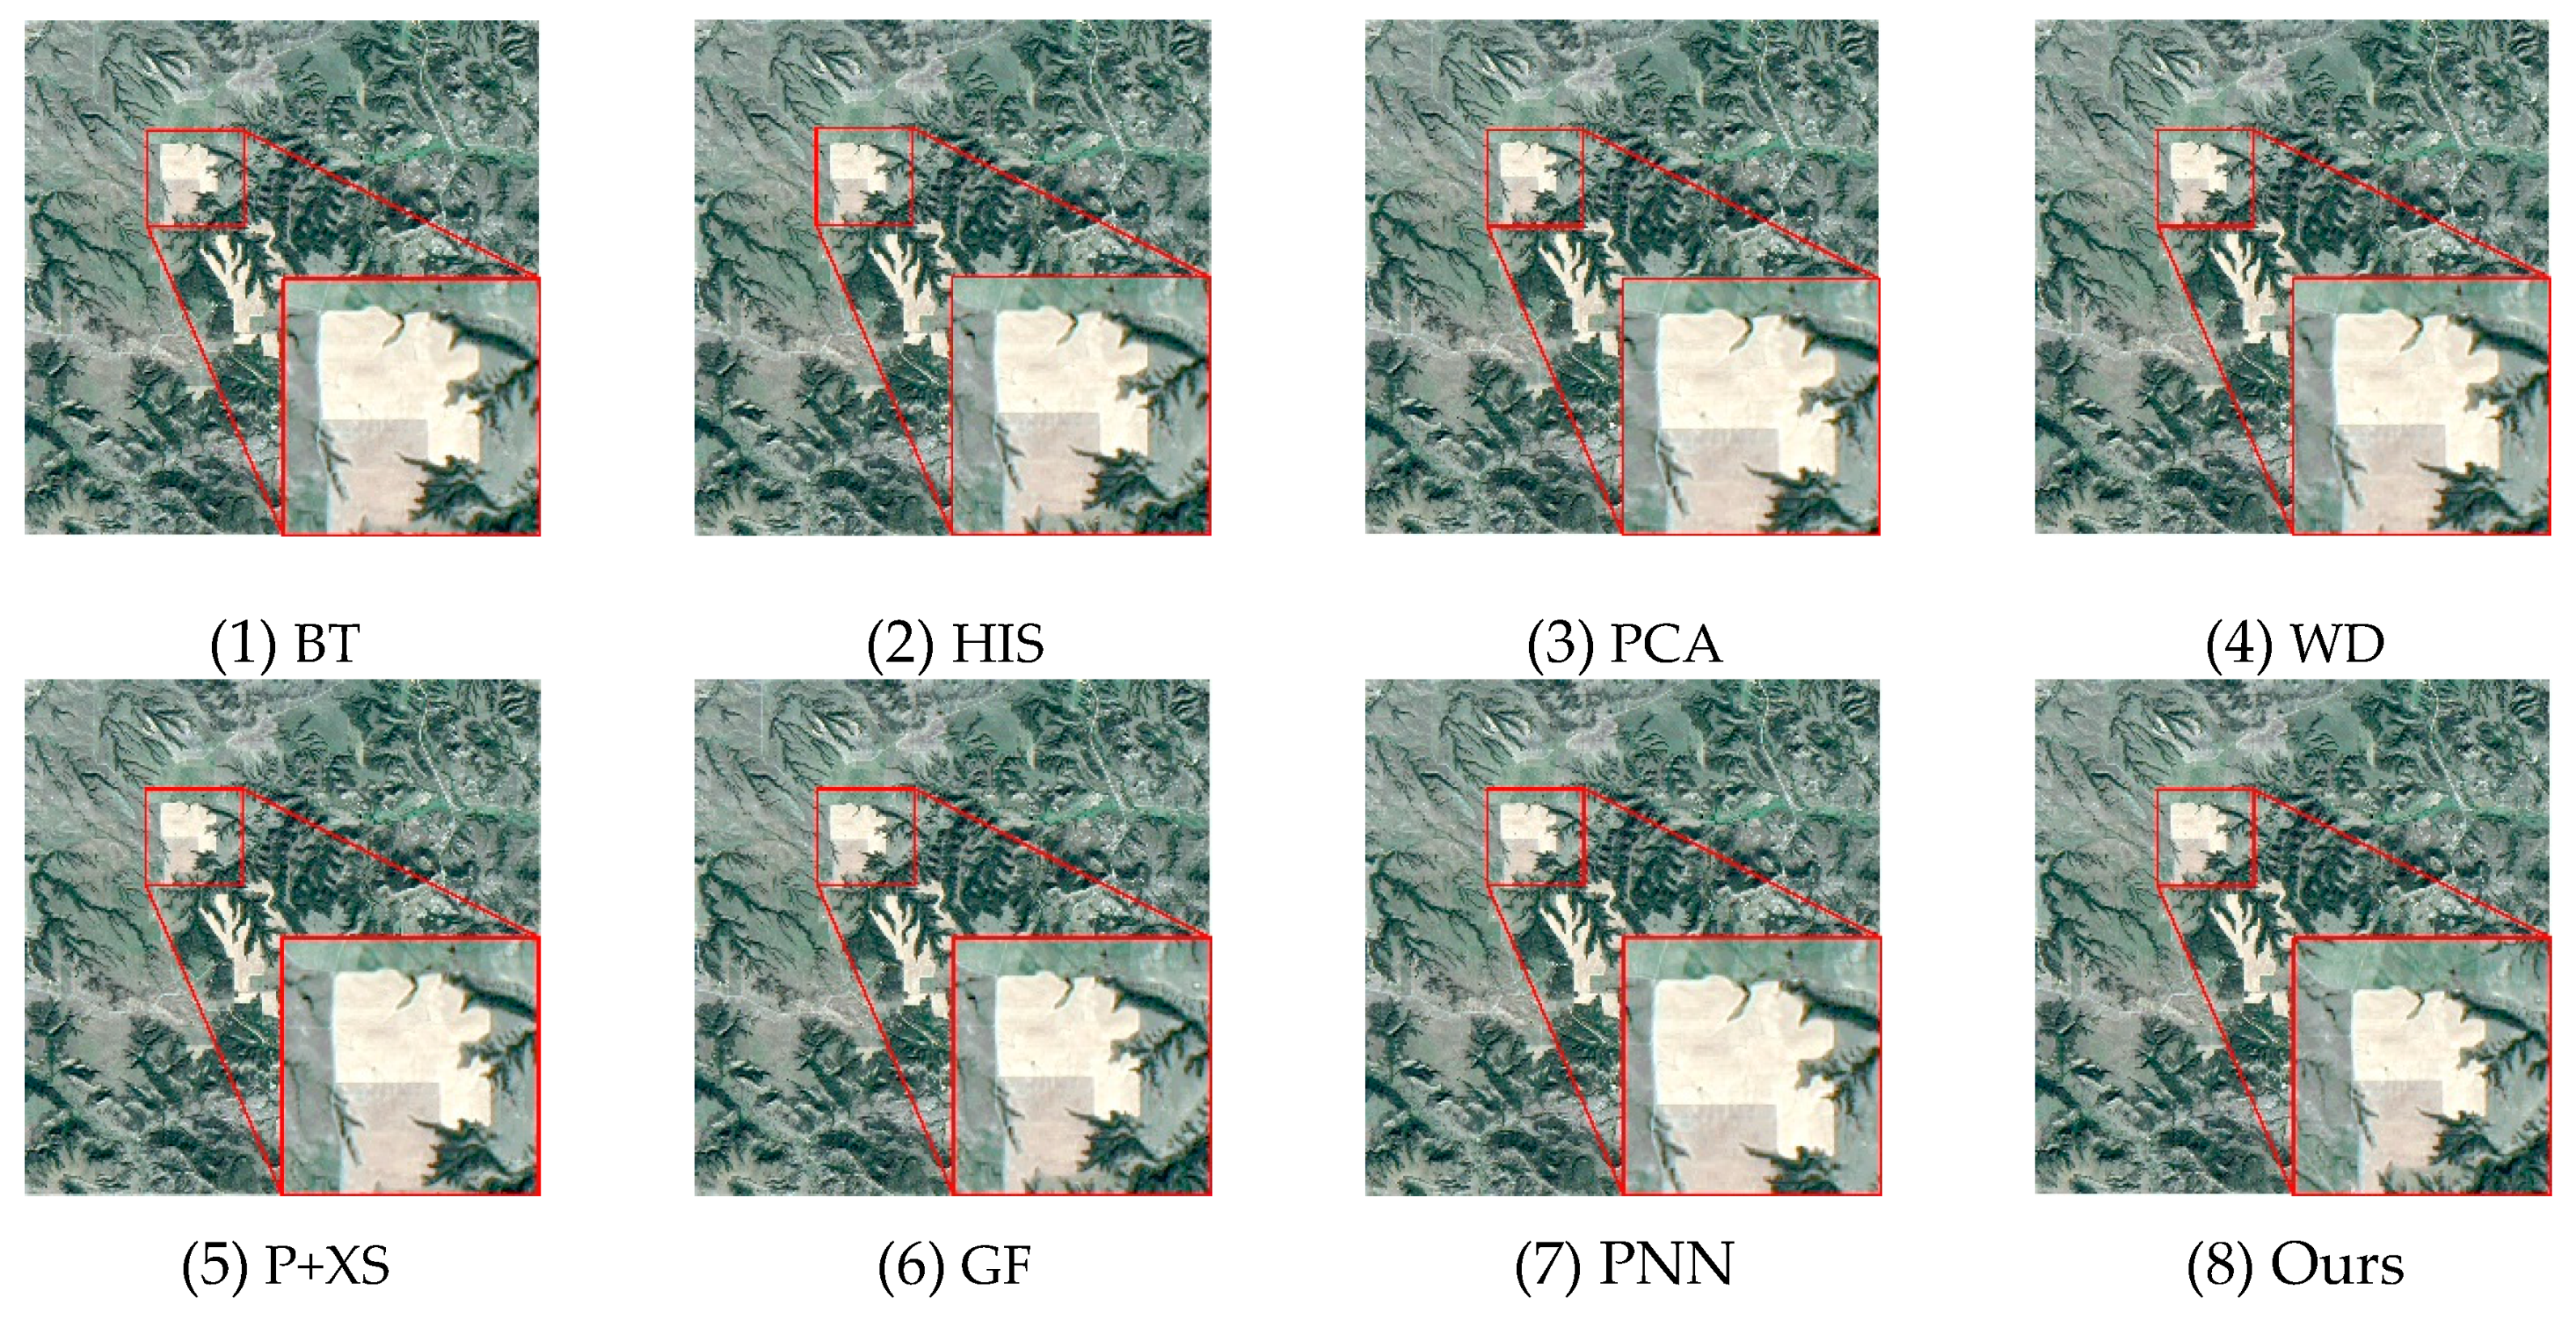
Taking the different landcovers into consideration, we also qualitatively analyze the fused results of different landcovers, such as farmlands, lakes, and roads. Figure 9, Figure 10 and Figure 11 show visual comparisons among different methods for different landcovers. Because there are a number of methods for multispectral imagery visualization and each combination can highlight different properties, Red: Band 4, Green: Band 3, and Blue: Band 2 are selected and used as a band combination for good visualization. In a nutshell, it is apparent that, compared with other typical existing methods, the fusion results derived from the proposed CNN-based pan-sharpening architecture exhibit less spectral and spatial distortion, especially at the junction between different landcovers.
4. Conclusions
Taking the superior performance of the CNN architecture with high learning capacity to form a highly nonlinear transformation into consideration, in this paper, we develop a convolutional neural network (CNN)-based pan-sharpening method for fusing panchromatic and multispectral images to address the spectral and spatial distortions from which the other typical existing pan-sharpening algorithms suffer. In our method, the highly nonlinear fusion process is formulated into the CNN-based nonlinear mapping relationship. The highly nonlinear transformation can be effectively simulated by stacking several linear filtering layers, where the loss function between the predicted output and the ground truth is minimized to find the optimal solutions related to all of the involved parameters. As a result, the CNN-based architecture effectively models the complex mapping relationships between low-resolution and high-resolution multispectral images to reduce spectral and spatial distortion. Experiments were conducted on images captured from Landsat 8’s on-board LOI sensor. The results regarding sensitivity analysis of the involved parameters indicate the effects of parameters on the performance of our CNN-based pan-sharpening approach. Additionally, our CNN-based pan-sharpening approach outperforms other existing conventional pan-sharpening methods with a more promising fusion result, with differences in ERGAS, RMSE, and SAM of 0.59, 0.0019, and 1.08 on average, respectively. However, the proposed method frequently requires much more time in the training stage, which will be solved by parallel computation in our future work. In addition, the fused images will also be used in subsequent applications, such as object classification and change detection.
Author Contributions
Conceptualization, Z.L.; Methodology, Z.L.; Validation, Z.L.; Formal Analysis, Z.L.; Resources, C.C.; Writing—original draft preparation, Z.L.; Writing—review and editing, Z.L. and C.C.; Supervision, C.C.; Project administration, C.C.; funding acquisition, C.C.
Funding
This research was supported by the National Key Research and Development Program of China (Grant No. 2018YFB0505300 and Grant No. 2017YFB0503703) and the National Natural Science Foundation of China (Grant No. 41801301).
Acknowledgments
We greatly appreciate USGS for providing Landsat 8 OLI datasets (https://earthexplorer.usgs.gov/).
Conflicts of Interest
The authors declare no conflicts of interest.
References
- Campbell, J.B.; Wynne, R.H. Introduction to Remote Sensing; Guilford Press: New York, NY, USA, 2011. [Google Scholar]
- Tralli, D.M.; Blom, R.G.; Zlotnicki, V.; Donnellan, A.; Evans, D.L. Satellite remote sensing of earthquake, volcano, flood, landslide and coastal inundation hazards. ISPRS J. Photogramm. Remote Sens. 2005, 59, 185–198. [Google Scholar] [CrossRef]
- Rees, W.G.; Pellika, P. Principles of remote sensing. In Remote Sensing of Glaciers; CRC Press: London, UK, 2010. [Google Scholar]
- Palsson, F.; Sveinsson, J.R.; Ulfarsson, M.O. Multispectral and hyperspectral image fusion using a 3-D-convolutional neural network. IEEE Geosci. Remote Sens. Lett. 2017, 14, 639–643. [Google Scholar] [CrossRef]
- Ding, Z.; Wu, Z.; Huang, W.; Yin, X.; Sun, J.; Zhang, Y.; Wei, Z.; Zhang, Y. A Pan-sharpening method for multispectral image with back propagation neural network and its parallel optimization based on Spark. In Proceedings of the 2017 International Conference on Progress in Informatics and Computing (PIC), Nanjing, China, 15–17 December 2017; pp. 113–118. [Google Scholar]
- Laben, C.A.; Brower, B.V. Process for Enhancing the Spatial Resolution of Multispectral Imagery Using Pan-Sharpening. U.S. Patents 6,011,875, 4 January 2000. [Google Scholar]
- Tu, T.-M.; Su, S.-C.; Shyu, H.-C.; Huang, P.S. A new look at IHS-like image fusion methods. Inf. Fusion 2001, 2, 177–186. [Google Scholar] [CrossRef]
- Kwarteng, P.; Chavez, A. Extracting spectral contrast in Landsat Thematic Mapper image data using selective principal component analysis. Photogramm. Eng. Remote Sens. 1989, 55, 1. [Google Scholar]
- Dong, W.; Xiao, S.; Xue, X.; Qu, J. An Improved Hyperspectral Pansharpening Algorithm Based on Optimized Injection Model. IEEE Access 2019, 7, 16718–16729. [Google Scholar] [CrossRef]
- Aiazzi, B.; Baronti, S.; Selva, M. Improving component substitution pansharpening through multivariate regression of MS + Pan data. IEEE Trans. Geosci. Remote Sens. 2007, 45, 3230–3239. [Google Scholar] [CrossRef]
- Rahmani, S.; Strait, M.; Merkurjev, D.; Moeller, M.; Wittman, T. An adaptive IHS pan-sharpening method. IEEE Geosci. Remote Sens. Lett. 2010, 7, 746–750. [Google Scholar] [CrossRef]
- Yang, C.; Zhan, Q.; Liu, H.; Ma, R. An IHS-Based Pan-Sharpening Method for Spectral Fidelity Improvement Using Ripplet Transform and Compressed Sensing. Sensors 2018, 18, 3624. [Google Scholar] [CrossRef]
- Duran, J.; Buades, A. Restoration of Pansharpened Images by Conditional Filtering in the PCA Domain. IEEE Geosci. Remote Sens. Lett. 2018, 16, 442–446. [Google Scholar] [CrossRef] [Green Version]
- Yin, H.; Li, S. Pansharpening with multiscale normalized nonlocal means filter: A two-step approach. IEEE Trans. Geosci. Remote Sens. 2015, 53, 5734–5745. [Google Scholar]
- Aiazzi, B.; Alparone, L.; Baronti, S.; Garzelli, A.; Selva, M. MTF-tailored multiscale fusion of high-resolution MS and Pan imagery. Photogramm. Eng. Remote Sens. 2006, 72, 591–596. [Google Scholar] [CrossRef]
- Vivone, G.; Restaino, R.; Mura, M.D.; Licciardi, G.; Chanussot, J. Contrast and error-based fusion schemes for multispectral image pansharpening. IEEE Geosci. Remote Sens. Lett. 2013, 11, 930–934. [Google Scholar] [CrossRef]
- Liu, J. Smoothing filter-based intensity modulation: A spectral preserve image fusion technique for improving spatial details. Int. J. Remote Sens. 2000, 21, 3461–3472. [Google Scholar] [CrossRef]
- Kaplan, N.H.; Erer, I. Bilateral filtering-based enhanced pansharpening of multispectral satellite images. IEEE Geosci. Remote Sens. Lett. 2014, 11, 1941–1945. [Google Scholar] [CrossRef]
- Dong, W.; Xiao, S.; Qu, J. Fusion of hyperspectral and panchromatic images with guided filter. SignalImage Video Process. 2018, 12, 1369–1376. [Google Scholar] [CrossRef]
- Li, X.; Cui, J.; Zhao, L. Blind nonlinear hyperspectral unmixing based on constrained kernel nonnegative matrix factorization. SignalImage Video Process. 2014, 8, 1555–1567. [Google Scholar] [CrossRef]
- Simões, M.; Bioucas-Dias, J.; Almeida, L.B.; Chanussot, J. A convex formulation for hyperspectral image superresolution via subspace-based regularization. IEEE Trans. Geosci. Remote Sens. 2014, 53, 3373–3388. [Google Scholar] [CrossRef]
- Wei, Q.; Dobigeon, N.; Tourneret, J.-Y. Fast fusion of multi-band images based on solving a Sylvester equation. IEEE Trans. Image Process. 2015, 24, 4109–4121. [Google Scholar] [CrossRef]
- Wei, Q.; Bioucas-Dias, J.; Dobigeon, N.; Tourneret, J.-Y. Hyperspectral and multispectral image fusion based on a sparse representation. IEEE Trans. Geosci. Remote Sens. 2015, 53, 3658–3668. [Google Scholar] [CrossRef]
- Zhang, L.; Shen, H.; Gong, W.; Zhang, H. Adjustable model-based fusion method for multispectral and panchromatic images. IEEE Trans. Syst. Man Cybern. Part B 2012, 42, 1693–1704. [Google Scholar] [CrossRef]
- Li, S.; Yang, B. A new pan-sharpening method using a compressed sensing technique. IEEE Trans. Geosci. Remote Sens. 2010, 49, 738–746. [Google Scholar] [CrossRef]
- Li, S.; Yin, H.; Fang, L. Remote sensing image fusion via sparse representations over learned dictionaries. IEEE Trans. Geosci. Remote Sens. 2013, 51, 4779–4789. [Google Scholar] [CrossRef]
- Shen, H.; Meng, X.; Zhang, L. An integrated framework for the spatio–temporal–spectral fusion of remote sensing images. IEEE Trans. Geosci. Remote Sens. 2016, 54, 7135–7148. [Google Scholar] [CrossRef]
- Jiang, C.; Zhang, H.; Shen, H.; Zhang, L. Two-step sparse coding for the pan-sharpening of remote sensing images. IEEE J. Sel. Top. Appl. Earth Obs. Remote Sens. 2013, 7, 1792–1805. [Google Scholar] [CrossRef]
- Krizhevsky, A.; Sutskever, I.; Hinton, G.E. Imagenet classification with deep convolutional neural networks. Adv. Neural Inf. Process. Syst. 2012, 1097–1105. [Google Scholar] [CrossRef]
- Oquab, M.; Bottou, L.; Laptev, I.; Sivic, J. Learning and transferring mid-level image representations using convolutional neural networks. In Proceedings of the IEEE Conference on Computer Vision and Pattern Recognition, Columbus, OH, USA, 23–28 June 2014; pp. 1717–1724. [Google Scholar]
- Karpathy, A.; Toderici, G.; Shetty, S.; Leung, T.; Sukthankar, R.; Fei-Fei, L. Large-scale video classification with convolutional neural networks. In Proceedings of the IEEE conference on Computer Vision and Pattern Recognition, Columbus, OH, USA, 23–28 June 2014; pp. 1725–1732. [Google Scholar]
- Ji, S.; Xu, W.; Yang, M.; Yu, K. 3D convolutional neural networks for human action recognition. IEEE Trans. Pattern Anal. Mach. Intell. 2012, 35, 221–231. [Google Scholar] [CrossRef]
- Simonyan, K.; Zisserman, A. Very deep convolutional networks for large-scale image recognition. arXiv 2014, arXiv:1409.1556. [Google Scholar]
- Bengio, Y.; Courville, A.; Vincent, P. Representation learning: A review and new perspectives. IEEE Trans. Pattern Anal. Mach. Intell. 2013, 35, 1798–1828. [Google Scholar] [CrossRef]
- Burger, H.C.; Schuler, C.J.; Harmeling, S. Image denoising: Can plain neural networks compete with BM3D? In Proceedings of the 2012 IEEE Conference on Computer Vision and Pattern Recognition, Providence, RI, USA, 16–21 June 2012; pp. 2392–2399. [Google Scholar]
- Dong, C.; Loy, C.C.; He, K.; Tang, X. Learning a deep convolutional network for image super-resolution. In Proceedings of the European Conference on Computer Vision, Zurich, Switzerland, 6–12 September 2014; pp. 184–199. [Google Scholar]
- Kim, J.; Lee, J.K.; Lee, K.M. Deeply-recursive convolutional network for image super-resolution. In Proceedings of the IEEE Conference on Computer Vision and Pattern Recognition, Las Vegas, NV, USA, 27–30 June 2016; pp. 1637–1645. [Google Scholar]
- Mao, X.; Shen, C.; Yang, Y.-B. Image restoration using very deep convolutional encoder-decoder networks with symmetric skip connections. In Proceedings of the 30th Conference on Neural Information Processing Systems (NIPS 2016), Barcelona, Spain, 5–10 December 2016; pp. 2802–2810. [Google Scholar]
- Tai, Y.; Yang, J.; Liu, X. Image super-resolution via deep recursive residual network. In Proceedings of the IEEE conference on computer vision and pattern recognition, Honolulu, HI, USA, 21–26 July 2017; pp. 3147–3155. [Google Scholar]
- Stimpel, B.; Syben, C.; Schirrmacher, F.; Hoelter, P.; Dörfler, A.; Maier, A. Multi-Modal Super-Resolution with Deep Guided Filtering. In Bildverarbeitung für die Medizin 2019; Springer: Berlin/Heidelberg, Germany, 2019; pp. 110–115. [Google Scholar]
- Molini, A.B.; Valsesia, D.; Fracastoro, G.; Magli, E. DeepSUM: Deep neural network for Super-resolution of Unregistered Multitemporal images. arXiv 2019, arXiv:1907.06490. [Google Scholar]
- Liu, D.; Wen, B.; Fan, Y.; Loy, C.C.; Huang, T.S. Non-local recurrent network for image restoration. In Proceedings of the 32nd Conference on Neural Information Processing Systems (NeurIPS 2018), Montreal, QC, Canada, 3–8 December 2018; pp. 1673–1682. [Google Scholar]
- Masi, G.; Cozzolino, D.; Verdoliva, L.; Scarpa, G. Pansharpening by convolutional neural networks. Remote Sens. 2016, 8, 594. [Google Scholar] [CrossRef]
- Huang, W.; Xiao, L.; Wei, Z.; Liu, H.; Tang, S. A new pan-sharpening method with deep neural networks. IEEE Geosci. Remote Sens. Lett. 2015, 12, 1037–1041. [Google Scholar] [CrossRef]
- Palsson, F.; Sveinsson, J.; Ulfarsson, M. Sentinel-2 image fusion using a deep residual network. Remote Sens. 2018, 10, 1290. [Google Scholar] [CrossRef]
- Dong, C.; Loy, C.C.; He, K.; Tang, X. Image super-resolution using deep convolutional networks. IEEE Trans. Pattern Anal. Mach. Intell. 2015, 38, 295–307. [Google Scholar] [CrossRef] [PubMed]
- He, K.; Zhang, X.; Ren, S.; Sun, J. Deep residual learning for image recognition. In Proceedings of the IEEE Conference on Computer Vision and Pattern Recognition, Las Vegas, NV, USA, 27–30 June 2016; pp. 770–778. [Google Scholar]
- Yuanbo, N. Improved Brovey Transform Image Fusion Method. J. Geomat. 2008, 3, 237. [Google Scholar]
- Nunez, J.; Otazu, X.; Fors, O.; Prades, A.; Pala, V.; Arbiol, R. Multiresolution-based image fusion with additive wavelet decomposition. IEEE Trans. Geosci. Remote Sens. 1999, 37, 1204–1211. [Google Scholar] [CrossRef] [Green Version]
- Ballester, C.; Caselles, V.; Igual, L.; Verdera, J.; Rougé, B. A variational model for P+ XS image fusion. Int. J. Comput. Vis. 2006, 69, 43–58. [Google Scholar] [CrossRef]
- Li, S.; Kang, X.; Hu, J. Image fusion with guided filtering. IEEE Trans. Image Process. 2013, 22, 2864–2875. [Google Scholar]
- Alparone, L.; Wald, L.; Chanussot, J.; Thomas, C.; Gamba, P.; Bruce, L.M. Comparison of pansharpening algorithms: Outcome of the 2006 GRS-S data-fusion contest. IEEE Trans. Geosci. Remote Sens. 2007, 45, 3012–3021. [Google Scholar] [CrossRef]
- Zhang, L.; Zhang, L.; Tao, D.; Huang, X. On combining multiple features for hyperspectral remote sensing image classification. IEEE Trans. Geosci. Remote Sens. 2011, 50, 879–893. [Google Scholar] [CrossRef]
- Abadi, M.; Agarwal, A.; Barham, P.; Brevdo, E.; Chen, Z.; Citro, C.; Corrado, G.S.; Davis, A.; Dean, J.; Devin, M.; et al. Tensorflow: Large-scale machine learning on heterogeneous distributed systems. arXiv 2016, arXiv:1603.04467. [Google Scholar]
Figure 1.
Workflow of the proposed convolutional neural network (CNN)-based pan-sharpening method.
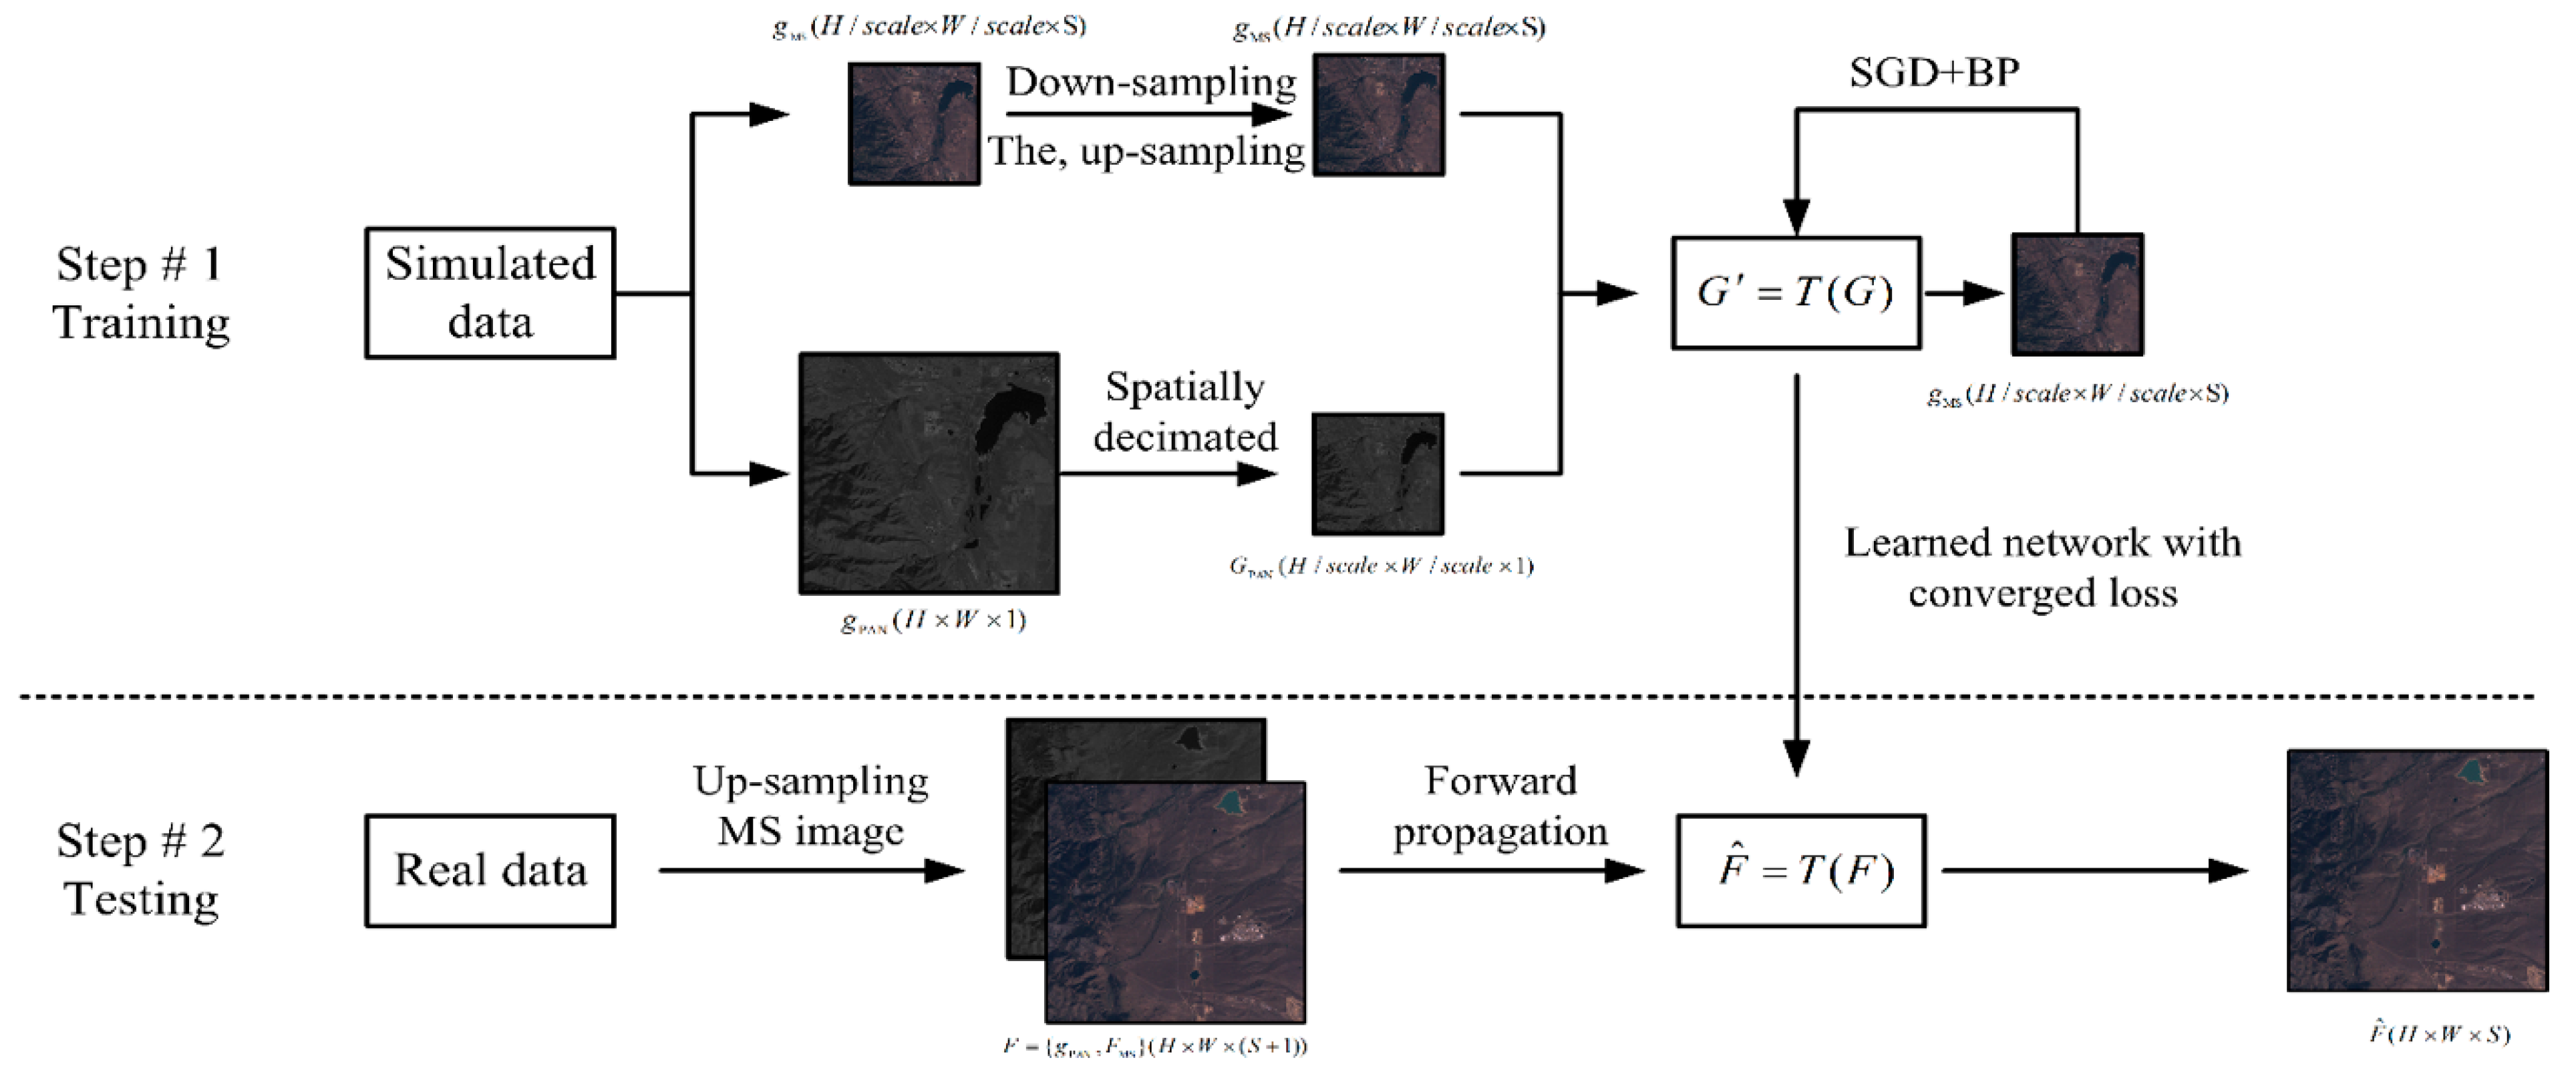
Figure 2.
The overall structure of pan-sharpening.
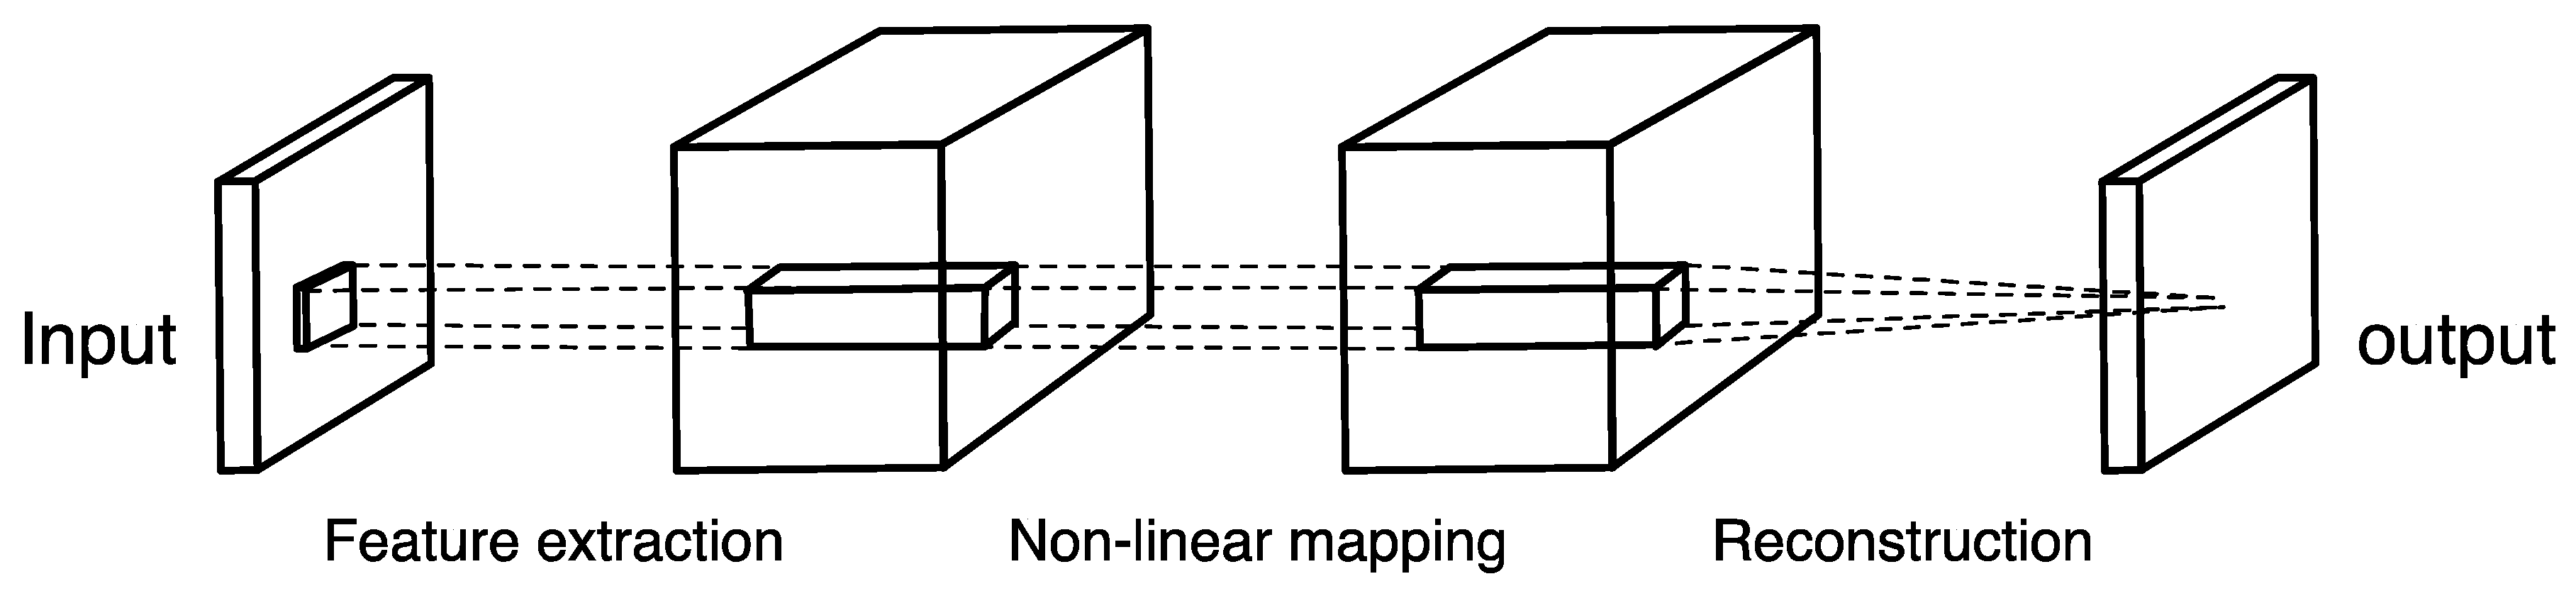
Figure 3.
Schematic diagram of identify mapping.
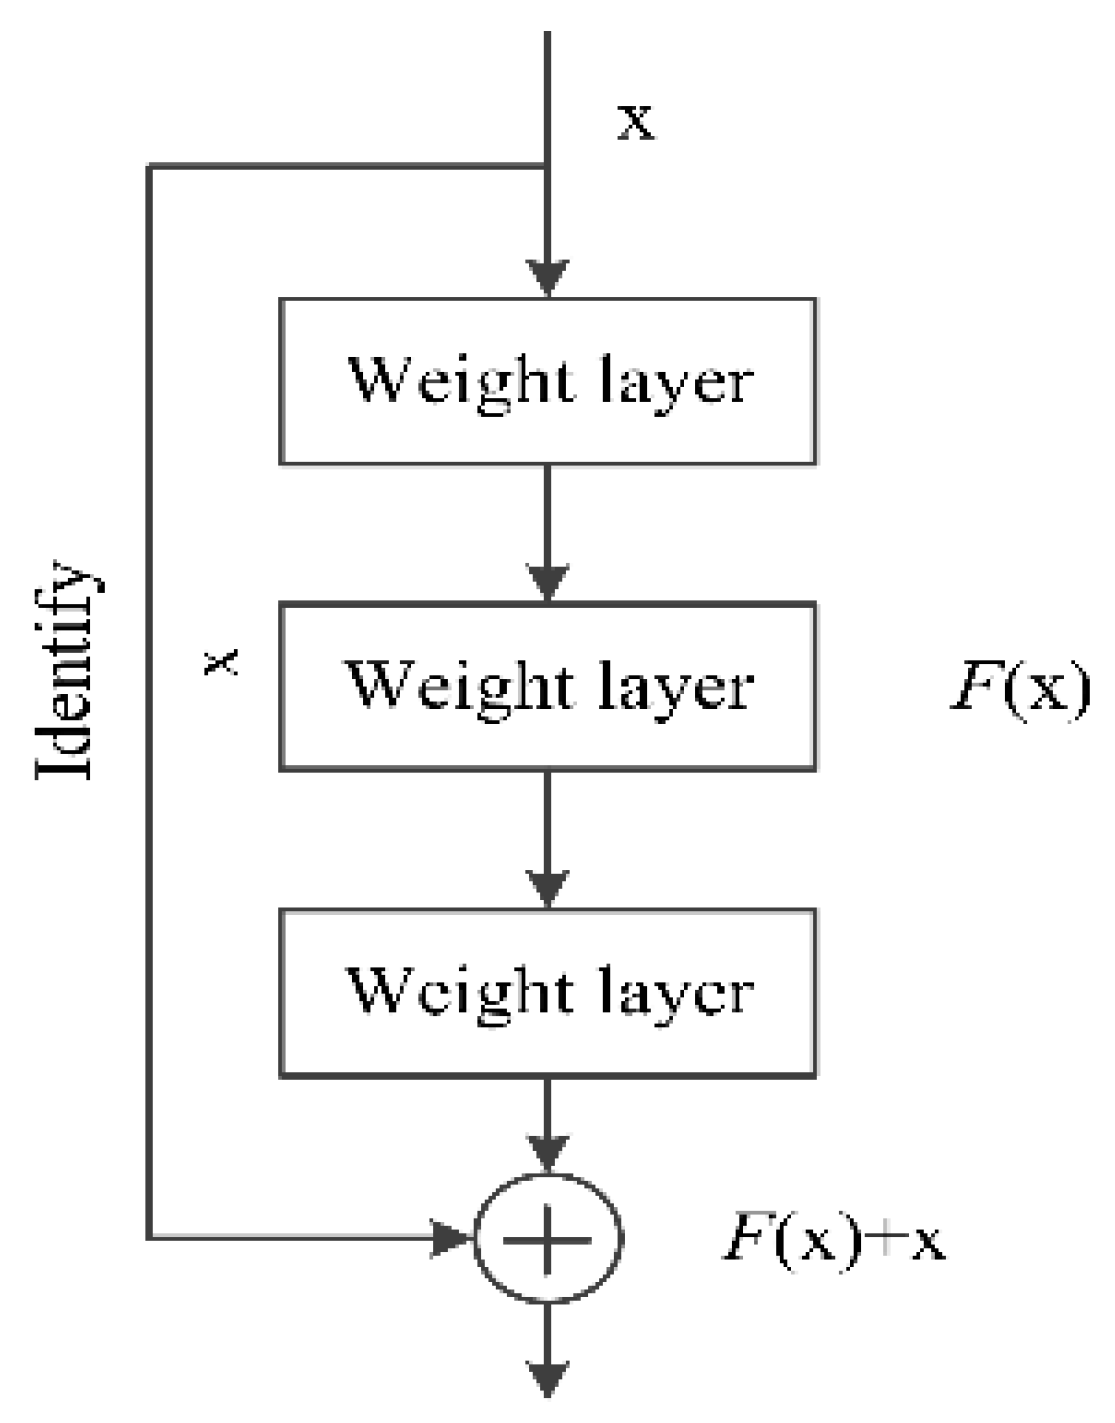
Figure 4.
Fusion diagram through the skip connection during training step.
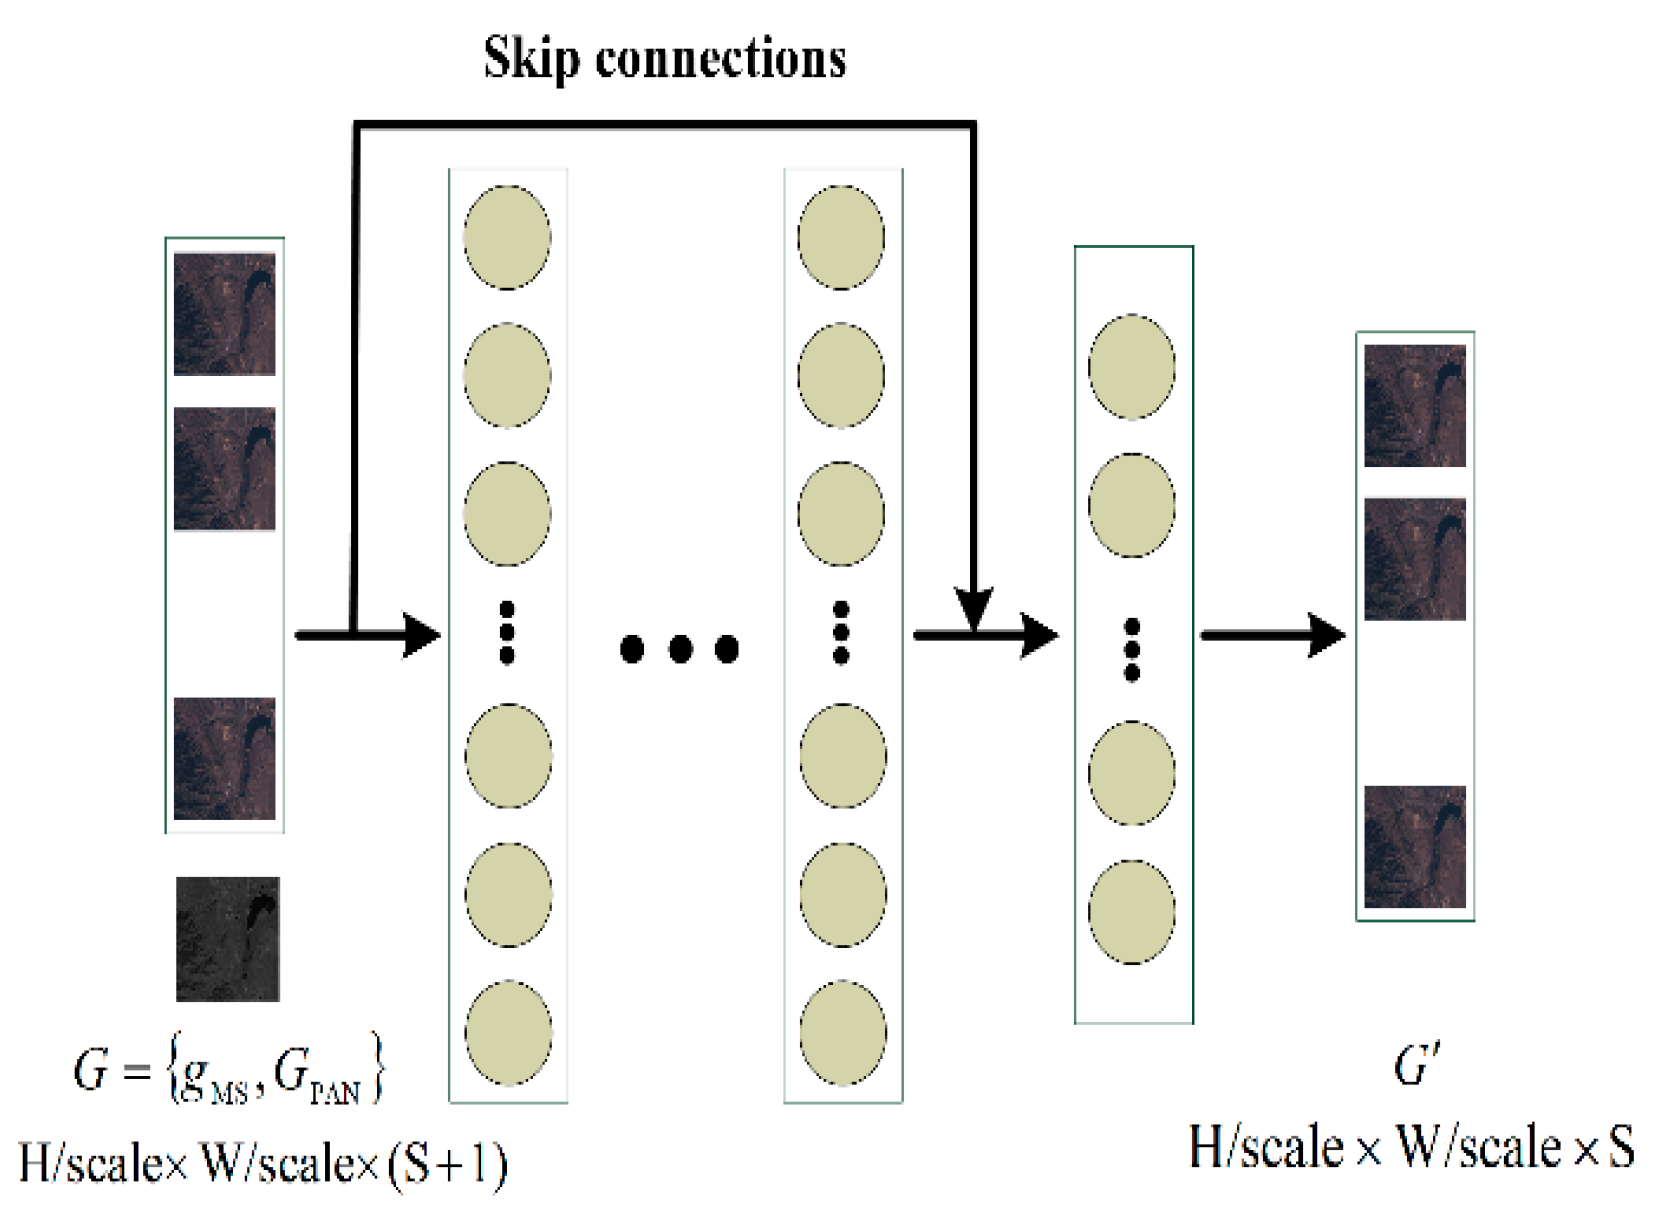
Figure 5.
The positions of the experimental data.
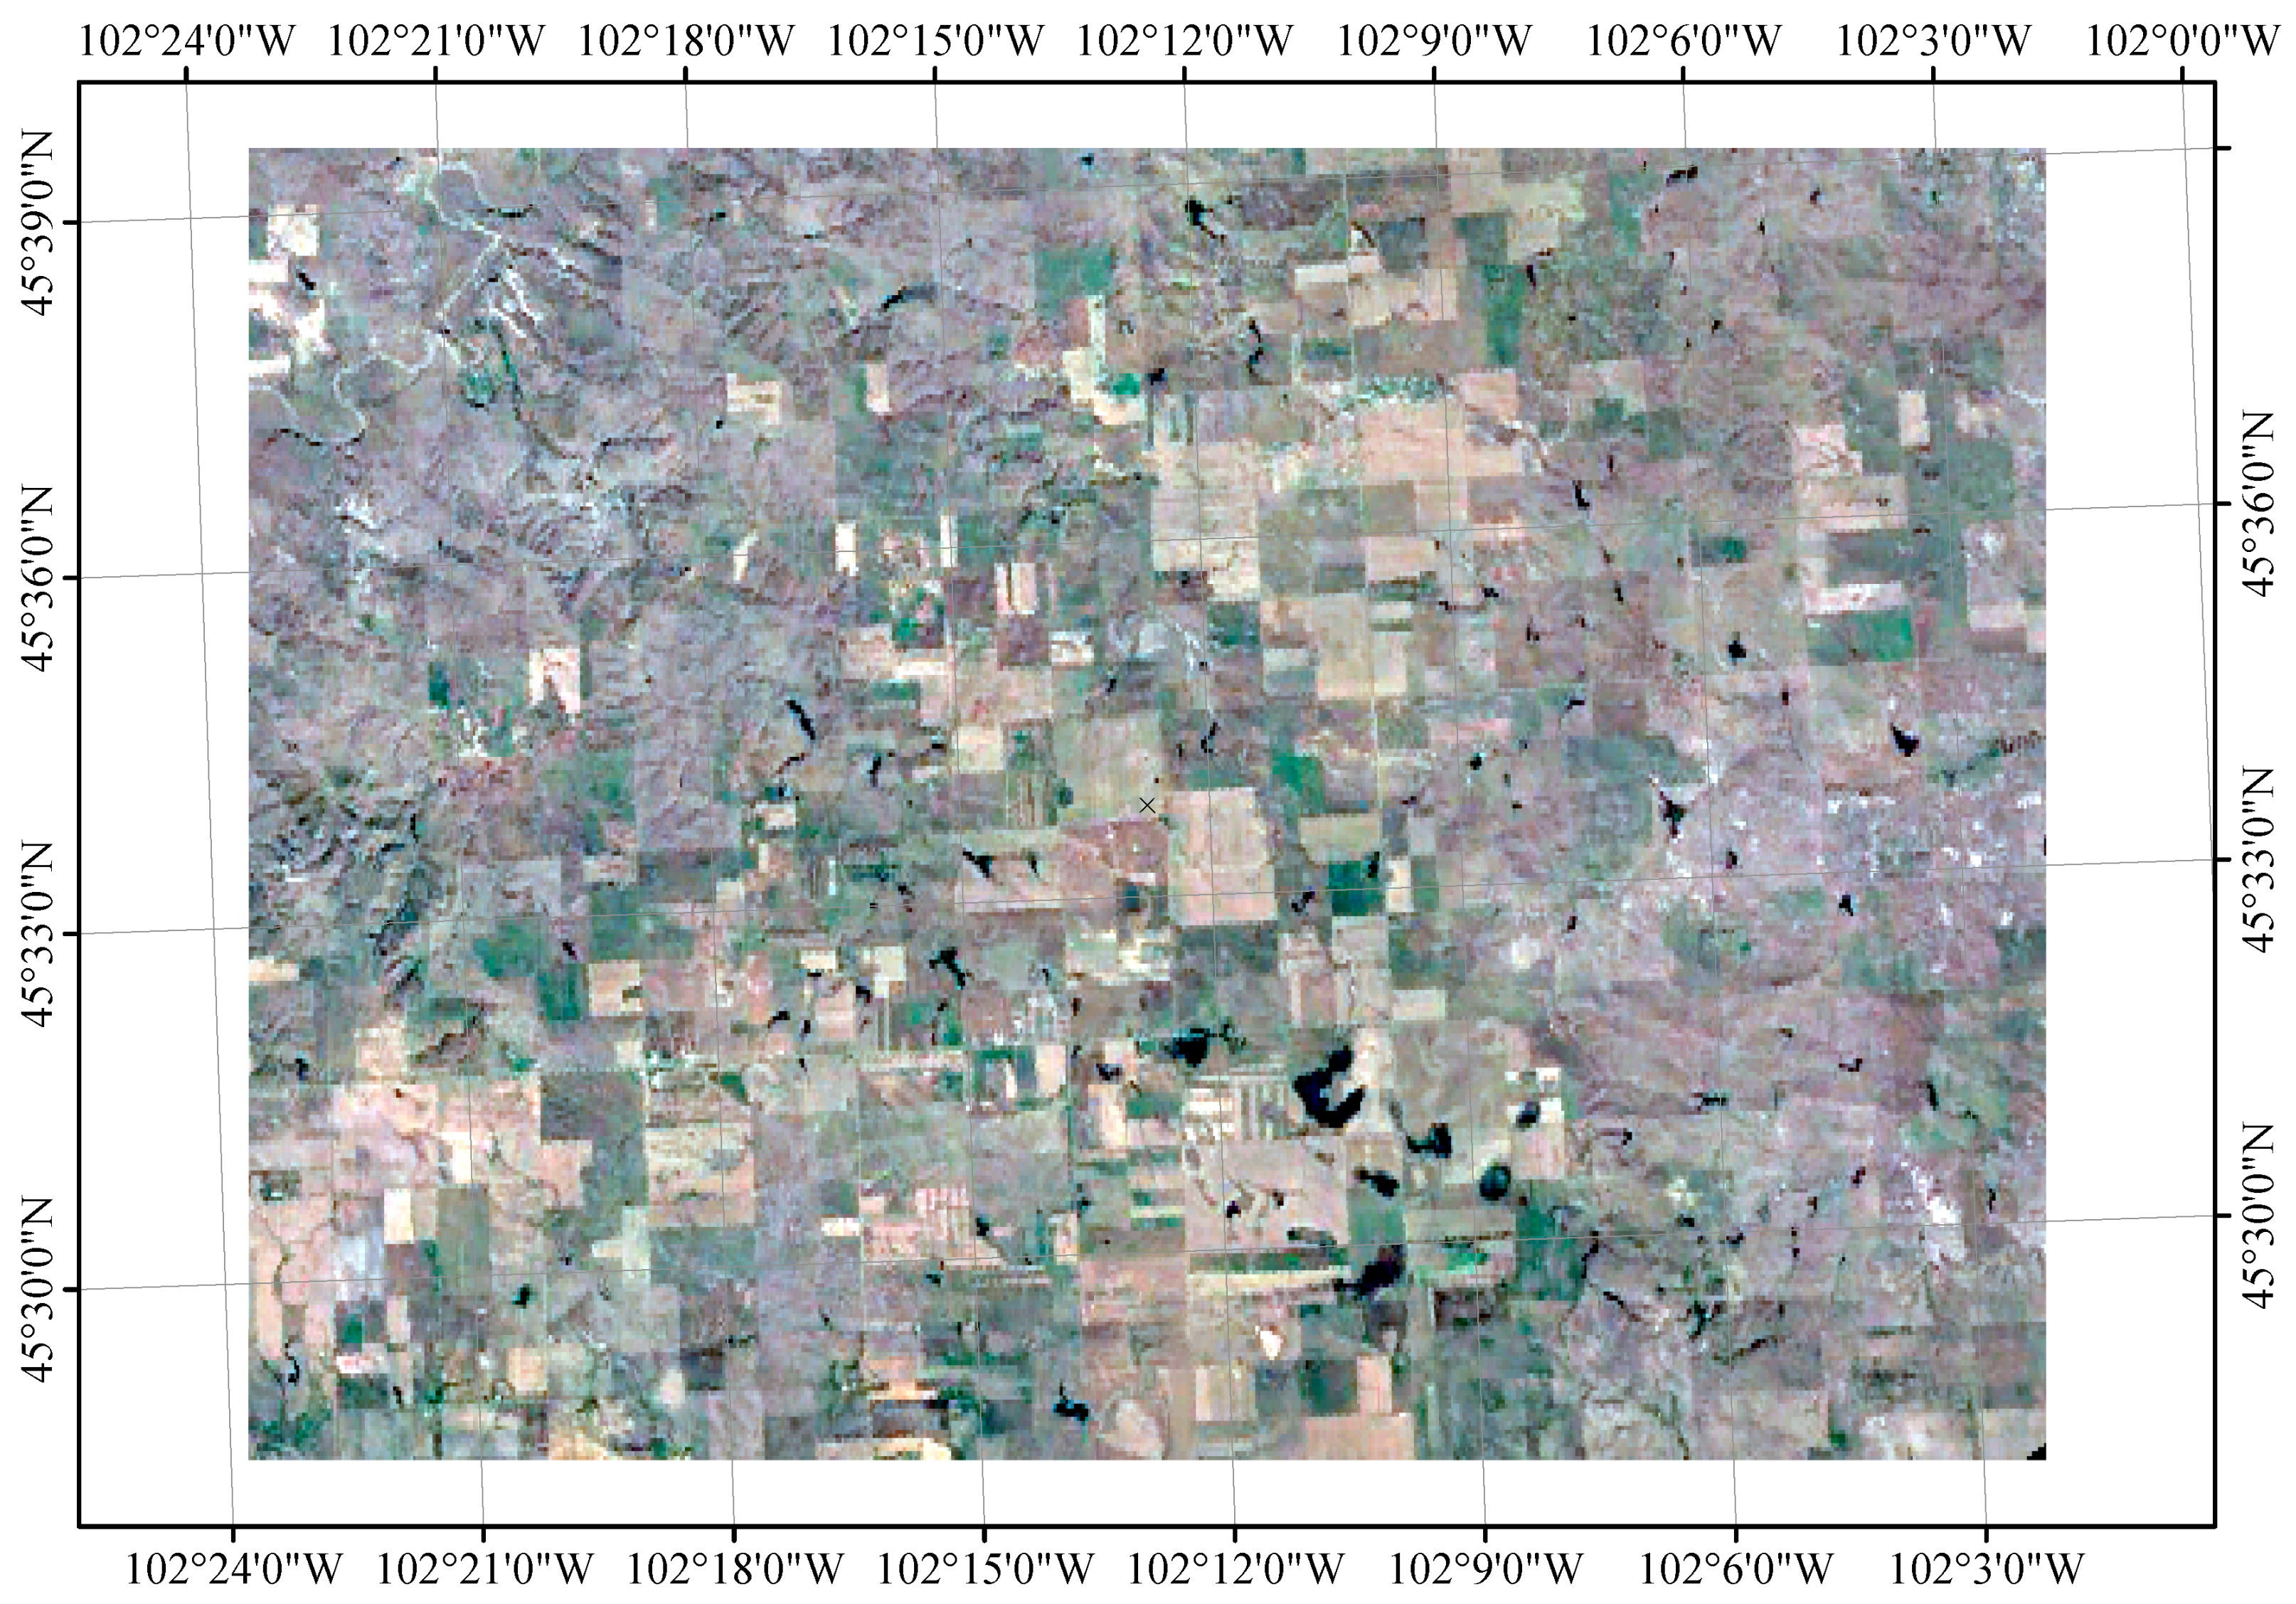
Figure 6.
Role of the number of training epochs in the pan-sharpening results.
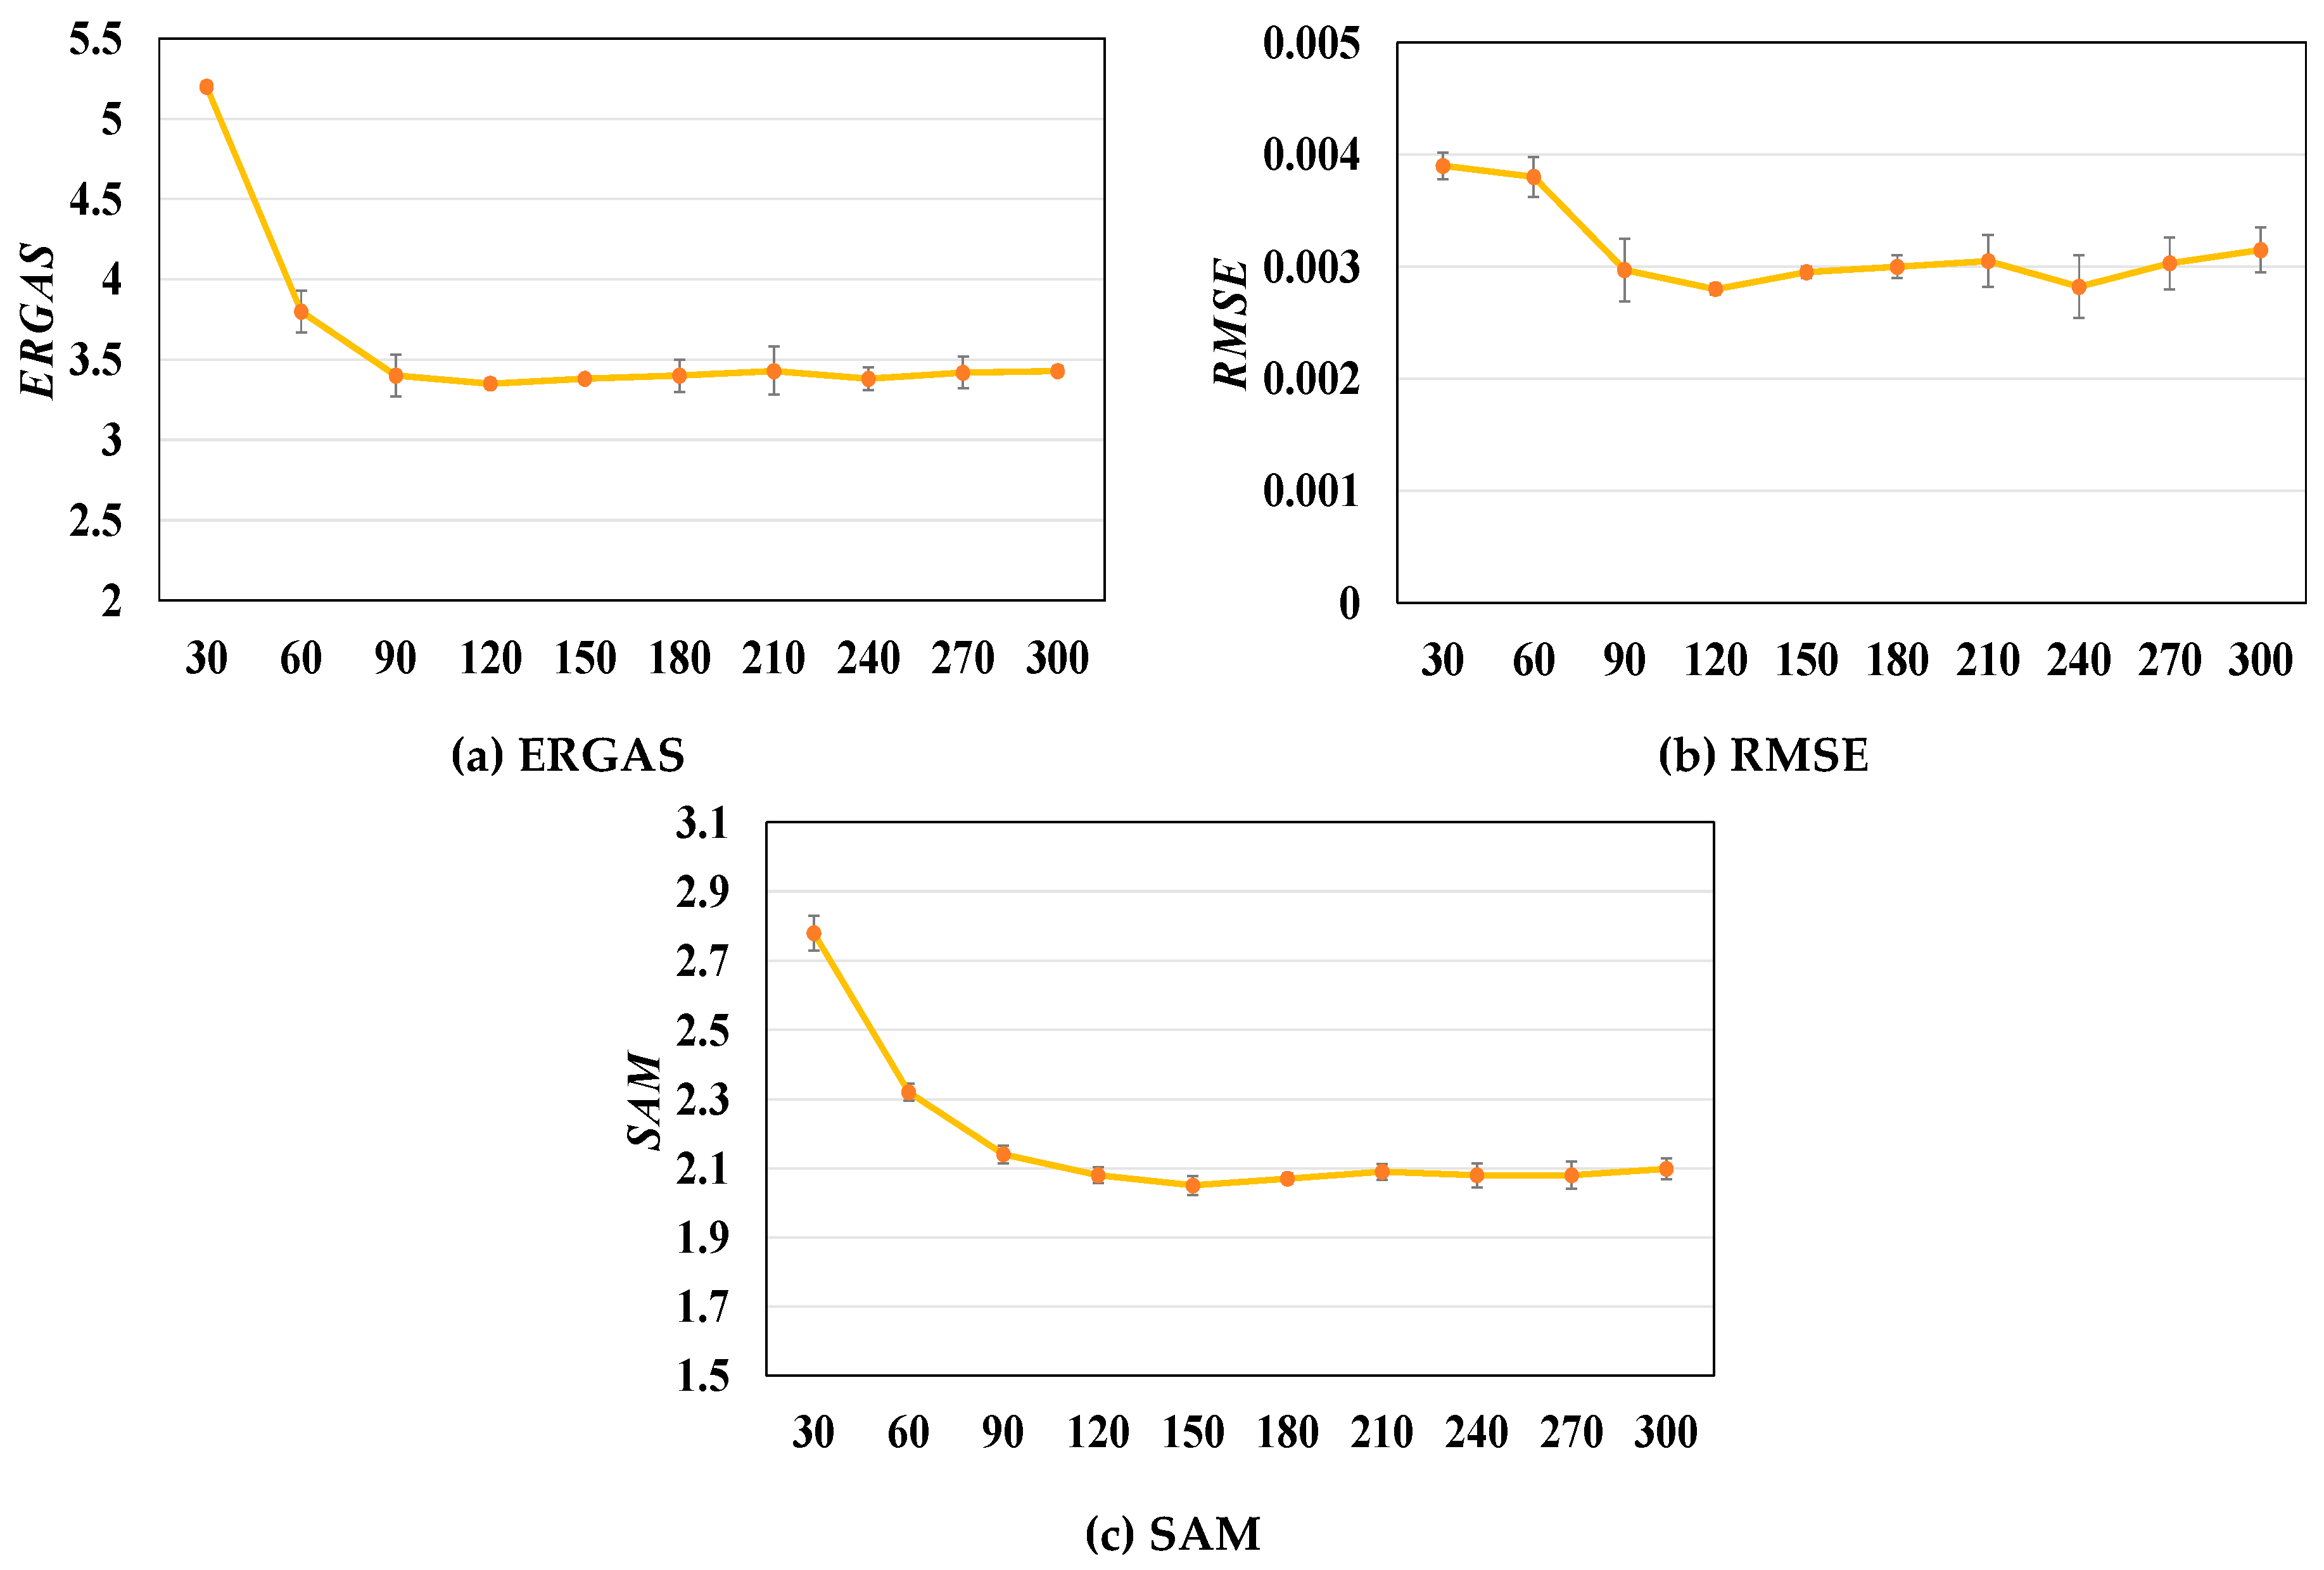
Figure 7.
Role of the number of training patches in the pan-sharpening results.
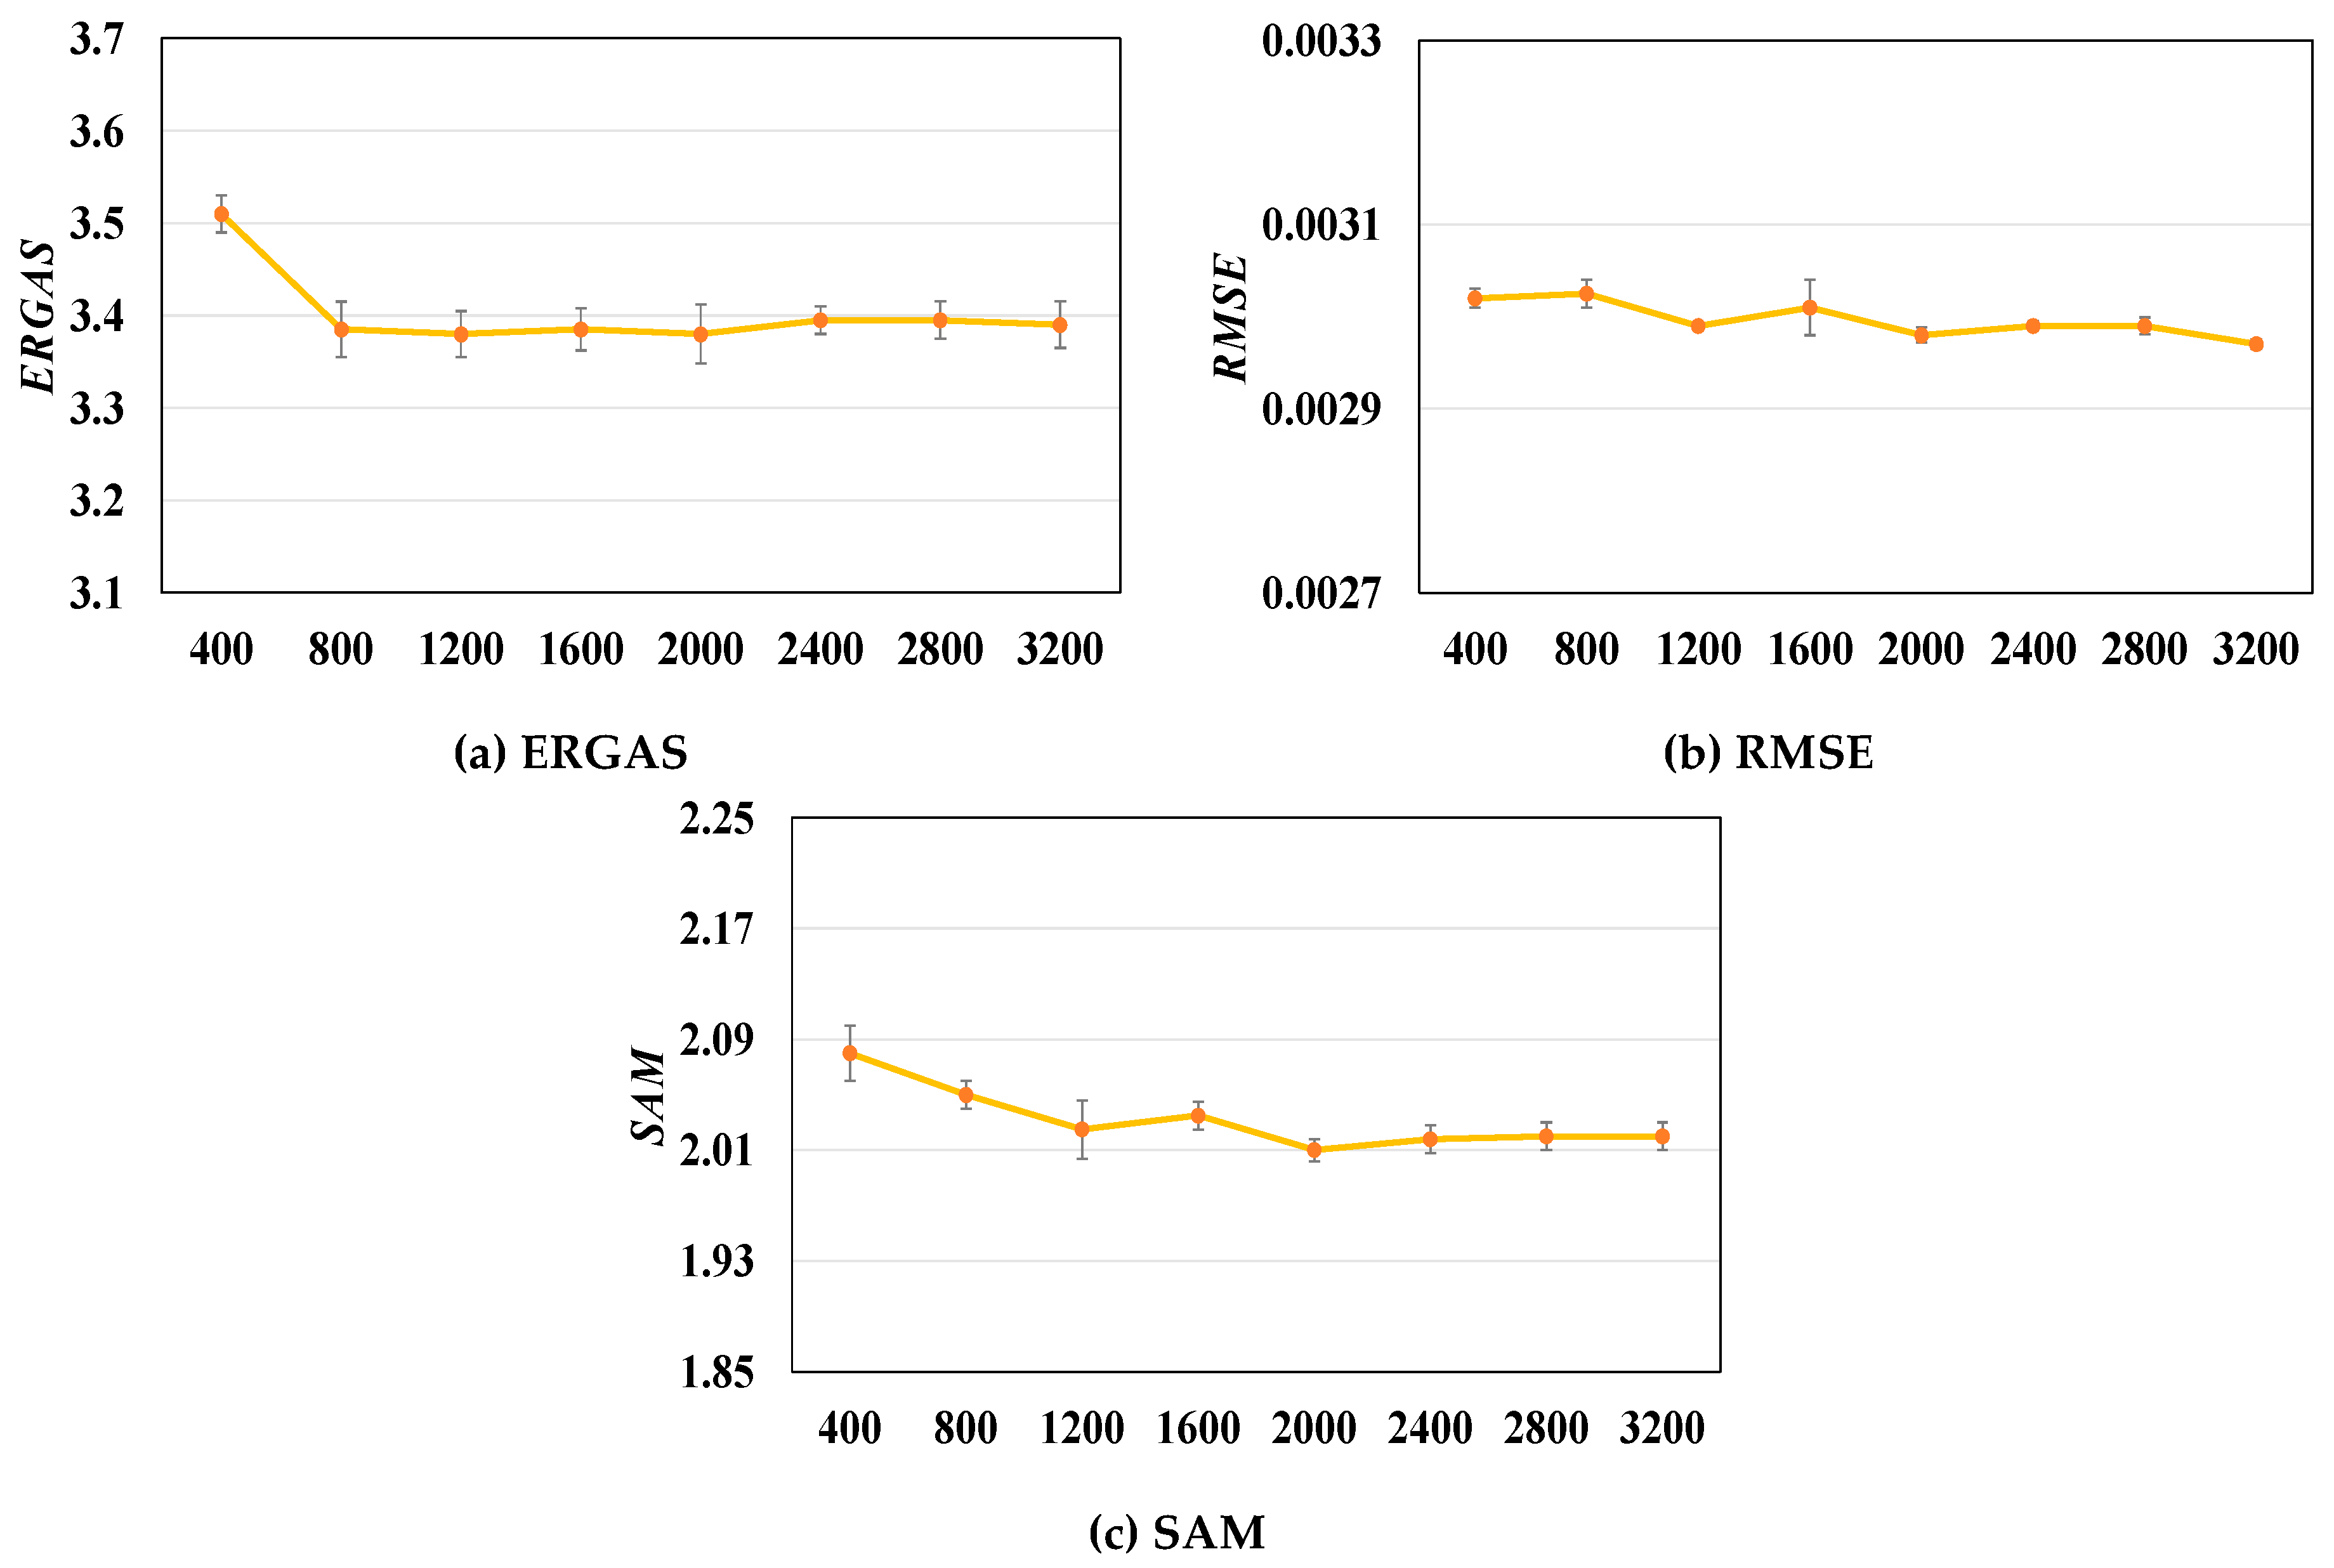
Figure 8.
Role of the size of patches in the pan-sharpening results.
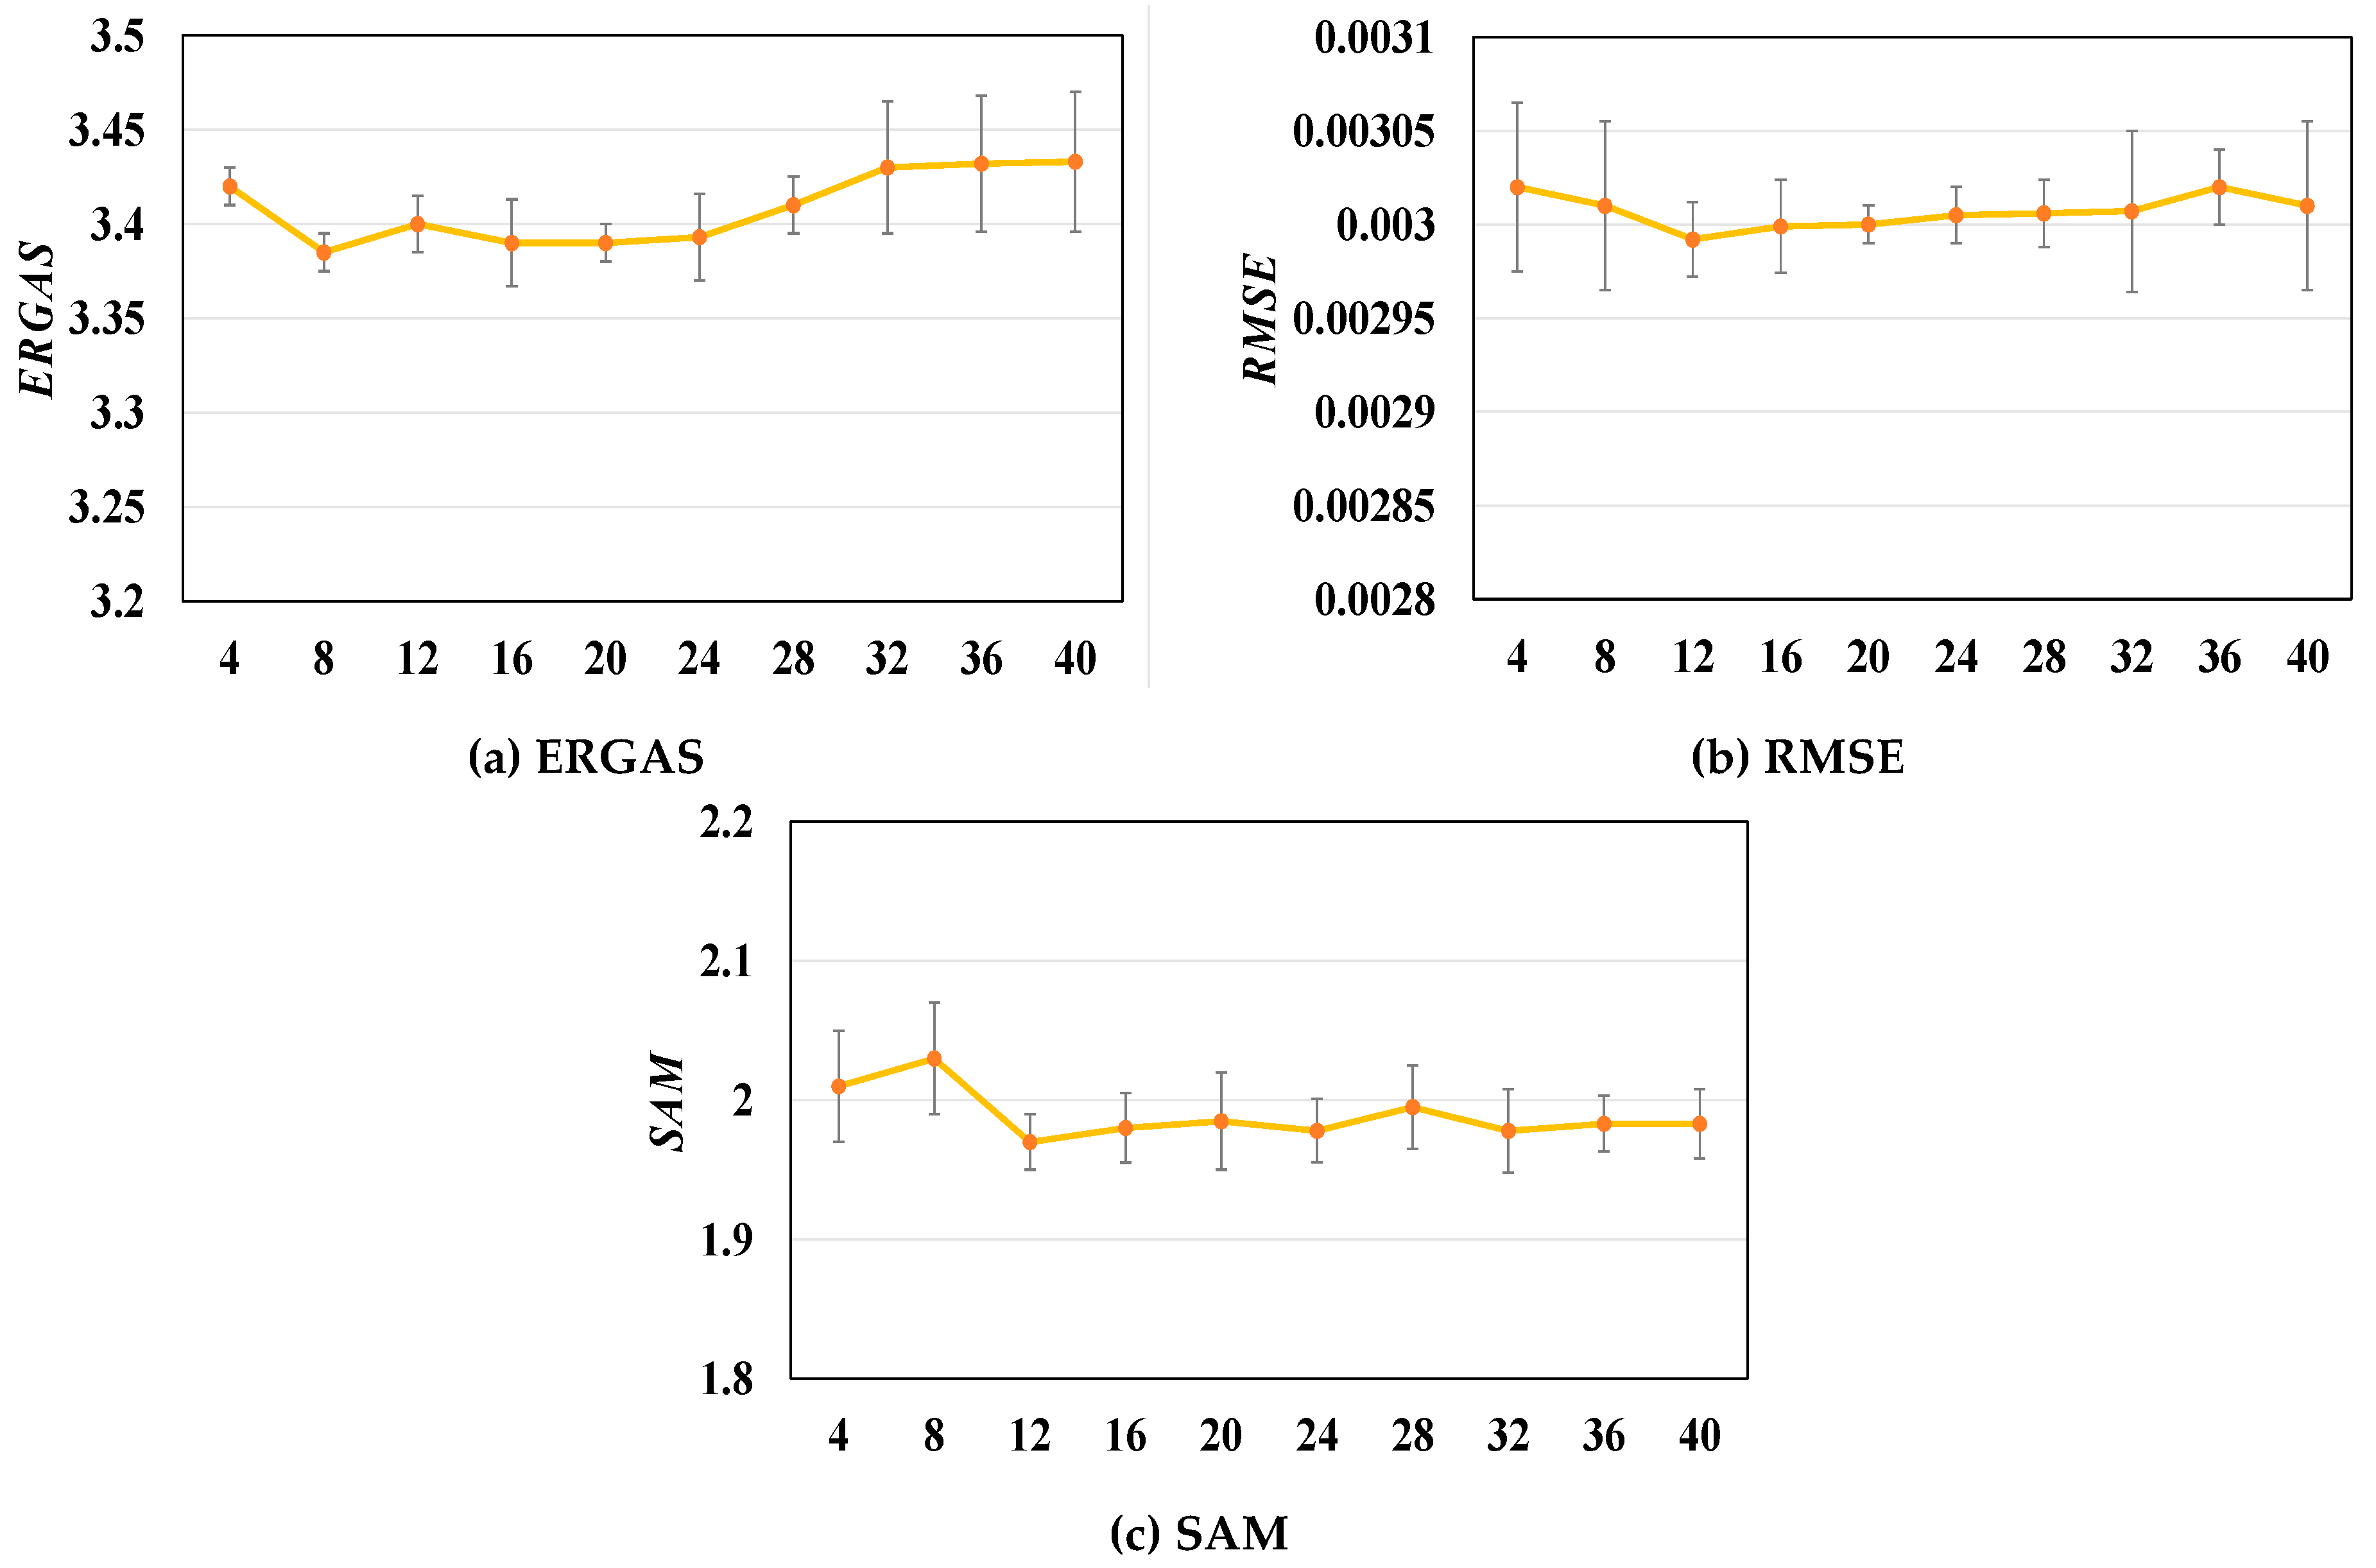
Figure 9.
Detailed results among different methods (Example #1). Parts of experimental results derived from different methods are enlarged for better comparison visualization.
Figure 9.
Detailed results among different methods (Example #1). Parts of experimental results derived from different methods are enlarged for better comparison visualization.
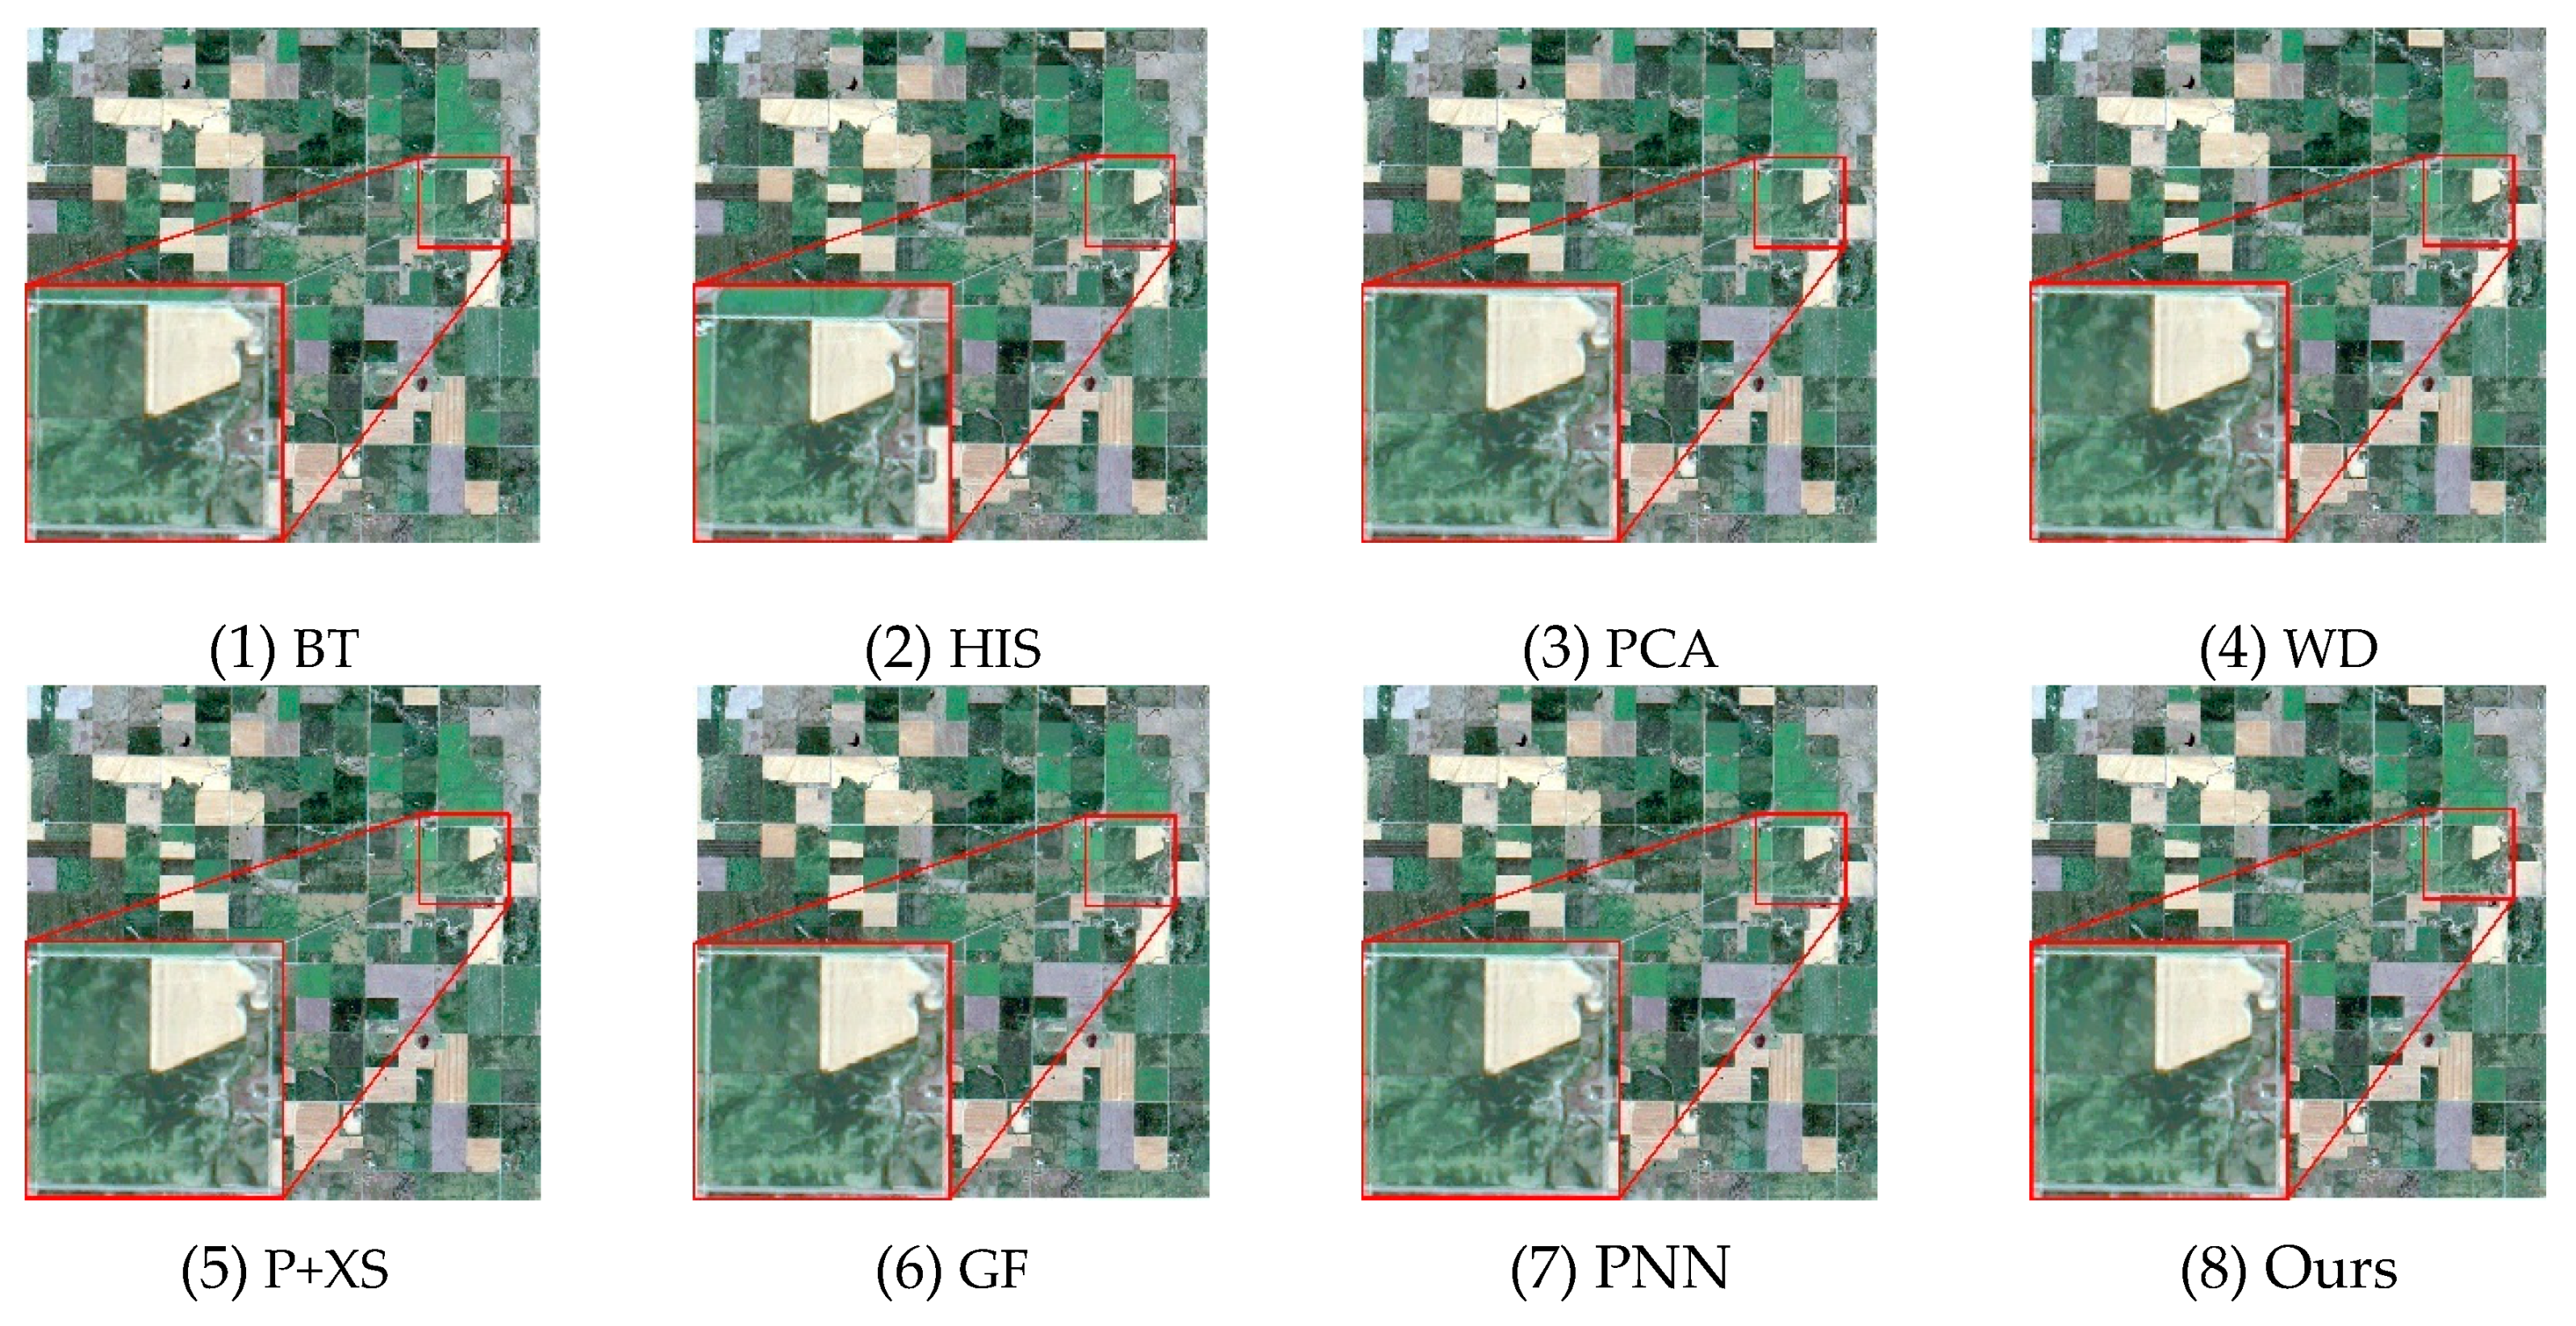
Figure 10.
Detailed results among different methods (Example #2). Parts of experimental results derived from different methods are enlarged for better comparison visualization.
Figure 10.
Detailed results among different methods (Example #2). Parts of experimental results derived from different methods are enlarged for better comparison visualization.
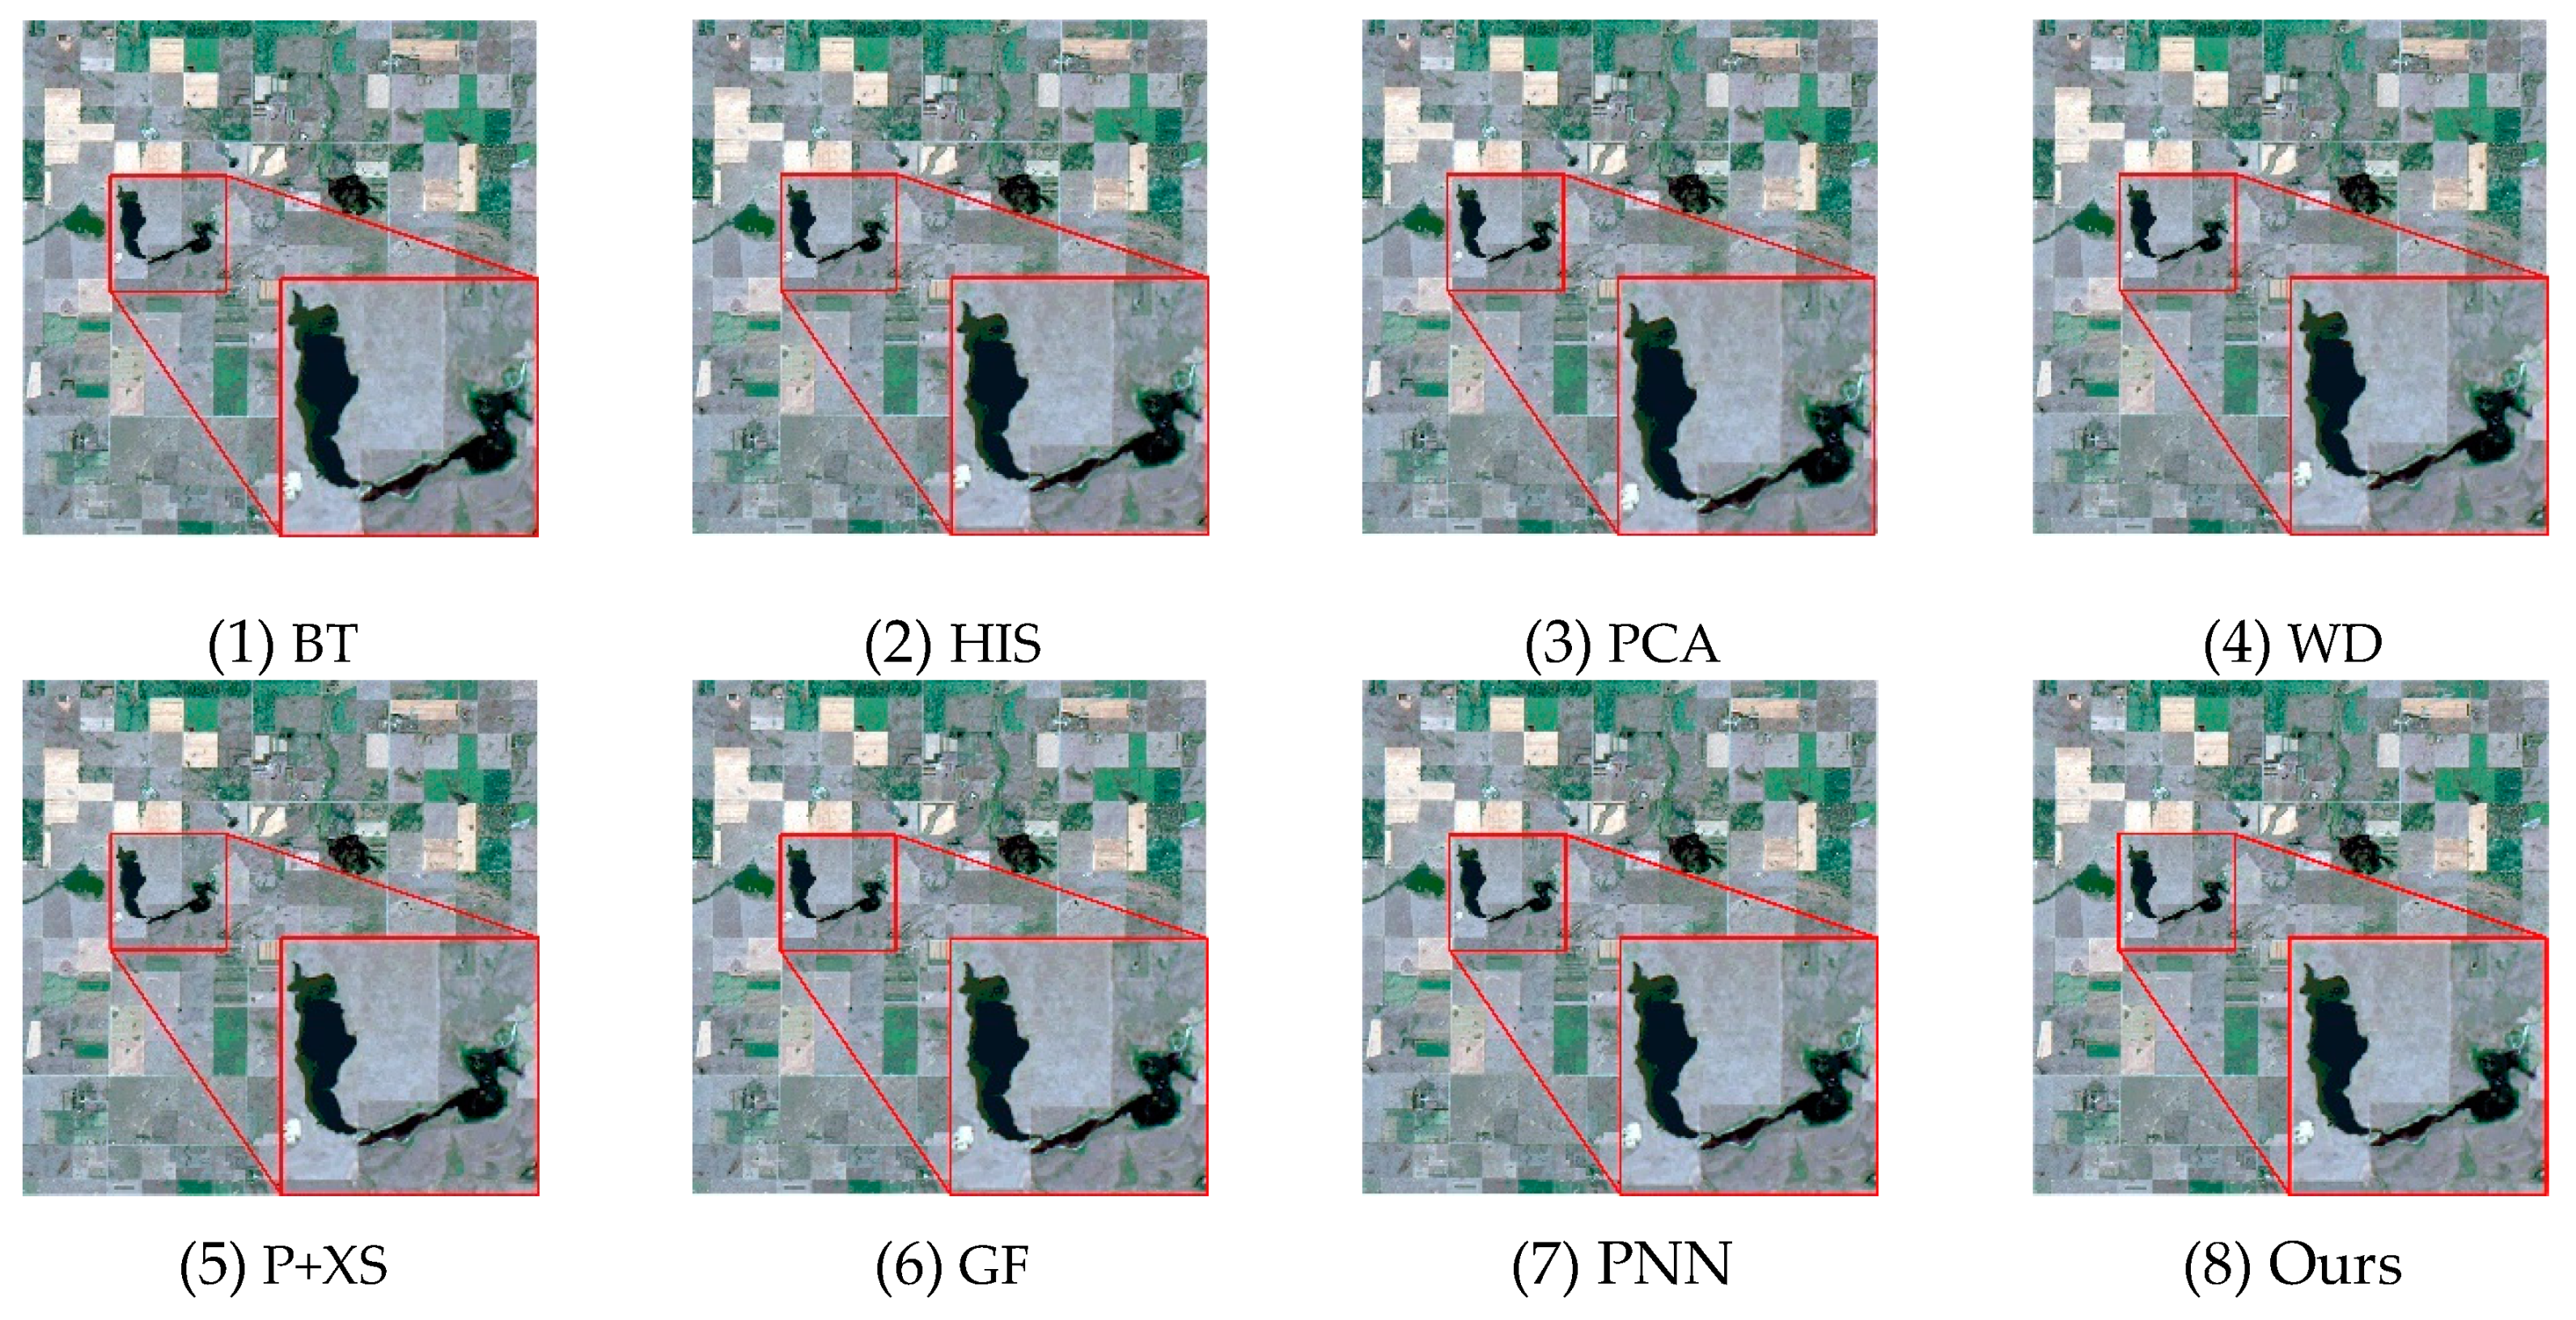
Figure 11.
Detailed results among different methods (Example #3). Parts of experimental results derived from different methods are enlarged for better comparison visualization.
Figure 11.
Detailed results among different methods (Example #3). Parts of experimental results derived from different methods are enlarged for better comparison visualization.

Table 1.
The operational land imager (OLI) spectral band information.
| Spectral Band | Wavelength (nm) | Resolution (m/Pixel) |
|---|---|---|
| Band 1—Coastal / Aerosol | 433–453 | 30 |
| Band 2—Blue | 450–515 | 30 |
| Band 3—Green | 525–600 | 30 |
| Band 4—Red | 630–680 | 30 |
| Band 5—Near-Infrared | 845–885 | 30 |
| Band 6—Short-Wavelength Infrared | 1560–1660 | 30 |
| Band 7—Short-Wavelength Infrared | 2100–2300 | 30 |
| Band 8—Panchromatic | 500–680 | 15 |
| Band 9—Cirrus | 1360–1390 | 30 |
Table 2.
Comparison with other existing methods. The best performance is marked in bold font, and the second best is underlined.
Table 2.
Comparison with other existing methods. The best performance is marked in bold font, and the second best is underlined.
| Methods | ERGAS | RMSE | SAM |
|---|---|---|---|
| BT | 3.531 | 0.0042 | 2.582 |
| HIS | 4.272 | 0.0074 | 3.420 |
| PCA | 4.589 | 0.0059 | 3.842 |
| WD | 3.652 | 0.0050 | 2.745 |
| P + XS | 4.746 | 0.0067 | 3.211 |
| GF | 3.236 | 0.0039 | 2.442 |
| PNN | 3.201 | 0.0036 | 2.299 |
| Ours | 3.199 | 0.0031 | 2.121 |
© 2019 by the authors. Licensee MDPI, Basel, Switzerland. This article is an open access article distributed under the terms and conditions of the Creative Commons Attribution (CC BY) license (http://creativecommons.org/licenses/by/4.0/).
Share and Cite
MDPI and ACS Style
Li, Z.; Cheng, C. A CNN-Based Pan-Sharpening Method for Integrating Panchromatic and Multispectral Images Using Landsat 8. Remote Sens. 2019, 11, 2606. https://doi.org/10.3390/rs11222606
AMA Style
Li Z, Cheng C. A CNN-Based Pan-Sharpening Method for Integrating Panchromatic and Multispectral Images Using Landsat 8. Remote Sensing. 2019; 11(22):2606. https://doi.org/10.3390/rs11222606
Chicago/Turabian StyleLi, Zhiqiang, and Chengqi Cheng. 2019. "A CNN-Based Pan-Sharpening Method for Integrating Panchromatic and Multispectral Images Using Landsat 8" Remote Sensing 11, no. 22: 2606. https://doi.org/10.3390/rs11222606
Note that from the first issue of 2016, this journal uses article numbers instead of page numbers. See further details here.