Sea Ice Remote Sensing Using GNSS-R: A Review


Department of Electrical and Computer Engineering, Memorial University of Newfoundland, St. John’s, NL A1B 3X5, Canada
*
Author to whom correspondence should be addressed.
Remote Sens. 2019, 11(21), 2565; https://doi.org/10.3390/rs11212565
Submission received: 11 October 2019
/
Revised: 27 October 2019
/
Accepted: 30 October 2019
/
Published: 1 November 2019
(This article belongs to the Section Ocean Remote Sensing)
Abstract
:Knowledge of sea ice is critical for offshore oil and gas exploration, global shipping industries, and climate change studies. During recent decades, Global Navigation Satellite System-Reflectometry (GNSS-R) has evolved as an efficient tool for sea ice remote sensing. In particular, thanks to the availability of the TechDemoSat-1 (TDS-1) data over high-latitude regions, remote sensing of sea ice based on spaceborne GNSS-R has been rapidly growing. The goal of this paper is to provide a review of the state-of-the-art methods for sea ice remote sensing offered by the GNSS-R technique. In this review, the fundamentals of these applications are described, and their performances are evaluated. Specifically, recent progress in sea ice sensing using TDS-1 data is highlighted including sea ice detection, sea ice concentration estimation, sea ice type classification, sea ice thickness retrieval, and sea ice altimetry. In addition, studies of sea ice sensing using airborne and ground-based data are also noted. Lastly, applications based on various platforms along with remaining challenges are summarized and possible future trends are explored. In this review, concepts, research methods, and experimental techniques of GNSS-R-based sea ice sensing are delivered, and this can benefit the scientific community by providing insights into this topic to further advance this field or transfer the relevant knowledge and practice to other studies.

1. Introduction
A strong decline of Arctic sea ice has been reported during the last decades [1,2,3], and this phenomenon coincides with global warming [4]. Sea ice plays an important role in maintaining high surface albedo, limiting air-sea interaction [5], and modulating the distribution of freshwater and seawater [6]. Furthermore, sea ice conditions have a direct impact on managing and securing human activities, such as offshore oil and gas development and the global shipping industries [7]. Due to its significant influence on the global climate and human activities, knowledge of sea ice information is critical. However, in situ sea ice measurement is cumbersome and limited in spatial coverage. As an alternative, remote sensing techniques present a more efficient and cost effective method for acquiring sea ice data.
Large-scale sea ice remote sensing data from satellites have been used intensively [8]. Sea ice conditions, such as the extent, drift, growth stage, concentration, and thickness can be estimated from data acquired by passive microwave sensors [9,10,11,12,13], scatterometer [14,15], radar altimeter [3,16,17], and synthetic aperture radar (SAR) [18,19,20]. However, passive microwave and scatterometer data are generally characterized by coarse resolutions (typically 25–50 km). On the other hand, SAR and radar altimeter are able to provide finer resolutions, but their demands in terms of instruments (high power requirements and complex circuit designs) result in high costs. In addition, interpretations of SAR images are typically time-consuming and subjective [20] and the use of empirical retracking has no physical model for altimeter [21].
Since Hall and Cordey proposed the concept of Global Navigation Satellite System-Reflectometry (GNSS-R) in [22], it has been successfully applied to various remote sensing tasks. Currently, GNSS-R is largely utilized to monitor winds and surface roughness over the ocean [23,24,25,26,27,28,29,30]. In addition, observation of cryosphere and land is also being developed. Applications include snow depth estimation [31,32,33,34,35,36] and soil moisture and vegetation sensing [37,38,39,40], respectively. GNSS-R works in a bistatic configuration, in which the transmitter (Tx) and the receiver (Rx) are at different locations. Theoretically, a Tx can be any GNSS satellite such as the Global Positioning System (GPS), GLONASS, Galileo, and Beidou/COMPASS [41,42,43]. After the transmitted signals are reflected by the Earth’s surface, e.g., ocean, land, and ice (thus carrying information about the surface conditions), they will be captured by one or more GNSS-R Rxs. At present, the most used signals are from GPS Txs, which are of L-band wavelength (19 cm). In addition, a GNSS-R Rx is capable of collecting data from several different tracks simultaneously. Furthermore, as a passive instrument, a GNSS-R Rx is typically low-cost, low-mass, and low-power, which allows easy and flexible deployment. According to the platform of Rxs, GNSS-R can be divided into three categories, i.e., spaceborne, airborne, and ground-based. The first type mainly aims at large-scale or global monitoring while the latter two are usually for regional and local observations. Therefore, with multiple GNSS-R Rxs deployed on various platforms, a temporally and spatially intensive coverage at both global and regional scales can be achieved. Take Cyclone GNSS (CYGNSS) system as an illustration: The achieved average revisit time is 4 h [44] and the spatial resolution can be about 10 km for cases of incoherent scattering and about 500 m for coherent cases [45]. Therefore, the spatial resolution of spaceborne GNSS-R is comparable or better than that of radar altimeters (with a nominal circular footprint of 2–10 km in diameter for Envisat or an along-track footprint of 1.65 km × 0.30 km for CryoSat-2 [17]). In addition, the distance between successive CYGNSS measurements is about 6 km. Examples of studies that use different platforms can be found in, e.g., [46,47,48,49,50] for spaceborne, [26,51,52,53] for airborne, and [32,54,55,56,57] for ground-based applications, respectively.
Sea ice remote sensing using GNSS-R was first demonstrated by [58] with an airborne GPS Rx. Since then, several ground-based and airborne experiments have been accomplished with promising results [56,57,59,60,61]. The first spaceborne GNSS-R measurement was carried out during the UK Disaster Monitoring Constellation (UK-DMC) mission in 2004 showing its capability of sea ice remote sensing. With the launch of TechDemoSat-1 (TDS-1, another spaceborne platform carrying a GNSS-R receiver) in 2014, the application of GNSS-R in sea ice sensing has been rapidly developed by e.g., [62,63,64,65,66,67,68,69,70]. In this paper, the techniques of sea ice remote sensing using GNSS-R are reviewed. The aim of this review is to provide a comprehensive comparison among different techniques and investigate remaining challenges. Considering the richness of studies using different platforms, specifically, the limited amount of available data and experiments performed by airborne and ground-based platforms relative to spaceborne platforms, the focus of this paper is on the progress in spaceborne applications. The remainder of this paper is organized as follows: Section 2 contains a review of sea ice sensing applications based on the spaceborne instruments. Section 3 presents a summary of airborne and ground-based experiments. Section 4 concludes with an overview of current work and future prospects.
2. Spaceborne Applications
2.1. Preliminary Investigation in Sea Ice Sensing
The first acquisition of a GNSS-R signal from space was performed by the UK-DMC satellite, and its application for sea ice sensing was demonstrated by [71,72,73]. Two sets of measurements were acquired, one on 4 February 2005 off the coast of Alaska with a total of 7-s data, and the other on 23 June 2005 near Antarctica in the Southern Ocean with an additional 9-s of data. Referred to in situ sea ice validation data, the first measurement was obtained from a region in which 90% of the area is covered by first-year sea ice of 30 to 70 cm thick. For the second collection, the sea ice concentration (SIC) was between 70% and 90%. Compared to the acquired GNSS-R signals from 23 June, the data collected on 4 February showed stronger peak and less spreading in the delay-Doppler map (DDM). Their differences illustrated that the rough seawater surface could decrease the overall coherent specular reflection and lead to a larger glistening zone, which corresponds to a DDM with more spreading along delay and Doppler axes. A comparison of the DDMs from regions of varying SICs is shown in Figure 1. Although the available GNSS-R data were limited, the analysis indicated the viability of observing ice-covered regions using spaceborne GNSS-R. In addition, the varying signal power and extent of spreading in delay and Doppler associated with different SIC values demonstrated the potential of GNSS-R for SIC estimation. It was also mentioned in [72] that for a coherent signal to be reflected off the ice surface, the carrier phase information can be recovered for accurate altimetry measurement.
Following the launch of TDS-1 in 2014, millions of GNSS-R DDM data have been available to the public, and this offers an opportunity for researchers to advance the initial achievements made by [72]. Some of the earliest experiments of TDS-1 DDM data for sea ice sensing include [62,65,66,67,68,69]. Existing studies mainly focus on sea ice detection, SIC estimation, ice type classification, sea ice thickness (SIT) retrieval, and sea ice altimetry, which will be introduced in the following subsections. Due to the large variety of methods for sea ice detection, this topic is treated in Section 2.2, Section 2.3 and Section 2.4, which consider the observable-based, scattering coefficient retrieval-based, and machine leaning-based methods, respectively.
2.2. DDM Observable-Based Sea Ice Detection
The first application of TDS-1 data for sea ice detection was performed by [62,74] through evaluating some parameters (also known as observables) extracted from DDMs. Around the same time, ref. [65] also investigated sea ice detection application with different observables. The DDM observables were initially proposed to describe the extent of spreading for DDMs, which is determined by surface roughness [25,26,27].
In [62] five observables were used (listed as 1–5 below). Three different observables (as 6–8) were employed by [65], two new ones (listed as 9 and 10) were proposed in [75], and another three (denoted as 11–13) were adopted in [76]. These observables are described as follows:
- Pixel Number (PN): The total number of normalized (with respect to the DDM maximum) DDM pixels with power greater than the pre-set threshold ().
- Power Summation: The power summation of normalized DDM pixels with power greater than .
- Geometrical center (GC) Distance: The distance from the DDM geometrical center pixel [located at (GC, GC)] to (MAX, MAX), and is formulated aswhere GC and GC are the mean values of delay coordinates () and Doppler coordinates (f) for the DDM pixels with power greater than .
- Center-of-mass (CM) Distance: The distance from the DDM center-of-mass pixel [whose coordinate is (CM, CM)] to the peak power pixel [with a coordinate of (MAX, MAX)], and is formulated aswhere CM and CM are defined as
- CM Taxicab Distance: The taxicab distance from (CM, CM) to (MAX, MAX) is
- Delay-Doppler Map Average (DDMA): The average value of the normalized DDM around its peak.
- Trailing Edge Slope (TES): The slope of Doppler integrated waveform (DIW, summation of all delay waveforms at each Doppler bin) between its maximum and the value at, for example, 3 bins after the peak.
- Matched Filer (MF): The correlation coefficient between the obtained DIW and a Doppler cut of the so-called Woodward ambiguity function (WAF).
- : The distance between two pixels with a value below the average of the waveform that are immediately before and after the peak power point. These two points confine the boundary of the “effective zone” of a waveform.
- : The standard deviation of effective zone.
- Offset Centre of Gravity (OCOG): This parameter is based on a waveform, which is selected and re-centered on the peak power point. OCOG is calculated as the difference between the CM point and peak power point of a waveform.
- and : The difference between the peak power and the location on the waveform where the power has decreased to 85% of its maximum.
- Kurtosis: The kurtosis for the DDM of scattered power.
The difference between DDMs of seawater and sea ice lies in the distinct spreading extent, and typically DDMs of sea water exhibit more spreading. The above-mentioned observables are able to describe the spreading extent of a DDM. For observables 1–6, 9, and 11–13, a larger value corresponds to more spreading. However, for observables 7, 8, and 10, a smaller value indicates more spreading. As such, the sea ice detection can be realized by comparing the value of a DDM observable with its corresponding threshold. For illustration, the flowchart for sea ice detection using these observables is displayed in Figure 2.
As an extension of the work done by [62], ref. [70] derived a DDM observable, specifically Pixel Number and Power Summation, based on the difference between two normalized DDMs acquired consecutively. The evaluation of the obtained observable enables to determine the type of surface transition. Take the observable PN as an example and suppose the threshold for distinguishing different surface types as , and the threshold for discriminating the same surface types are PN’ and , the surface type will be categorized as:
- Ice-water transition, if PN ;
- Water-ice transition, if PN ;
- Ice-ice/Water-water transition, if |PN| ; further classification will be made as:
- -
- Ice-ice transition, if |PN’| ;
- -
- Water-water transition, if |PN’| ;
In general, derivations of these observables are quite straightforward, whereas their design requires close attention. For example, the value of for deriving the PN observable needs to be properly assigned by the researchers, because PN will either be severely affected by noise if the value of is too low or become insensitive to geophysical parameters when the value of is too high. A common practice for obtaining the optimal is to test various values of , and the one resulting in the best accuracy of detection is selected. However, the Kurtosis observable (no. 13) is free from this process since it is a statistical parameter derived from the data directly. Nonetheless, it was found that the performance of these observables is quite similar [69,76]. Without the loss of generality, the PN Observable is hereafter employed as a representative of observable-based methods for later comparison in Section 2.6.
2.3. Retrieval-Based Sea Ice Detection
The use of DDM observable is efficient for sea ice detection. However, the detailed spatial distribution of sea ice is hard to interpret on the basis of such products. By retrieving scattering coefficients () in the spatial domain from TDS-1 DDMs, ref. [66,77] offered a new perspective to observe water/ice transitions, detect sea ice, and depict its distribution. The method in [66] is based on the 2-D truncated singular value decomposition (TSVD), the method in [77] involves the spatial integration approach (SIA) [78] and multi-scan technique.
DDMs depict the power of scattered GNSS signal and can be described using the Zavorotny-Voronovich (ZV) model [79], which can be expressed as a 2-D convolution as in [80]:
where is the WAF, S is the sinc function and is the triangle function [79], and
where is the coherent integration time, is the displacement vector of a surface point, D is the antenna pattern. and are the distances from a point on the ocean surface to the GNSS-R transmitter and receiver. A represents the glistening zone. For an effective calculation of the integral in (7), a change of variables can be adopted [80]
where is the Jacobian of the change of variables.
In the retrieval stage, needs to be obtained first. The following two different methods can be applied.
- 2-D TSVD-basedThe reconstruction of from (6) is presented in the following form:where X denotes the discretized and B is the associated DDM, i.e., . represents the convolution operator. (9) can be expressed in matrix form by transferring B and X into lexicographically ordered vectors and :where is an n-by-n matrix and n is the length of and . (10) is solved using the regularization methods, which minimizes the norm of the residualP represents the space in which the minimization proceeds. In [66,81], Hilbert spaces were selected, and the 2-D TSVD approach was used. Based on the TSVD, a regularized solution of (10) is derived using the singular-value decomposition. The noisiest singular values are discarded, and only the first k singular values are reserved in the TSVD solutionwhere represents the selected singular values of ; and are the left and right singular vectors, respectively. Once is derived using the 2-D TSVD, can be obtained from (8). The ambiguity problem is solved by visual inspection on consecutive DDMs acquired within the same track.
- SIA-basedUnlike [66], is deconvolved from a DDM using the Fourier transformation ():By assuming a uniform within each spatial cluster, can be calculated using the SIA with obtained , throughThe ambiguity problem exists when converting a DDM pixel into the spatial coordinate, as one DDM pixel is associated with two different spatial clusters that are symmetrical to the ambiguity-free line (see illustration in Figure 3). To resolve the ambiguity issue, the multi-scan method is adopted, which uses two consecutive DDMs. Due to a short time gap (1 s) among the TDS-1 DDM measurement, two adjacent DDMs share nearly (over 90%) the same glistening zone by assuming its size is about 100 km and the surface scattering property almost remains unchanged within 1 s. The multi-scan approach can be expressed bywhere subscripts and distinguish two separate regions that are symmetrical to the ambiguity-free line, and subscripts 1 and 2 reflect the association with the 1st and the 2nd DDMs that are acquired consecutively (see Figure 3 for the geometry configuration). The desired and that add up to can be obtained by solving (15) and (16) simultaneously.
Both methods can produce qualitative confirmation of the presence of sea ice. However, the 2-D TSVD-based approach relies on visual inspection for resolving the ambiguity issue, which means the application of this method is relatively limited because it is potentially time-consuming and cannot proceed automatically.
2.4. Machine Learning-Based Sea Ice Detection
Recently, machine learning has been widely accepted as a new solution to remote sensing image processing because it is able to construct the relationship between the remote sensing data and desired parameters directly from the data. Furthermore, machine learning approaches have successfully been applied to sea ice remote sensing using, e.g., SAR [19], altimeter [82], and passive microwave data [83]. The general machine learning procedure consists of three steps: Preprocessing of the input (remote sensing data), training, and test. A corresponding flowchart is presented in Figure 4. Up to now, the following three machine learning techniques for sea ice detection using TDS-1 data have been exploited.
- Neural Networks (NNs)Before being input to the neural networks, each DDM is preprocessed with (1) noise floor subtraction, (2) normalization, (3) signal box determination, and (4) data stretching. To mitigate the noise effect, the noise floor is deducted for each DDM, which is determined as the average of a signal-free box (containing the first four delay bins along all Doppler bins). It is worth mentioning that an original TDS-1 DDM consists of 128 bins (with a resolution of 244 ns) in delay and 20 bins in Doppler (with a resolution of 500 Hz). Next, each DDM is normalized with respect to its peak power, which is determined by the local maxima in the DDM. After that, the signal box is selected based on the local maxima, specifically, 4 rows before and 35 rows after the local maxima in delay and all the Doppler bins. Then the 2-D signal box is transferred into a lexicographically ordered vector, which has 800 elements and is the input of the NN.In [69], an NN with 1 input layer (800 units, i.e., , ), 1 hidden layer (3 units, i.e., , ), and 1 output layer (1 unit, i.e., that produces the detection results) was devised. The corresponding diagram is displayed in Figure 5a. In general, the associations between the layers can be summarized in the matrix formwhere , , , and represent the activation function, input vector, the bias vector, and the weight matrix, respectively. The activation functions in the hidden layer and the output layers were chosen separately as the widely used sigmoid function and the softmax function, respectively.With the constructed NN, a training process begins to determine weights and bias, for which the back-propagation (BP) learning [84] and the Levenberg-Marquardt algorithm [85] can be employed. Detailed formulas can be found in [69]. After learning with a training set of DDM data and its corresponding seawater/ice label data, the sea ice detection results can be generated by inputting the processed DDMs to the trained NN.
- Convolutional Neural Networks (CNNs)Compared with NNs, CNNs deploy extra convolutional and pooling layers. The convolutional layer directly interacts with the input 2-D DDM, which preserves the correlation between adjacent DDM pixels. The employment of a pooling layer helps reduce the redundancy in data and makes CNNs less sensitive to the misalignment of the signal box within a DDM frame. CNNs also require less data preprocessing than NN, including noise floor subtraction, normalization, and (optional) signal box determination. Ref. [63] designed a CNN architecture (see Figure 5b) that contains 1 convolution layer (which is made of 5 seven-by-seven filters) followed by 1 two-by-two pooling layer and 2 fully connected layers (whose functionality is similar to the input and hidden layers for NN). The use of a convolution layer can be described bywhere , b, , and are the input, the bias, the kth () convolved image and filter, respectively. The convolution operation is denoted by *. For the output layer, the activation function is the softmax function; and for the remaining layers, the widely adopted rectified linear unit (ReLU) function is chosen, i.e.,
- Support Vector Machines (SVMs)SVMs [87] are capable of operating classification tasks by finding a hyperplane that can best distinguish (with the maximum margin) between different types and are able to provide better accuracy than other pattern classification models [64,88]. In addition to noise floor subtraction and normalization, another feature extraction process is undertaken as a preprocess in [64]. The mean value along the delay-axis at each Doppler bin is calculated, and processed by ReLU. Such an array of 20 elements is then normalized by its maximum and consequently reserved as the feature vector (noted as feature selection, FS).The classifier can be formulated asbased on the training set , where n is the length of DDM training set, is the jth input feature vector (), and is the class labels (seawater/sea ice) associated with corresponding DDMs. are Lagrange multipliers, which can be solved throughs.t.and b can be derived as the mean value of the term ().
2.5. SIC Estimation Approaches
As pointed out by [72] and demonstrated in Figure 1, space-detected GNSS-R data collected over regions of varying SIC manifest different extents in delay and Doppler. Thanks to the availability of millions of TDS-1 DDM data, the task of SIC estimation has been fulfilled. Nowadays, all the existing methods are machine learning-based techniques, including NNs [69], CNNs [63], and support vector regression (SVR) [89]. The procedure for this regression application is similar to that for sea ice detection described in Section 2.4, and the main difference lies in the fact that the target output is set as the SIC values instead of surface type labels. In addition, the linear function rather than the softmax function is adopted as the activation function in the output layer for NNs and CNNs, and the regression model is employed for SVR. Due to the similarity of the methods for SIC estimation and sea ice detection, the implementation of these techniques will not be described here. More details can be found in [63,69,89].
2.6. Performance Comparison and Evaluation
The machine learning-based methods for ice detection and concentration estimation were assessed with data gathered during five collection periods (3–5, 11–13, and 19–21 February, 15–17 March and 16–18 April 2015 and they were labeled as RD 17, RD 18, RD 19, RD 23, and RD 27, respectively) in [63,64,69,89]. The first period was employed as a training set while the latter four were adopted as test sets. The daily reference SIC data were from the Nimbus-7 Scanning Multi-Channel Microwave Radiometer and Defense Meteorological Satellite Program Special Sensor Microwave Imager-Special Sensor Microwave Imager/Sounder passive microwave sensors [90] and were regarded as ground-truth. In addition, the collocation between reference SIC products and the GNSS-R results is on a same-day basis. For sea ice detection application, the output was labeled as “sea ice” if its reference SIC was above 15%; otherwise it was identified as “seawater”.
The inputs to SVM/SVR and NN were different; in order to make an impartial performance comparison between them and to validate the advantage of FS, further tests were made with the NN-based method by using FS input (note that the CNN employs 2-D input, and therefore, it was not examined). For comparing NN- and CNN-based methods, two different input schemes using the cropped and original DDMs were tested as well. Accordingly, results of the NN-based with FS, full, and cropped DDMs, the CNN-based with full and cropped inputs, and the SVM-based with FS were evaluated and compared using the same dataset. These methods were utilized for both sea ice detection and SIC estimation, while the observable-based approach was only evaluated for the application of sea ice detection. The overall prediction of sea ice or seawater along with the ground truth are presented in Figure 6. It is worth mentioning that each point in Figure 6 (also including the following Figure 7 and Figure 8) represents one co-located GNSS-R - reference sea ice data pair. High accuracy was obtained for sea ice detection using these methods, and the results are tabulated in Table 1.
To assess the SIC estimation, taking NN-based SIC results () as an example, is compared with the same-day reference SIC data (). The standard deviation error and the correlation coefficient r between and were employed for evaluation purposes and they are defined as
These error statistics for SIC estimation are shown in Table 2, from which low discrepancy between estimated SIC and is noticed for these methods. Insignificant degradation in the test accuracy relative to the training set suggests the generalizability of these methods. The predicted SIC results along with the reference data are presented in Figure 7. For demonstration, the averaged SIC estimates from the proposed NNs-, CNNs-, and SVMs-based methods are shown in a geographic frame as Figure 8. In addition, the locations without DDM estimates are in white.
Overall good agreement can be observed between the DDM-based SIC estimates and the reference data. Despite this, discrepancy was noted for the locations where both sea ice and seawater exist. It was reported that the SIC tends to be overestimated at the regions near ice edge or in partially ice-covered areas when the sea state and wind speed are low. Such phenomenon can be noticed from the patterns marked by arrows in Figure 7. Similarly, false detection of sea ice may be due to very calm water with low wind [62].
On the other hand, underestimation also existed when the actual SIC was 100%. This might be caused by sea surfaces with ice of thickness exceeding the penetration depth. In this case, the scattering would be dominated by the uppermost sea ice, which could be rougher than the ice-water interface. In addition, if a DDM is contaminated by speckle noise at the non-specular delay-Doppler bins, the SIC could also be underestimated. The cases of underestimation can be observed in Figure 7 as patterns tagged by cross symbols.
2.6.1. NN vs. CNN
As can be seen from Table 1 and Table 2, the CNN-based sea ice remote sensing shows overall improved accuracy over the NN-based one, especially when using the original input size. An advantage of CNN lies in the deployment of filters in the convolution layer, which can reduce the noise in the DDM. The convolution and pooling layers make CNN less sensitive to disalignment of DDM specular point within a frame. However, when the data are adequately processed by cropping the DDM for alignment, both CNN and NN can produce good result.
2.6.2. NN vs. SVM
The SVM/SVR-FS-based sea ice sensing approach manifests improved accuracy relative to the NN- and CNN-based (with full DDM frame as input) methods. Note that the FS is derived from full DDMs rather than cropped ones. By applying the devised FS, the input size is notably decreased compared with the full-sized DDM (from 128 × 20 to 20). Furthermore, FS is more immune to noise than original input due to an averaging process. The achieved outcome (see Table 1 and Table 2) also proved both the advantage of FS since NN-FS outperformed NN and the improvement of SVM-FS against NN-FS.
2.7. Sea Ice Type Classification
The sensitivity of GNSS-R signals to the surface roughness of several primary ice types, i.e., first-year ice (FYI), multi-year ice (MYI), and young ice was investigated by [91]. It was anticipated that the smooth new and young ice will result in strongest reflectivity since their low surface roughness will lead to coherent scattering, FYI gives intermediate reflectivity due to a combination of deformed edges and smooth surfaces that leads to coherent and incoherent scattering, and MYI contributes the lowest reflectivity because deformed edges and rough surfaces will lead to incoherent scattering. The difference in the shape of DDMs for various ice types was observed. Accordingly, several DDM observables were developed for sea ice type classification. The employed observables include DDMA, TES, leading edge slope (LES), generalized linear observable (see [92]), and waveform width observable (the width of a waveform when its power reach 2/3 of the peak value). Firstly, only the DDMs of sea ice are selected by evaluating these observables similar to those described in Section 2.2. Next, data (14,370 samples in total) of each sea ice type are randomly and equally divided into two groups for training and validation, respectively. Since the classification of ice type cannot be accomplished by inspecting these observables alone, the standard classification and regression tree (CART) method (see [93]) is adopted for training. In [91], the CART was built with 181 nodes, and the derived observables are the inputs of the CART. Each node can contain conditional control statements that are based on the evaluation of input observables and classification result. The complete algorithm in the form of pseudo-code can be found in [91]. After the results being generated from the designed CART, a spatial and temporal dominant class check was applied to amend samples that did not agree with the surroundings.
Validation was made for the Chukchi-Beaufort Seas covering from 70N to 80N and from 112.5W to 180W. The TDS-1 data collected on 2, 3, 10, 11, 18, 19, 26, and 27 October and 3 and 4 November 2015 were employed. Sea ice type reference data consist of two sources; one is generated weekly/semi-weekly from SAR data by the US National Ice Center (NIC) with a spatial resolution of 100 m and the other is produced weekly from MODIS imagery with a spatial resolution of 1 km. The first reference data have better spatial and temporal resolution but less coverage (up to 75N) compared with the second one which covers up to 80N. The TDS-1 data were matched with the NIC data closest in time (within 2–5 days) first. For the regions without NIC data (i.e., from 75N to 80N), the MODIS data closet in time (within 7 days) were employed instead. This algorithm produces an accuracy 54.5%, 94%, and 69.7% for classifying FYI, MYI and Young Ice, respectively. It should be noted that there was no constraint on local surface incidence angles in [91], which would be sub-optimal for the application of sea ice type classification. It is also meaningful to consider both surface characteristics (such as deformation and roughness) and interior properties (e.g., vertical salinity and temperature distribution) of the sea ice at the same time, and the latter needs further investigation in the future.
2.8. Sea Ice Thickness Retrieval
The possibility of SIT measurement using spaceborne GNSS-R was indicated by [68,94]. Analyzing the 40-s measurements in the Hudson Bay, it was found that the GNSS signal was mainly reflected at the ice-water interface for the case of FYI with thickness of 20 to 60 cm [68]. By only considering coherent GNSS reflections, ref. [95] modeled the scattering coefficient of an ice-covered surface as the product of the propagation loss within sea ice and the reflection coefficient (ℜ) at sea ice-water boundary, i.e.,
where is the attenuation coefficient. Consequently, the retrieval of SIT can be proceeded through
can be obtained from the TDS-1 dataset, and can be deduced by following the procedure in [79]. is dependent on the elevation angle , the signal wavelength and the relative permittivity of sea ice, which is formulated as
For obtaining , the model proposed by Vant et al. [96] can be adopted
where is the relative brine volume, which can be approximated by the following relationship [97]
where S and T are sea ice salinity and temperature, respectively, and were regarded as known in [95].
The experimental evaluation was performed over the year of 2015 in Arctic for the periods with available co-located SMOS reference data, i.e., from 1 January to 15 April and from 15 October to 31 December 2015. The collocation between the TDS-1 and SMOS data is on a same-day basis, since both of them provide daily data when available. The SMOS data manual (available on https://icdc.cen.uni-hamburg.de/1/daten/cryosphere/l3c-smos-sit.html) suggests not using data with uncertainty higher than 1 m, a stricter threshold of 0.5 m was adopted by [95] to further ensure the quality of reference data.
By comparing the derived TDS-1 SIT with the SMOS reference, good consistency was obtained, with an r of 0.90 and a root-mean-square difference (RMSD) of 8.68 cm for sea ice with thickness below 1 m. Good agreement can also be observed from the overall results that are plotted in the form of a density plot (Figure 9). The data densities were calculated relative to the maximum of overall distribution.
The SMOS reference SIT data require assumptions about SIC and vertical profiles of temperature and salinity in the sea ice, which are also important factors for GNSS-R SIT. It should be noted that the reference data for S and T in [95] were from those provided in SMOS SIT products [98], but it is more appropriate to find other S and T data sources, either from local measurements or from an ocean model (which includes the effects of sea ice formation and melt). In addition, the SMOS data made an assumption of 100% SIC and underestimation will occur when the actual SIC is not. No SIC threshold was applied in [95], but its effect cannot be neglected. It is found that when SIC is high (above 90%), the TDS-1 and SMOS SITs agree well with each other (see Figure 10). In contrast, when SIC is low, the relative differences, which are calculated as (SMOS SIT – TDS-1 SIT)/ SMOS SIT, are significant, especially for the negative part. Nonetheless, the occurrence of high negative relative differences may be due to the underestimation of SMOS SIT for the cases of low SICs.
2.9. Ice Altimetry Techniques
Another argument made by [72] was that the coherent reflection from ice surfaces allows accurate altimetry measurements, which was later verified by [67] through investigating delay waveforms and by [68] via processing phase measurements of raw data. In general, over smooth new and young ice and FYI, coherent reflection can be expected, which allows waveform analysis. These two methods were both based on the raw data collected by TDS-1 over Hudson Bay on 18 January 2015 (RD 15), and are discussed as follows.
2.9.1. Waveform-Based
The waveforms are produced from raw data by cross-correlating received signals with local replicas. With both direct and reflected waveforms, the path delay can be derived as
where c is the speed of light, and are the arrival times of reflected and direct signals, respectively. V represents the error term that includes ionospheric and tropospheric effect, as well as noise. and are determined based on the peaks of their corresponding waveforms. The height of the surface under investigation can be determined from an obtained path delay using the method either described in [99,100] or [101]. The estimated precision is about 1 m with a spatial resolution of 3.8 km.
2.9.2. Phase-Based
Instead of deriving arrival times with generated waveforms, the phase delay is directly extracted from raw data through an open-loop tracking of the reflected signal. The surface height h can be retrieved through
where and are the observed and modelled phase delays, is the estimated error that is determined through least squares fitting, and is the Tx elevation angle at the specular point. The RMSD between the achieved GNSS-R altimetric results and mean sea surface is 4.7 cm with an along-track sampling distance of about 140 m. Moreover, the difference between obtained results and mean sea surface was found to be correlated with collocated SMOS sea ice thickness data. This indicates the application of spaceborne GNSS-R for sea ice thickness retrieval. Furthermore, it should be noted that this experiment was a case study in the Hudson Bay with a 40-s long measurement for a single day.
2.10. Summary
A summary of sea ice sensing studies using spaceborne GNSS-R is presented in Table 3. It can be noticed that the detection accuracy appear to be similar for both DDM observables-based methods and machine learning-based methods. The difference of these two kinds of methods lies in that the latter methods perform classification through a learning process exclusively dependent on the data, while the former ones are based on interpretations by researchers. The difference between DDMs of sea ice and seawater is clear, which can be well represented by the derived observables, and thus the accuracy is plausible. However, it is challenging to deal with complex problems such as SIC estimation and sea ice type classification by solely using observables, and in such cases machine learning methods can be adopted. For sea ice altimetry, the phase-based method shows better performance than the waveform-based one, which is due to (1) an extra error mitigation processed by the former, (2) the restriction on delay resolution of waveform by the latter, and (3) shorter integration time adopted by the former that results in better spatial resolution.
3. Airborne and Ground-Based Experiments
In addition to the spaceborne applications, there have been several dedicated missions based on airborne and ground-based GNSS-R receivers capable of providing regional and local sea ice monitoring. However, these dedicated tests are of relatively limited generality and access compared with spaceborne applications. Nonetheless, their progress has been important for developing and validating new GNSS-R-based sea ice sensing practices. In this section, the contributions of recent airborne and ground-based experiments are described.
3.1. Airborne Tests
The first airborne sea ice measurement was performed in 1998 in the Beaufort Sea. The results showed the sensitivity of reflected GPS signals to the presence of sea ice and its conditions [58]. During the flight, the received signal shape had consistently a sharp and narrow waveform, which indicates a trivial variation in the ice surface roughness observed. However, the peak power of the waveform changed significantly, which suggested the sensitivity to ice reflectivity. In addition, a correlation between the power of received signals and collocated RADARSAT backscatter was observed.
The potential of reflected GPS signals for the retrieval of sea ice information, specifically, permittivity and roughness, was further evaluated by [59]. These two derived parameters are retrieved from obtained waveforms using the ZV model. It was shown in [59] that the received waveform can be modeled as the product of the reflection coefficient and the GPS C/A code autocorrelation function in the limit of small surface slopes for Kirchhoff approximation. For this reason, the power strength and shape of a waveform are decoupled to derive the permittivity and roughness, separately. The surface permittivity is mapped from the peak power via reflection coefficient, and the surface roughness (parameterized by surface mean square slope) is based on a least squares fitting between the modeled and measured waveforms.
3.2. Ground-Based Operations
In addition to verifying the altimetric application, ground-based experiments conducted in Greenland in 2008 [54,56] also provided polarimetric analysis from which a qualitative matching was found between the polarization ratio (a ratio between the received right-handed and left-handed circular polarization (RHCP and LHCP) signals) and SIC.
Signal-to-noise ratio (SNR) data of received reflected GNSS signals were collected at the Onsala Space Observatory, Sweden in 2012 [61,102]. The high-frequency part of the SNR data, referred to as SNR, can be modeled as
where is the signal wavelength, m is the height of receiver above the reflecting surface, is the elevation angle, and are the amplitudes of each component, respectively, and is referred to as the damping parameter that is related with the properties of reflecting surface. , , m, and can be determined through nonlinear least squares fitting using Equation (31). It was found in [61] that low values of were coincident with the presence of ice, and thus can be used for ice detection.
In 2013, tests were operated at the Bohai Bay (China), and the ratio between direct and reflected signals () was found to be sensitive to SIC [57].
The ratio was further investigated for sea ice thickness retrieval and an empirical relationship between these two parameters was obtained through a fitting process based on data collected at the field demonstration at Liaodong Bay (China) in 2016 [60], and the empirical formula was given as
This was verified in [60] for sea ice with a thickness of 10 to 20 cm.
The above-mentioned ground-based investigations are summarized in Table 4.
4. Conclusions
In this paper, the state-of-the-art techniques for sea ice remote sensing using GNSS-R are reviewed. Due to the availability of massive spaceborne GNSS-R data, more investigations and verifications have been made for their applications in sea ice sensing than using airborne and ground-based data in the literature. As such, this review focuses more on the topic of sea ice sensing using spaceborne GNSS-R data.
For spaceborne applications, the characteristics of coherent reflection off sea ice is utilized. The presence of sea ice results in (1) less spreading in DDM of sea ice than that of seawater and (2) recoverable phase information. Based on the first attribute, sea ice detection and SIC estimation can be realized; and sea ice altimetry is accomplished according to the latter one. The difference in DDMs for various ice types is the fundamental for ice type classification. Although existing studies have demonstrated high accuracy and efficiency in sea ice detection and SIC estimation, it is necessary to derive other sea ice parameters from the GNSS-R signals in the future. For example, further investigation on retrieval of thin-ice thickness at fine spatial resolution is meaningful, which if done properly can greatly assist shipping close to coasts and harbor areas. Existing work on sea ice sensing are mainly based on data collected by TDS-1 satellite, whose service was ceased in December 2018. Although the CYGNSS mission is in orbit, it is unable to cover high-latitude sea ice-infested areas. Thus, the launch of new GNSS-R satellites for sea ice monitoring will be helpful.
For airborne tests, the waveform that can be regarded as the central column of a DDM was most investigated. By analyzing the peak power value and the shape of a waveform, the sea ice permittivity and surface roughness can be determined. In order to verify the generality of their applications, more tests are necessary in the future.
For ground-based measurements, the power ratio between the RHCP and the LHCP signals and the SNR of received signal can be used and their relationship with, e.g., presence of sea ice, SIT, and SIC were investigated. Although the coverage area by a ground-based receiver is quite limited compared to spaceborne and airborne instruments, GNSS sites can provide long-term observations for specific regions of interests. The sea ice information obtained from coastal GNSS-R can be regarded as ground-truth for validating spaceborne and airborne sensors [61]. With increasing ground GNSS stations, more intensive coverage and more data will be accessible at a regional scale [42], it is thus possible to further develop sea ice sensing schemes in the future.
Author Contributions
Q.Y. and W.H. wrote the manuscript.
Funding
This work was supported by the Natural Sciences and Engineering Research Council of Canada Discovery Grants (NSERC RGPIN-2017-04508 and RGPAS-2017-507962), and the Canadian Space Agency CubeSat Grant (17CCPNFL11) to W. Huang.
Conflicts of Interest
The authors declare no conflict of interest.
Abbreviations
The following abbreviations are used in this manuscript:
| GNSS-R | Global Navigation Satellite System-Reflectometry |
| TDS-1 | TechDemoSat-1 |
| SAR | Synthetic aperture radar |
| Tx | Transmitter |
| Rx | Receiver |
| GPS | Global Positioning System |
| CYGNSS | Cyclone Global Navigation Satellite System |
| UK-DMC | UK Disaster Monitoring Constellation |
| SIC | Sea ice concentration |
| DDM | Delay-Doppler map |
| SIT | Sea ice thickness |
| PN | Pixel number |
| GC | Geometrical center |
| CM | Center-of-mass |
| DDMA | Delay-Doppler map average |
| TES | Trailing edge slope |
| DIW | Doppler integrated waveform |
| MF | Global Navigation Satellite System-Reflectometry |
| WAF | Woodward ambiguity function |
| OCOG | Offset centre of gravity |
| TSVD | Truncated singular value decomposition |
| SIA | Spatial integration approach |
| ZV | Zavorotny-Voronovich |
| NN | Neural network |
| BP | Back-propagation |
| CNN | Convolutional neural network |
| ReLU | Rectified linear unit |
| SGDM | Stochastic gradient descendant with momentum |
| SVM | Support vector machine |
| SVR | Support vector regression |
| FYI | First-year ice |
| MYI | Multi-year ice |
| LES | Leading edge slope |
| CART | Classification and regression tree |
| NIC | National Ice Center |
| SMOS | Soil Moisture Ocean Salinity |
| RMSD | Root-mean-square difference |
| RHCP | Right-handed circular polarization |
| LHCP | Left-handed circular polarization |
| SNR | Signal-to-noise ratio |
References
- Rothrock, D.A.; Yu, Y.; Maykut, G.A. Thinning of the Arctic sea-ice cover. Geophys. Res. Lett. 1999, 26, 3469–3472. [Google Scholar] [CrossRef] [Green Version]
- Comiso, J.C.; Parkinson, C.L.; Gersten, R.; Stock, L. Accelerated decline in the Arctic sea ice cover. Geophys. Res. Lett. 2008, 35, L01703. [Google Scholar] [CrossRef]
- Laxon, S.W.; Giles, K.A.; Ridout, A.L.; Wingham, D.J.; Willatt, R.; Cullen, R.; Kwok, R.; Schweiger, A.; Zhang, J.; Haas, C.; et al. CryoSat-2 estimates of Arctic sea ice thickness and volume. Geophys. Res. Lett. 2013, 40, 732–737. [Google Scholar] [CrossRef] [Green Version]
- Hartman, D.; Klein Tank, A.; Rusicucci, M.; Alexander, L.; Broenniman, B.; Charabi, Y.; Dentener, F.; Dlugokencky, E.; Easterling, E.; Kaplan, A.; et al. Observations: Atmosphere and Surface; Cambridge University Press: Cambridge, UK, 2013. [Google Scholar]
- Barry, R.G.; Serreze, M.C.; Maslanik, J.A.; Preller, R.H. The Arctic Sea Ice-Climate System: Observations and modeling. Rev. Geophys. 1993, 31, 397. [Google Scholar] [CrossRef]
- McPhee, M.G.; Proshutinsky, A.; Morison, J.H.; Steele, M.; Alkire, M.B. Rapid change in freshwater content of the Arctic Ocean. Geophys. Res. Lett. 2009, 36, L10602. [Google Scholar] [CrossRef]
- Galley, R.J.; Else, B.; Prinsenberg, S.; Babb, D.; Barber, D. Summer Sea Ice Concentration, Motion, and Thickness Near Areas of Proposed Offshore Oil and Gas Development in the Canadian Beaufort Sea—2009. ARCTIC 2013, 66, 105–116. [Google Scholar] [CrossRef]
- Sandven, S.; Johannessen, O.M.; Kloster, K. Sea Ice Monitoring by Remote Sensing; John Wiley & Sons, Ltd.: Chichester, UK, 2006. [Google Scholar] [CrossRef]
- Petrou, Z.I.; Tian, Y. Prediction of Sea Ice Motion With Convolutional Long Short-Term Memory Networks. IEEE Trans. Geosci. Remote Sens. 2019, 57, 6865–6876. [Google Scholar] [CrossRef]
- Kashiwase, H.; Ohshima, K.I.; Fukamachi, Y.; Nihashi, S.; Tamura, T. Evaluation of AMSR-E Thin Ice Thickness Algorithm from a Mooring-Based Observation: How Can the Satellite Observe a Sea Ice Field with Nonuniform Thickness Distribution? J. Atmos. Ocean. Technol. 2019, 36, 1623–1641. [Google Scholar] [CrossRef] [Green Version]
- Zhang, Z.; Yu, Y.; Li, X.; Hui, F.; Cheng, X.; Chen, Z. Arctic Sea Ice Classification Using Microwave Scatterometer and Radiometer Data During 2002–2017. IEEE Trans. Geosci. Remote Sens. 2019, 57, 5319–5328. [Google Scholar] [CrossRef]
- Cooke, C.L.V.; Scott, K.A. Estimating Sea Ice Concentration From SAR: Training Convolutional Neural Networks with Passive Microwave Data. IEEE Trans. Geosci. Remote Sens. 2019, 57, 4735–4747. [Google Scholar] [CrossRef]
- Meier, W.N.; Stewart, J.S. Assessing uncertainties in sea ice extent climate indicators. Environ. Res. Lett. 2019, 14, 035005. [Google Scholar] [CrossRef]
- Otosaka, I.; Belmonte Rivas, M.; Stoffelen, A. Bayesian Sea Ice Detection With the ERS Scatterometer and Sea Ice Backscatter Model at C-Band. IEEE Trans. Geosci. Remote Sens. 2018, 56, 2248–2254. [Google Scholar] [CrossRef]
- Belmonte Rivas, M.; Otosaka, I.; Stoffelen, A.; Verhoef, A. A scatterometer record of sea ice extents and backscatter: 1992–2016. Cryosphere 2018, 12, 2941–2953. [Google Scholar] [CrossRef]
- Laxon, S.W.; Peacock, N.; Smith, D. High interannual variability of sea ice thickness in the Arctic region. Nature 2003, 425, 947–950. [Google Scholar] [CrossRef]
- Rose, S.K.; Andersen, O.B.; Passaro, M.; Ludwigsen, C.A.; Schwatke, C. Arctic Ocean Sea Level Record from the Complete Radar Altimetry Era: 1991–2018. Remote Sens. 2019, 11, 1672. [Google Scholar] [CrossRef]
- Kwok, R.; Cunningham, G.F. Seasonal ice area and volume production of the Arctic Ocean: November 1996 through April 1997. J. Geophys. Res. 2002, 107, 8038. [Google Scholar] [CrossRef]
- Wang, L.; Scott, K.A.; Xu, L.; Clausi, D.A. Sea ice concentration estimation during melt from dual-pol SAR scenes using deep convolutional neural networks: A case study. IEEE Trans. Geosci. Remote Sens. 2016, 54, 4524–4533. [Google Scholar] [CrossRef]
- Gao, F.; Wang, X.; Gao, Y.; Dong, J.; Wang, S. Sea Ice Change Detection in SAR Images Based on Convolutional-Wavelet Neural Networks. IEEE Geosci. Remote Sens. Lett. 2019, 16, 1240–1244. [Google Scholar] [CrossRef]
- Longepe, N.; Thibaut, P.; Vadaine, R.; Poisson, J.C.; Guillot, A.; Boy, F.; Picot, N.; Borde, F. Comparative Evaluation of Sea Ice Lead Detection Based on SAR Imagery and Altimeter Data. IEEE Trans. Geosci. Remote Sens. 2019, 57, 4050–4061. [Google Scholar] [CrossRef]
- Hall, C.; Cordey, R. Multistatic Scatterometry. In Proceedings of the International Geoscience and Remote Sensing Symposium, ‘Remote Sensing: Moving Toward the 21st Century’, Edinburgh, UK, 12–16 September 1988; pp. 561–562. [Google Scholar] [CrossRef]
- Garrison, J.; Komjathy, A.; Zavorotny, V.; Katzberg, S. Wind speed measurement using forward scattered GPS signals. IEEE Trans. Geosci. Remote Sens. 2002, 40, 50–65. [Google Scholar] [CrossRef] [Green Version]
- Katzberg, S.J.; Torres, O.; Ganoe, G. Calibration of reflected GPS for tropical storm wind speed retrievals. Geophys. Res. Lett. 2006, 33. [Google Scholar] [CrossRef] [Green Version]
- Marchan-Hernandez, J.F.; Rodriguez-Alvarez, N.; Camps, A.; Bosch-Lluis, X.; Ramos-Perez, I.; Valencia, E. Correction of the sea state impact in the L-Band brightness temperature by means of delay-Doppler maps of global navigation satellite signals reflected over the sea surface. IEEE Trans. Geosci. Remote Sens. 2008, 46, 2914–2923. [Google Scholar] [CrossRef]
- Rodriguez-Alvarez, N.; Akos, D.M.; Zavorotny, V.U.; Smith, J.A.; Camps, A.; Fairall, C.W. Airborne GNSS-R wind retrievals using delay–Doppler maps. IEEE Trans. Geosci. Remote Sens. 2013, 51, 626–641. [Google Scholar] [CrossRef]
- Clarizia, M.P.; Ruf, C.S.; Jales, P.; Gommenginger, C. Spaceborne GNSS-R minimum variance wind speed estimator. IEEE Trans. Geosci. Remote Sens. 2014, 52, 6829–6843. [Google Scholar] [CrossRef]
- Li, C.; Huang, W. An algorithm for sea-surface wind field retrieval from GNSS-R delay-doppler map. IEEE Geosci. Remote Sens. Lett. 2014, 11, 2110–2114. [Google Scholar] [CrossRef]
- Foti, G.; Gommenginger, C.; Jales, P.; Unwin, M.; Shaw, A.; Robertson, C.; Roselló, J. Spaceborne GNSS reflectometry for ocean winds: First results from the UK TechDemoSat-1 mission. Geophys. Res. Lett. 2015, 42, 5435–5441. [Google Scholar] [CrossRef] [Green Version]
- Yan, Q.; Huang, W.; Foti, G. Quantification of the relationship between sea surface roughness and the size of the glistening zone for GNSS-R. IEEE Geosci. Remote Sens. Lett. 2018, 15, 237–241. [Google Scholar] [CrossRef]
- Larson, K.M.; Gutmann, E.D.; Zavorotny, V.U.; Braun, J.J.; Williams, M.W.; Nievinski, F.G. Can we measure snow depth with GPS receivers? Geophys. Res. Lett. 2009, 36, L17502. [Google Scholar] [CrossRef]
- Najibi, N.; Jin, S.; Najibi, N.; Jin, S. Physical reflectivity and polarization characteristics for snow and ice-covered surfaces interacting with GPS signals. Remote Sens. 2013, 5, 4006–4030. [Google Scholar] [CrossRef]
- McCreight, J.L.; Small, E.E.; Larson, K.M. Snow depth, density, and SWE estimates derived from GPS reflection data: Validation in the western U. S. Water Resour. Res. 2014, 50, 6892–6909. [Google Scholar] [CrossRef]
- Jin, S.; Najibi, N. Sensing snow height and surface temperature variations in Greenland from GPS reflected signals. Adv. Sp. Res. 2014, 53, 1623–1633. [Google Scholar] [CrossRef]
- Najibi, N.; Jin, S.; Wu, X. Validating the Variability of Snow Accumulation and Melting From GPS-Reflected Signals: Forward Modeling. IEEE Trans. Antennas Propag. 2015, 63, 2646–2654. [Google Scholar] [CrossRef]
- Jin, S.; Qian, X.; Kutoglu, H. Snow Depth Variations Estimated from GPS-Reflectometry: A Case Study in Alaska from L2P SNR Data. Remote Sens. 2016, 8, 63. [Google Scholar] [CrossRef]
- Katzberg, S.J.; Torres, O.; Grant, M.S.; Masters, D. Utilizing calibrated GPS reflected signals to estimate soil reflectivity and dielectric constant: Results from SMEX02. Remote Sens. Environ. 2006, 100, 17–28. [Google Scholar] [CrossRef] [Green Version]
- Alonso-Arroyo, A.; Camps, A.; Aguasca, A.; Forte, G.F.; Monerris, A.; Rudiger, C.; Walker, J.P.; Park, H.; Pascual, D.; Onrubia, R. Dual-Polarization GNSS-R Interference Pattern Technique for Soil Moisture Mapping. IEEE J. Sel. Top. Appl. Earth Obs. Remote Sens. 2014, 7, 1533–1544. [Google Scholar] [CrossRef]
- Camps, A.; Park, H.; Pablos, M.; Foti, G.; Gommenginger, C.P.; Liu, P.W.; Judge, J. Sensitivity of GNSS-R Spaceborne Observations to Soil Moisture and Vegetation. IEEE J. Sel. Top. Appl. Earth Obs. Remote Sens. 2016, 9, 4730–4742. [Google Scholar] [CrossRef] [Green Version]
- Jia, Y.; Savi, P.; Canone, D.; Notarpietro, R. Estimation of Surface Characteristics Using GNSS LH-Reflected Signals: Land Versus Water. IEEE J. Sel. Top. Appl. Earth Obs. Remote Sens. 2016, 9, 4752–4758. [Google Scholar] [CrossRef]
- Jin, S.; Komjathy, A. GNSS reflectometry and remote sensing: New objectives and results. Adv. Space Res. 2010, 46, 111–117. [Google Scholar] [CrossRef] [Green Version]
- Jin, S.; Feng, G.; Gleason, S. Remote sensing using GNSS signals: Current status and future directions. Adv. Space Res. 2011, 47, 1645–1653. [Google Scholar] [CrossRef]
- Zavorotny, V.U.; Gleason, S.; Cardellach, E.; Camps, A. Tutorial on Remote Sensing Using GNSS Bistatic Radar of Opportunity. IEEE Geosci. Remote Sens. Mag. 2014, 2, 8–45. [Google Scholar] [CrossRef]
- Ruf, C.; Unwin, M.; Dickinson, J.; Rose, R.; Rose, D.; Vincent, M.; Lyons, A. CYGNSS: Enabling the Future of Hurricane Prediction [Remote Sensing Satellites]. IEEE Geosci. Remote Sens. Mag. 2013, 1, 52–67. [Google Scholar] [CrossRef]
- Ruf, C. Cyclone Global Navigation Satellite System (CYGNSS) and Soil Moisture Product Prospects; SMAP CalVal Work; 2018. Available online: https://smap.jpl.nasa.gov/system/internal_resources/details/original/498_203_-_Ruf.pdf (accessed on 31 October 2019).
- Gleason, S. Space-Based GNSS Scatterometry: Ocean Wind Sensing Using an Empirically Calibrated Model. IEEE Trans. Geosci. Remote Sens. 2013, 51, 4853–4863. [Google Scholar] [CrossRef]
- Yan, Q.; Huang, W. GNSS-R Delay-Doppler Map Simulation Based on the 2004 Sumatra-Andaman Tsunami Event. J. Sens. 2016, 2016, 2750862. [Google Scholar] [CrossRef]
- Yan, Q.; Huang, W. Tsunami Detection and Parameter Estimation from GNSS-R Delay-Doppler Map. IEEE J. Sel. Top. Appl. Earth Obs. Remote Sens. 2016, 9, 4650–4659. [Google Scholar] [CrossRef]
- Unwin, M.; Jales, P.; Tye, J.; Gommenginger, C.; Foti, G.; Rosello, J. Spaceborne GNSS-Reflectometry on TechDemoSat-1: Early Mission Operations and Exploitation. IEEE J. Sel. Top. Appl. Earth Obs. Remote Sens. 2016, 9, 4525–4539. [Google Scholar] [CrossRef]
- Pierdicca, N.; Mollfulleda, A.; Costantini, F.; Guerriero, L.; Dente, L.; Paloscia, S.; Santi, E.; Zribi, M. Spaceborne GNSS Reflectometry Data for Land Applications: An Analysis of Techdemosat Data. In Proceedings of the IGARSS 2018—2018 IEEE International Geoscience and Remote Sensing Symposium, Valencia, Spain, 22–27 July 2018; pp. 3343–3346. [Google Scholar] [CrossRef]
- Cardellach, E.; Fabra, F.; Nogués-Correig, O.; Oliveras, S.; Ribó, S.; Rius, A. GNSS-R ground-based and airborne campaigns for ocean, land, ice, and snow techniques: Application to the GOLD-RTR data sets. Radio Sci. 2011, 46. [Google Scholar] [CrossRef] [Green Version]
- Cardellach, E.; Rius, A.; Martin-Neira, M.; Fabra, F.; Nogues-Correig, O.; Ribo, S.; Kainulainen, J.; Camps, A.; D’Addio, S. Consolidating the Precision of Interferometric GNSS-R Ocean Altimetry Using Airborne Experimental Data. IEEE Trans. Geosci. Remote Sens. 2014, 52, 4992–5004. [Google Scholar] [CrossRef]
- Egido, A.; Paloscia, S.; Motte, E.; Guerriero, L.; Pierdicca, N.; Caparrini, M.; Santi, E.; Fontanelli, G.; Floury, N. Airborne GNSS-R Polarimetric Measurements for Soil Moisture and Above-Ground Biomass Estimation. IEEE J. Sel. Top. Appl. Earth Obs. Remote Sens. 2014, 7, 1522–1532. [Google Scholar] [CrossRef]
- Fabra, F.; Cardellach, E.; Nogues-Correig, O.; Oliveras, S.; Ribo, S.; Rius, A.; Belmonte-Rivas, M.; Semmling, M.; Macelloni, G.; Pettinato, S.; et al. Monitoring sea-ice and dry snow with GNSS reflections. In Proceedings of the 2010 IEEE International Geoscience and Remote Sensing Symposium, Honolulu, HI, USA, 25–30 July 2010; pp. 3837–3840. [Google Scholar] [CrossRef]
- Semmling, A.M.; Beyerle, G.; Stosius, R.; Dick, G.; Wickert, J.; Fabra, F.; Cardellach, E.; Ribó, S.; Rius, A.; Helm, A.; et al. Detection of Arctic Ocean tides using interferometric GNSS-R signals. Geophys. Res. Lett. 2011, 38. [Google Scholar] [CrossRef] [Green Version]
- Fabra, F.; Cardellach, E.; Rius, A.; Ribo, S.; Oliveras, S.; Nogues-Correig, O.; Belmonte Rivas, M.; Semmling, M.; D’Addio, S. Phase Altimetry with Dual Polarization GNSS-R Over Sea Ice. IEEE Trans. Geosci. Remote Sens. 2012, 50, 2112–2121. [Google Scholar] [CrossRef]
- Zhang, Y.; Meng, W.; Gu, Q.; Han, Y.; Hong, Z.; Cao, Y.; Xia, Q.; Wang, W. Detection of bohai bay sea ice using GPS-reflected signals. IEEE J. Sel. Top. Appl. Earth Obs. Remote Sens. 2015, 8, 39–46. [Google Scholar] [CrossRef]
- Komjathy, A.; Maslanik, J.; Zavorotny, V.; Axelrad, P.; Katzberg, S. Sea ice remote sensing using surface reflected GPS signals. In Proceedings of the IEEE 2000 International Geoscience and Remote Sensing Symposium (IGARSS 2000). Taking the Pulse of the Planet: The Role of Remote Sensing in Managing the Environment, Honolulu, HI, USA, 24–28 July 2000; Proceedings (Cat. No.00CH37120). Volume 7, pp. 2855–2857. [Google Scholar] [CrossRef]
- Rivas, M.; Maslanik, J.; Axelrad, P. Bistatic Scattering of GPS Signals Off Arctic Sea Ice. IEEE Trans. Geosci. Remote Sens. 2010, 48, 1548–1553. [Google Scholar] [CrossRef]
- Gao, H.; Yang, D.; Zhang, B.; Wang, Q.; Wang, F. Remote Sensing of Sea Ice Thickness with GNSS Reflected Signal. J. Electron. Inf. Technol. 2017, 39, 1096–1100. [Google Scholar] [CrossRef]
- Strandberg, J.; Hobiger, T.; Haas, R. Coastal Sea Ice Detection Using Ground-Based GNSS-R. IEEE Geosci. Remote Sens. Lett. 2017, 14, 1552–1556. [Google Scholar] [CrossRef]
- Yan, Q.; Huang, W. Spaceborne GNSS-R Sea Ice Detection Using Delay-Doppler Maps: First Results from the U.K. TechDemoSat-1 Mission. IEEE J. Sel. Top. Appl. Earth Obs. Remote Sens. 2016, 9, 4795–4801. [Google Scholar] [CrossRef]
- Yan, Q.; Huang, W. Sea Ice Sensing From GNSS-R Data Using Convolutional Neural Networks. IEEE Geosci. Remote Sens. Lett. 2018, 15, 1510–1514. [Google Scholar] [CrossRef]
- Yan, Q.; Huang, W. Detecting Sea Ice From TechDemoSat-1 Data Using Support Vector Machines with Feature Selection. IEEE J. Sel. Top. Appl. Earth Obs. Remote Sens. 2019, 12, 1409–1416. [Google Scholar] [CrossRef]
- Alonso-Arroyo, A.; Zavorotny, V.U.; Camps, A. Sea Ice Detection Using U.K. TDS-1 GNSS-R Data. IEEE Trans. Geosci. Remote Sens. 2017, 55, 4989–5001. [Google Scholar] [CrossRef] [Green Version]
- Schiavulli, D.; Frappart, F.; Ramillien, G.; Darrozes, J.; Nunziata, F.; Migliaccio, M. Observing Sea/Ice Transition Using Radar Images Generated from TechDemoSat-1 Delay Doppler Maps. IEEE Geosci. Remote Sens. Lett. 2017, 14, 734–738. [Google Scholar] [CrossRef]
- Hu, C.; Benson, C.; Rizos, C.; Qiao, L. Single-Pass Sub-Meter Space-Based GNSS-R Ice Altimetry: Results From TDS-1. IEEE J. Sel. Top. Appl. Earth Obs. Remote Sens. 2017, 10, 3782–3788. [Google Scholar] [CrossRef]
- Li, W.; Cardellach, E.; Fabra, F.; Rius, A.; Ribó, S.; Martín-Neira, M. First spaceborne phase altimetry over sea ice using TechDemoSat-1 GNSS-R signals. Geophys. Res. Lett. 2017, 44, 8369–8376. [Google Scholar] [CrossRef]
- Yan, Q.; Huang, W.; Moloney, C. Neural Networks Based Sea Ice Detection and Concentration Retrieval From GNSS-R Delay-Doppler Maps. IEEE J. Sel. Top. Appl. Earth Obs. Remote Sens. 2017, 10, 3789–3798. [Google Scholar] [CrossRef]
- Zhu, Y.; Yu, K.; Zou, J.; Wickert, J. Sea Ice Detection Based on Differential Delay-Doppler Maps from UK TechDemoSat-1. Sensors 2017, 17, 1614. [Google Scholar] [CrossRef]
- Gleason, S.; Adjrad, M.; Unwin, M. Sensing Ocean, Ice and Land Reflected Signals from Space: Results from the UK-DMC GPS Reflectometry Experiment. In Proceedings of the ION GNSS 18th International Technical Meeting of theSatellite Division, Long Beach, CA, USA, 13–16 September 2005; pp. 1679–1685. [Google Scholar]
- Gleason, S. Remote Sensing of Ocean, Ice and Land Surfaces Using Bistatically Scattered GNSS Signals from Low Earth Orbit. Ph.D. Thesis, University of Surrey, Guildford, UK, 2006. [Google Scholar]
- Gleason, S. Towards Sea Ice Remote Sensing with Space Detected GPS Signals: Demonstration of Technical Feasibility and Initial Consistency Check Using Low Resolution Sea Ice Information. Remote Sens. 2010, 2, 2017–2039. [Google Scholar] [CrossRef] [Green Version]
- Yan, Q.; Huang, W. Sea ice detection from GNSS-R Delay-Doppler Map. In Proceedings of the 2016 17th International Symposium on Antenna Technology and Applied Electromagnetics (ANTEM), Montreal, QC, Canada, 10–13 July 2016; pp. 1–2. [Google Scholar] [CrossRef]
- Zhang, G.; Guo, J.; Yang, D.; Wang, F.; Gao, H. Sea Ice Edge Detection Using Spaceborne GNSS-R Signal. Geomatics Inf. Sci. Wuhan Univ. 2019, 44, 668–674. [Google Scholar]
- Cartwright, J.; Banks, C.J.; Srokosz, M. Sea Ice Detection Using GNSS-R Data From TechDemoSat-1. J. Geophys. Res. Ocean. 2019, 124, 5801–5810. [Google Scholar] [CrossRef]
- Yan, Q.; Huang, W. Sea Ice Detection Based on Unambiguous Retrieval of Scattering Coefficient from GNSS-R Delay-Doppler Maps. In Proceedings of the 2018 OCEANS—MTS/IEEE Kobe Techno-Oceans (OTO), Kobe, Japan, 28–31 May 2018; pp. 1–5. [Google Scholar] [CrossRef]
- Valencia, E.; Camps, A.; Marchan-Hernandez, J.F.; Park, H.; Bosch-Lluis, X.; Rodriguez-Alvarez, N.; Ramos-Perez, I. Ocean Surface’s Scattering Coefficient Retrieval by Delay–Doppler Map Inversion. IEEE Geosci. Remote Sens. Lett. 2011, 8, 750–754. [Google Scholar] [CrossRef]
- Zavorotny, V.; Voronovich, A. Scattering of GPS signals from the ocean with wind remote sensing application. IEEE Trans. Geosci. Remote Sens. 2000, 38, 951–964. [Google Scholar] [CrossRef] [Green Version]
- Marchan-Hernandez, J.; Camps, A.; Rodriguez-Alvarez, N.; Valencia, E.; Bosch-Lluis, X.; Ramos-Perez, I. An Efficient Algorithm to the Simulation of Delay–Doppler Maps of Reflected Global Navigation Satellite System Signals. IEEE Trans. Geosci. Remote Sens. 2009, 47, 2733–2740. [Google Scholar] [CrossRef]
- Schiavulli, D.; Nunziata, F.; Migliaccio, M.; Frappart, F.; Ramilien, G.; Darrozes, J. Reconstruction of the Radar Image From Actual DDMs Collected by TechDemoSat-1 GNSS-R Mission. IEEE J. Sel. Top. Appl. Earth Obs. Remote Sens. 2016, 9, 4700–4708. [Google Scholar] [CrossRef]
- Shen, X.; Zhang, J.; Zhang, X.; Meng, J.; Ke, C. Sea Ice Classification Using Cryosat-2 Altimeter Data by Optimal Classifier–Feature Assembly. IEEE Geosci. Remote Sens. Lett. 2017, 14, 1948–1952. [Google Scholar] [CrossRef]
- Bobylev, L.P.; Zabolotskikh, E.V.; Mitnik, L.M.; Johannessenn, O.M. Neural-Network based algorithm for ice concentration retrievals from satellite passive microwave data. In Proceedings of the 2008 Microwave Radiometry and Remote Sensing of the Environment, Firenze, Italy, 11–14 March 2008; pp. 1–4. [Google Scholar] [CrossRef]
- Werbos, P. Beyond Regression: New Tools for Prediction and Analysis in the Behavioral Sciences. Ph.D. Thesis, Harvard University, Cambridge, MA, USA, 1974. [Google Scholar]
- Marquardt, D.W. An Algorithm for Least-Squares Estimation of Nonlinear Parameters. J. Soc. Ind. Appl. Math. 1963, 11, 431–441. [Google Scholar] [CrossRef]
- LeCun, Y.A.; Bottou, L.; Orr, G.B.; Müller, K.R. Efficient BackProp; Springer: Berlin/Heidelberg, Germany, 2012; pp. 9–48. [Google Scholar] [CrossRef]
- Cortes, C.; Vapnik, V. Support-vector networks. Mach. Learn. 1995, 20, 273–297. [Google Scholar] [CrossRef]
- Pal, M.; Mather, P.M. Support vector machines for classification in remote sensing. Int. J. Remote Sens. 2005, 26, 1007–1011. [Google Scholar] [CrossRef]
- Yan, Q.; Huang, W. Sea Ice Concentration Estimation From TechDemoSat-1 Data Using Support Vector Regression. In Proceedings of the 2019 IEEE Radar Conference (RadarConf19), Boston, MA, USA, 2–7 June 2019; pp. 1–6. [Google Scholar]
- Cavalieri, D.J.; Parkinson, C.L.; Gloerson, P.; Zwally, H.J. Sea Ice Concentrations from Nimbus-7 SMMR and DMSP SSM/I-SSMIS Passive Microwave Data; NASA DAAC National Snow and Ice Data Center: Boulder, CO, USA, 1996. [Google Scholar] [CrossRef]
- Rodriguez-Alvarez, N.; Holt, B.; Jaruwatanadilok, S.; Podest, E.; Cavanaugh, K.C. An Arctic sea ice multi-step classification based on GNSS-R data from the TDS-1 mission. Remote Sens. Environ. 2019, 230, 111202. [Google Scholar] [CrossRef]
- Rodriguez-Alvarez, N.; Garrison, J.L. Generalized Linear Observables for Ocean Wind Retrieval From Calibrated GNSS-R Delay–Doppler Maps. IEEE Trans. Geosci. Remote Sens. 2016, 54, 1142–1155. [Google Scholar] [CrossRef]
- Breiman, L.; Friedman, J.H.; Olshen, R.A.; Stone, C.J. Classification And Regression Trees; Wadsworth & Brooks: Monterey, CA, USA, 1984. [Google Scholar] [CrossRef]
- Mayers, D.; Ruf, C. Measuring Ice Thickness with Cygnss Altimetry. In Proceedings of the IGARSS 2018—2018 IEEE International Geoscience and Remote Sensing Symposium, Valencia, Spain, 22–27 July 2018; pp. 8535–8538. [Google Scholar] [CrossRef]
- Yan, Q.; Huang, W. Sea Ice Thickness Estimation from TechDemoSat-1 Data. In Proceedings of the Oceans 2019—MTS/IEEE Marseille, Marseille, France, 17–20 June 2019; pp. 1–4. [Google Scholar]
- Vant, M.R.; Ramseier, R.O.; Makios, V. The complex-dielectric constant of sea ice at frequencies in the range 0.1–40 GHz. J. Appl. Phys. 1978, 49, 1264–1280. [Google Scholar] [CrossRef]
- Ulaby, F.T.; Moore, R.K.; Fung, A.K. Microwave Remote Sensing: Active and Passive; Addison-Wesley: Boston, MA, USA, 1986; Volume 2, p. 2162. [Google Scholar]
- Tian-Kunze, X.; Kaleschke, L.; Maass, N. SMOS Daily Sea Ice Thickness Version 3. 2016. Available online: https://icdc.cen.uni-hamburg.de/1/daten/cryosphere/l3c-smos-sit.html (accessed on 31 October 2019).
- Yu, K.; Rizos, C.; Dempster, A.G. GNSS-Based Model-Free Sea Surface Height Estimation in Unknown Sea State Scenarios. IEEE J. Sel. Top. Appl. Earth Obs. Remote Sens. 2014, 7, 1424–1435. [Google Scholar] [CrossRef]
- Clarizia, M.P.; Ruf, C.; Cipollini, P.; Zuffada, C. First spaceborne observation of sea surface height using GPS-Reflectometry. Geophys. Res. Lett. 2016, 43, 767–774. [Google Scholar] [CrossRef]
- Helm, A. Ground-Based GPS Altimetry with the L1 OpenGPS Receiver Using Carrier Phase-Delay Observations of Reflected GPS Signals. Ph.D. Thesis, Postdam Deutsches GFZ, Potsdam, Germany, 2008. [Google Scholar]
- Hobiger, T.; Strandberg, J.; Haas, R. Inverse modeling of ground-based GNSS-R—Results and new possibilities. In Proceedings of the 2017 IEEE International Geoscience and Remote Sensing Symposium (IGARSS), Fort Worth, TX, USA, 23–28 July 2017; pp. 2671–2681. [Google Scholar] [CrossRef]
Figure 1.
TechDemoSat-1 (TDS-1) delay-Doppler maps (DDMs) collected over regions with varying SICs: (a) 0%, (b) 50%, and (c) 92%, respectively. Each DDM has been normalized by its peak power value.
Figure 1.
TechDemoSat-1 (TDS-1) delay-Doppler maps (DDMs) collected over regions with varying SICs: (a) 0%, (b) 50%, and (c) 92%, respectively. Each DDM has been normalized by its peak power value.
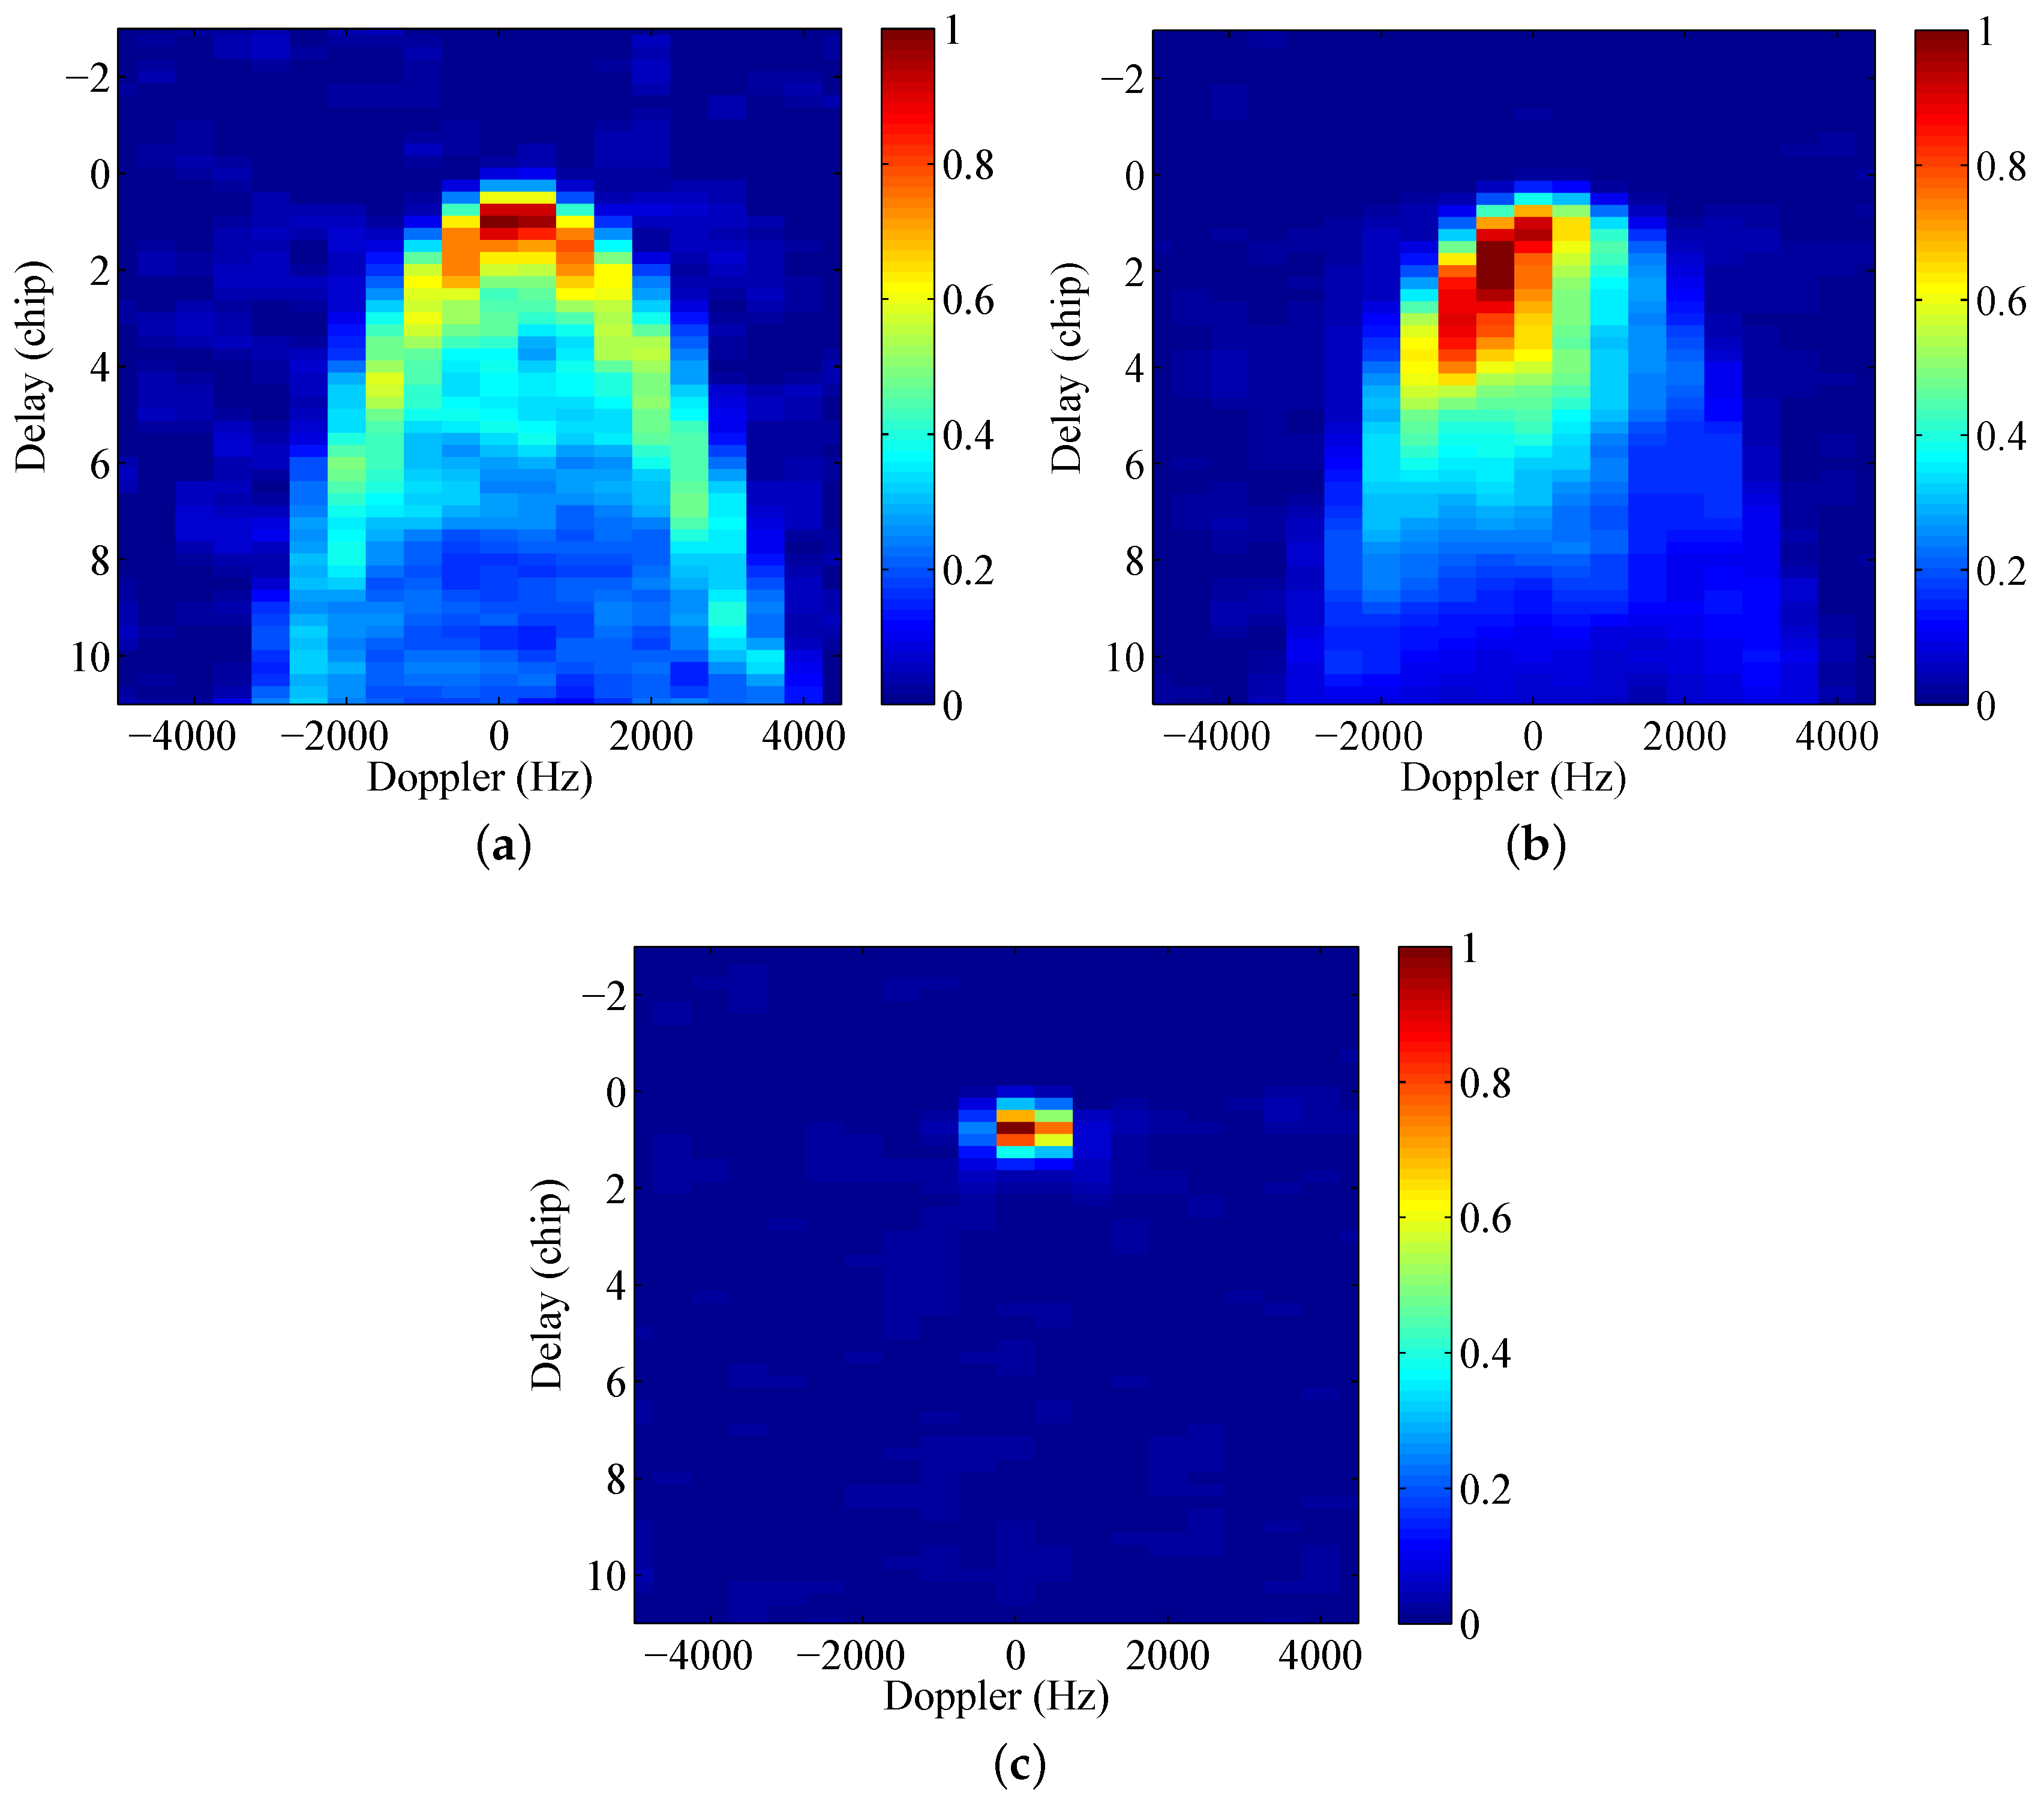
Figure 2.
A flowchart for sea ice detection using DDM observables.

Figure 3.
Demonstration of ambiguity problem and its solution by the multi-scan method. The glistening zones of two different DDM acquisition consecutively are shown in blue and orange, respectively. and denote the separate regions that are symmetrical to the ambiguity-free line in red.
Figure 3.
Demonstration of ambiguity problem and its solution by the multi-scan method. The glistening zones of two different DDM acquisition consecutively are shown in blue and orange, respectively. and denote the separate regions that are symmetrical to the ambiguity-free line in red.

Figure 4.
Flowchart of general processes for machine learning-based sea ice sensing techniques.

Figure 5.
Diagram of (a) Neural Network (NN) and (b) Convolutional Neural Network (CNN).

Figure 6.
Outcomes of sea ice detection using TDS-1 data. Training and test sets are separated by a solid line.
Figure 6.
Outcomes of sea ice detection using TDS-1 data. Training and test sets are separated by a solid line.

Figure 7.
SIC estimation using machine learning-based methods. In target (ground-truth) data, DDMs associated with patterns marked by arrows and tagged by cross symbols result in overestimation and underestimation, respectively.
Figure 7.
SIC estimation using machine learning-based methods. In target (ground-truth) data, DDMs associated with patterns marked by arrows and tagged by cross symbols result in overestimation and underestimation, respectively.

Figure 8.
Averaged SIC estimations using different machine learning methods and the reference data. The difference between the reference and support vector regression (SVR)-FS result is also presented for illustration.
Figure 8.
Averaged SIC estimations using different machine learning methods and the reference data. The difference between the reference and support vector regression (SVR)-FS result is also presented for illustration.

Figure 9.
Density plot comparing SIT from TDS-1 retrieval and collocated SMOS data with the 1:1 reference line (magenta). The data densities were calculated relative to the maximum of overall distribution.
Figure 9.
Density plot comparing SIT from TDS-1 retrieval and collocated SMOS data with the 1:1 reference line (magenta). The data densities were calculated relative to the maximum of overall distribution.

Figure 10.
The influence of SIC on the relative difference between the SMOS and TDS-1 SITs. Higher SIC generally results in less discrepancy.
Figure 10.
The influence of SIC on the relative difference between the SMOS and TDS-1 SITs. Higher SIC generally results in less discrepancy.


Table 1.
Accuracy of Ice Detection.
| ID | Observable | Full-Size Input | Cropped Input | FS | |||
|---|---|---|---|---|---|---|---|
| CNN | NN | CNN | NN | NN | SVM | ||
| RD 17 (training) | 97.96% | 99.15% | 99.60% | 99.03% | 99.13% | 98.95% | 98.81% |
| RD 18 (test) | 98.17% | 98.12% | 97.94% | 98.94% | 99.01% | 98.63% | 99.06% |
| RD 19 (test) | 96.58% | 97.97% | 97.29% | 98.77% | 98.54% | 98.21% | 98.33% |
| RD 23 (test) | 97.67% | 96.42% | 93.98% | 98.41% | 98.04% | 97.00% | 97.58% |
| RD 27 (test) | 98.10% | 97.04% | 95.97% | 98.43% | 98.41% | 97.78% | 98.64% |
| Average | 97.78% | 97.83% | 97.17% | 98.73% | 98.67% | 98.18% | 98.56% |
Table 2.
Error Statistics for sea ice concentration (SIC) Estimation Using Different Inputs.
| ID | Full-Size Input | Cropped Input | FS | |||||||||
|---|---|---|---|---|---|---|---|---|---|---|---|---|
| CNN | NN | CNN | NN | CNN | NN | CNN | NN | NN | SVR | NN | SVR | |
| RD 17 (training) | 0.15 | 0.11 | 0.95 | 0.97 | 0.15 | 0.11 | 0.95 | 0.97 | 0.13 | 0.12 | 0.96 | 0.97 |
| RD 18 (test) | 0.17 | 0.20 | 0.91 | 0.88 | 0.16 | 0.17 | 0.92 | 0.91 | 0.17 | 0.16 | 0.91 | 0.92 |
| RD 19 (test) | 0.15 | 0.17 | 0.93 | 0.92 | 0.15 | 0.16 | 0.94 | 0.93 | 0.16 | 0.15 | 0.93 | 0.94 |
| RD 23 (test) | 0.16 | 0.19 | 0.93 | 0.91 | 0.15 | 0.13 | 0.94 | 0.95 | 0.15 | 0.15 | 0.94 | 0.95 |
| RD 27 (test) | 0.18 | 0.20 | 0.89 | 0.86 | 0.17 | 0.18 | 0.89 | 0.90 | 0.17 | 0.16 | 0.90 | 0.90 |
| Average | 0.16 | 0.17 | 0.92 | 0.91 | 0.16 | 0.15 | 0.93 | 0.93 | 0.15 | 0.15 | 0.93 | 0.94 |
Table 3.
Applications of Sea Ice Sensing using Spaceborne GNSS-R.
| Application | Source | Technique | Accuracy |
|---|---|---|---|
| Altimetry/SIC | [72,73] | N/A | |
| Detection | [62] | Observable-based | 97.78% |
| Detection | [65] | Observable-based | |
| Detection | [70] | Observable-based | |
| Detection | [66] | TSVD-based retrieval | |
| Detection | [77] | SIA-based retrieval | |
| Detection | [75] | Observable-based | |
| Detection | [64] | SVM | 98.56% |
| Detection | [76] | Observable-based | |
| Detection/SIC | [69] | NN | 98.41%/0.93 (R) |
| Detection/SIC | [63] | CNN | 98.73%/0.93 (R) |
| SIC | [89] | SVR | 0.94 (R) |
| Type Classification | [91] | CART | |
| Altimetry | [67] | Waveform-based | 4.4 m (RMSD) |
| Altimetry | [68] | Phase-based | 4.7 cm (RMSD) |
© 2019 by the authors. Licensee MDPI, Basel, Switzerland. This article is an open access article distributed under the terms and conditions of the Creative Commons Attribution (CC BY) license (http://creativecommons.org/licenses/by/4.0/).
Share and Cite
MDPI and ACS Style
Yan, Q.; Huang, W. Sea Ice Remote Sensing Using GNSS-R: A Review. Remote Sens. 2019, 11, 2565. https://doi.org/10.3390/rs11212565
AMA Style
Yan Q, Huang W. Sea Ice Remote Sensing Using GNSS-R: A Review. Remote Sensing. 2019; 11(21):2565. https://doi.org/10.3390/rs11212565
Chicago/Turabian StyleYan, Qingyun, and Weimin Huang. 2019. "Sea Ice Remote Sensing Using GNSS-R: A Review" Remote Sensing 11, no. 21: 2565. https://doi.org/10.3390/rs11212565
Note that from the first issue of 2016, this journal uses article numbers instead of page numbers. See further details here.