Wide-Area InSAR Survey of Surface Deformation in Urban Areas and Geothermal Fields in the Eastern Trans-Mexican Volcanic Belt, Mexico

 ,
,  ,
,  ,
,
Abstract
:
1. Introduction
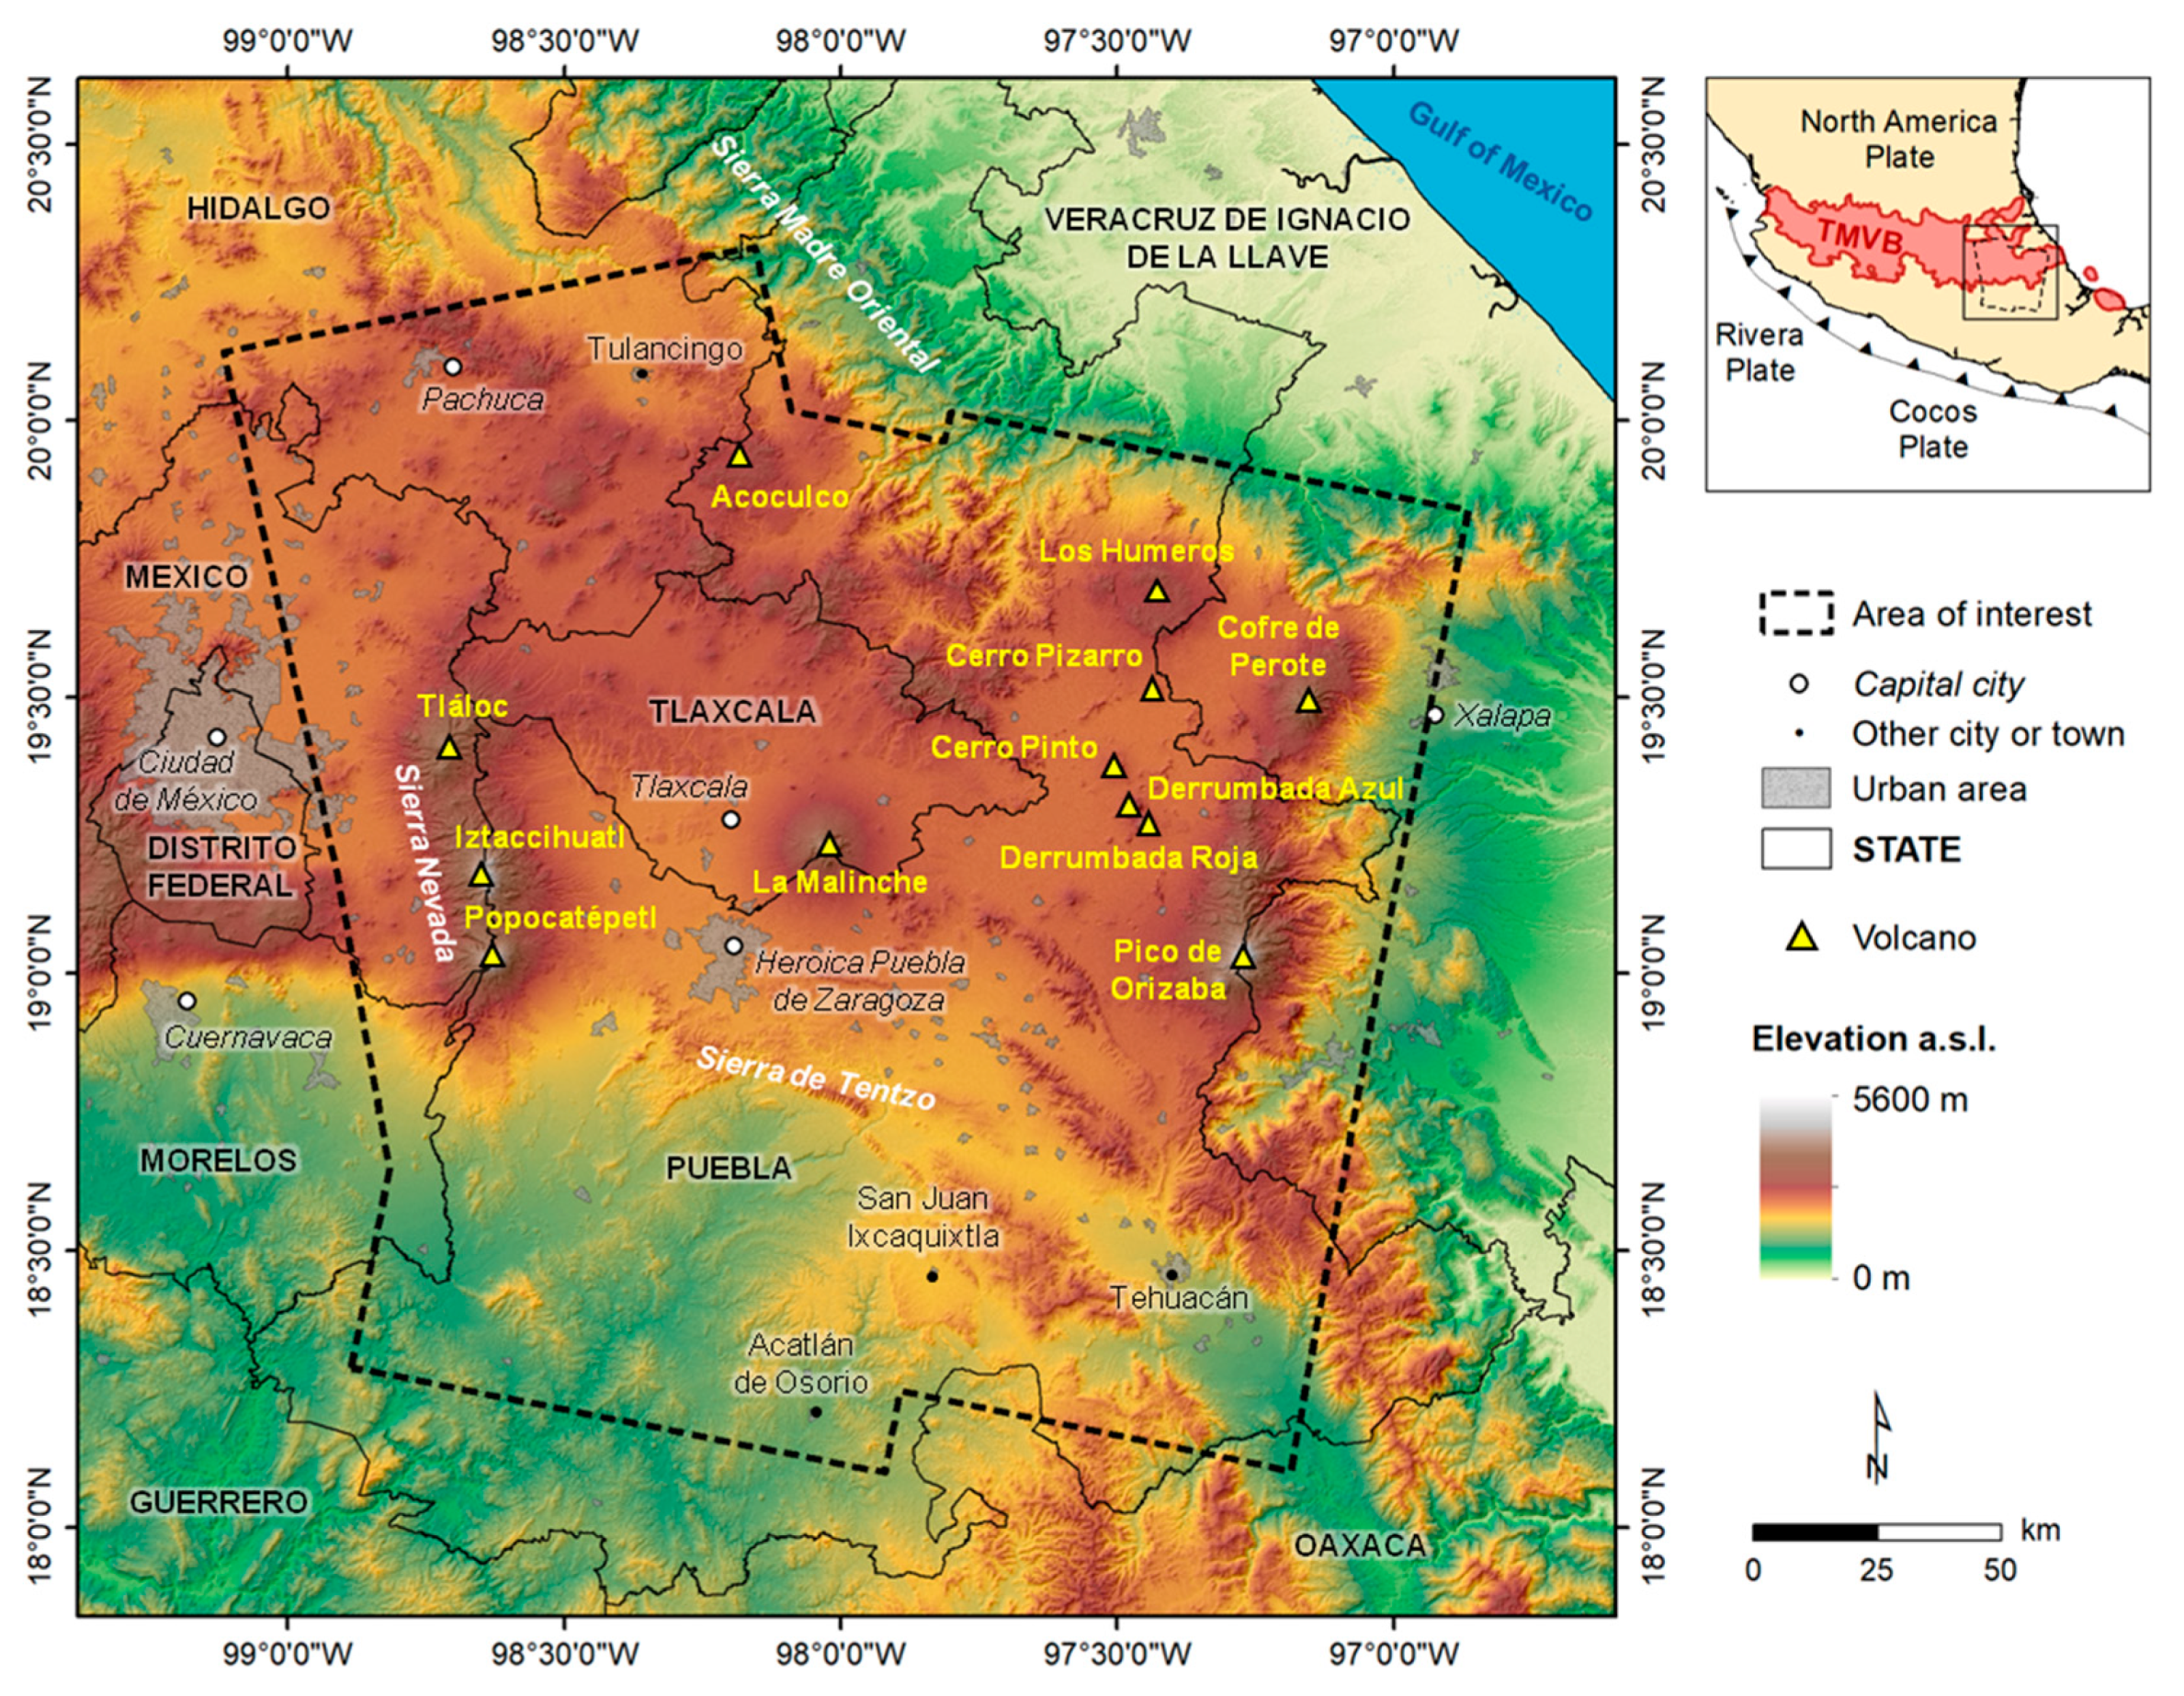
2. Study Area
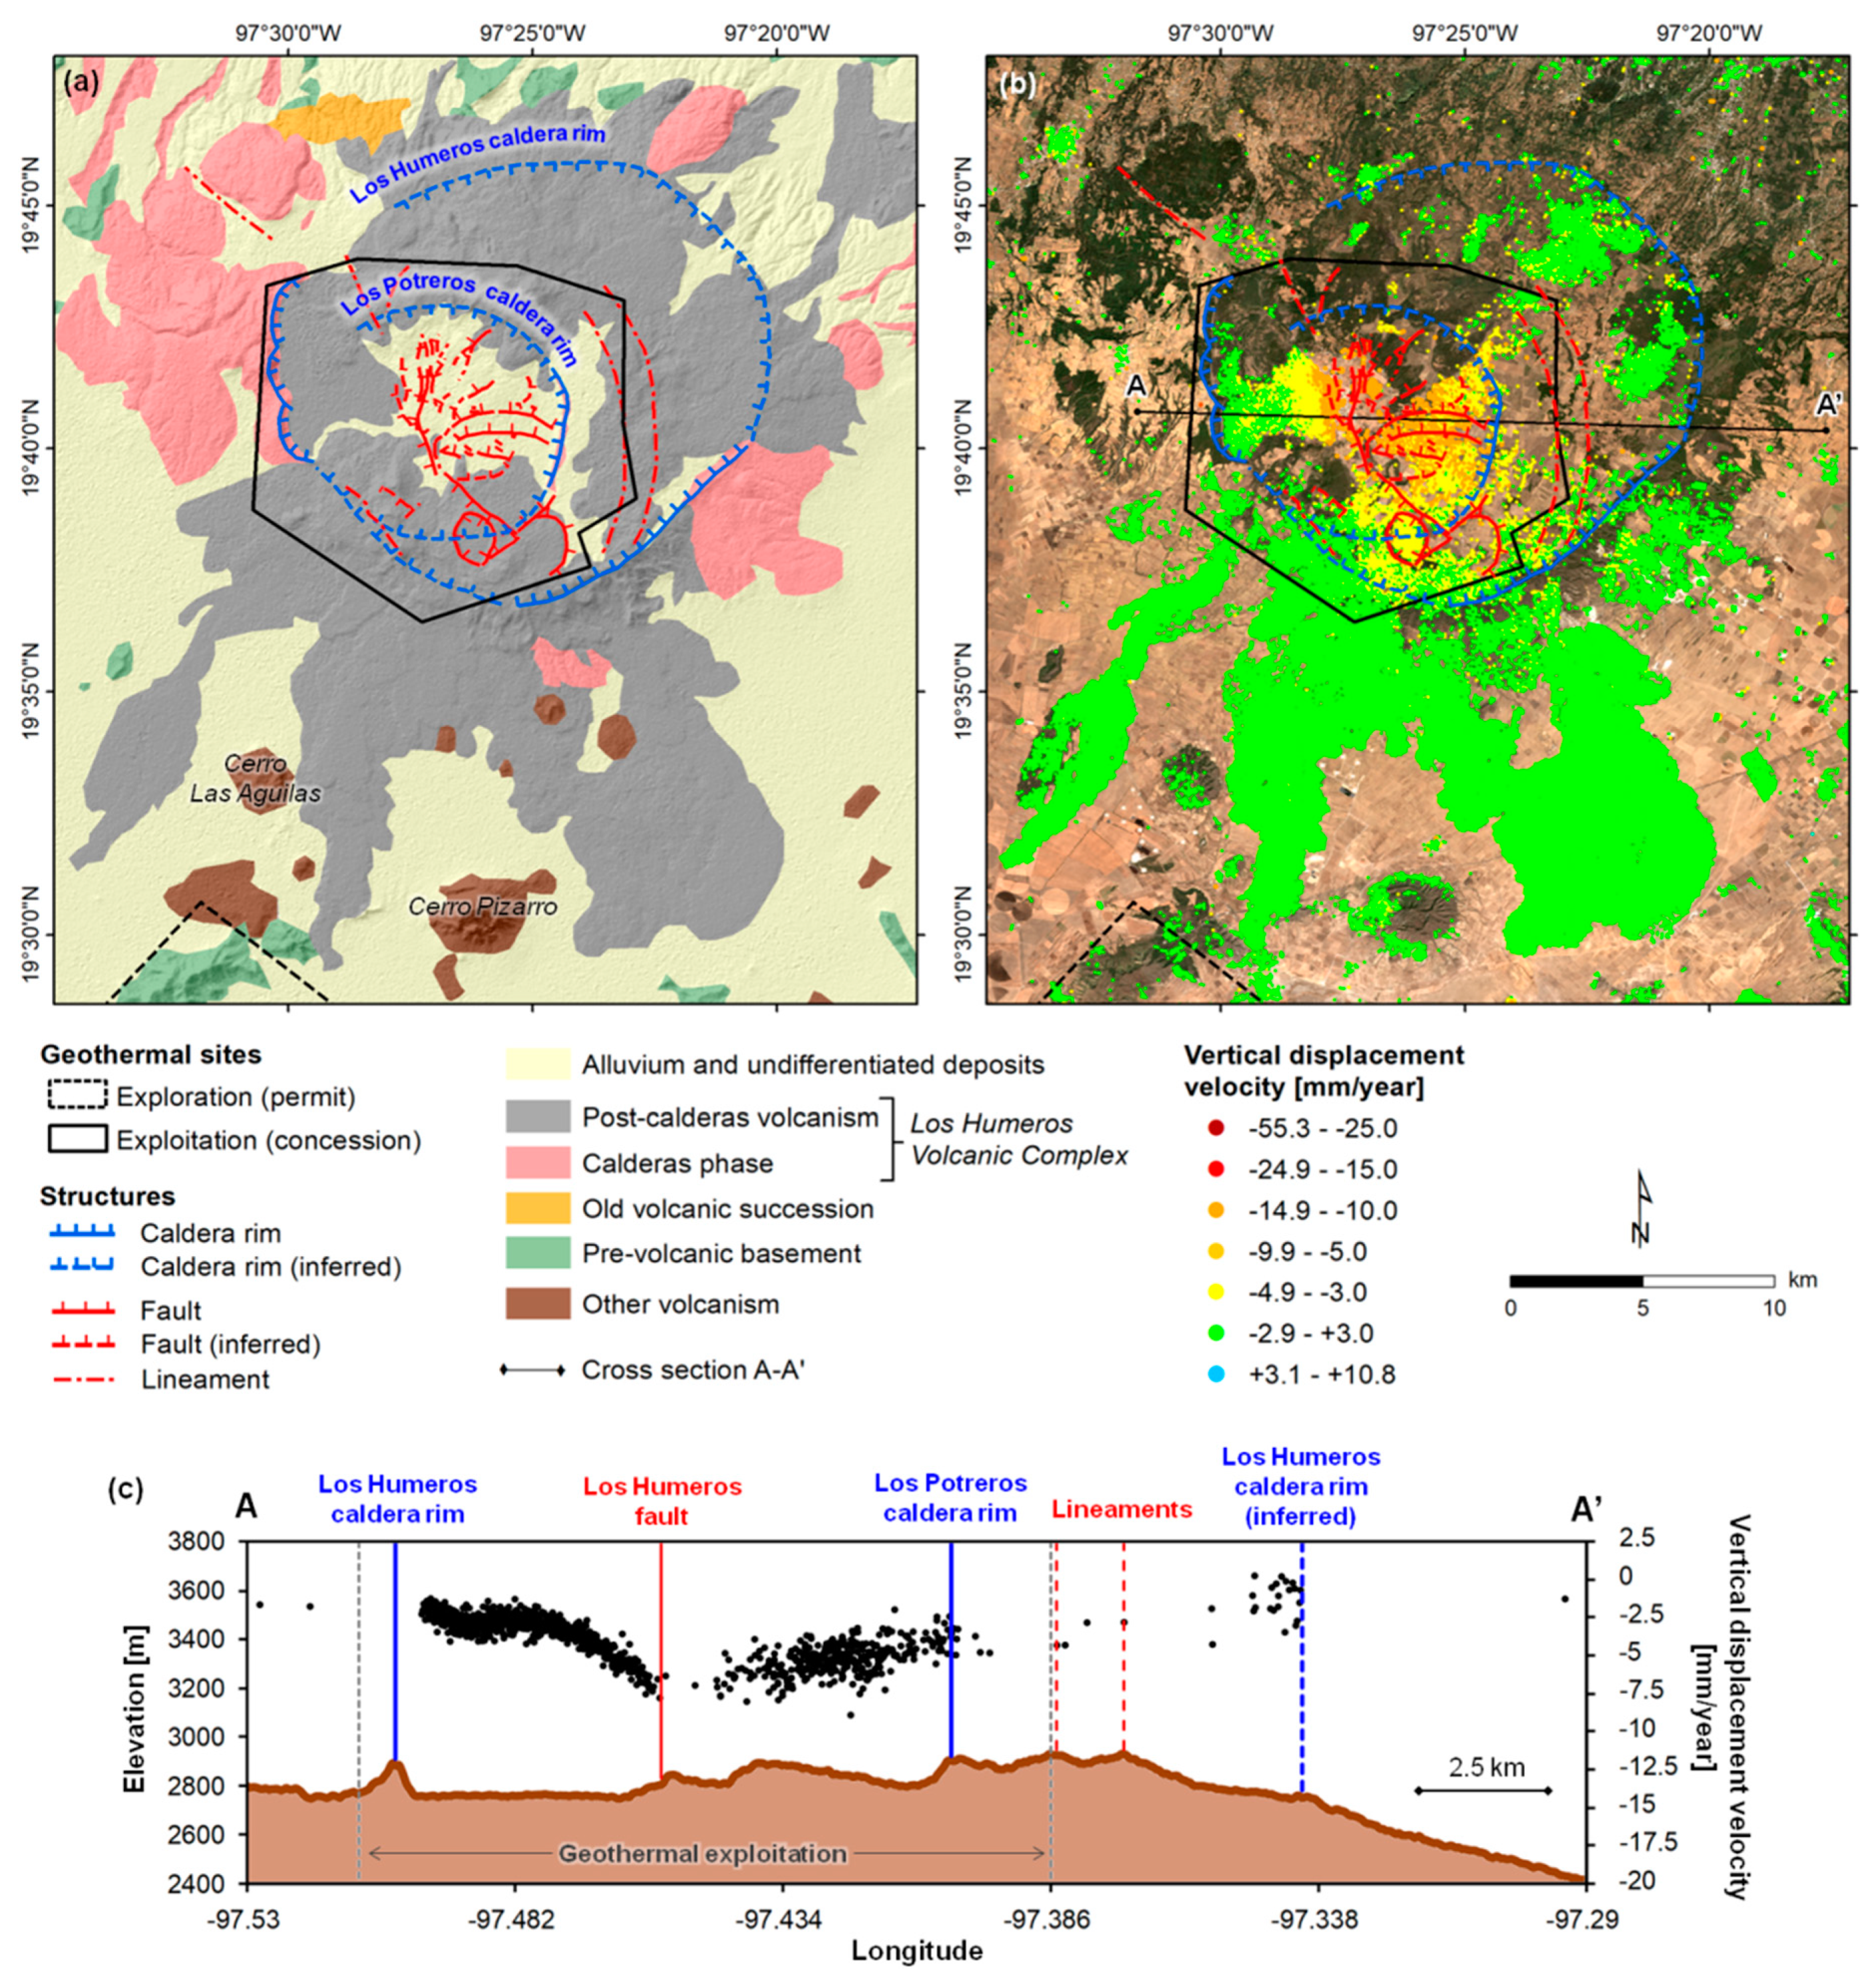
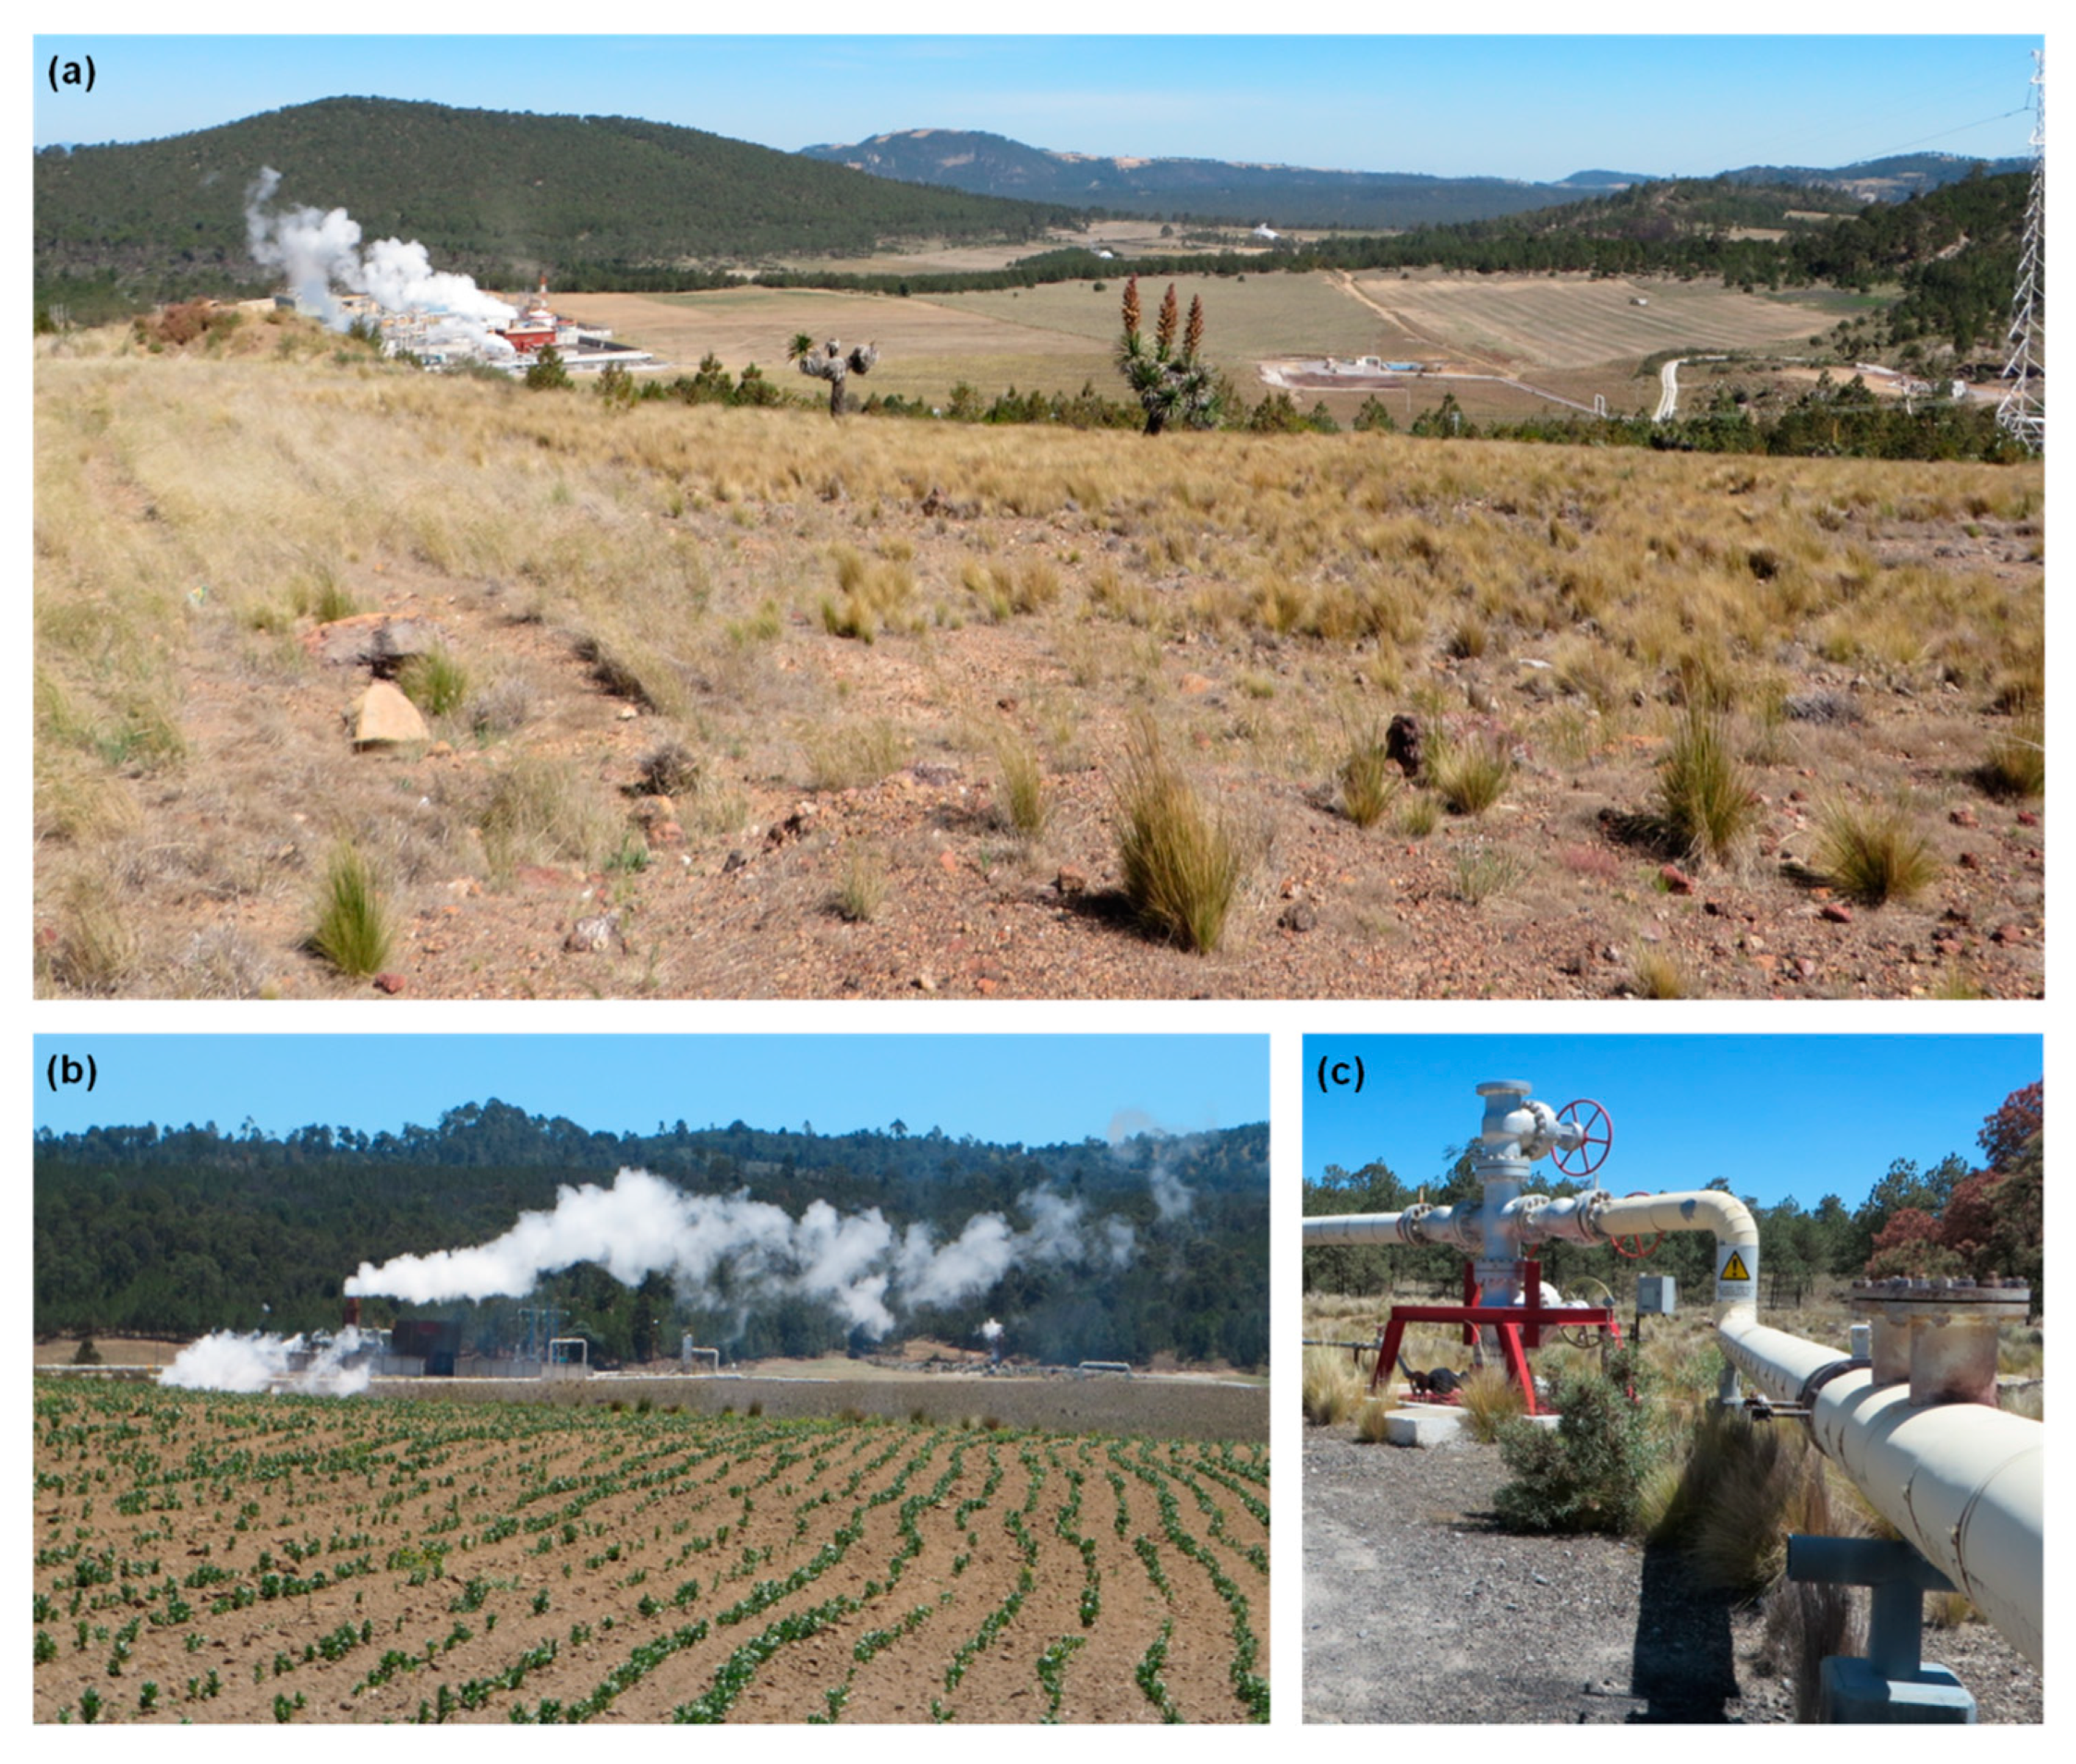
2.1. Los Humeros Caldera Complex
2.2. Las Derrumbadas Complex
2.3. Tulancingo-Acoculco Caldera Complex
2.4. Puebla and the Tecamachalco Valleys
3. Materials and Methods
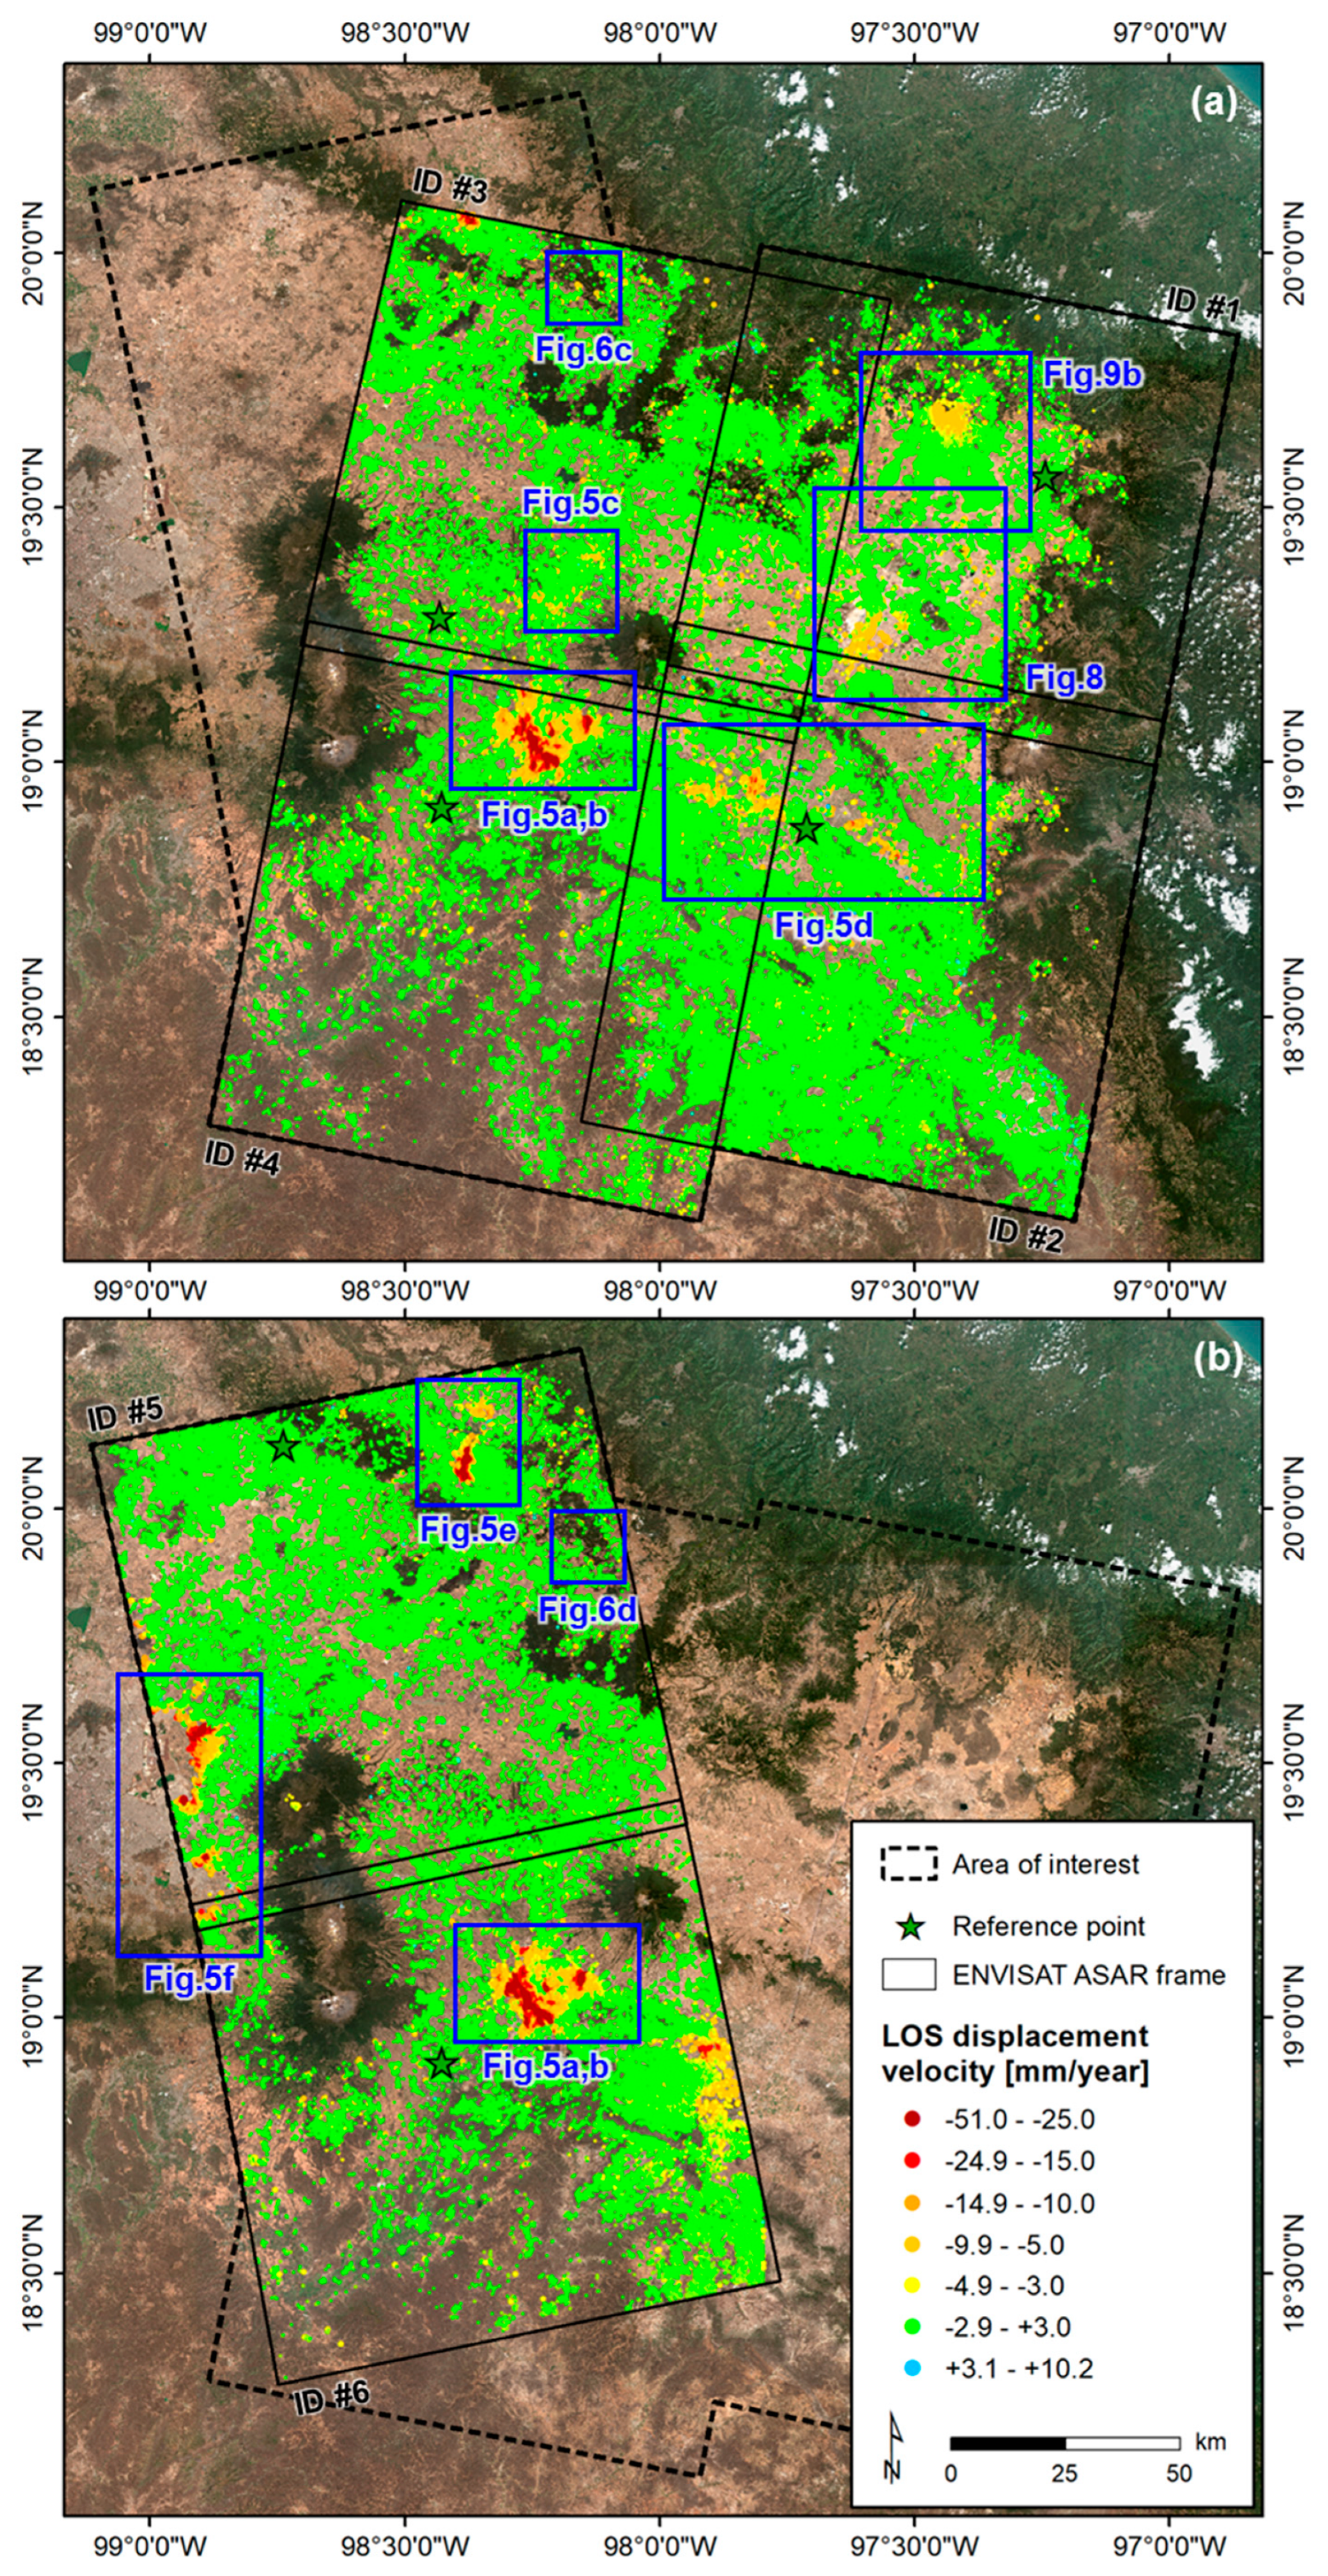
3.1. Satellite SAR Data
3.2. Multi-temporal InSAR Analysis
- 19.562 N, −97.244 E within the city of Perote in the Mexican state of Veracruz for data stack #1
- 18.872 N, −97.712 E onto limestone to the east of the town of Tecamachalco for stack #2
- 19.285 N, −98.432 E within the town of Texmelucan (25 km north-west of Puebla) for stack #3
- 18.912 N, −98.428 E within the town of Atlixco (15 km south-west of Puebla) for stacks #4 and #6
- 20.124 N, −98.738 E within the city of Pachuca for stack #5.
3.3. Estimation of Vertical and Horizontal Displacement Rates
4. Results and Discussion
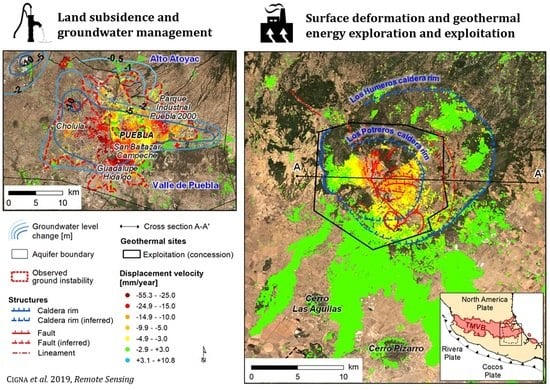
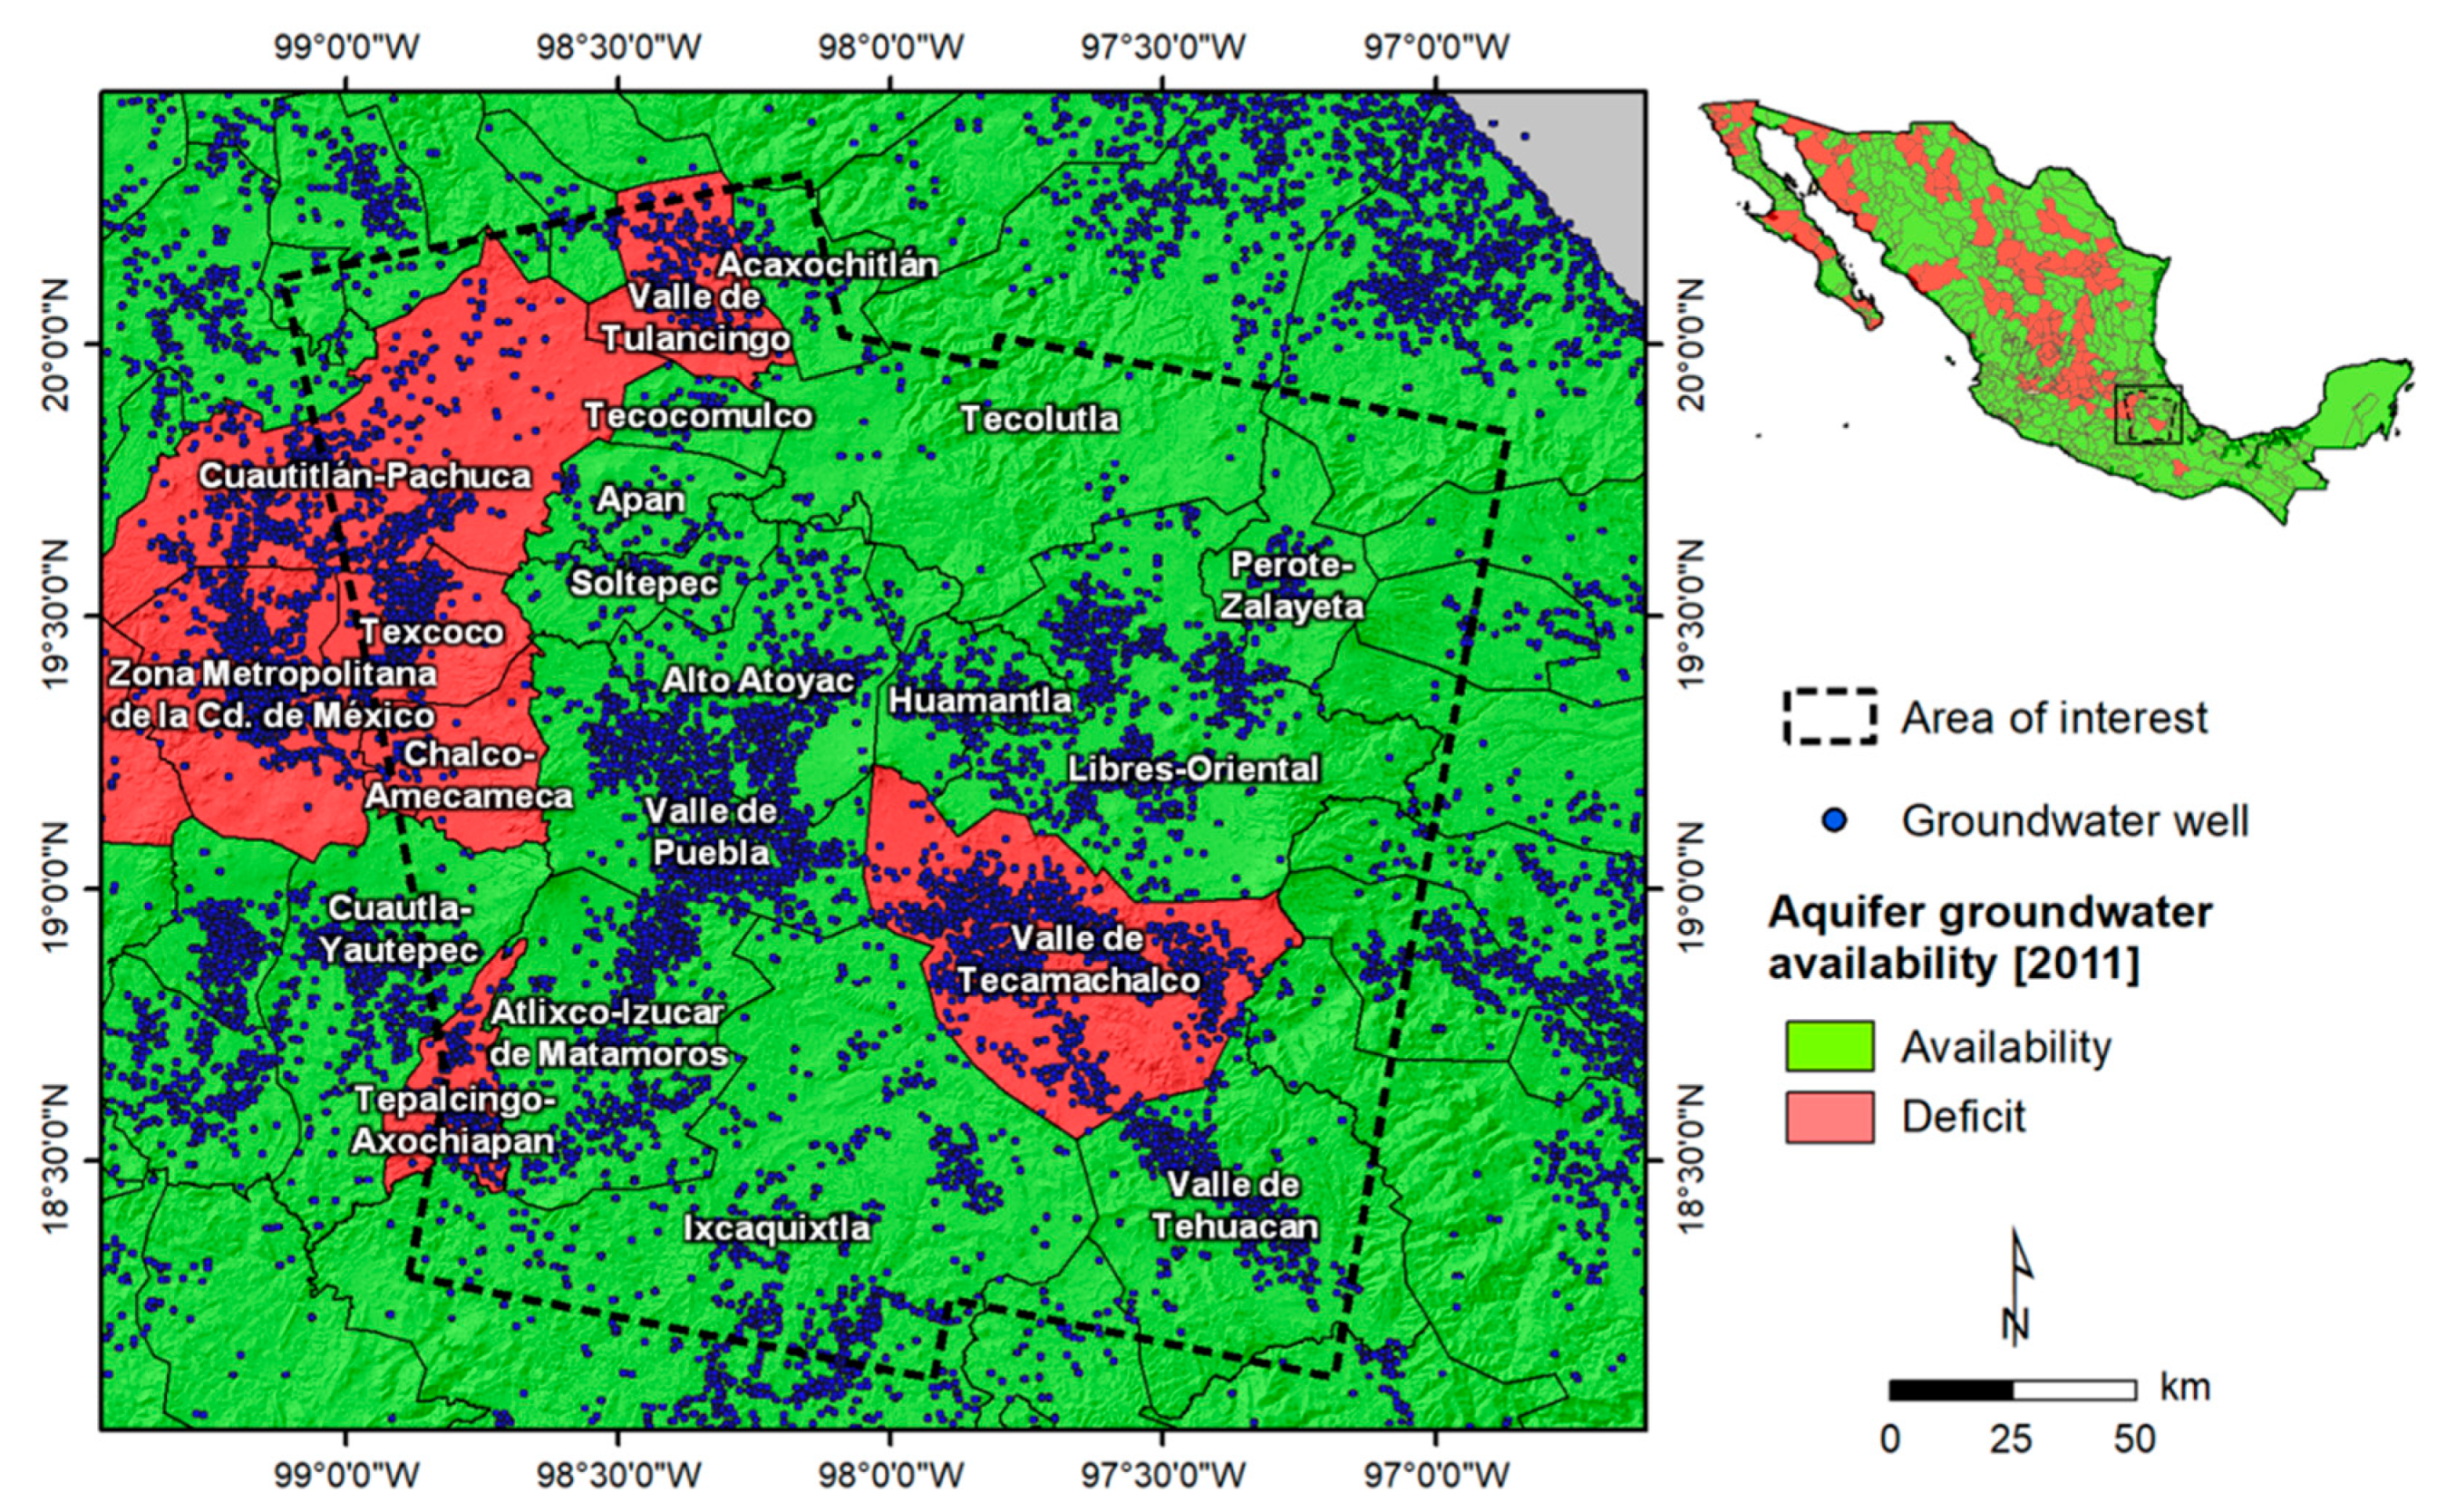
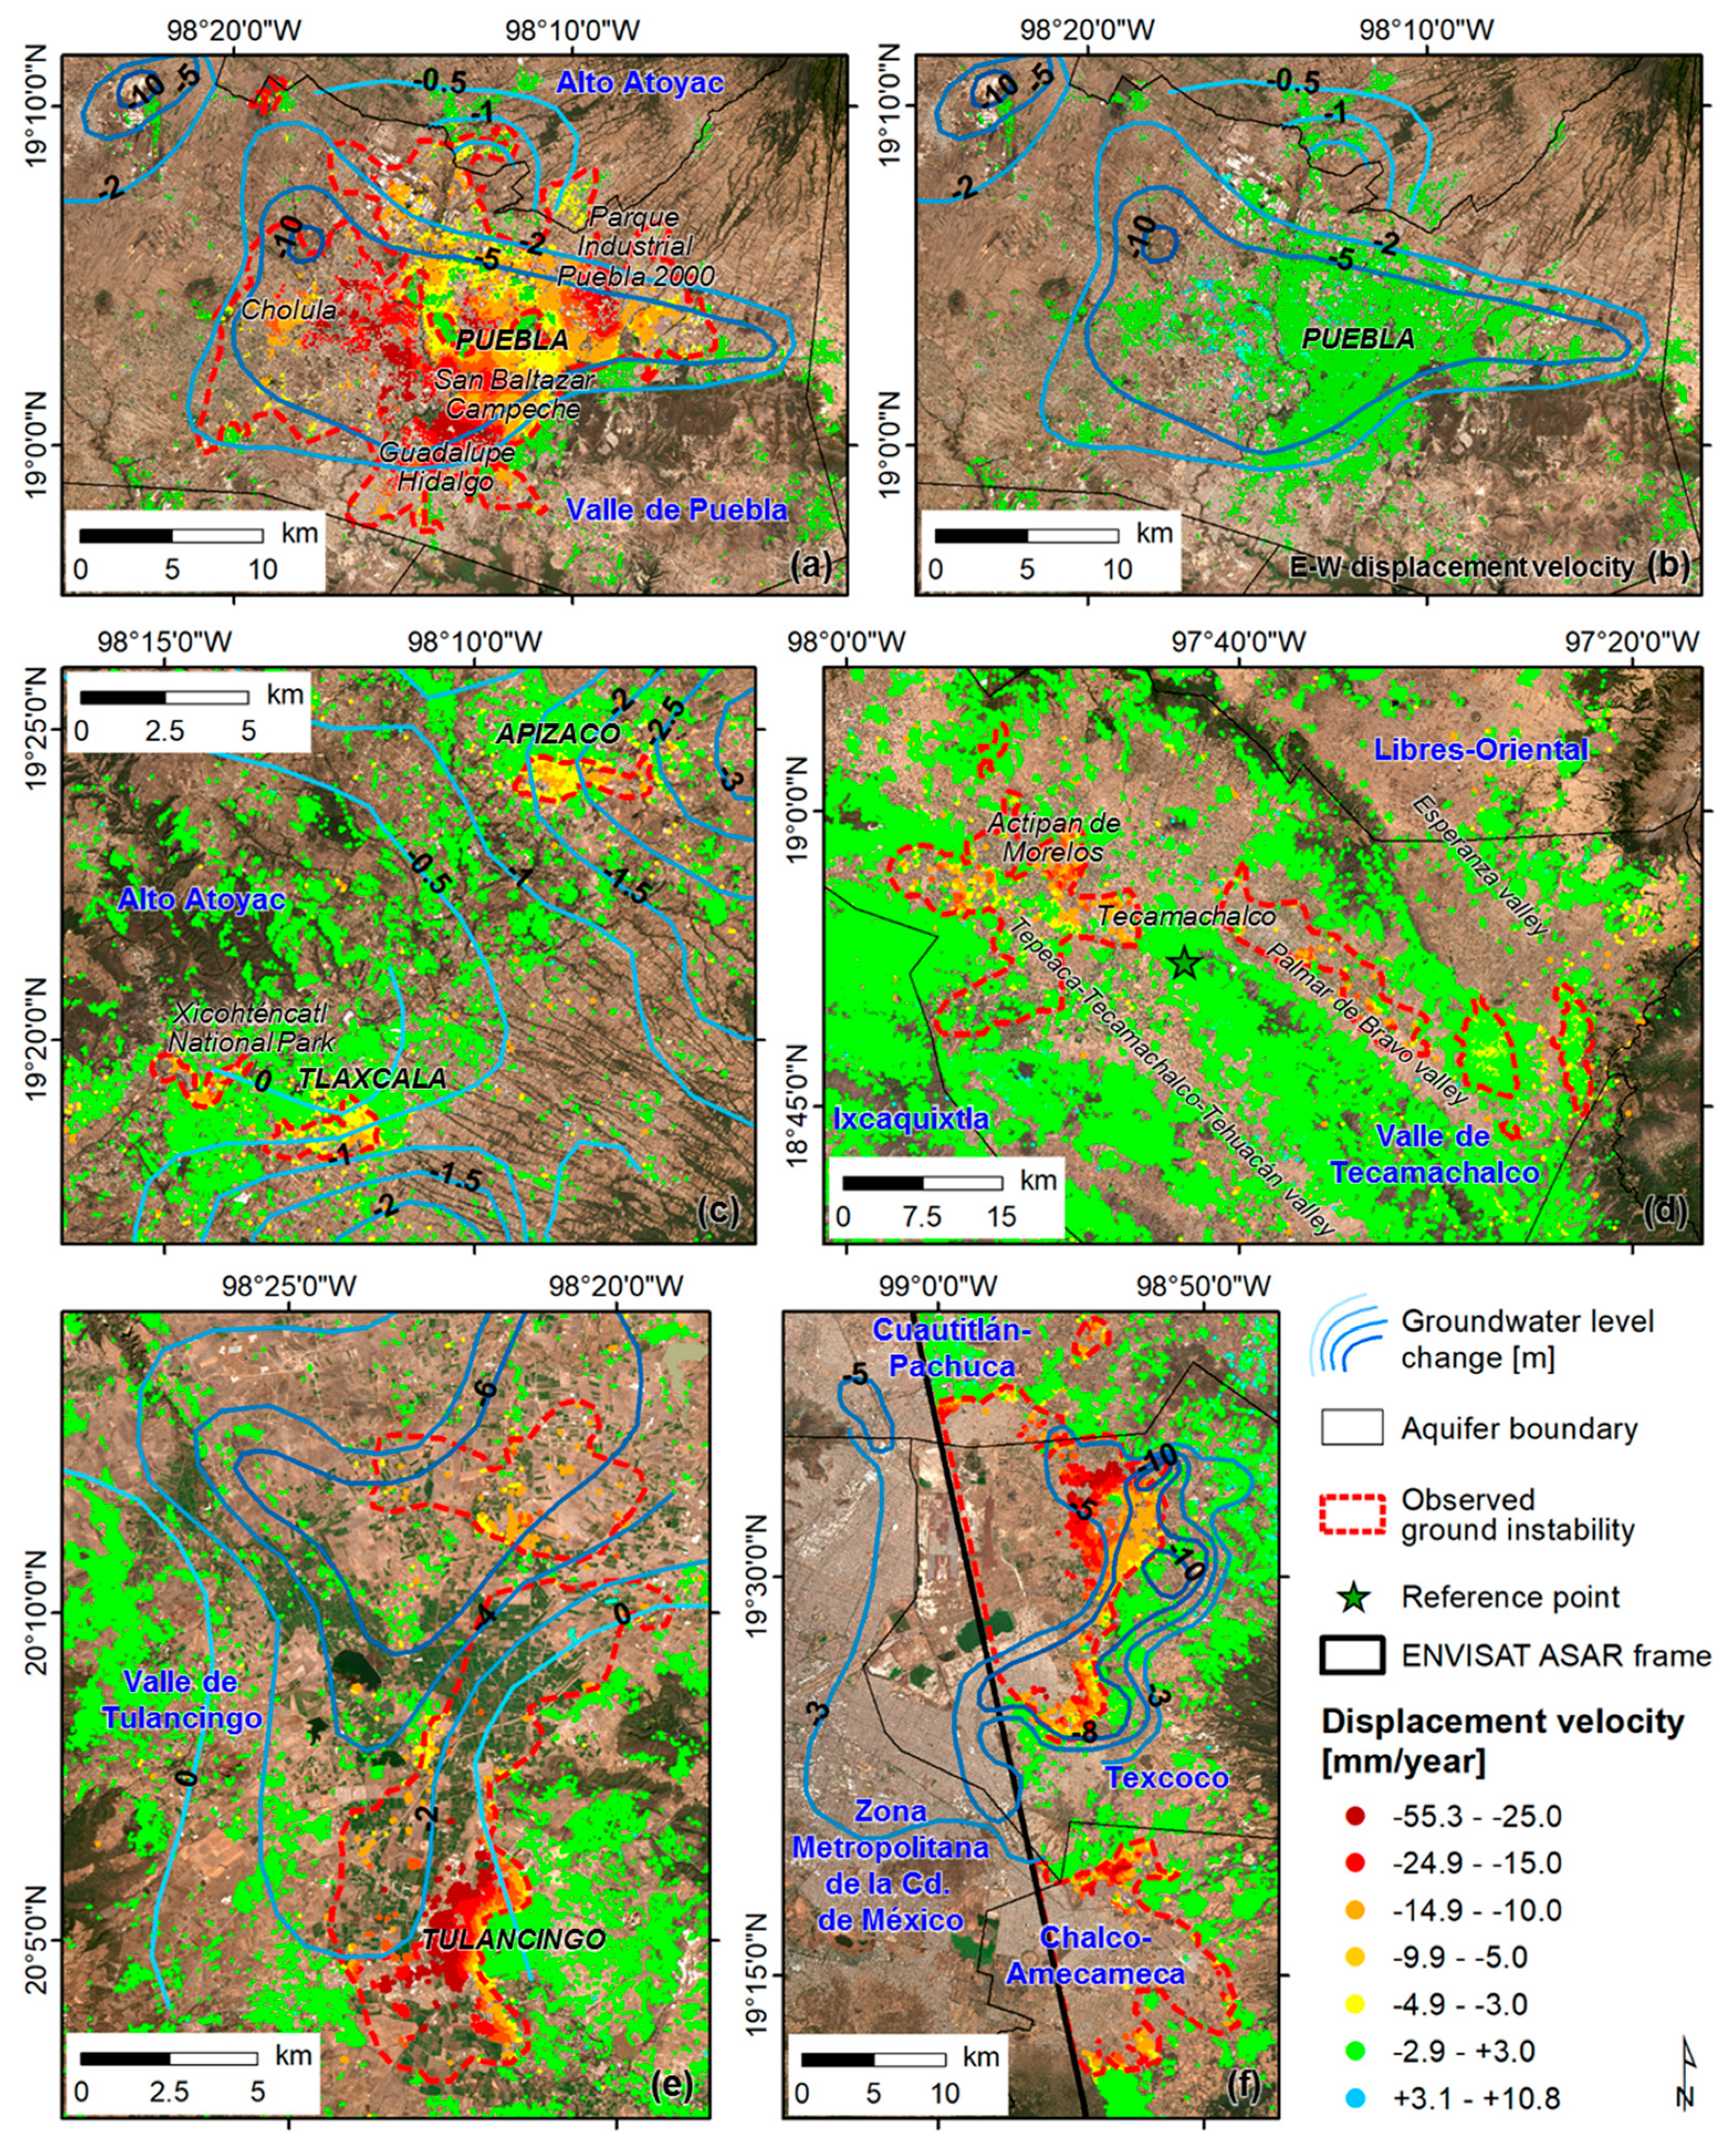
4.1. Land Subsidence and Groundwater Management
4.1.1. The Valley of Puebla
4.1.2. Tlaxcala and Apizaco
4.1.3. The Valley of Tecamachalco
4.1.4. The Valley of Tulancingo
4.1.5. Eastern Mexico City Metropolitan Area
4.2. Environmental Baseline Mapping
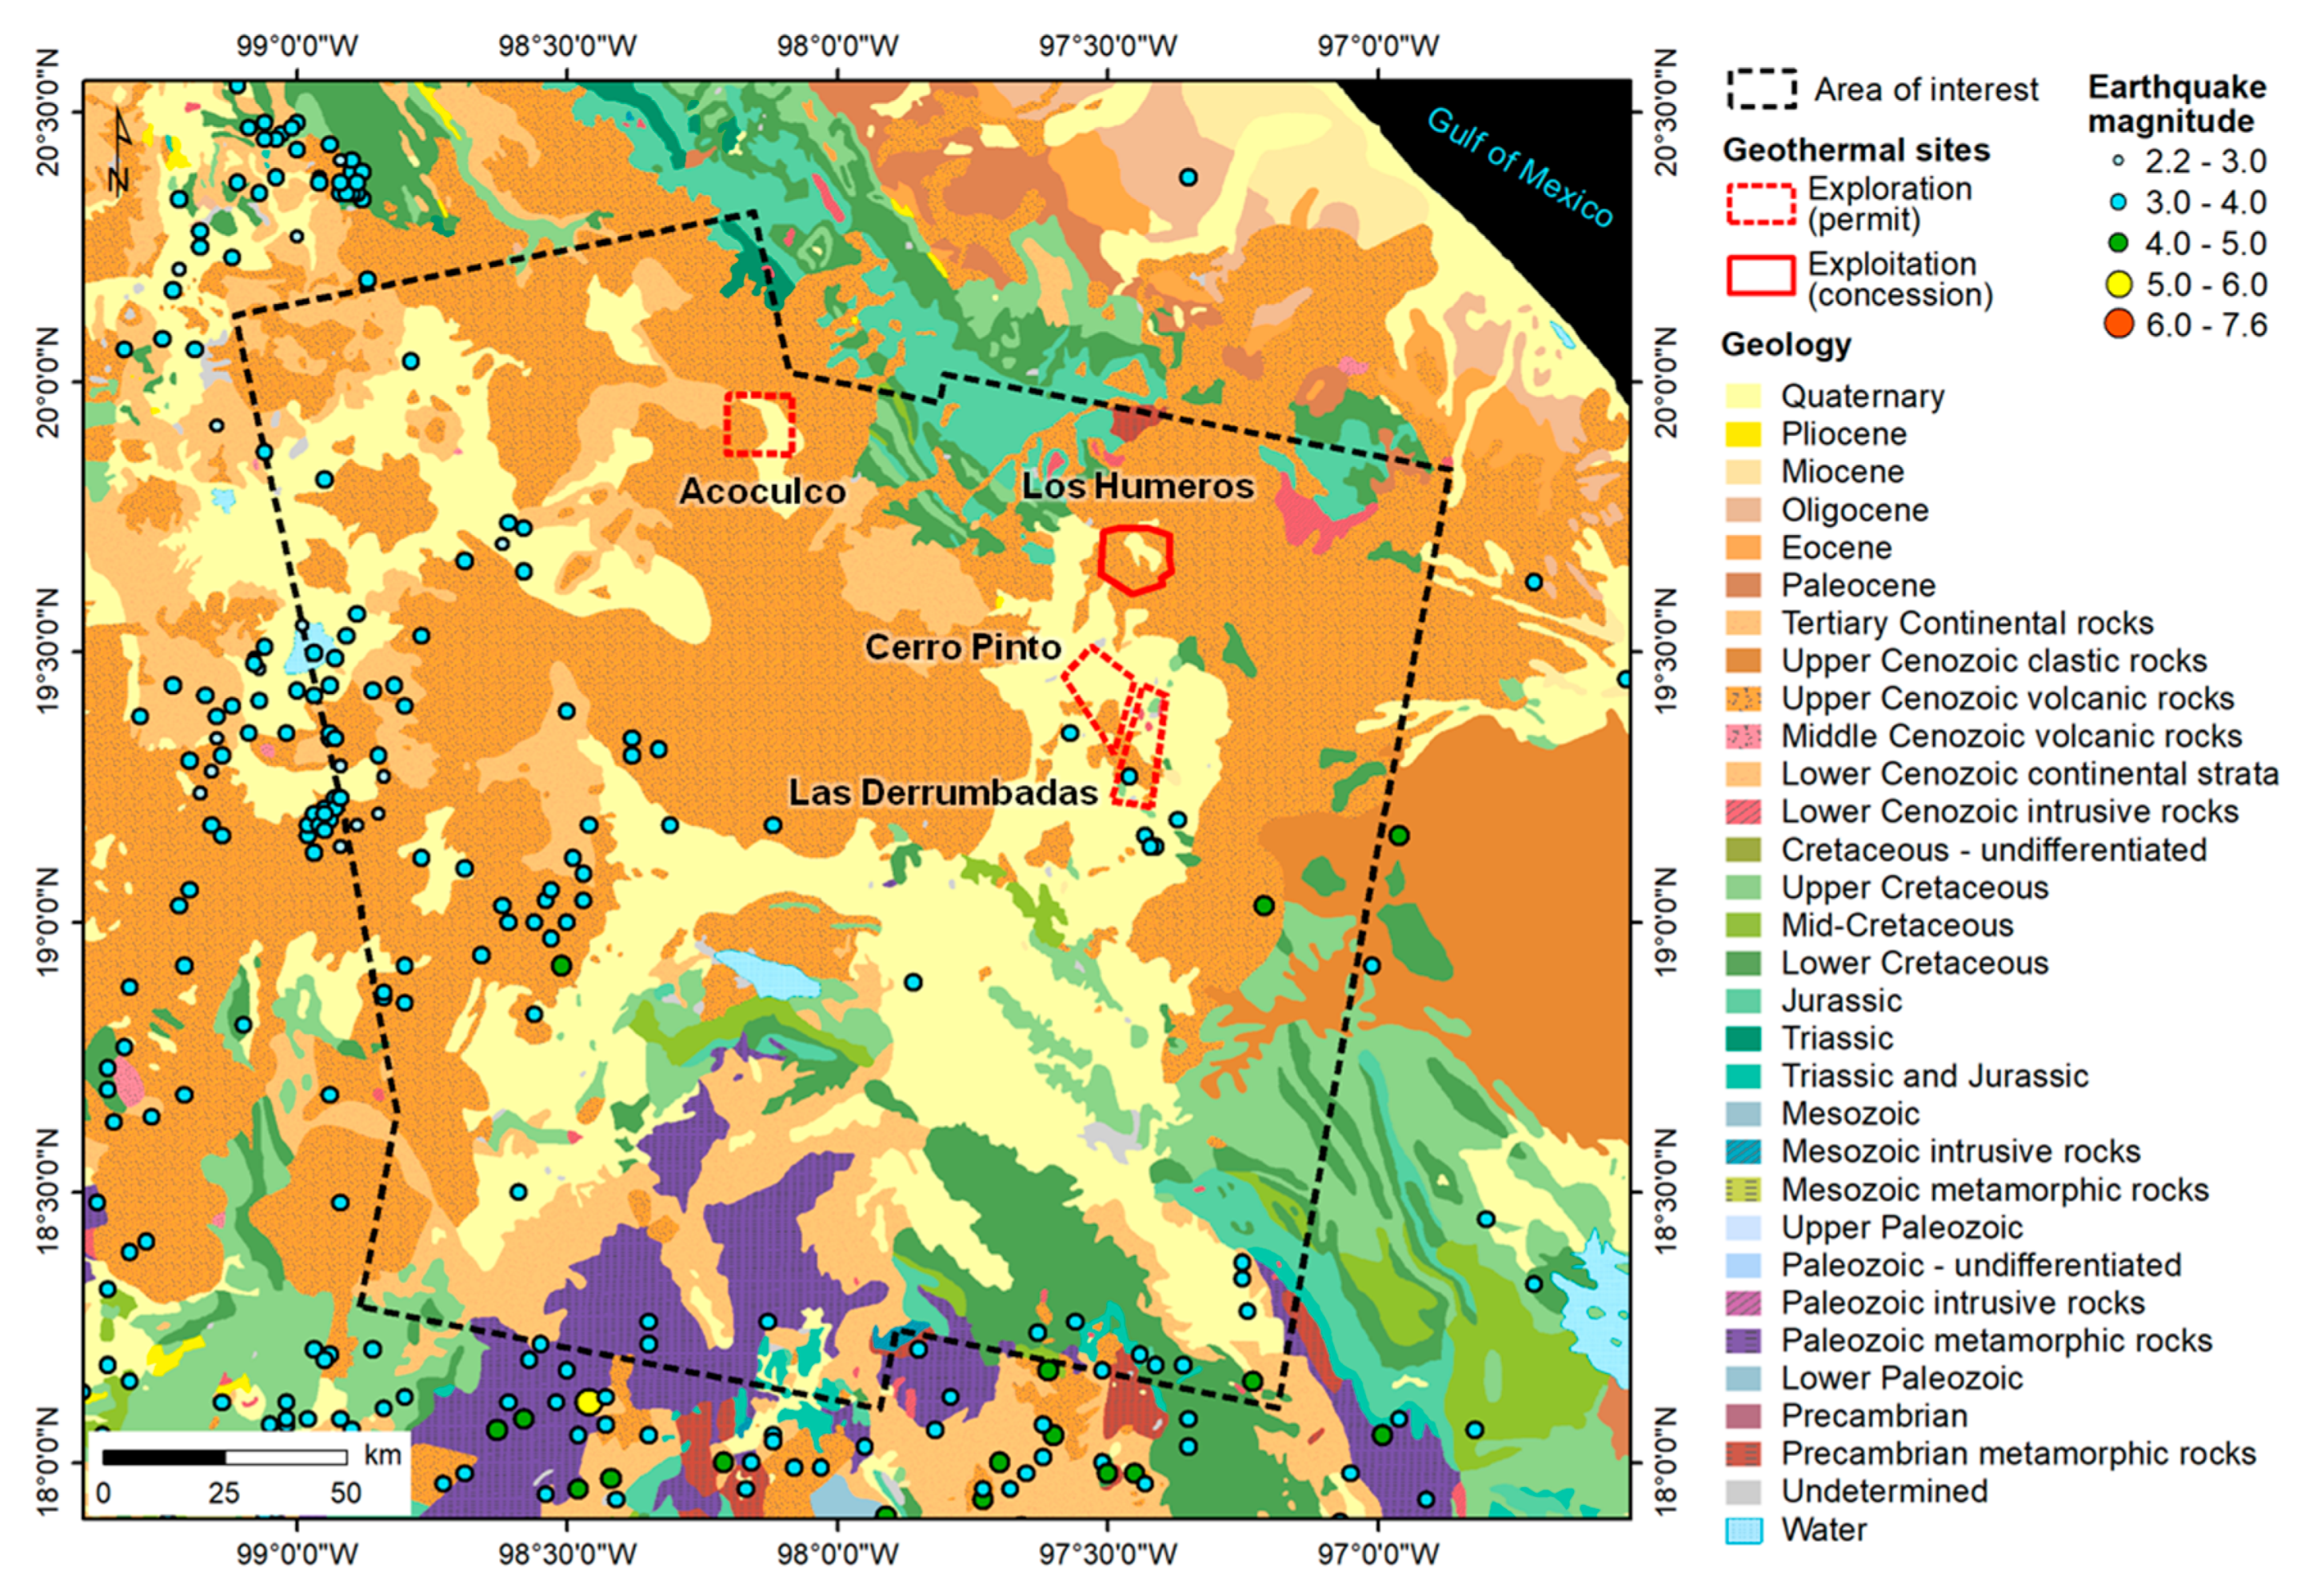
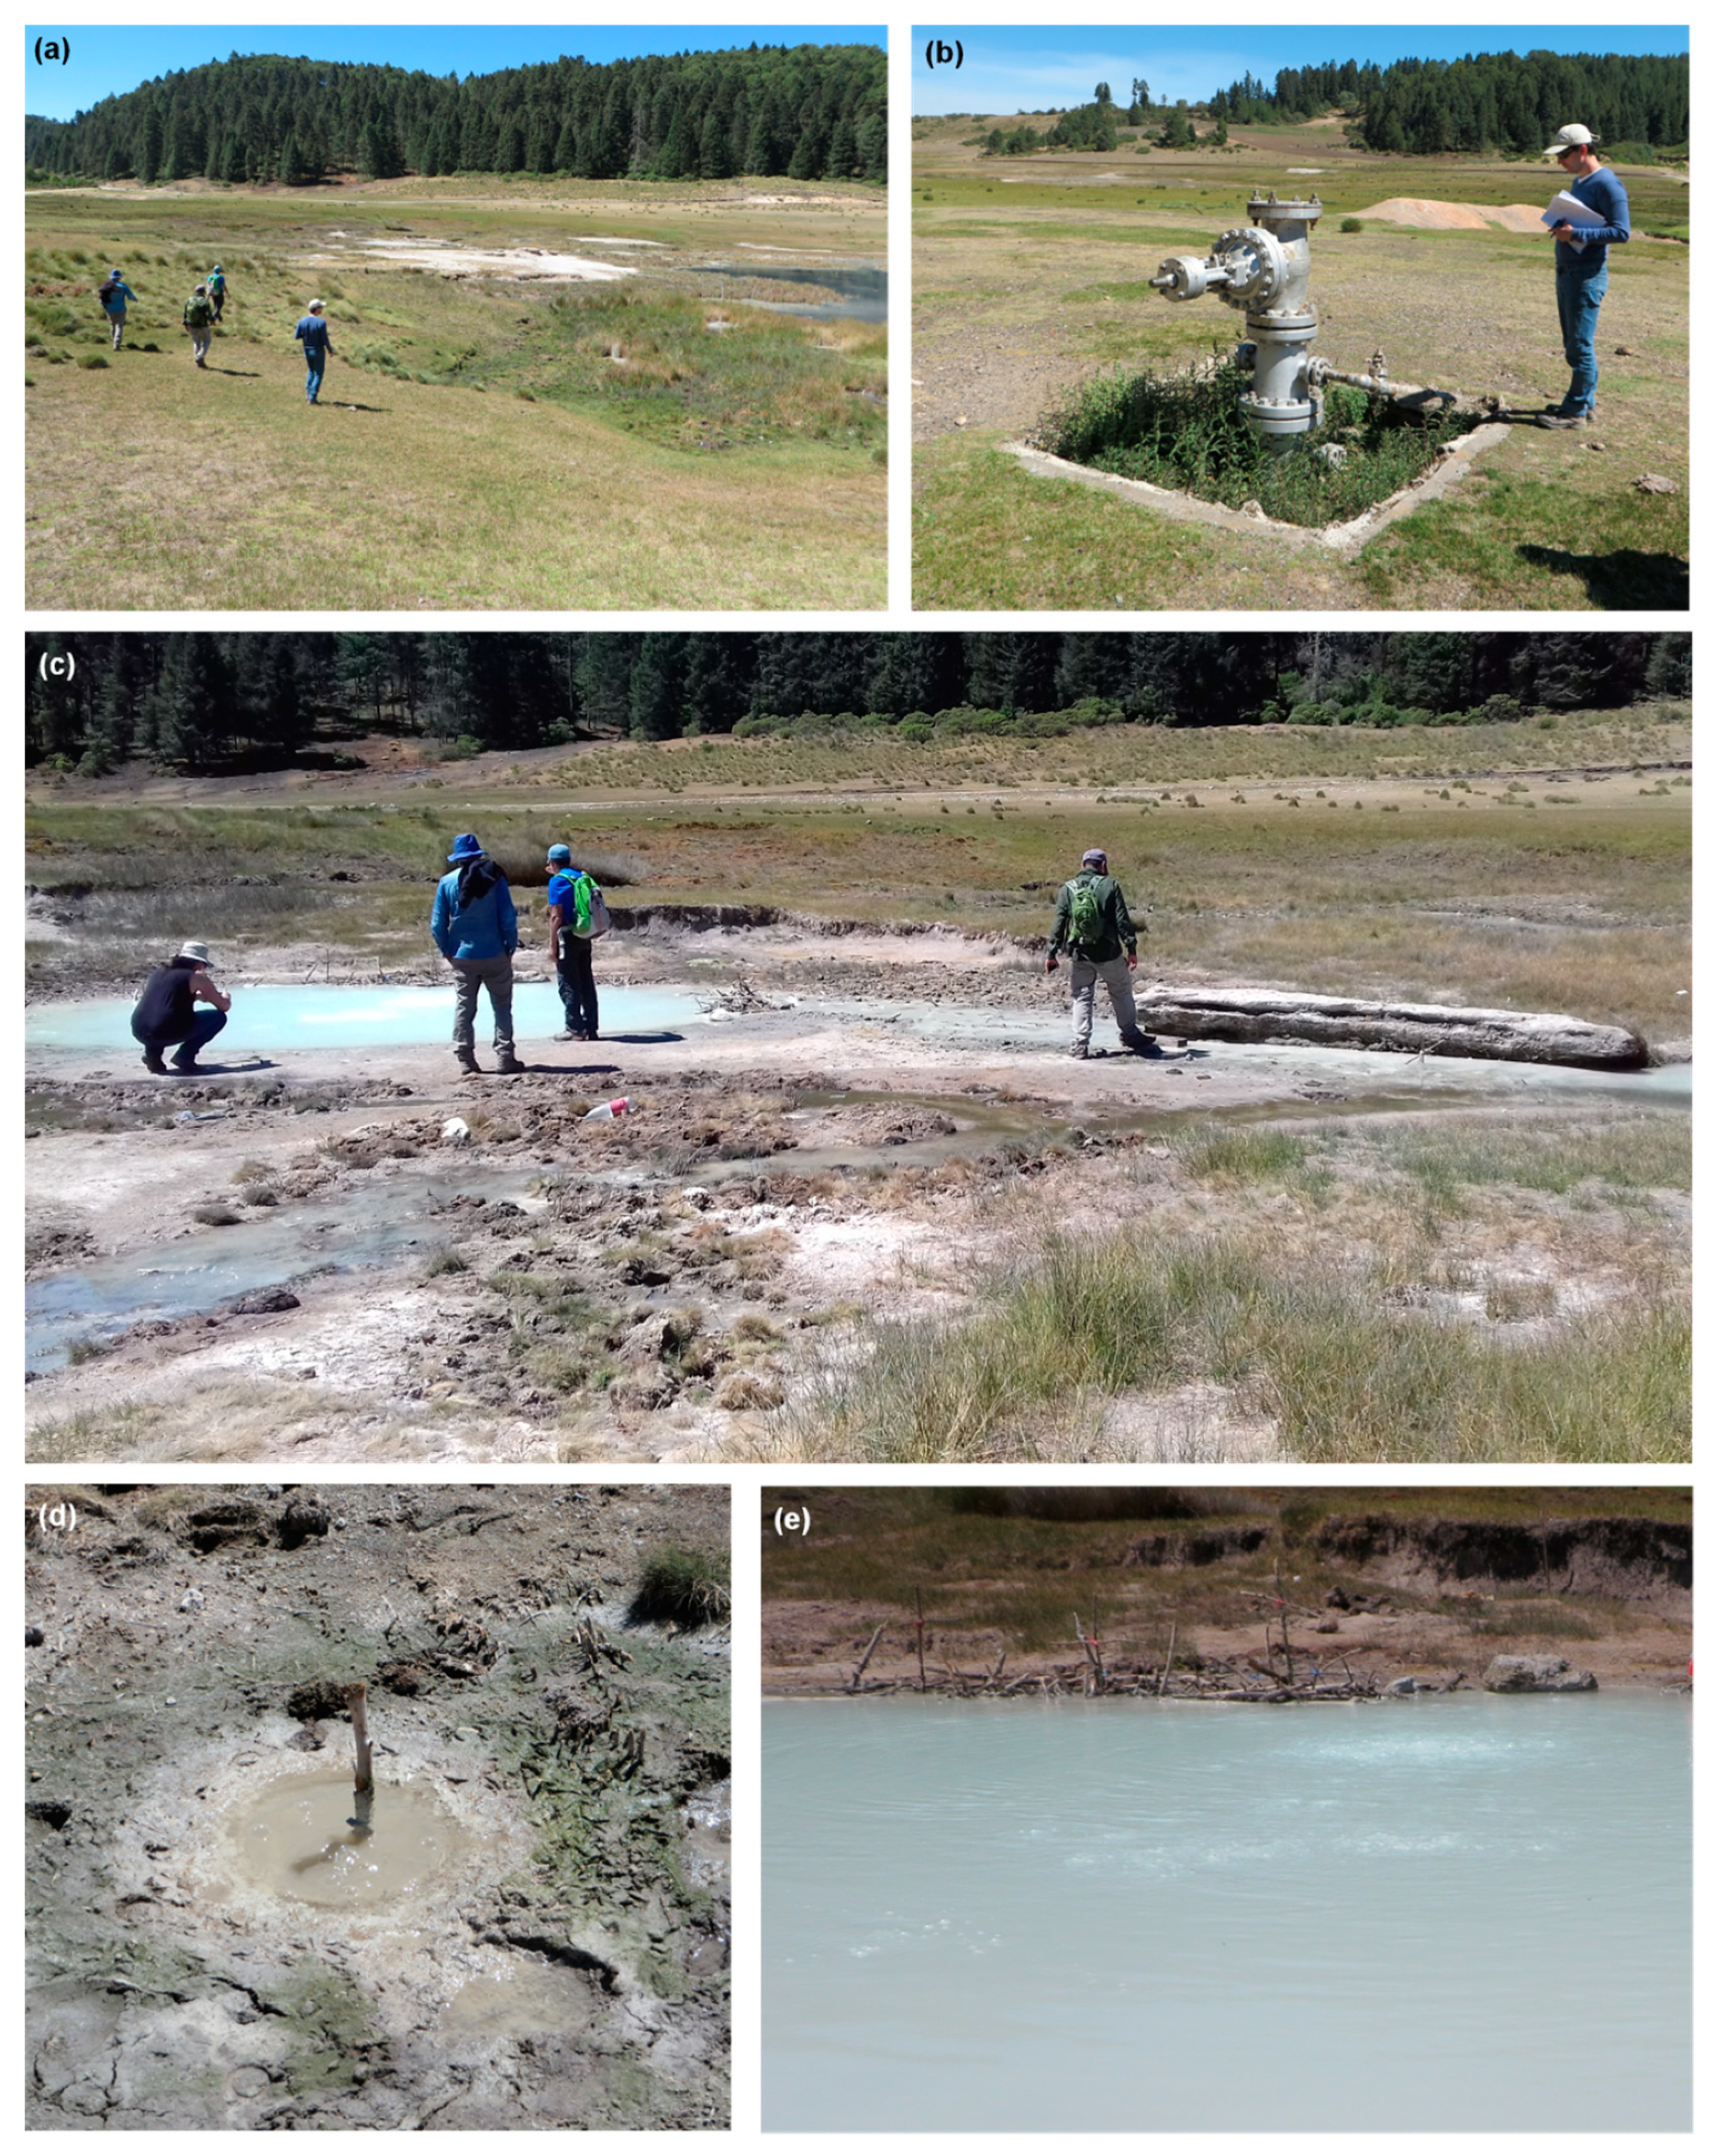
4.2.1. Acoculco
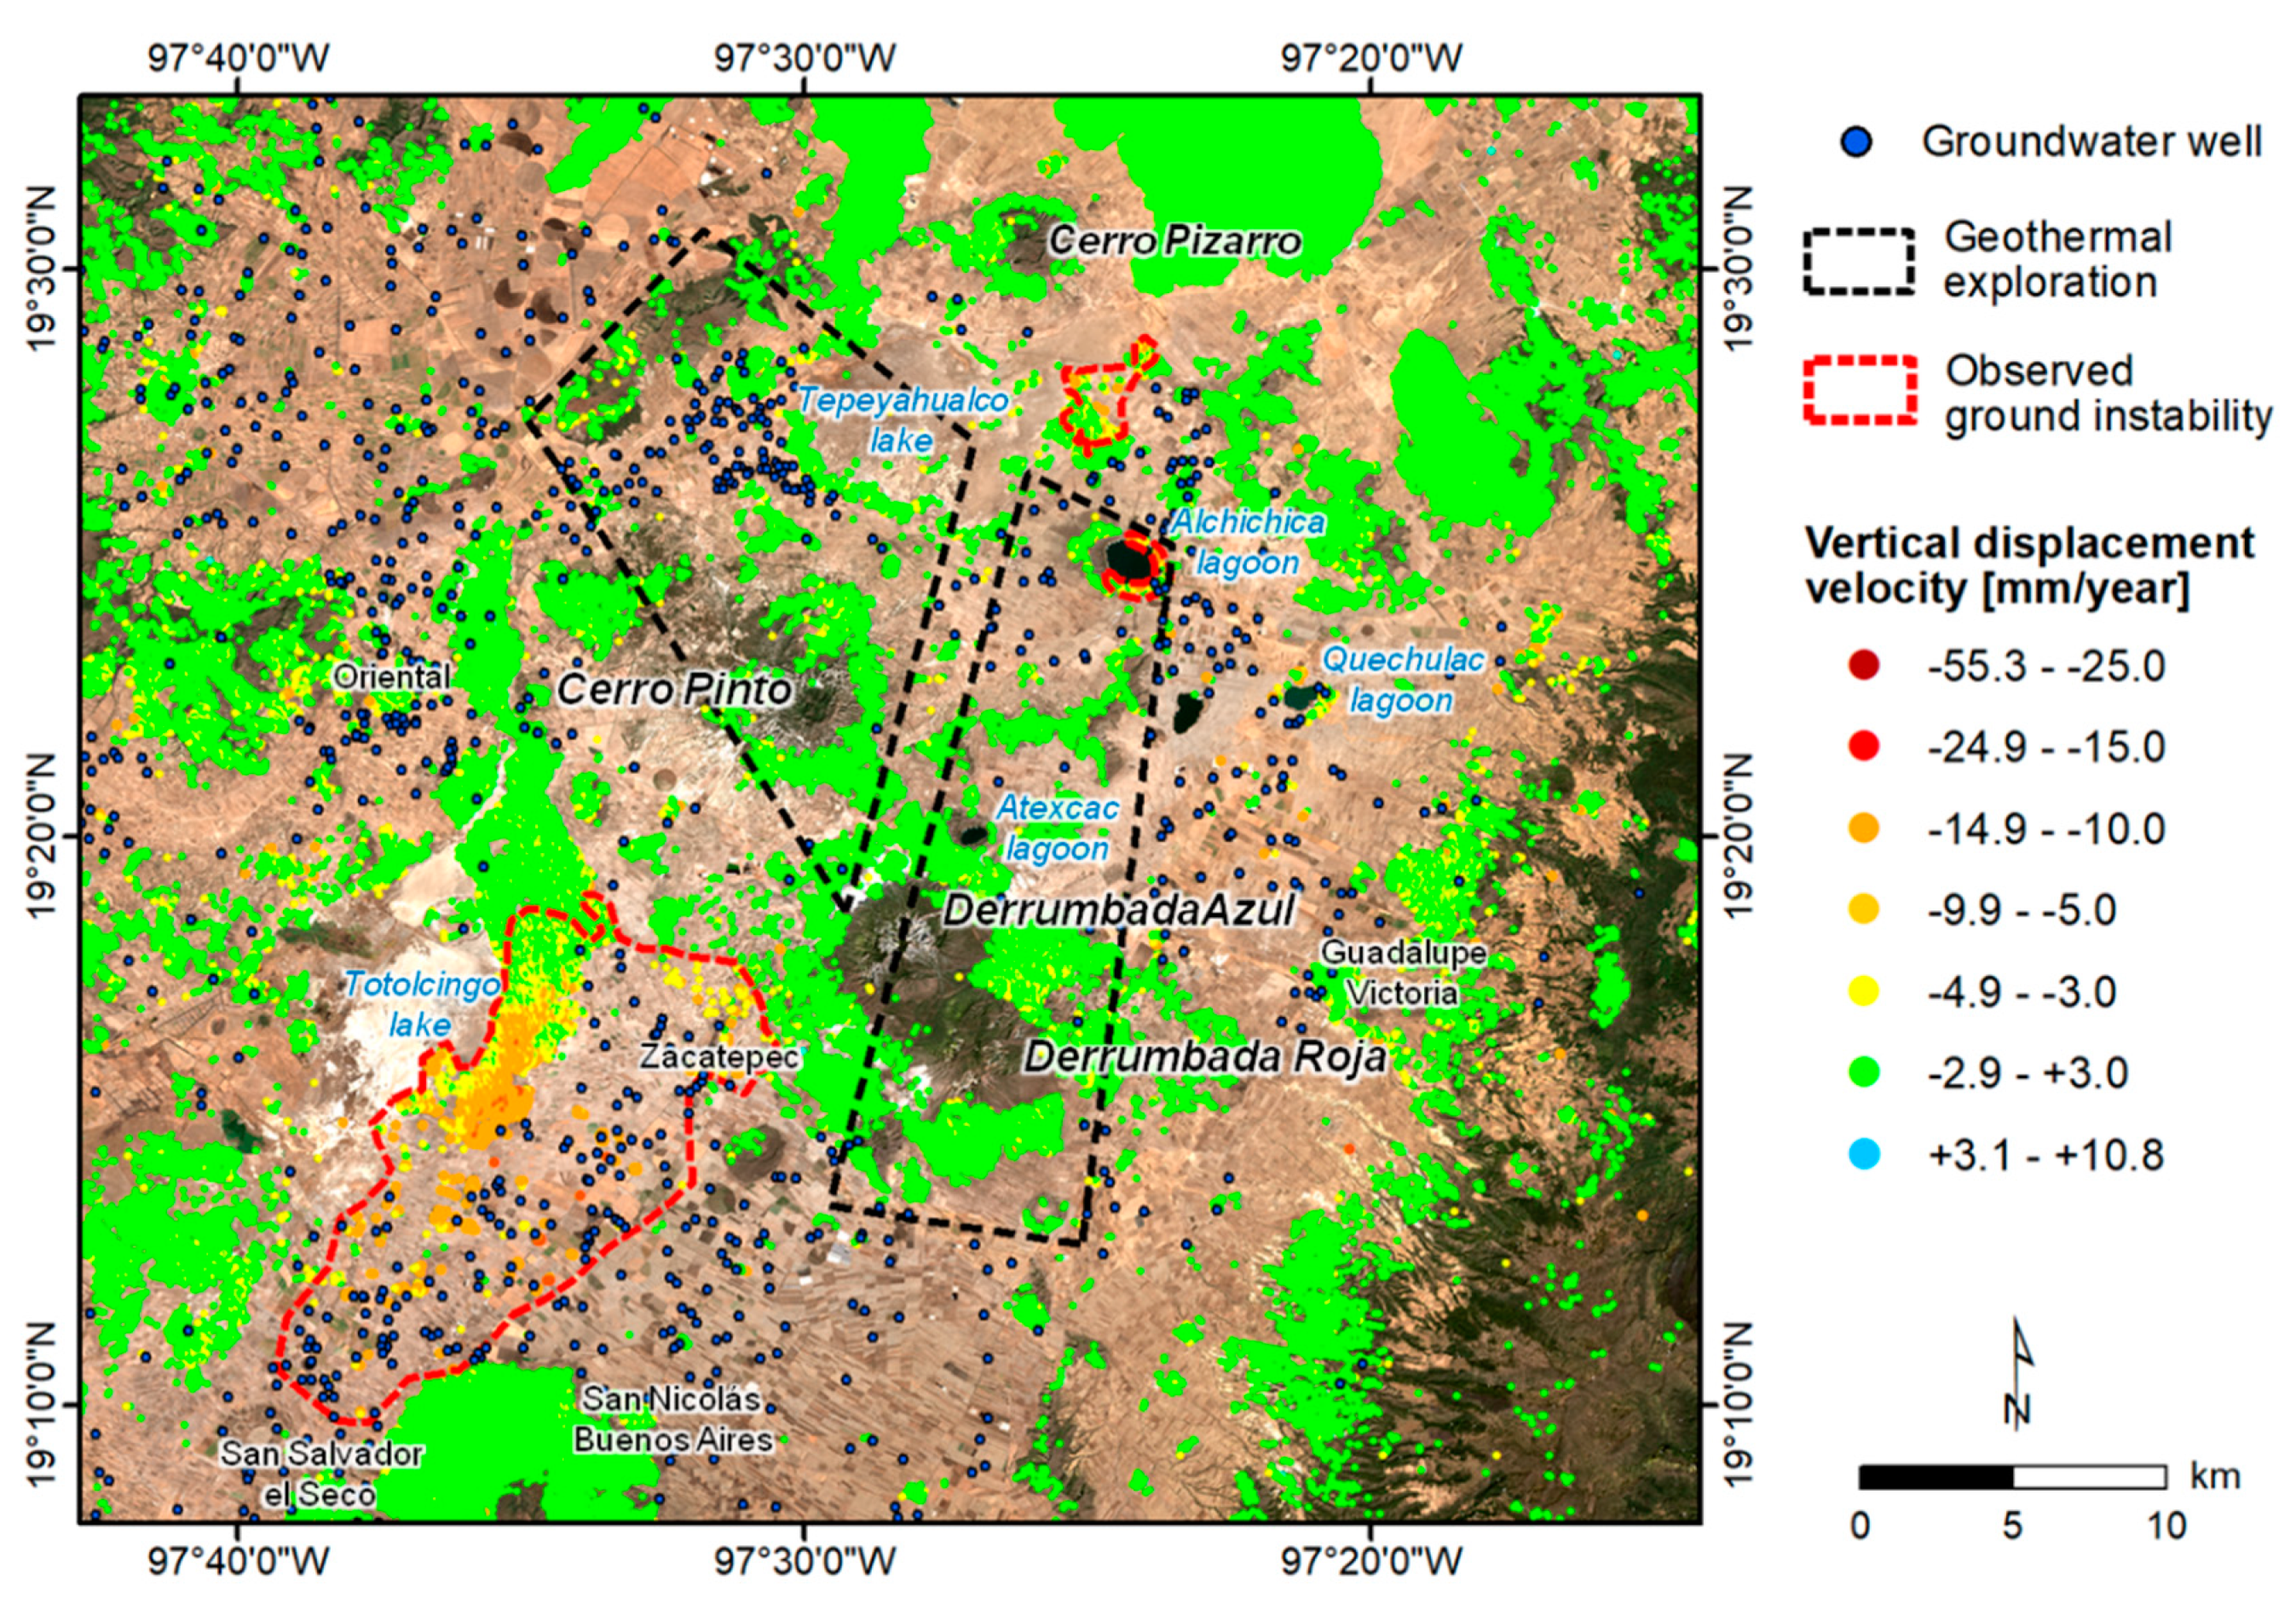
4.2.2. Las Derrumbadas and Cerro Pinto
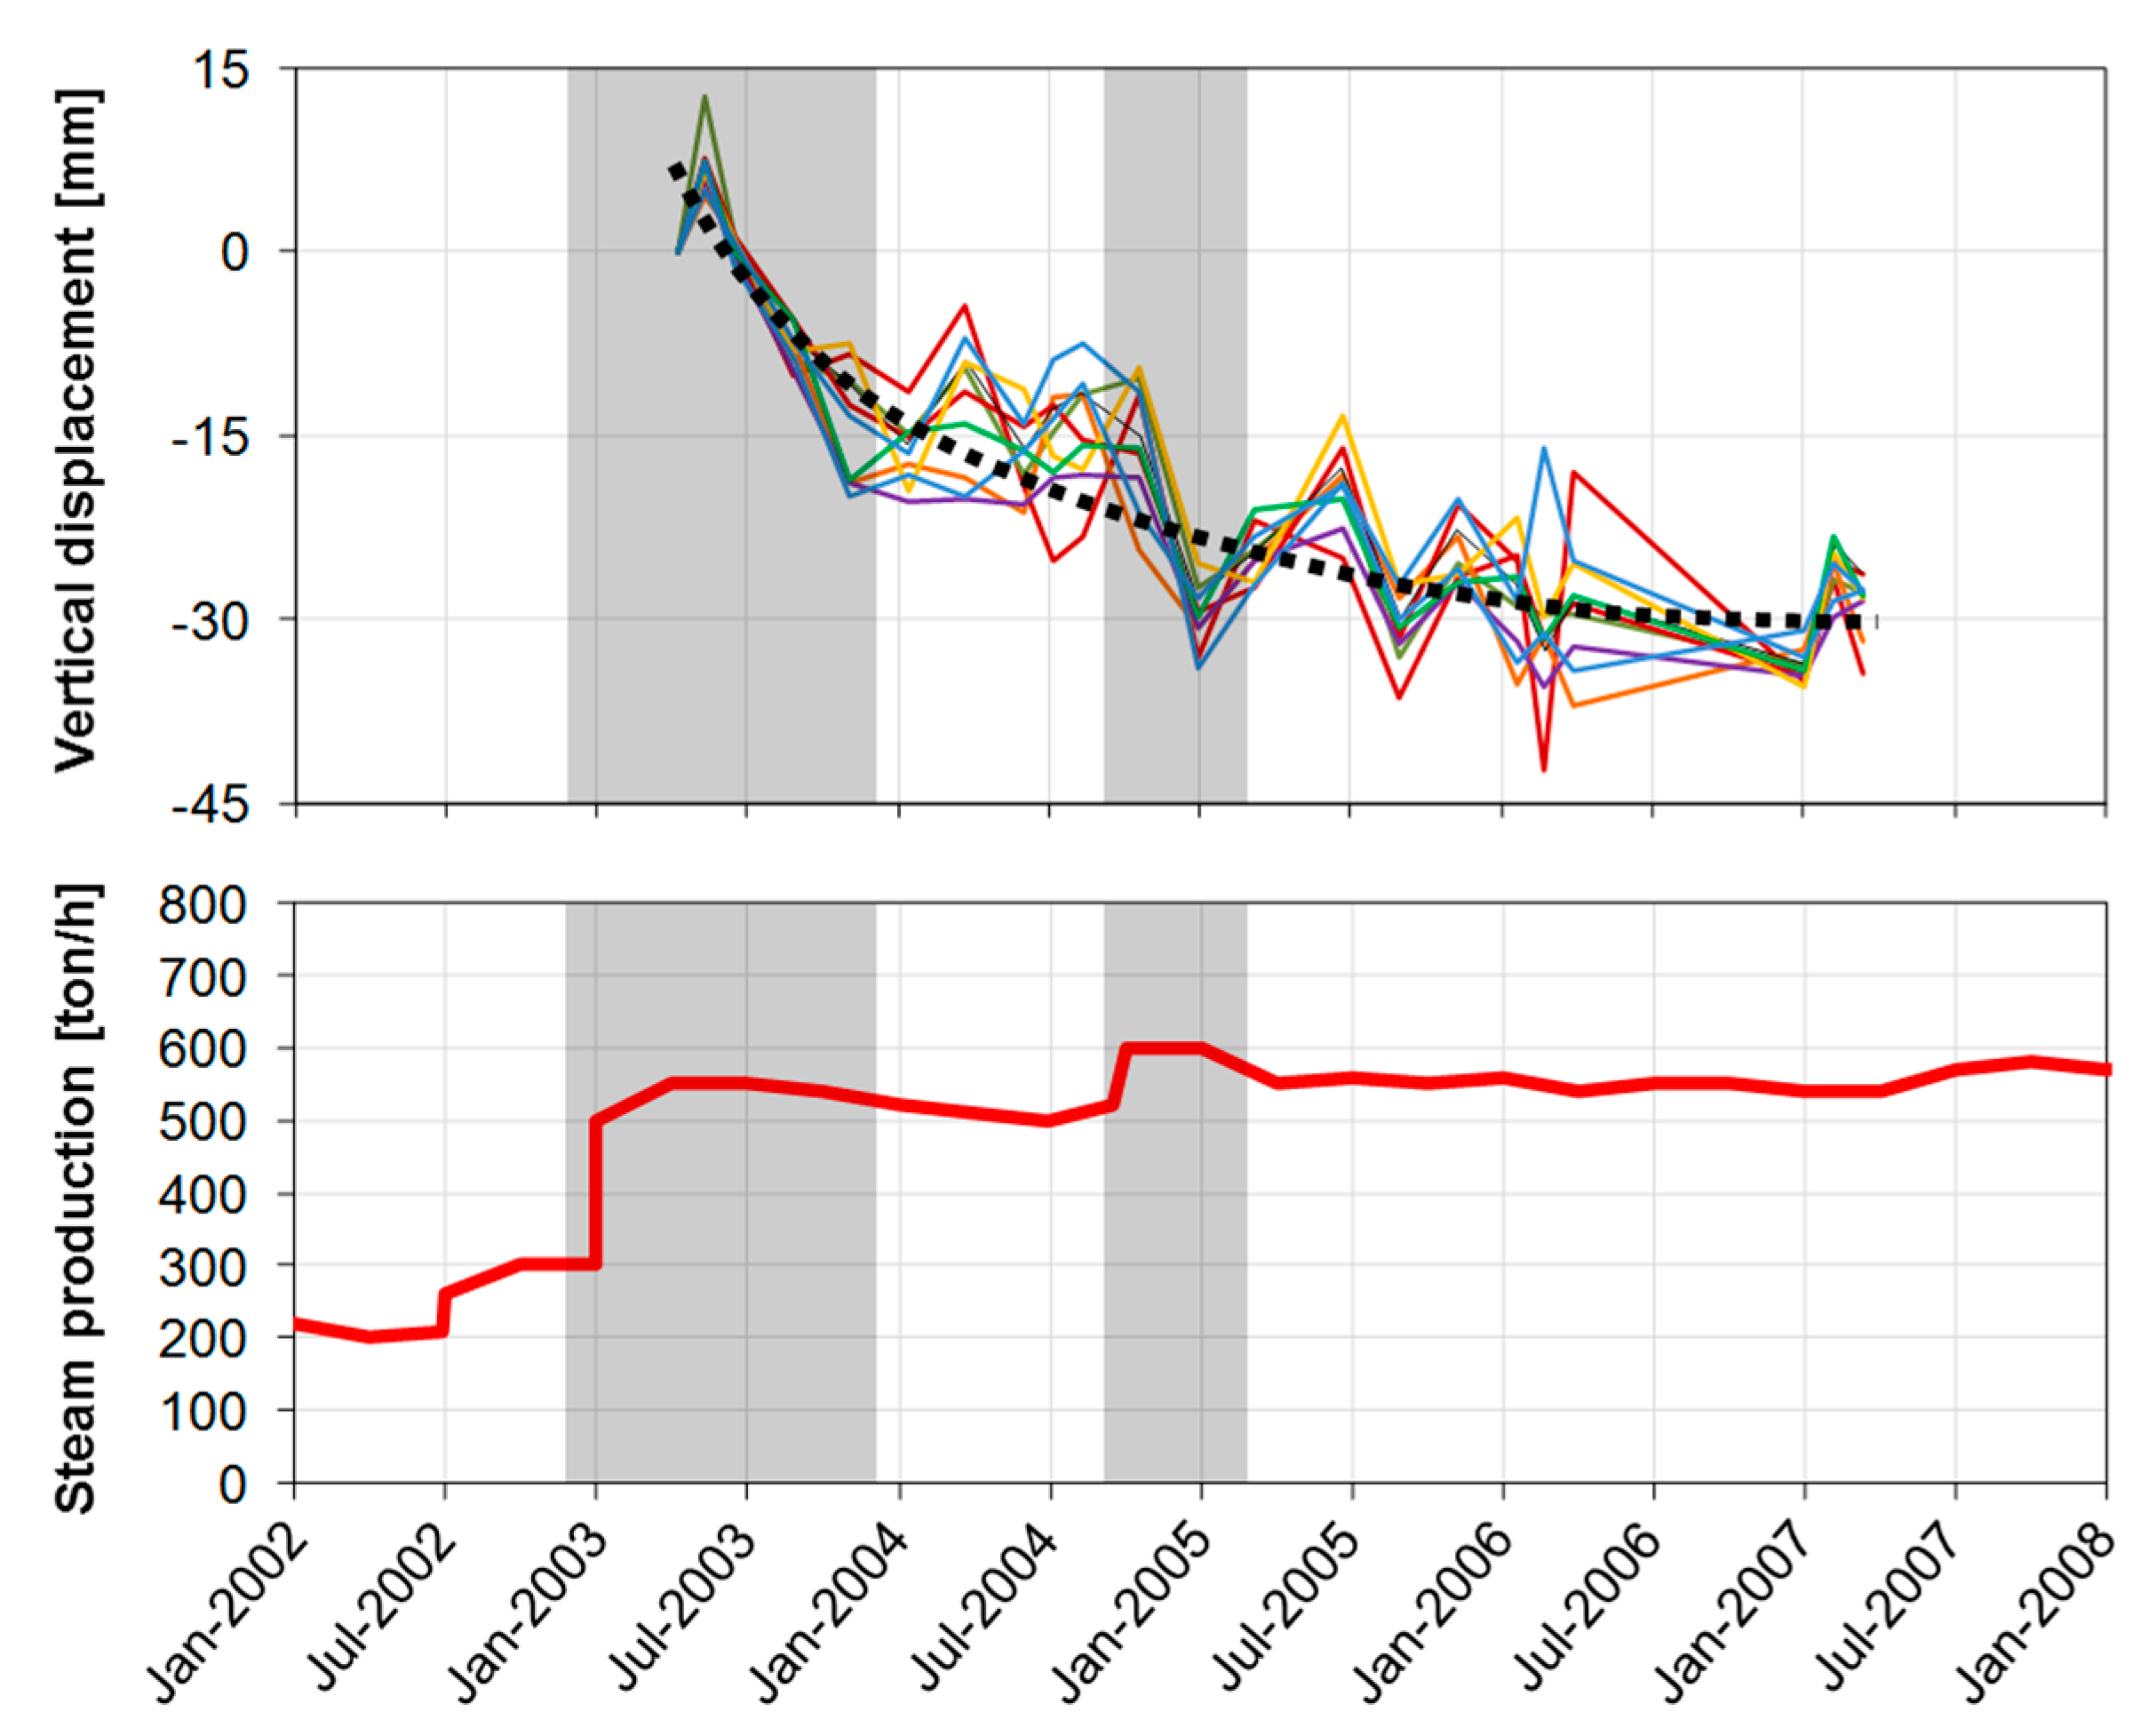
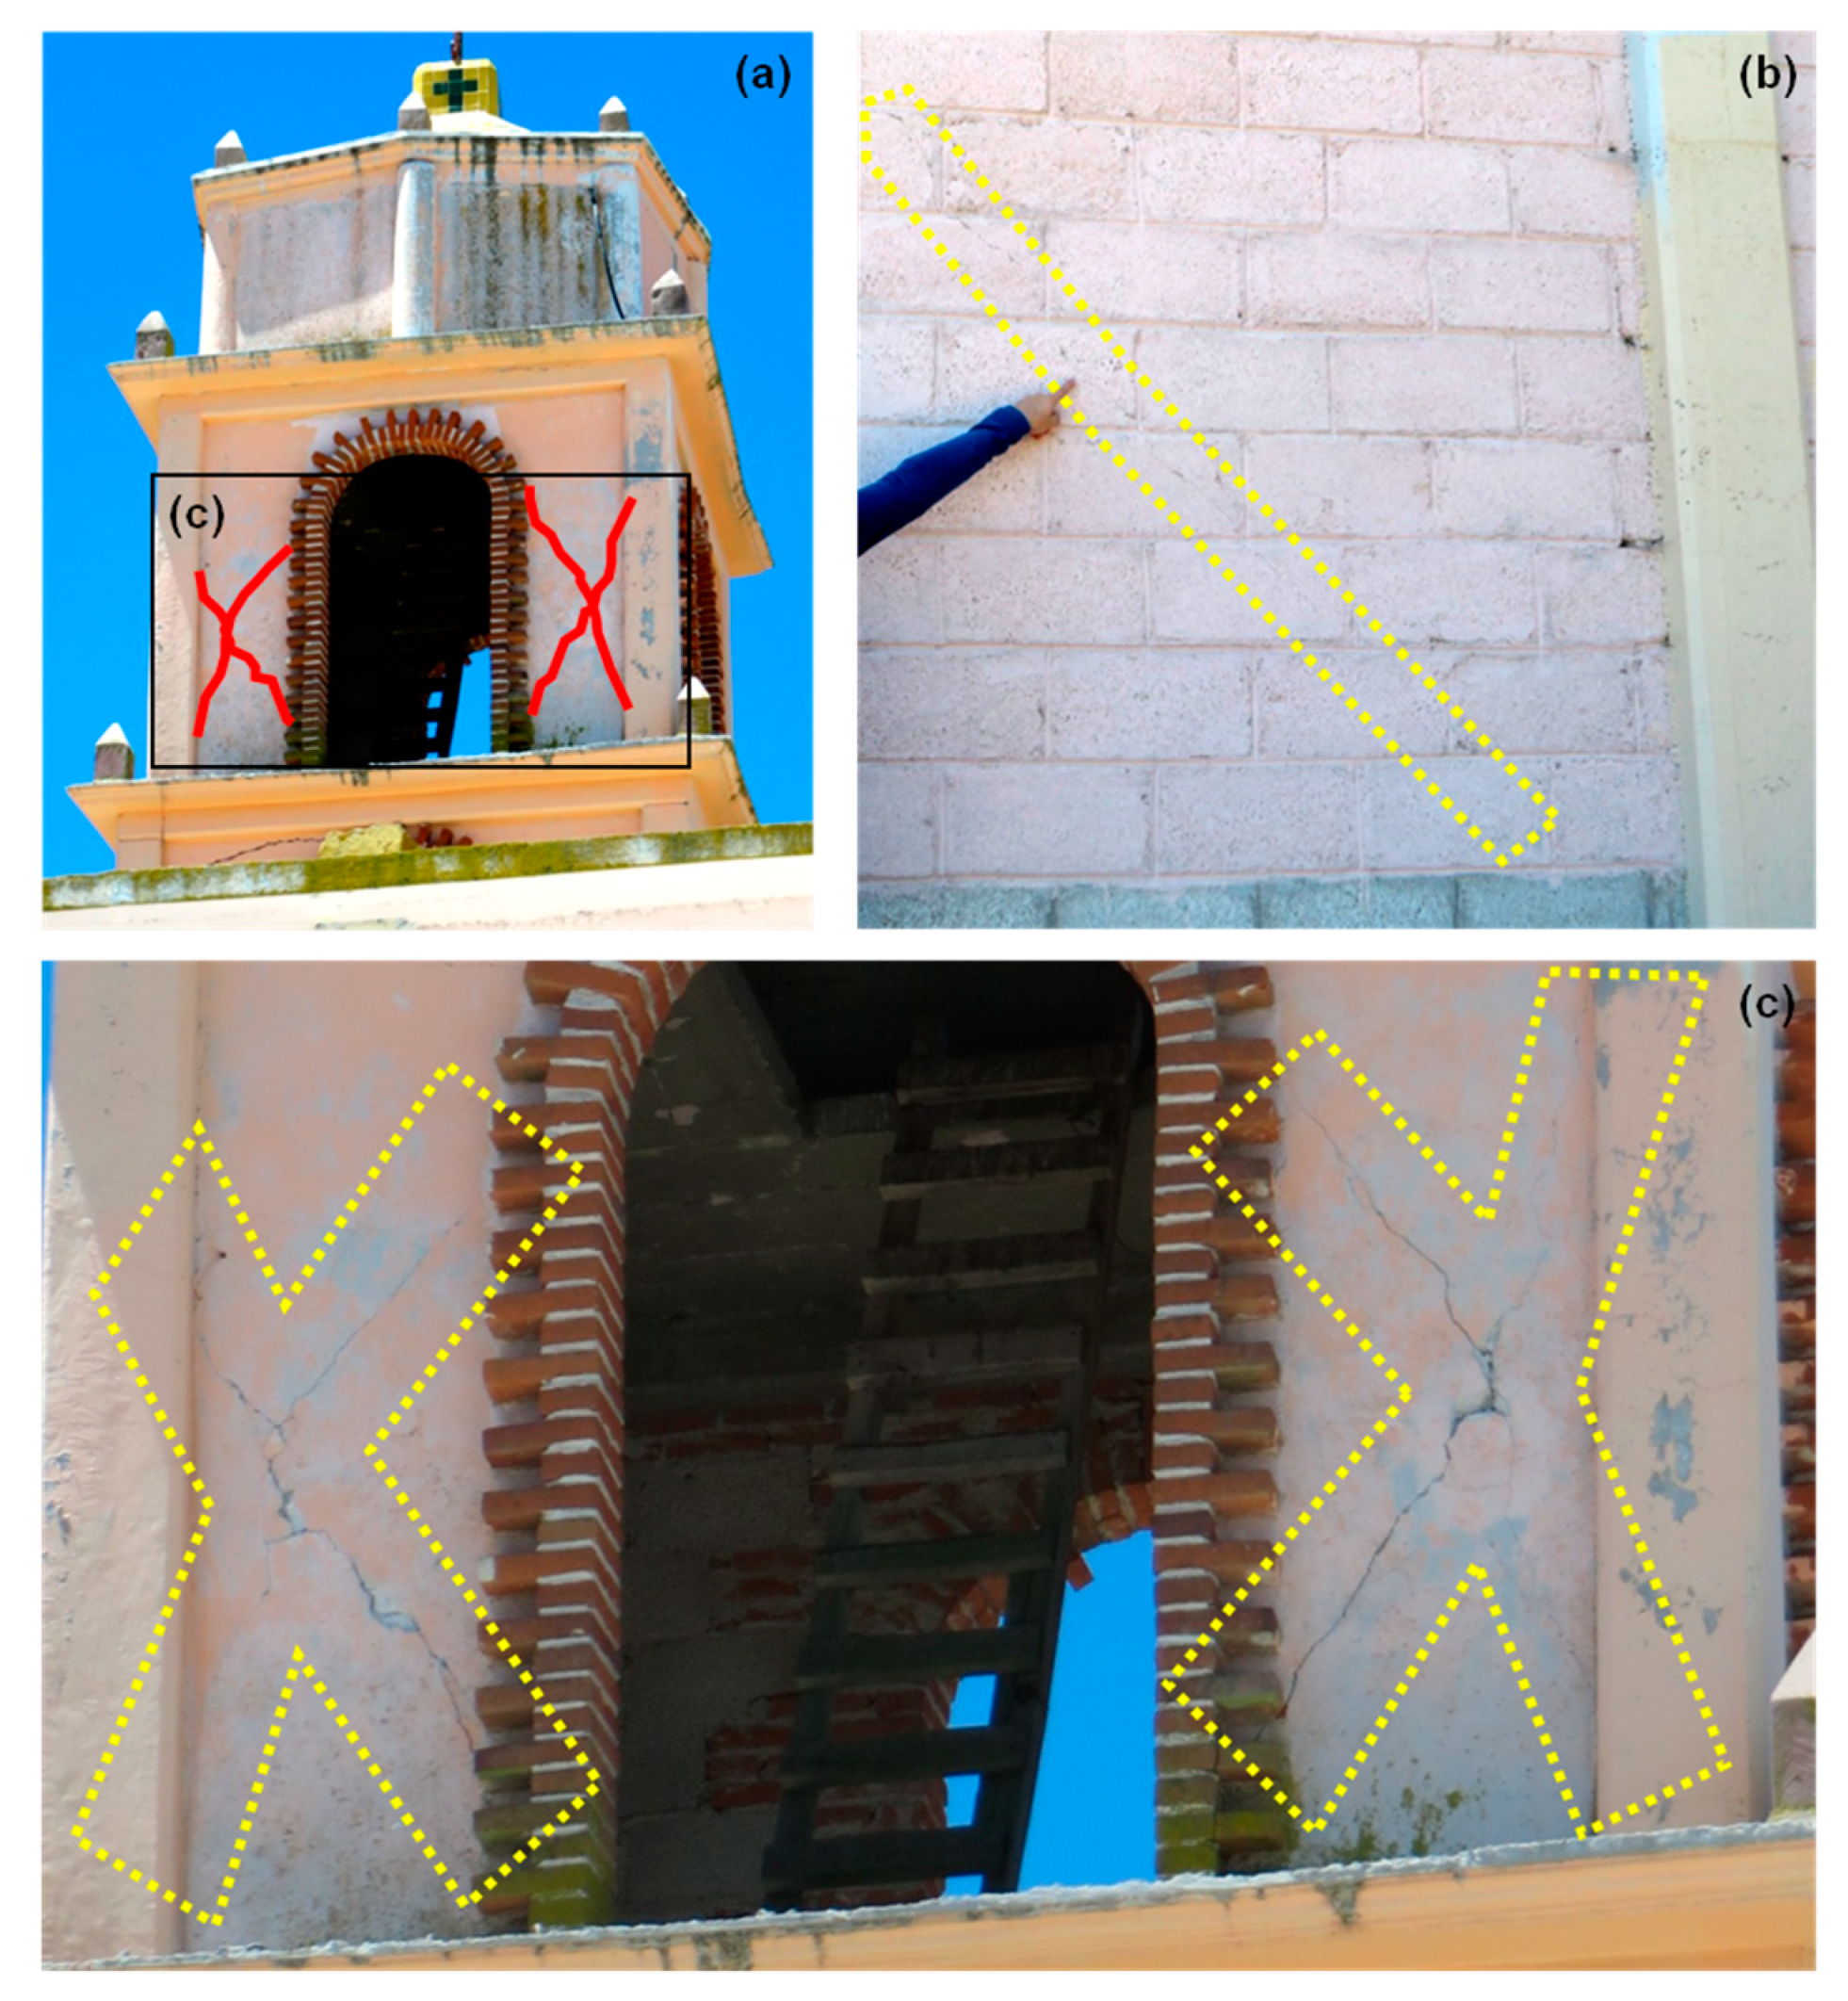
4.3. Surface Deformation and Geothermal Exploitation at Los Humeros
5. Conclusions
Author Contributions
Funding
Acknowledgments
Conflicts of Interest
References
- van der Meer, F.; Hecker, C.; van Ruitenbeek, F.; van der Werff, H.; de Wijkerslooth, C.; Wechsler, C. Geologic remote sensing for geothermal exploration: A review. Int. J. Appl. Earth Obs. Geoinf. 2014, 33, 255–269. [Google Scholar] [CrossRef]
- Gabriel, A.K.; Goldstein, R.M.; Zebker, H.A. Mapping small elevation changes over large areas: Differential radar interferometry. J. Geophys. Res. 1989, 94, 9183–9191. [Google Scholar] [CrossRef]
- Massonnet, D.; Feigl, K.L. Radar interferometry and its application to changes in the Earth’s surface. Rev. Geophys. 1998, 36, 441–500. [Google Scholar] [CrossRef]
- Ferretti, A.; Prati, C.; Rocca, F. Permanent scatterers in SAR interferometry. IEEE Trans. Geosci. Remote 2001, 39, 8–20. [Google Scholar] [CrossRef]
- Berardino, P.; Fornaro, G.; Lanari, R.; Sansosti, E. A new algorithm for surface deformation monitoring based on small baseline differential SAR interferograms. IEEE Trans. Geosci. Remote 2002, 40, 2375–2383. [Google Scholar] [CrossRef] [Green Version]
- WEC. World Energy Resources 2016. 2016. Available online: https://www.worldenergy.org/wp-content/uploads/2016/10/World-Energy-Resources-Full-report-2016.10.03.pdf (accessed on 23 June 2019).
- Gobierno de México, Secretaría de Energía SENER. Permisos y Concesiones Otorgadas por SENER para la Exploración y Explotación de Recursos Geotérmicos. 22 November 2018. Available online: https://www.gob.mx/sener/documentos/permisos-y-concesiones-otorgadas-por-sener-para-la-exploracion-y-explotacion-de-recursos-geotermicos (accessed on 23 June 2019).
- Cabral-Cano, E.; Dixon, T.H.; Miralles-Wilhelm, F.; Diaz-Molina, O.; Sanchez-Zamora, O.; Carande, R.E. Space geodetic imaging of rapid ground subsidence in Mexico City. Geol. Soc. Am. Bull. 2008, 120, 1556–1566. [Google Scholar] [CrossRef] [Green Version]
- Osmanoğlu, B.; Dixon, T.H.; Wdowinski, S.; Cabral-Cano, E.; Jiang, Y. Mexico City subsidence observed with persistent scatterer InSAR. Int. J. Appl. Earth Obs. Geoinf. 2011, 13, 1–12. [Google Scholar] [CrossRef]
- Pinel, V.; Hooper, A.; De la Cruz-Reyna, S.; Reyes-Davila, G.; Doin, M.P.; Bascou, P. The challenging retrieval of the displacement field from InSAR data for andesitic stratovolcanoes: Case study of Popocatepetl and Colima Volcano, Mexico. J. Volcanol. Geoth. Res. 2011, 200, 49–61. [Google Scholar] [CrossRef]
- Cigna, F.; Osmanoğlu, B.; Cabral-Cano, E.; Dixon, T.H.; Ávila-Olivera, J.A.; Garduño-Monroy, V.H.; DeMets, C.; Wdowinski, S. Monitoring land subsidence and its induced geological hazard with Synthetic Aperture Radar Interferometry: A case study in Morelia, Mexico. Remote Sens. Environ. 2012, 117, 146–161. [Google Scholar] [CrossRef]
- Chaussard, E.; Wdowinski, S.; Cabral-Cano, E.; Amelung, F. Land subsidence in central Mexico detected by ALOS InSAR time-series. Remote Sens. Environ. 2014, 140, 94–106. [Google Scholar] [CrossRef]
- Brunori, C.A.; Bignami, C.; Albano, M.; Zucca, F.; Samsonov, S.; Groppelli, G.; Norini, G.; Saroli, M.; Stramondo, S. Land subsidence, Ground Fissures and Buried Faults: InSAR Monitoring of Ciudad Guzmán (Jalisco, Mexico). Remote Sens. 2015, 7, 8610–8630. [Google Scholar] [CrossRef]
- Albano, M.; Polcari, M.; Bignami, C.; Moro, M.; Saroli, M.; Stramondo, S. An innovative procedure for monitoring the change in soil seismic response by InSAR data: Application to the Mexico City subsidence. Int. J. Appl. Earth Obs. Geoinf. 2016, 53, 146–158. [Google Scholar] [CrossRef]
- Castellazzi, P.; Arroyo-Domínguez, N.; Martel, R.; Calderhead, A.I.; Normand, J.C.L.; Gárfias, J.; Rivera, A. Land subsidence in major cities of Central Mexico: Interpreting InSAR-derived land subsidence mapping with hydrogeological data. Int. J. Appl. Earth Obs. Geoinf. 2016, 47, 102–111. [Google Scholar] [CrossRef]
- Sowter, A.; Che Amat, M.; Cigna, F.; Marsh, S.; Athab, A.; Alshammari, L. Mexico City land subsidence in 2014–2015 with Sentinel-1 IW TOPS: First results using the Intermittent SBAS (ISBAS) technique. Int. J. Appl. Earth Obs. Geoinf. 2016, 52, 230–242. [Google Scholar] [CrossRef]
- Carnec, C.; Fabriol, H. Monitoring and modeling land subsidence at the Cerro Prieto geothermal field, Baja California, Mexico, using SAR interferometry. Geophys. Res. Lett. 1999, 26, 1211–1214. [Google Scholar] [CrossRef]
- Sarychikhina, O.; Glowacka, E.; Mellors, R.; Suárez Vidal, F. Land subsidence in the Cerro Prieto Geothermal Field, Baja California, Mexico, from 1994 to 2005: An integrated analysis of DInSAR, leveling and geological data. J. Volcanol. Geoth. Res. 2011, 204, 76–90. [Google Scholar] [CrossRef]
- Samsonov, S.V.; Feng, W.; Fialko, Y. Subsidence at Cerro Prieto Geothermal Field and postseismic slip along the Indiviso fault from 2011 to 2016 RADARSAT-2 DInSAR time series analysis. Geophys. Res. Lett. 2017, 44, 2716–2724. [Google Scholar] [CrossRef]
- Xu, X.; Sandwell, D.T.; Tymofyeyeva, E.; González-Ortega, A.; Tong, X. Tectonic and Anthropogenic Deformation at the Cerro Prieto Geothermal Step-Over Revealed by Sentinel-1A InSAR. IEEE Trans. Geosci. Remote 2017, 55, 5284–5292. [Google Scholar] [CrossRef]
- Santos-Basurto, R. Interferometría de Radar de Apertura Sintética (InSAR) Aplicada a una Caldera Volcánica: Los Humeros Puebla-México. Ph.D. Thesis, Universidad Nacional Autónoma de México, México City, México, 2015. [Google Scholar]
- Carrasco-Núñez, G.; Arzate, J.; Pablo Bernal, J.; Carrera, J.; Cedillo, F.; Dávila-Harris, P.; Hernández, J.; Hurwitz, S.; Lermo, J.; Levresse, G.; et al. A New Geothermal Exploration Program at Los Humeros Volcanic and Geothermal Field (Eastern Mexican Volcanic Belt). In Proceedings of the World Geothermal Congress 2015, Melbourne, Australia, 19–25 April 2015. [Google Scholar]
- Békési, E.; Fokker, P.A.; Martins, J.E.; Limberger, J.; Bonté, D.; van Wees, J.-D. Production-Induced Subsidence at the Los Humeros Geothermal Field Inferred from PS-InSAR. Geofluids 2019. [Google Scholar] [CrossRef]
- Békési, E.; Martins, J.; Fokker, P.; Bonté, D.; Limberger, J.; van Wees, J.-D. Active deformation of the eastern Trans-Mexican Volcanic Belt based on InSAR persistent scatterers. EGU Gen. Assem. Con. Abstr. 2018, 20, 15520. [Google Scholar]
- Santos-Basurto, R.; Sarychikhina, O.; Lopez-Quiroz, P.; Norini, G.; Carrasco-Nuñez, G. The Mw 4.2 (February 8th, 2016) earthquake detected inside of Los Humeros caldera, Puebla-Mexico, by means of DInSAR. In Proceedings of the EGU General Assembly 2018, Vienna, Austria, 4–13 April 2018. [Google Scholar]
- Békési, E.; Fokker, P.A.; Martins, J.E.; van Wees, J.-D. Inversion of coseismic deformation due to the 8th February 2016, Mw 4.2 earthquake at Los Humeros (Mexico) inferred from DInSAR. In Proceedings of the European Geothermal Congress 2019, Den Haag, The Netherlands, 11–14 June 2019. [Google Scholar]
- Secretaría de Energía SENER. Titulo de Permiso de Exploración de Recursos Geotérmicos en el Área Geotérmica Denominada Acoculco, Puebla. 2015; 15p. Available online: https://www.gob.mx/cms/uploads/attachment/file/309675/VP_-_P_Acoculco__PUE.pdf (accessed on 23 June 2019).
- Secretaría de Energía SENER. Titulo de Permiso de Exploración de Recursos Geotérmicos en el Área Geotérmica Denominada Las Derrumbadas, Puebla. 2016; 19p. Available online: https://www.gob.mx/cms/uploads/attachment/file/227831/P_LAS_DERRUMBADAS.pdf (accessed on 23 June 2019).
- Secretaría de Energía SENER. Titulo de Permiso de Exploración de Recursos Geotérmicos en el Área Geotérmica Denominada Cerro Pinto, Puebla. 2016; 18p. Available online: https://www.gob.mx/cms/uploads/attachment/file/227846/P_CERRO_PINTO.pdf (accessed on 23 June 2019).
- Farr, T.G.; Caro, E.; Crippen, R.; Duren, R.; Hensley, S.; Kobrick, M.; Paller, M.; Rodriguez, E.; Rosen, P.; Roth, L.; et al. The Shuttle Radar Topography Mission. Rev. Geophys. 2007, 45, RG2004. [Google Scholar] [CrossRef]
- USGS, Central Energy Resource Team. Map Service Showing Geology, Oil and Gas Fields, and Geologic Provinces of the Gulf of Mexico Region. 1 January 2002. Available online: https://catalog.data.gov/dataset/map-service-showing-geology-oil-and-gas-fields-and-geologic-provinces-of-the-gulf-of-mexico-reg (accessed on 23 June 2019).
- SSN, Instituto de Geofísica de la Universidad Nacional Autónoma de México. Available online: http://www.ssn.unam.mx/ (accessed on 23 June 2019).
- Secretaría de Energía SENER. Título de Concesión Para la Exploración de Recursos Geotérmicos. Área Geotérmica de Los Humeros, Pue. 2014; p. 22. Available online: https://www.gob.mx/cms/uploads/attachment/file/227856/C_LOS_HUMEROS.pdf (accessed on 23 June 2019).
- González-Salazar, A. Informe geologico de Los Humeros, Puebla; Instituto de Investigaciones de la Industria Electrica-CFE: México City, Mexico, 1968. [Google Scholar]
- Campos-Enriquez, J.O.; Garduño-Monroy, V.H. The shallow structure of Los Humeros and Las Derrumbadas geothermal fields, Mexico. Geothermics 1987, 16, 539–554. [Google Scholar] [CrossRef]
- Garduño-Monroy, V.H.; Romero Ríos, F.; Torres Hernández, R. Análisis estructural del campo geotérmico de Los Humeros, Pue. CFE Internal Report. 1985; 26–85, Unpublished. [Google Scholar]
- Ferriz, H.; Mahood, G. Eruptive rates and compositional trends at Los Humeros volcanic center, Puebla, Mexico. J. Geophys. Res. 1984, 89, 8511–8524. [Google Scholar] [CrossRef]
- Carrasco-Núñez, G.; López-Martínez, M.; Hernández, J.; Vargas, V. Subsurface stratigraphy and its correlation with the surficial geology at Los Humeros geothermal field, eastern Trans-Mexican Volcanic Belt. Geothermics 2017, 67, 1–17. [Google Scholar] [CrossRef]
- Norini, G.; Carrasco-Núñez, G.; Corbo-Camargo, F.; Lermo, J.; Hernández Rojas, J.; Castro, C.; Bonini, M.; Montanari, D.; Corti, G.; Moratti, G.; et al. The structural architecture of the Los Humeros volcanic complex and geothermal field. J. Volcanol. Geoth. Res. 2019, 381, 312–329. [Google Scholar] [CrossRef] [Green Version]
- Norini, G.; Groppelli, G.; Sulpizio, R.; Carrasco-Núñez, G.; Dávila-Harris, P.; Pellicioli, C.; Zucca, F.; De Franco, R. Structural analysis and thermal remote sensing of the Los Humeros Volcanic Complex: Implications for volcano structure and geothermal exploration. J. Volcanol. Geoth. Res. 2015, 301, 221–237. [Google Scholar] [CrossRef]
- Carrasco-Nuñez, G.; Hernández, J.; De León, L.; Dávila, P.; Norini, G.; Bernal, J.P.; Jicha, B.; Navarro, M.; López-Quiroz, P. Geologic map of Los Humeros volcanic complex and geothermal field, eastern Trans-Mexican Volcanic Belt. Terra Digit. 2017, 1, 1–11. [Google Scholar] [CrossRef]
- Gutiérrez-Negrín, L.C.A. Mexican Geothermal Plays. In Proceedings of the World Geothermal Congress 2015, Melbourne, Australia, 19–25 April 2015; p. 9. [Google Scholar]
- Flores-Espino, F.; Booth, S.; Graves, A. Mexico’s Geothermal Market Assessment Report; Technical Report NREL/TP-6A20-63722; NREL, National Renewable Energy Laboratory: Golden, CO, USA, 2017. [Google Scholar]
- Flores-Armenta, M.; Ramírez-Montes, M.; Morales-Alcalá, L. Geothermal activity and development in Mexico–keeping the production going. In Proceedings of the Short Course VI on Utilization of Low-and Medium-Enthalpy Geothermal Resources and Financial Aspects of Utilization, Santa Tecla, El Salvador, 23–29 March 2014. [Google Scholar]
- Muñiz-Jáuregui, J.A.; Guzmán-Cervantes, C.S.; Garduño-Monroy, V.H.; Jiménez-Haro, A.; Layer, P. Geomorphology of Las Derrumbadas dome complex, Puebla Mexico. J. Maps 2019, 15, 601–610. [Google Scholar] [CrossRef] [Green Version]
- Zimmer, B.W.; Riggs, N.R.; Carrasco-Nuñez, G. Evolution of tuff ring-dome complex: the case study of Cerro Pinto, eastern Trans-Mexican Volcanic Belt. Bull. Volcanol. 2010, 72, 1223–1240. [Google Scholar] [CrossRef]
- Riggs, N.R.; Carrasco-Nuñez, G. Evolution of a complex isolated dome system, Cerro Pizarro, central Mexico. Bull. Volcanol. 2004, 66, 322–335. [Google Scholar] [CrossRef]
- Siebe, C.; Macías, J.L.; Abrams, M.; Rodríguez, S.; Castro, R.; Delgado, H. Quaternary Explosive Volcanism and Pyroclastic Deposits in East Central Mexico: Implications for Future Hazards. In Proceedings of the Geological Society of America Annual Meeting, New Orleans, LA, USA, 6–9 November 1995; pp. 1–47. [Google Scholar]
- CONAGUA. Actualización de la Disponibilidad Media Anual de Agua en el Acuífero de Libres-Oriental (2102), Estado de Puebla. Diario Oficial de la Federación. 20 April 2015. Available online: https://www.gob.mx/cms/uploads/attachment/file/103300/DR_2102.pdf (accessed on 23 June 2019).
- López-Hernández, A.; García-Estrada, G.; Aguirre-Díaz, G.; González-Partida, E.; Palma-Guzmán, H.; Quijano-León, J. Hydrothermal activity in the Tulancingo-Acoculco Caldera Complex, central México-exploratory studies. Geothermics 2009, 38, 279–293. [Google Scholar] [CrossRef]
- García-Palomo, A.; Macías, J.L.; Jiménez, A.; Tolson, G.; Mena, M.; Sánchez-Núñez, J.M.; Arce, J.L.; Layer, P.W.; Santoyo, M.A.; Lermo-Samaniego, J. NW-SE Pliocene-Quaternary extension in the Apan-Acoculco region, eastern Trans-Mexican Volcanic Belt. J. Volcanol. Geoth. Res. 2018, 349, 240–255. [Google Scholar] [CrossRef]
- Canet, C.; Trillaud, F.; Prol-Ledesma, R.M.; González-Hernández, G.; Peláez, B.; Hernández-Cruz, B.; Sánchez-Córdova, M.M. Thermal history of the Acoculco geothermal system, eastern México: Insights from numerical modeling and radiocarbon dating. J. Volcanol. Geoth. Res. 2015, 305, 56–62. [Google Scholar] [CrossRef]
- Sosa-Ceballos, G.; Macías, J.L.; Avellán, D.R.; Salazar-Hermenegildo, N.; Boijseauneau-López, M.E.; Pérez-Orozco, J.D. The Acoculco Caldera Complex magmas: Genesis, evolution and relation with the Acoculco geothermal system. J. Volcanol. Geoth. Res. 2018, 358, 288–306. [Google Scholar] [CrossRef]
- INEGI. Encuesta Intercensal 2015: Principales Resultados. Mexico. 2015. Available online: http://www.beta.inegi.org.mx/contenidos/programas/intercensal/2015/doc/eic_2015_presentacion.pdf (accessed on 23 June 2019).
- Secretaría de Cultura y Turismo. Indicadores Básicos de la Actividad Cultural y Turística en Puebla año 2018. Available online: http://sc.puebla.gob.mx/images/itpv2.pdf (accessed on 22 August 2019).
- Garfias, J.; Arroyo, N.; Aravena, R. Hydrochemistry and origins of mineralized waters in the Puebla aquifer system, Mexico. Environ. Earth Sci. 2010, 59, 1789–1805. [Google Scholar] [CrossRef]
- CONAGUA. Actualización de la Disponibilidad Media Anual de Agua en el Acuífero de Valle de Puebla (2104), Estado de Puebla. Diario Oficial de la Federación. 20 April 2015. Available online: www.gob.mx/cms/uploads/attachment/file/273105/DR_2104_VALLE_DE_PUEBLA.pdf (accessed on 23 June 2019).
- Flores-Marquez, E.L.; Jimenez-Juarez, G.; Martınez-Serrano, R.G.; Chavez, R.E.; Silva-Perez, D. Study of geothermal water intrusion due to groundwater exploitation in the Puebla Valley aquifer system, Mexico. Hydrogeol. J. 2006, 14, 1216–1230. [Google Scholar] [CrossRef]
- Secretaría de Gobernación. Acuerdo por el que se da a Conocer la Ubicación Geográfica de 371 Acuíferos del Territorio Nacional, se Actualiza la Disponibilidad Media Anual de Agua Subterránea de 282 Acuíferos, y se Modifica, Para su Mejor Precisión, la Descripción Geográfica de 202 Acuíferos. Diario Oficial de la Federación. 28 August 2009. Available online: http://legismex.mty.itesm.mx/acu/acuif/acu-acuif-371-09.pdf (accessed on 17 August 2019).
- Secretaría de Gobernación. Acuerdo por el que se Actualiza la Disponibilidad Media Anual de Agua Subterránea de los 653 Acuíferos de los Estados Unidos Mexicanos, Mismos que Forman Parte de las Regiones Hidrológico-Administrativas que se indican. Diario Oficial de la Federación. 4 January 2018; p. 26. Available online: https://agua.org.mx/wp-content/uploads/2018/02/Disponibilidad-Media-Anual-Acuiferos-2018DOF.pdf (accessed on 23 June 2019).
- Geotecnología, S.A. Actualización del Estudio Geohidrológico de los Acuíferos del Valle de Puebla, Puebla. (Revised Geohydrological Study of the Valle de Puebla Aquifer System, Puebla); Sistema Operador de Agua Potable y Alcantarillado de Puebla (SOAPAP): Puebla, Mexico, 1997. [Google Scholar]
- Sandoval Montes, I.C.; Ramos Leal, J.A.; Morán Ramírez, J. El sistema hidrológico Esperanza-Oriental y su impacto sobre el acuífero de Tecamachalco, Puebla, México. The Esperanza-Oriental hydrological system and its impact on Tecamachalco’s aquifer in Puebla State, Mexico; Realidad, datos y espacio. Revista internacional de estadística y geografía; INEGI: Aguascalientes, Mexico, 2016; Volume 7, pp. 14–25. [Google Scholar]
- Domínguez-Mariani, E.; Carrillo-Chávez, A.; Ortega, A.; Orozco-Esquivel, M.T. Wastewater Reuse in Valsequillo Agricultural Area, Mexico: Environmental Impact on Groundwater. Water Air Soil Poll. 2004, 155, 251–267. [Google Scholar] [CrossRef]
- CUPREDER. Atlas de Riesgos del municipio de Tecamachalco, Puebla, 2011. Benemérita Universidad Autónoma de Puebla, Report n.121154PPO36642, Tecamachalco, Puebla. 2011. Available online: http://www.normateca.sedesol.gob.mx/work/models/SEDESOL/Resource/2612/Atlas_Estados/21154_TECAMACHALCO/0_ATLAStecamachalCapI-V.pdf (accessed on 23 June 2019).
- CONAGUA. Actualización de la Disponibilidad Media Anual de Agua en el Acuífero de Valle de Tecamachalco (2101), Estado de Puebla. Diario Oficial de la Federación. 20 April 2015. Available online: https://www.gob.mx/cms/uploads/attachment/file/103299/DR_2101.pdf (accessed on 23 June 2019).
- CONAGUA. Atlas del Agua en México 2018. 2018. Available online: https://files.conagua.gob.mx/conagua/publicaciones/Publicaciones/AAM2018.pdf (accessed on 17 August 2019).
- CONAGUA. Localizador REPDA de Aguas Nacionales, Zonas Federales y Descargas de Aguas Residuales, LocREPDA, v.2017. Available online: https://sigagis.conagua.gob.mx/locrepda3/ (accessed on 23 June 2019).
- CONAGUA. Acuíferos (Nacional). Available online: http://sina.conagua.gob.mx/sina/tema.php?tema=acuiferos (accessed on 23 June 2019).
- Zebker, H.A.; Villasenor, J. Decorrelation in interferometric radar echoes. IEEE Trans. Geosci. Remote 1992, 30, 950–959. [Google Scholar] [CrossRef] [Green Version]
- Casu, F.; Elefante, S.; Imperatore, P.; Zinno, I.; Manunta, M.; De Luca, C.; Lanari, R. SBAS-DInSAR Parallel Processing for Deformation Time-Series Computation. IEEE J. Sel. Top. Appl. 2014, 7, 3285–3296. [Google Scholar] [CrossRef]
- De Luca, C.; Zinno, I.; Manunta, M.; Lanari, R.; Casu, F. Large areas surface deformation analysis through a cloud computing P-SBAS approach for massive processing of DInSAR time series. Remote Sens. Environ. 2017, 202, 3–17. [Google Scholar] [CrossRef]
- Zinno, I.; Casu, F.; De Luca, C.; Elefante, S.; Lanari, R.; Manunta, M. A Cloud Computing Solution for the Efficient Implementation of the P-SBAS DInSAR Approach. IEEE J. Sel. Top. Appl. 2017, 10, 802–817. [Google Scholar] [CrossRef]
- De Luca, C.; Cuccu, R.; Elefante, S.; Zinno, I.; Manunta, M.; Casola, V.; Rivolta, G.; Lanari, R.; Casu, F. An On-Demand Web Tool for the Unsupervised Retrieval of Earth’s Surface Deformation from SAR Data: The P-SBAS Service within the ESA G-POD Environment. Remote Sens. 2015, 7, 15630–15650. [Google Scholar] [CrossRef]
- Cigna, F. Getting ready for the generation of a nationwide ground motion product for Great Britain using SAR data stacks: Feasibility, data volumes and perspectives. Int. Geosci. Remote Sens. 2011, 1464–1467. [Google Scholar] [CrossRef]
- Cignetti, M.; Manconi, A.; Manunta, M.; Giordan, D.; De Luca, C.; Allasia, P.; Ardizzone, F. Taking Advantage of the ESA G-POD Service to Study Ground Deformation Processes in High Mountain Areas: A Valle d’Aosta Case Study, Northern Italy. Remote Sens. 2016, 8, 852. [Google Scholar] [CrossRef]
- Cigna, F.; Tapete, D. The value of SAR big data for geohazard applications: Automated grid processing of ERS-1/2 and ENVISAT data in ESA’s G-POD. In 2017 Conference on Big Data from Space (BIDS’2017); Soille, P., Marchetti, P.G., Eds.; Publications Office of the EU: Luxembourg, 2017; pp. 165–168. [Google Scholar] [CrossRef]
- Pepe, S.; D’Auria, L.; Castaldo, R.; Casu, F.; De Luca, C.; De Novellis, V.; Sansosti, E.; Solaro, G.; Tizzani, P. The Use of Massive Deformation Datasets for the Analysis of Spatial and Temporal Evolution of Mauna Loa Volcano (Hawai’i). Remote Sens. 2018, 10, 968. [Google Scholar] [CrossRef]
- Cigna, F.; Sowter, A. The relationship between intermittent coherence and precision of ISBAS InSAR ground motion velocities: ERS-1/2 case studies in the UK. Remote Sens. Environ. 2017, 202, 177–198. [Google Scholar] [CrossRef]
- Fuhrmann, T.; Garthwaite, M.C. Resolving three-dimensional surface motion with InSAR: Constraints from multi-geometry data fusion. Remote Sens. 2019, 11, 241. [Google Scholar] [CrossRef]
- CONAGUA. Actualización de la disponibilidad media anual de agua en el acuífero de Alto Atoyac (2901), Estado de Tlaxcala. Diario Oficial de la Federación. 20 April 2015. Available online: https://www.gob.mx/cms/uploads/attachment/file/103387/DR_2901.pdf (accessed on 23 June 2019).
- CONAGUA. Actualización de la Disponibilidad Media Anual de Agua en el Acuífero de Valle de Tulancingo (1317), Estado de Hidalgo. Diario Oficial de la Federación. 20 April 2015. Available online: https://www.gob.mx/cms/uploads/attachment/file/103066/DR_1317.pdf (accessed on 23 June 2019).
- CONAGUA. Actualización de la Disponibilidad Media Anual de Agua en el Acuífero Texcoco (1507), Estado de México. Diario Oficial de la Federación. 20 April 2015. Available online: https://www.gob.mx/cms/uploads/attachment/file/273113/DR_1507_TEXCOCO_EDOM_X.pdf (accessed on 23 June 2019).
- Cabral-Cano, E.; Osmanoğlu, B.; Dixon, T.; Wdowinski, S.; DeMets, C.; Cigna, F.; Díaz-Molina, O. Subsidence and fault hazard maps using PSInSAR and permanent GPS networks in central Mexico. In Land Subsidence, Associated Hazards and the Role of Natural Resources Development; Carreón-Freyre, D., Cerca, M., Galloway, D.L., Eds.; IAHS Press: Wallingford, UK, 2010; pp. 255–259. [Google Scholar]
- Cigna, F.; Cabral-Cano, E.; Osmanoğlu, B.; Dixon, T.H.; Wdowinski, S. Detecting subsidence-induced faulting in Mexican urban areas by means of Persistent Scatterer Interferometry and subsidence horizontal gradient mapping. In Proceedings of the 2011 IEEE International Geoscience and Remote Sensing Symposium, Vancouver, BC, Canada , 24–29 July 2011 ; pp. 2125–2128. [Google Scholar] [CrossRef]
- Cabral-Cano, E.; Solano-Rojas, D.; Oliver-Cabrera, T.; Wdowinski, S.; Chaussard, E.; Salazar-Tlaczani, L.; Cigna, F.; DeMets, C.; Pacheco-Martínez, J. Satellite geodesy tools for ground subsidence and associated shallow faulting hazard assessment in central Mexico. Proc. Int. Assoc. Hydrol. Sci. 2015, 372, 255–260. [Google Scholar] [CrossRef] [Green Version]
- Siles, G.L.; Alcérreca-Huerta, J.C.; López-Quiroz, P.; Hernández, J.C. On the potential of time series InSAR for subsidence and ground rupture evaluation: Application to Texcoco and Cuautitlan–Pachuca subbasins, northern Valley of Mexico. Nat. Hazards 2015, 79, 1091–1110. [Google Scholar] [CrossRef]
- Siles, G.L.; Alcérreca-Huerta, J.C.; López-Quiroz, P.; Niemeier, W. Long Term Subsidence Analysis and Soil Fracturing Zonation Based on InSAR Time Series Modelling in Northern Zona Metropolitana del Valle de Mexico. Remote Sens. 2015, 7, 6908–6931. [Google Scholar] [CrossRef] [Green Version]
- Viggiano-Guerra, J.C.; Flores-Armenta, M.; Ramírez-Silva, G.R. Evolución del sistema geotérmico de Acoculco, Pue.; México: Un estudio con base en estudios petrográficos del pozo EAC-2 y en otras consideraciones. Geotermia 2011, 24, 14–24. [Google Scholar]
- Avellán, D.R.; Macías, J.L.; Layer, P.W.; Cisneros, G.; Sánchez-Núñez, J.M.; Gómez-Vasconcelos, M.G.; Pola, A.; Sosa-Ceballos, G.; García-Tenorio, F.; Reyes Agustín, G.; et al. Geology of the late Pliocene–Pleistocene Acoculco caldera complex, eastern Trans-Mexican Volcanic Belt. (México). J. Maps 2019, 15, 8–18. [Google Scholar] [CrossRef]
- Lermo, J.; Antayhua, Y.; Quintanar, L.; Loren, C. Estudio sismológico del campo geotérmico de Los Humeros, Puebla, México. Parte I: Sismicidad, mecanismos de fuente y distribución de esfuerzos. Geotermia 2008, 21, 25–41. [Google Scholar]
- CONAGUA. Actualización de la Disponibilidad Media Anual de Agua en el Acuífero de Perote-Zalayeta (3004), Estado de Veracruz. Diario Oficial de la Federación. 20 April 2015. Available online: https://www.gob.mx/cms/uploads/attachment/file/273077/DR_3004_PEROTE_ZALAYETA_VERACRUZ.pdf (accessed on 23 June 2019).
- CONAGUA. Actualización de la Disponibilidad Media Anual de Agua en el Acuífero de Tecolutla (3002), Estado de Veracruz. Diario Oficial de la Federación. 20 April 2015. Available online: https://www.gob.mx/cms/uploads/attachment/file/104446/DR_3002.pdf (accessed on 23 June 2019).
- The GEMex Project. Available online: http://www.gemex-h2020.eu (accessed on 17 August 2019).
- Bonì, R.; Cigna, F.; Bricker, S.; Meisina, C.; McCormack, H. Characterisation of hydraulic head changes and aquifer properties in the London Basin using Persistent Scatterer Interferometry land subsidence data. J. Hydrol. 2016, 540, 835–849. [Google Scholar] [CrossRef]
- Castellazzi, P.; Martel, R.; Rivera, A.; Huang, J.; Pavlic, G.; Calderhead, A.I.; Chaussard, E.; Garfias, J.; Salas, J. Groundwater depletion in Central Mexico: Use of GRACE and InSAR to support water resources management. Water Resour. Res. 2016, 52, 5985–6003. [Google Scholar] [CrossRef]


| ID | No. Scenes | Dates | Orbit | Track | Area [km2] | Identified Targets | Density [Targets/km2] | LOS Velocity [mm/year] |
|---|---|---|---|---|---|---|---|---|
| #1 | 22 | 2003–2007 | Desc | T212 | 9,500 | 104,805 | 11 | −11.7 – +8.1 |
| #2 | 22 | 2003–2007 | Desc | T212 | 11,300 | 239,428 | 21 | −20.3 – +8.2 |
| #3 | 32 | 2003–2010 | Desc | T484 | 10,200 | 109,647 | 11 | −30.6 – +7.4 |
| #4 | 31 | 2003–2010 | Desc | T484 | 11,500 | 118,720 | 10 | −45.3 – +7.9 |
| #5 | 29 | 2003–2010 | Asc | T148 | 11,000 | 144,548 | 13 | −51.0 – +10.2 |
| #6 | 34 | 2003–2010 | Asc | T148 | 11,100 | 125,757 | 11 | −49.0 – +10.0 |
© 2019 by the authors. Licensee MDPI, Basel, Switzerland. This article is an open access article distributed under the terms and conditions of the Creative Commons Attribution (CC BY) license (http://creativecommons.org/licenses/by/4.0/).
Share and Cite
Cigna, F.; Tapete, D.; Garduño-Monroy, V.H.; Muñiz-Jauregui, J.A.; García-Hernández, O.H.; Jiménez-Haro, A. Wide-Area InSAR Survey of Surface Deformation in Urban Areas and Geothermal Fields in the Eastern Trans-Mexican Volcanic Belt, Mexico. Remote Sens. 2019, 11, 2341. https://doi.org/10.3390/rs11202341
Cigna F, Tapete D, Garduño-Monroy VH, Muñiz-Jauregui JA, García-Hernández OH, Jiménez-Haro A. Wide-Area InSAR Survey of Surface Deformation in Urban Areas and Geothermal Fields in the Eastern Trans-Mexican Volcanic Belt, Mexico. Remote Sensing. 2019; 11(20):2341. https://doi.org/10.3390/rs11202341
Chicago/Turabian StyleCigna, Francesca, Deodato Tapete, Víctor Hugo Garduño-Monroy, Jesús Arturo Muñiz-Jauregui, Oscar Humberto García-Hernández, and Adrián Jiménez-Haro. 2019. "Wide-Area InSAR Survey of Surface Deformation in Urban Areas and Geothermal Fields in the Eastern Trans-Mexican Volcanic Belt, Mexico" Remote Sensing 11, no. 20: 2341. https://doi.org/10.3390/rs11202341