Rapid Detection of Windthrows Using Sentinel-1 C-Band SAR Data


Abstract
:
1. Introduction
2. Materials and Methods
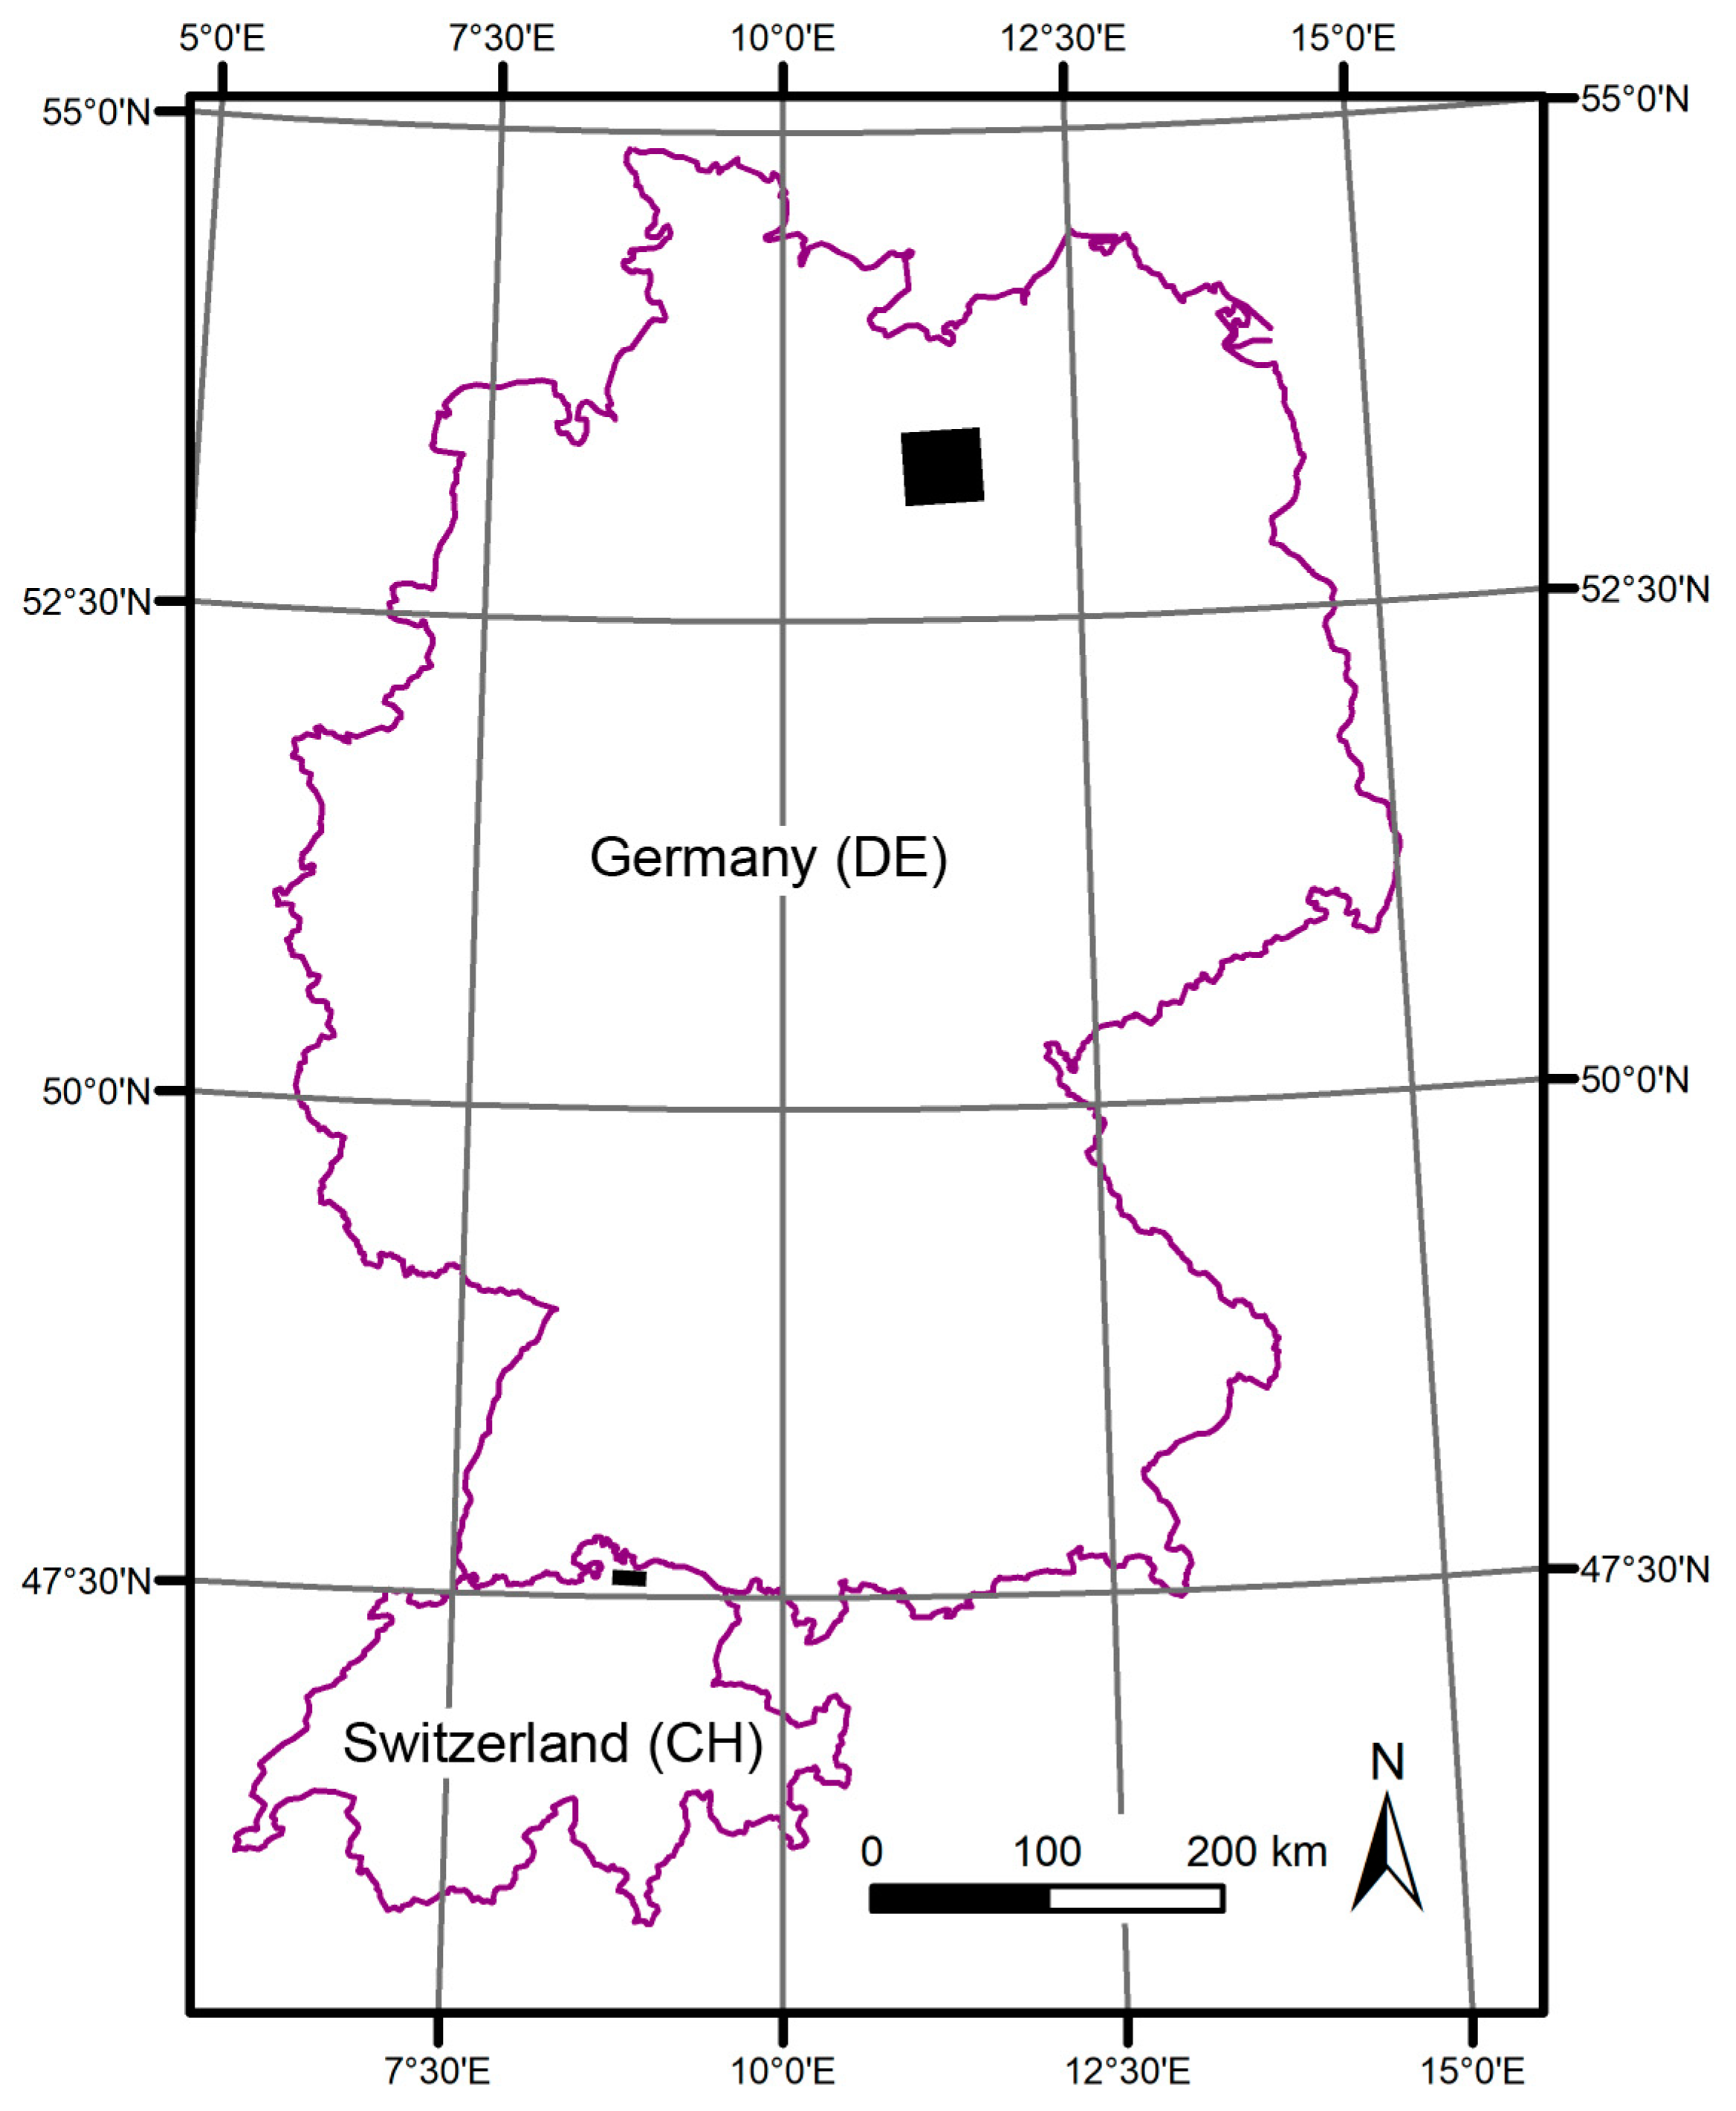
2.1. Study Areas
2.1.1. Swiss Study Area (SE of Schaffhausen, Switzerland): CH
2.1.2. German Study Area (East of Lüneburg, Germany): DE
2.2. Data
2.3. Methods
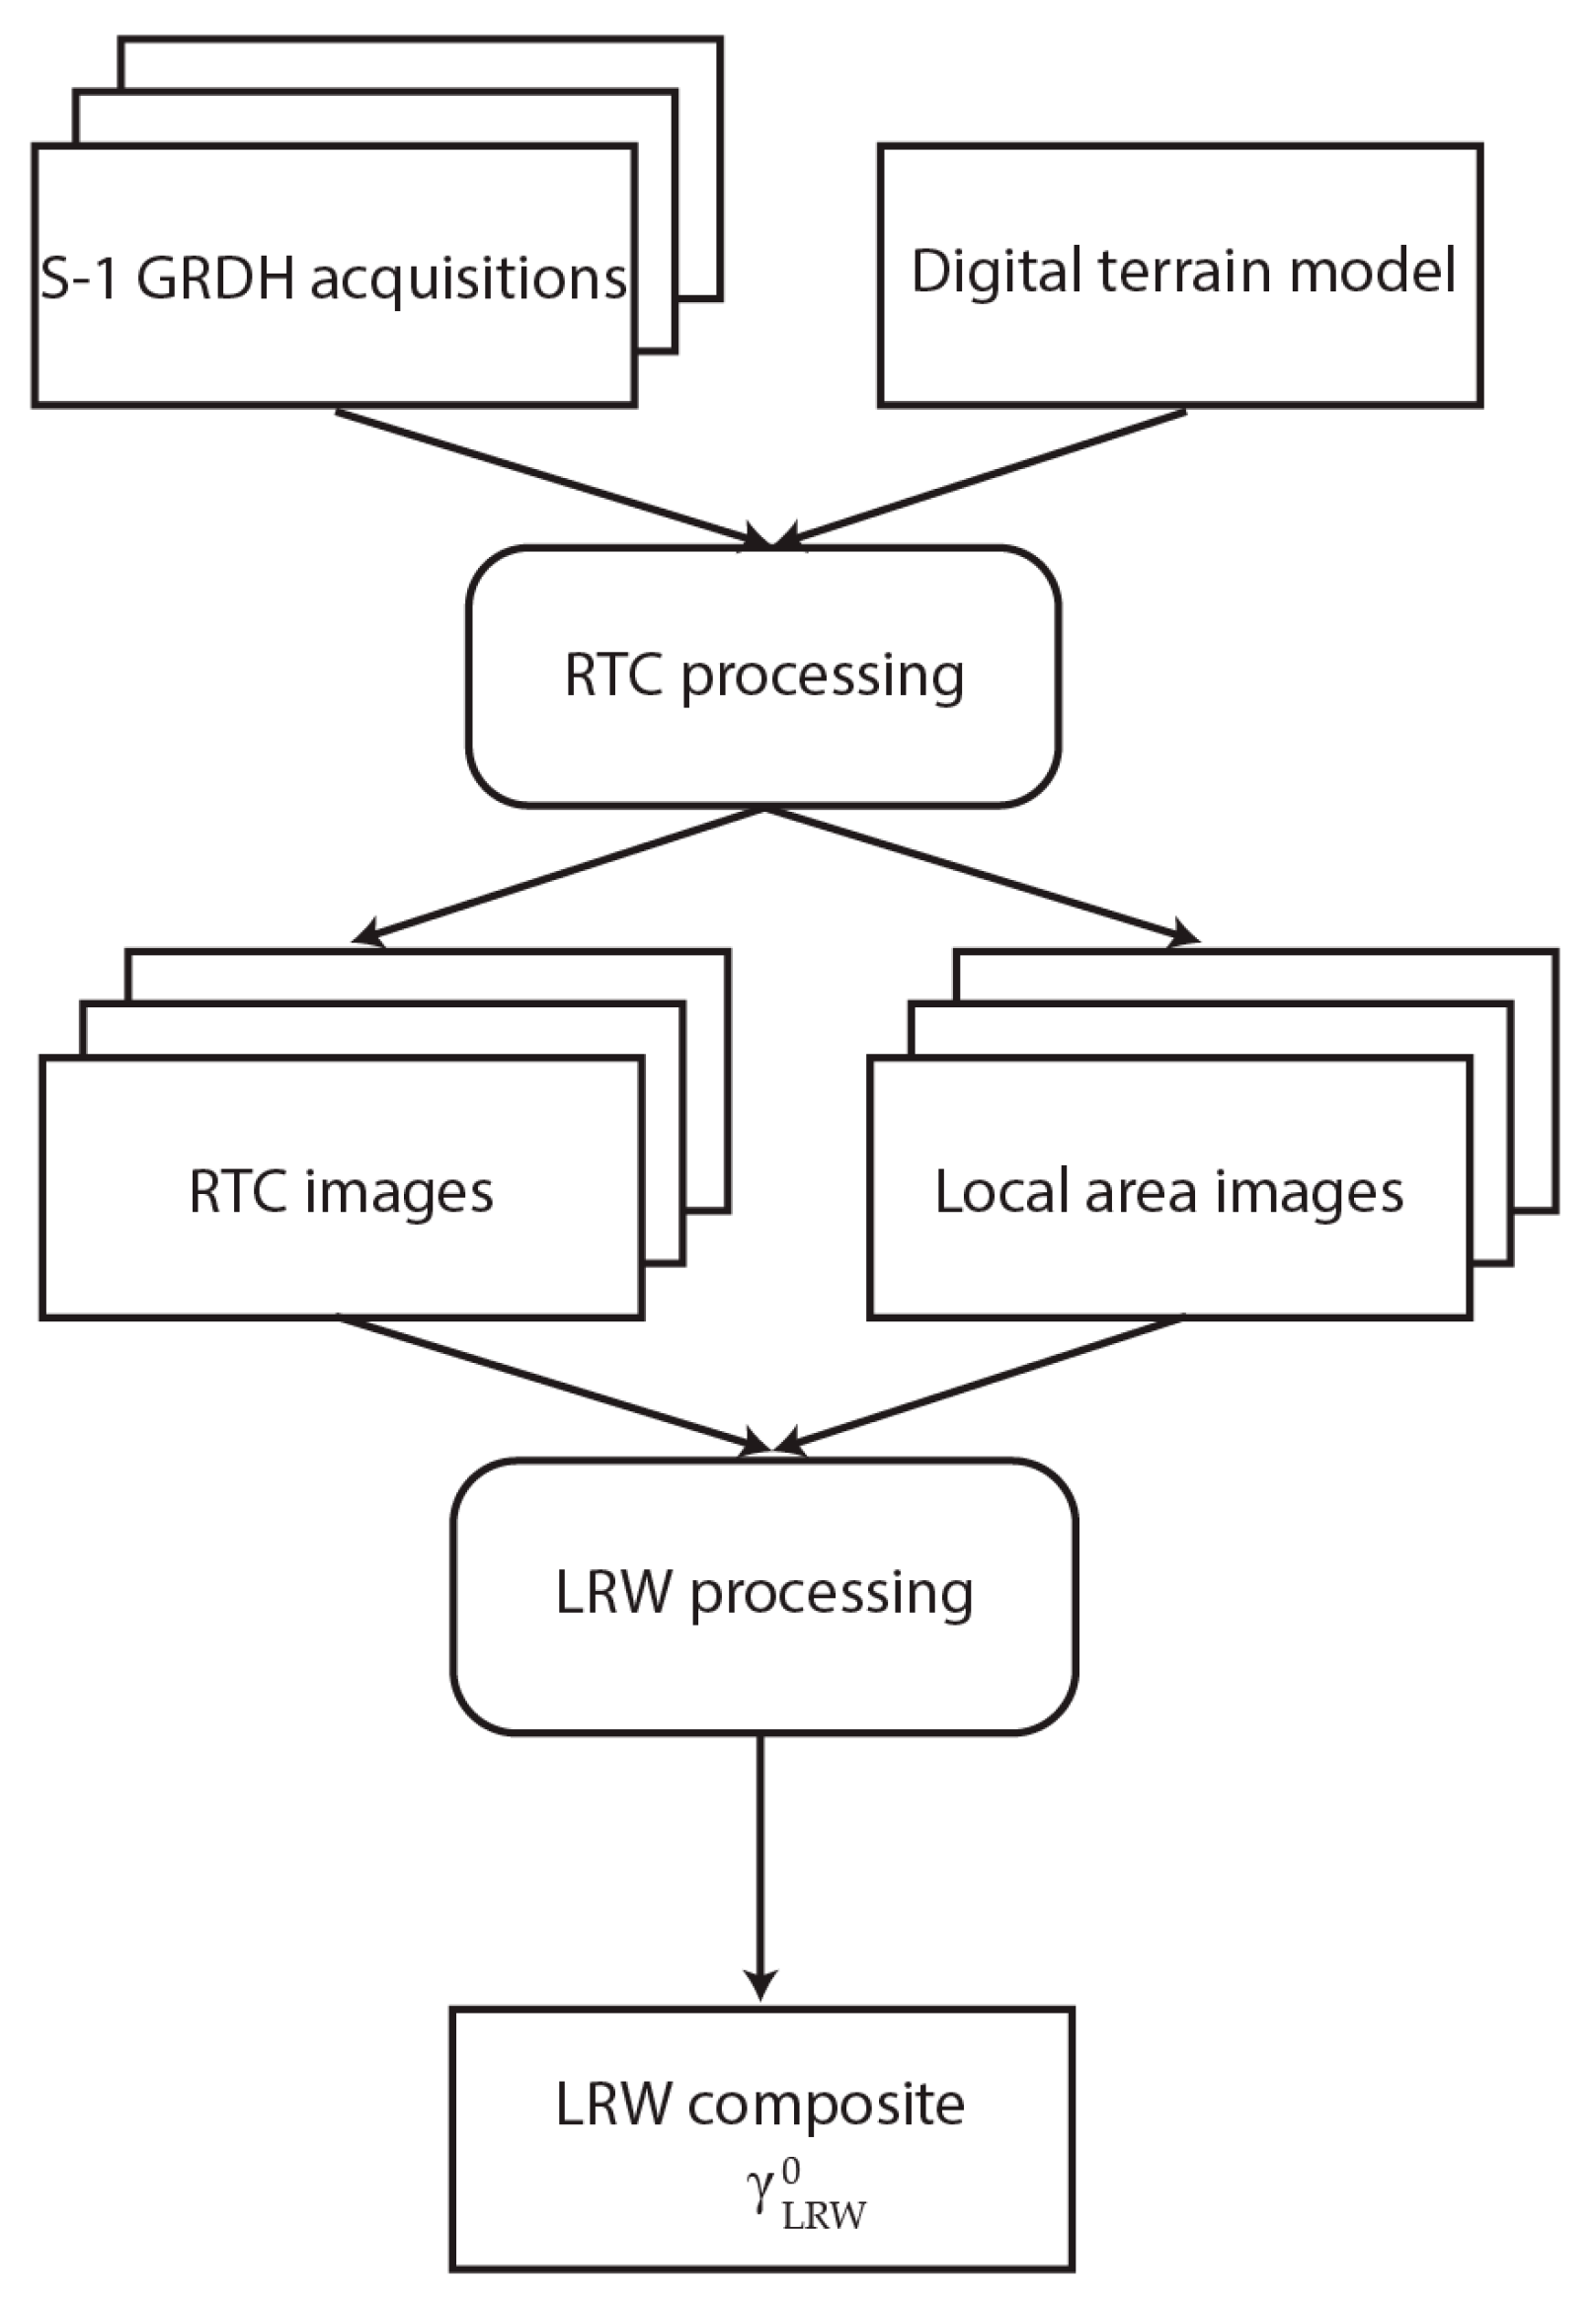
2.3.1. SAR Data Processing
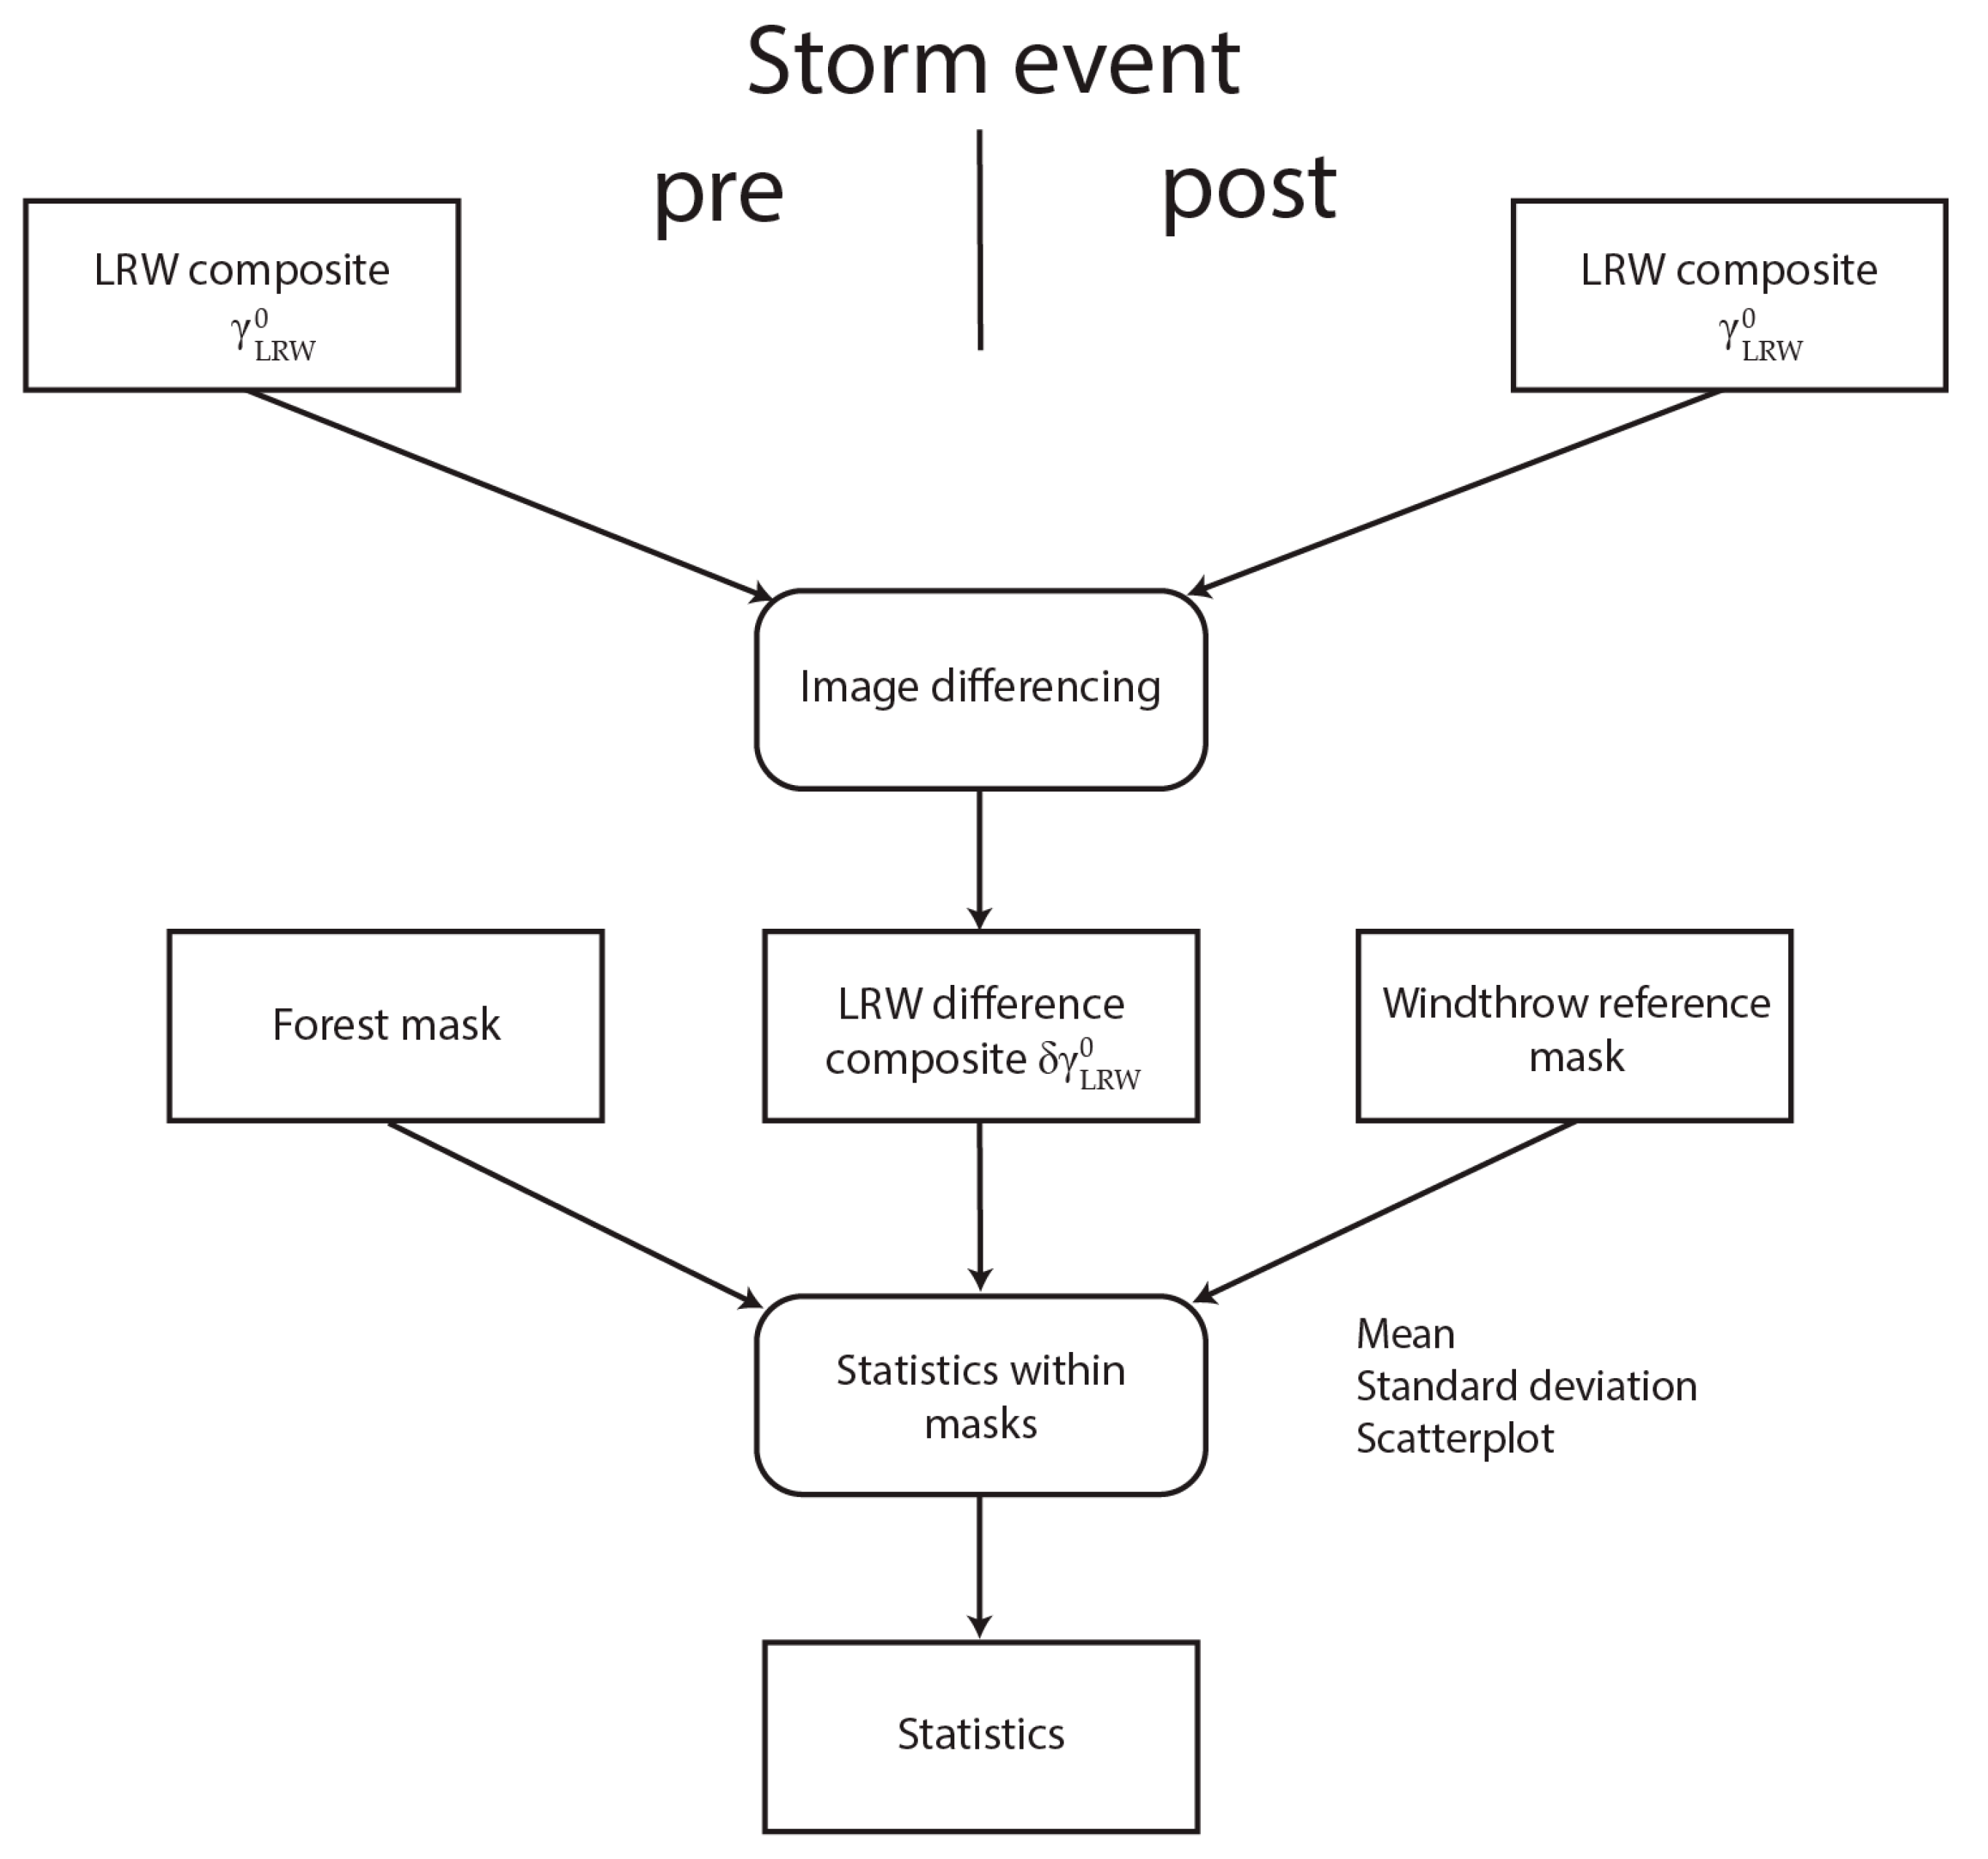
2.3.2. Image Differencing & Calculation of Statistics
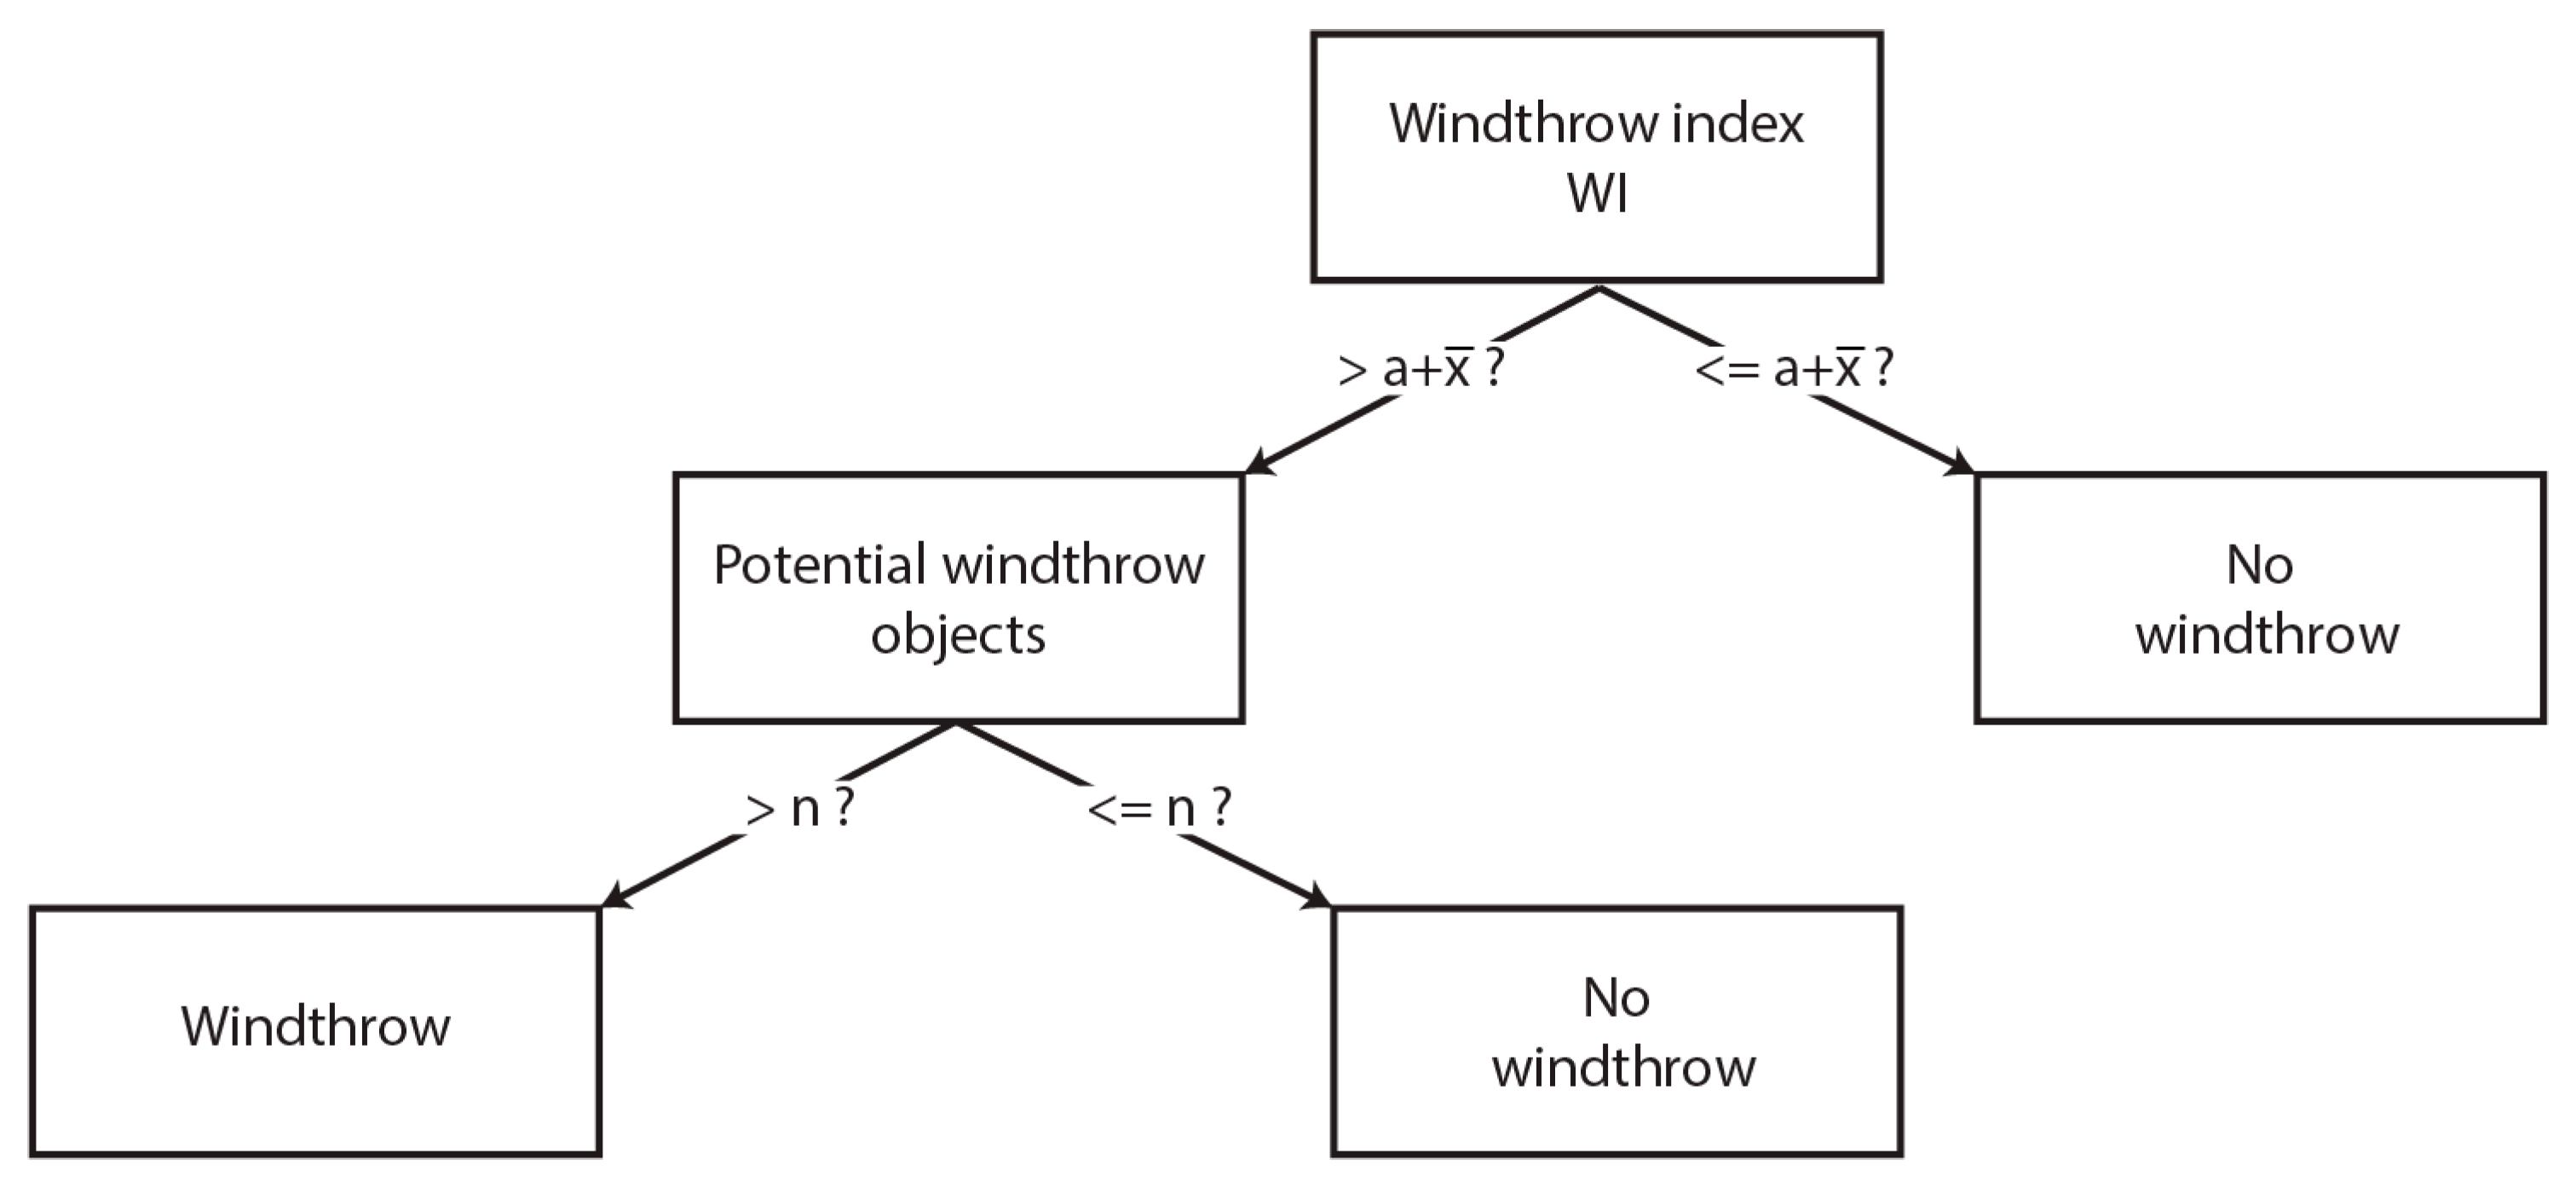
2.3.3. Detection Method
2.3.4. Influence of the Number of S-1 Acquisitions
3. Results
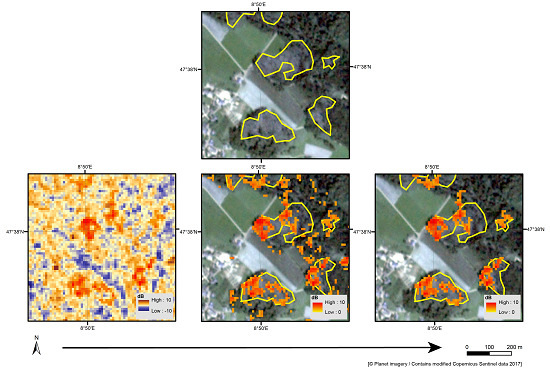
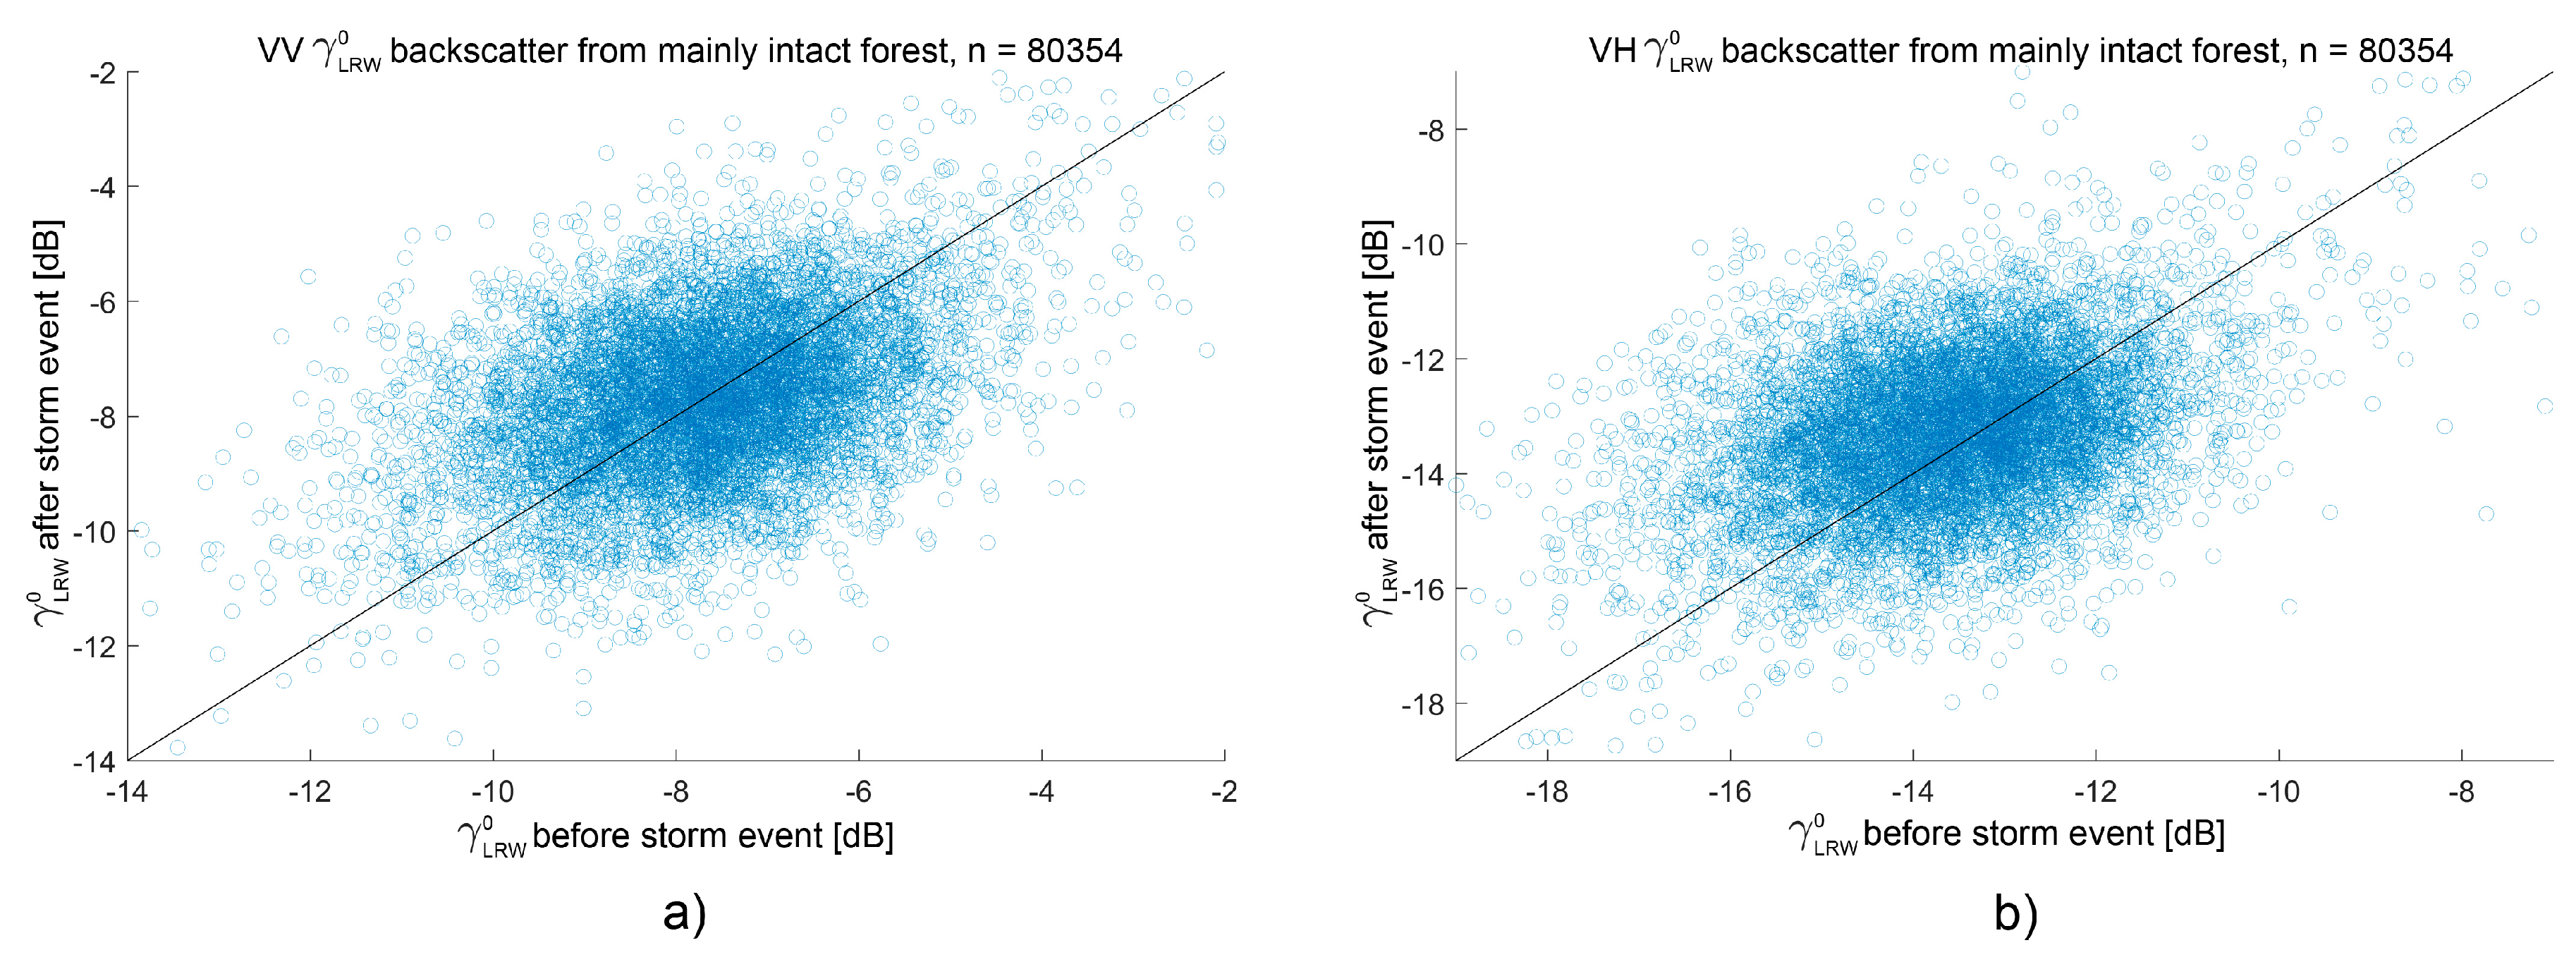
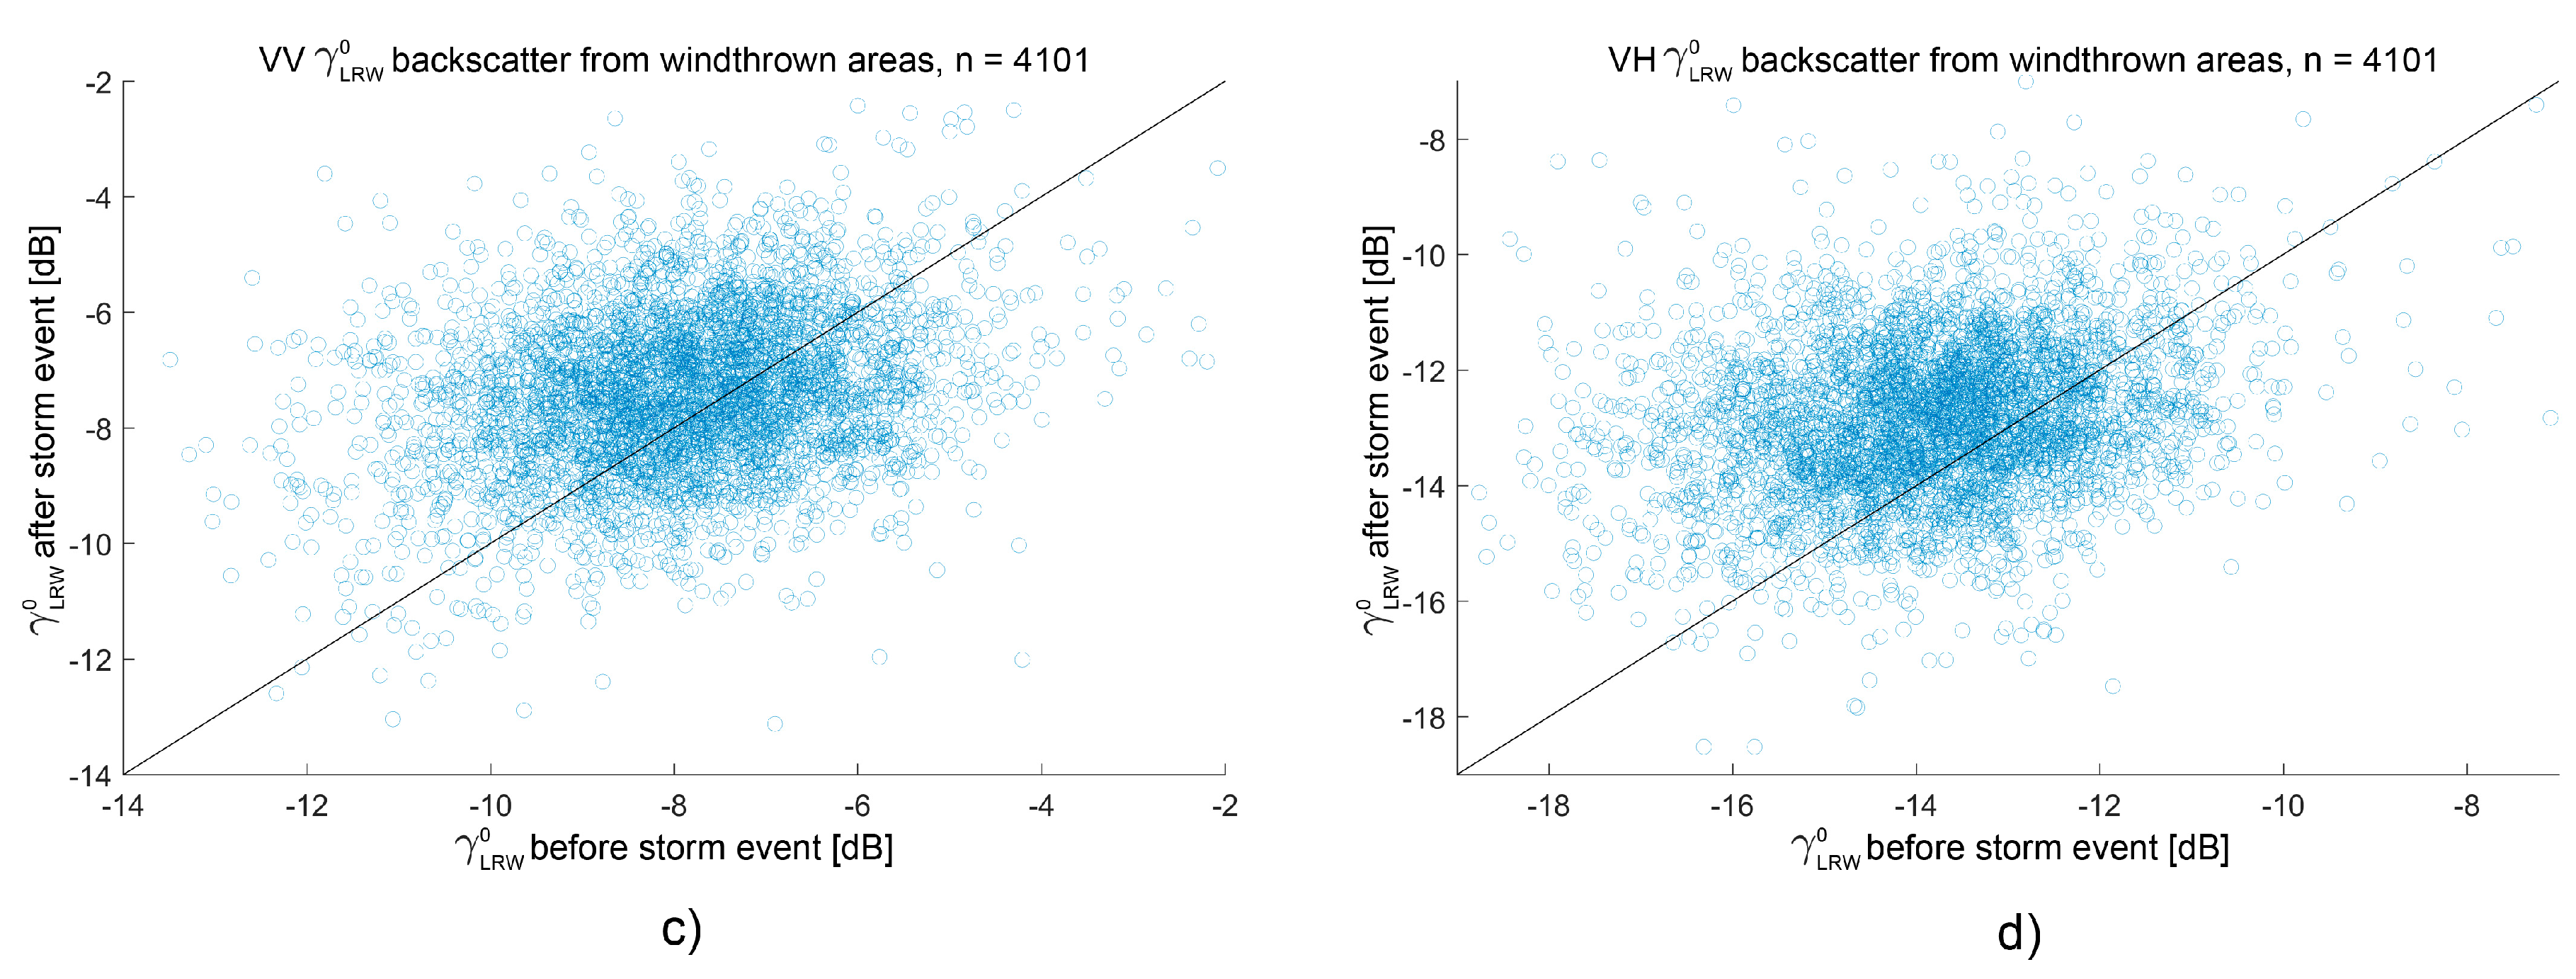
3.1. Statistics from Image Differencing
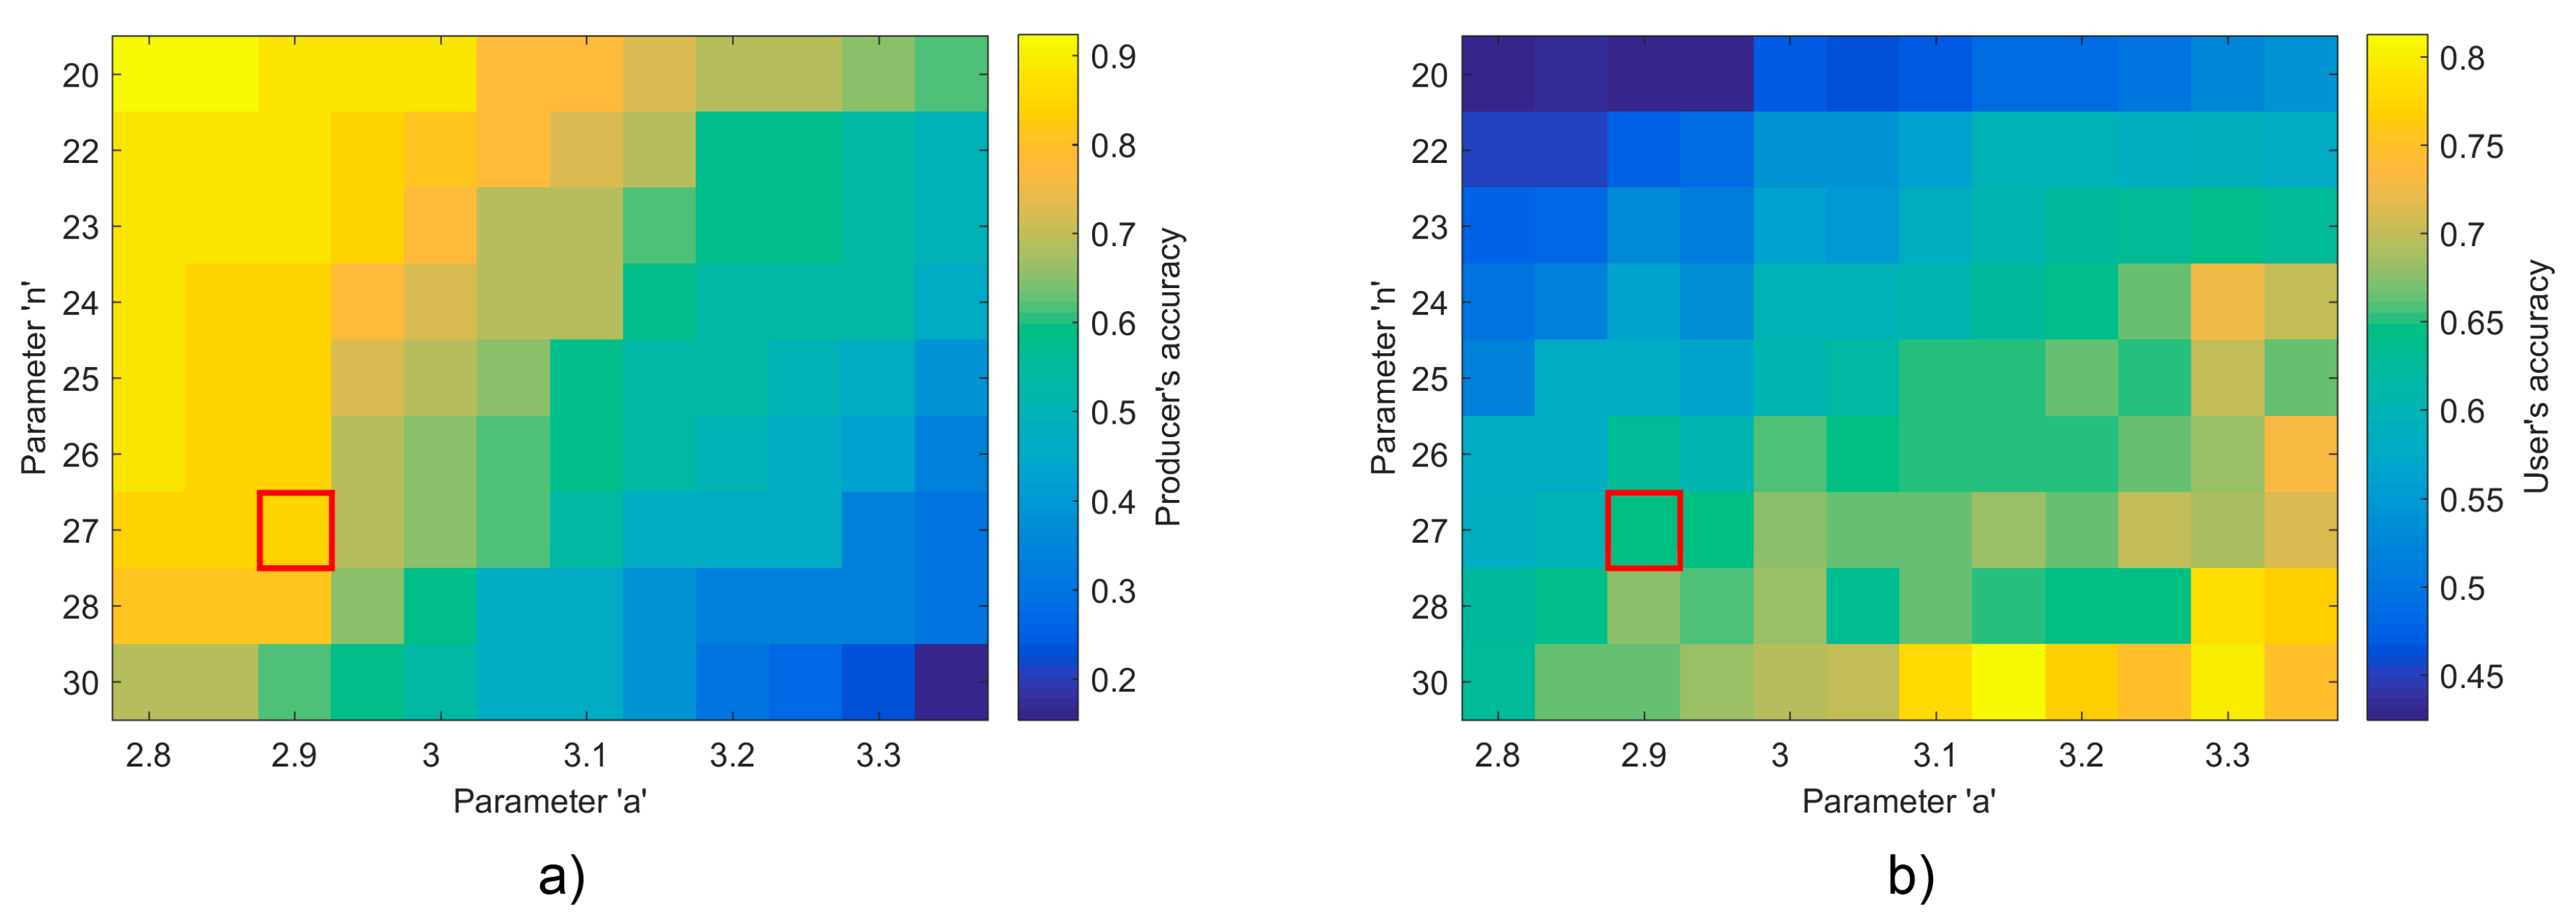
3.2. Parameter Combination Evaluation—Training of Method in Development Area
3.3. Method Evaluation in the German Validation Area Mecklenburg-Vorpommern
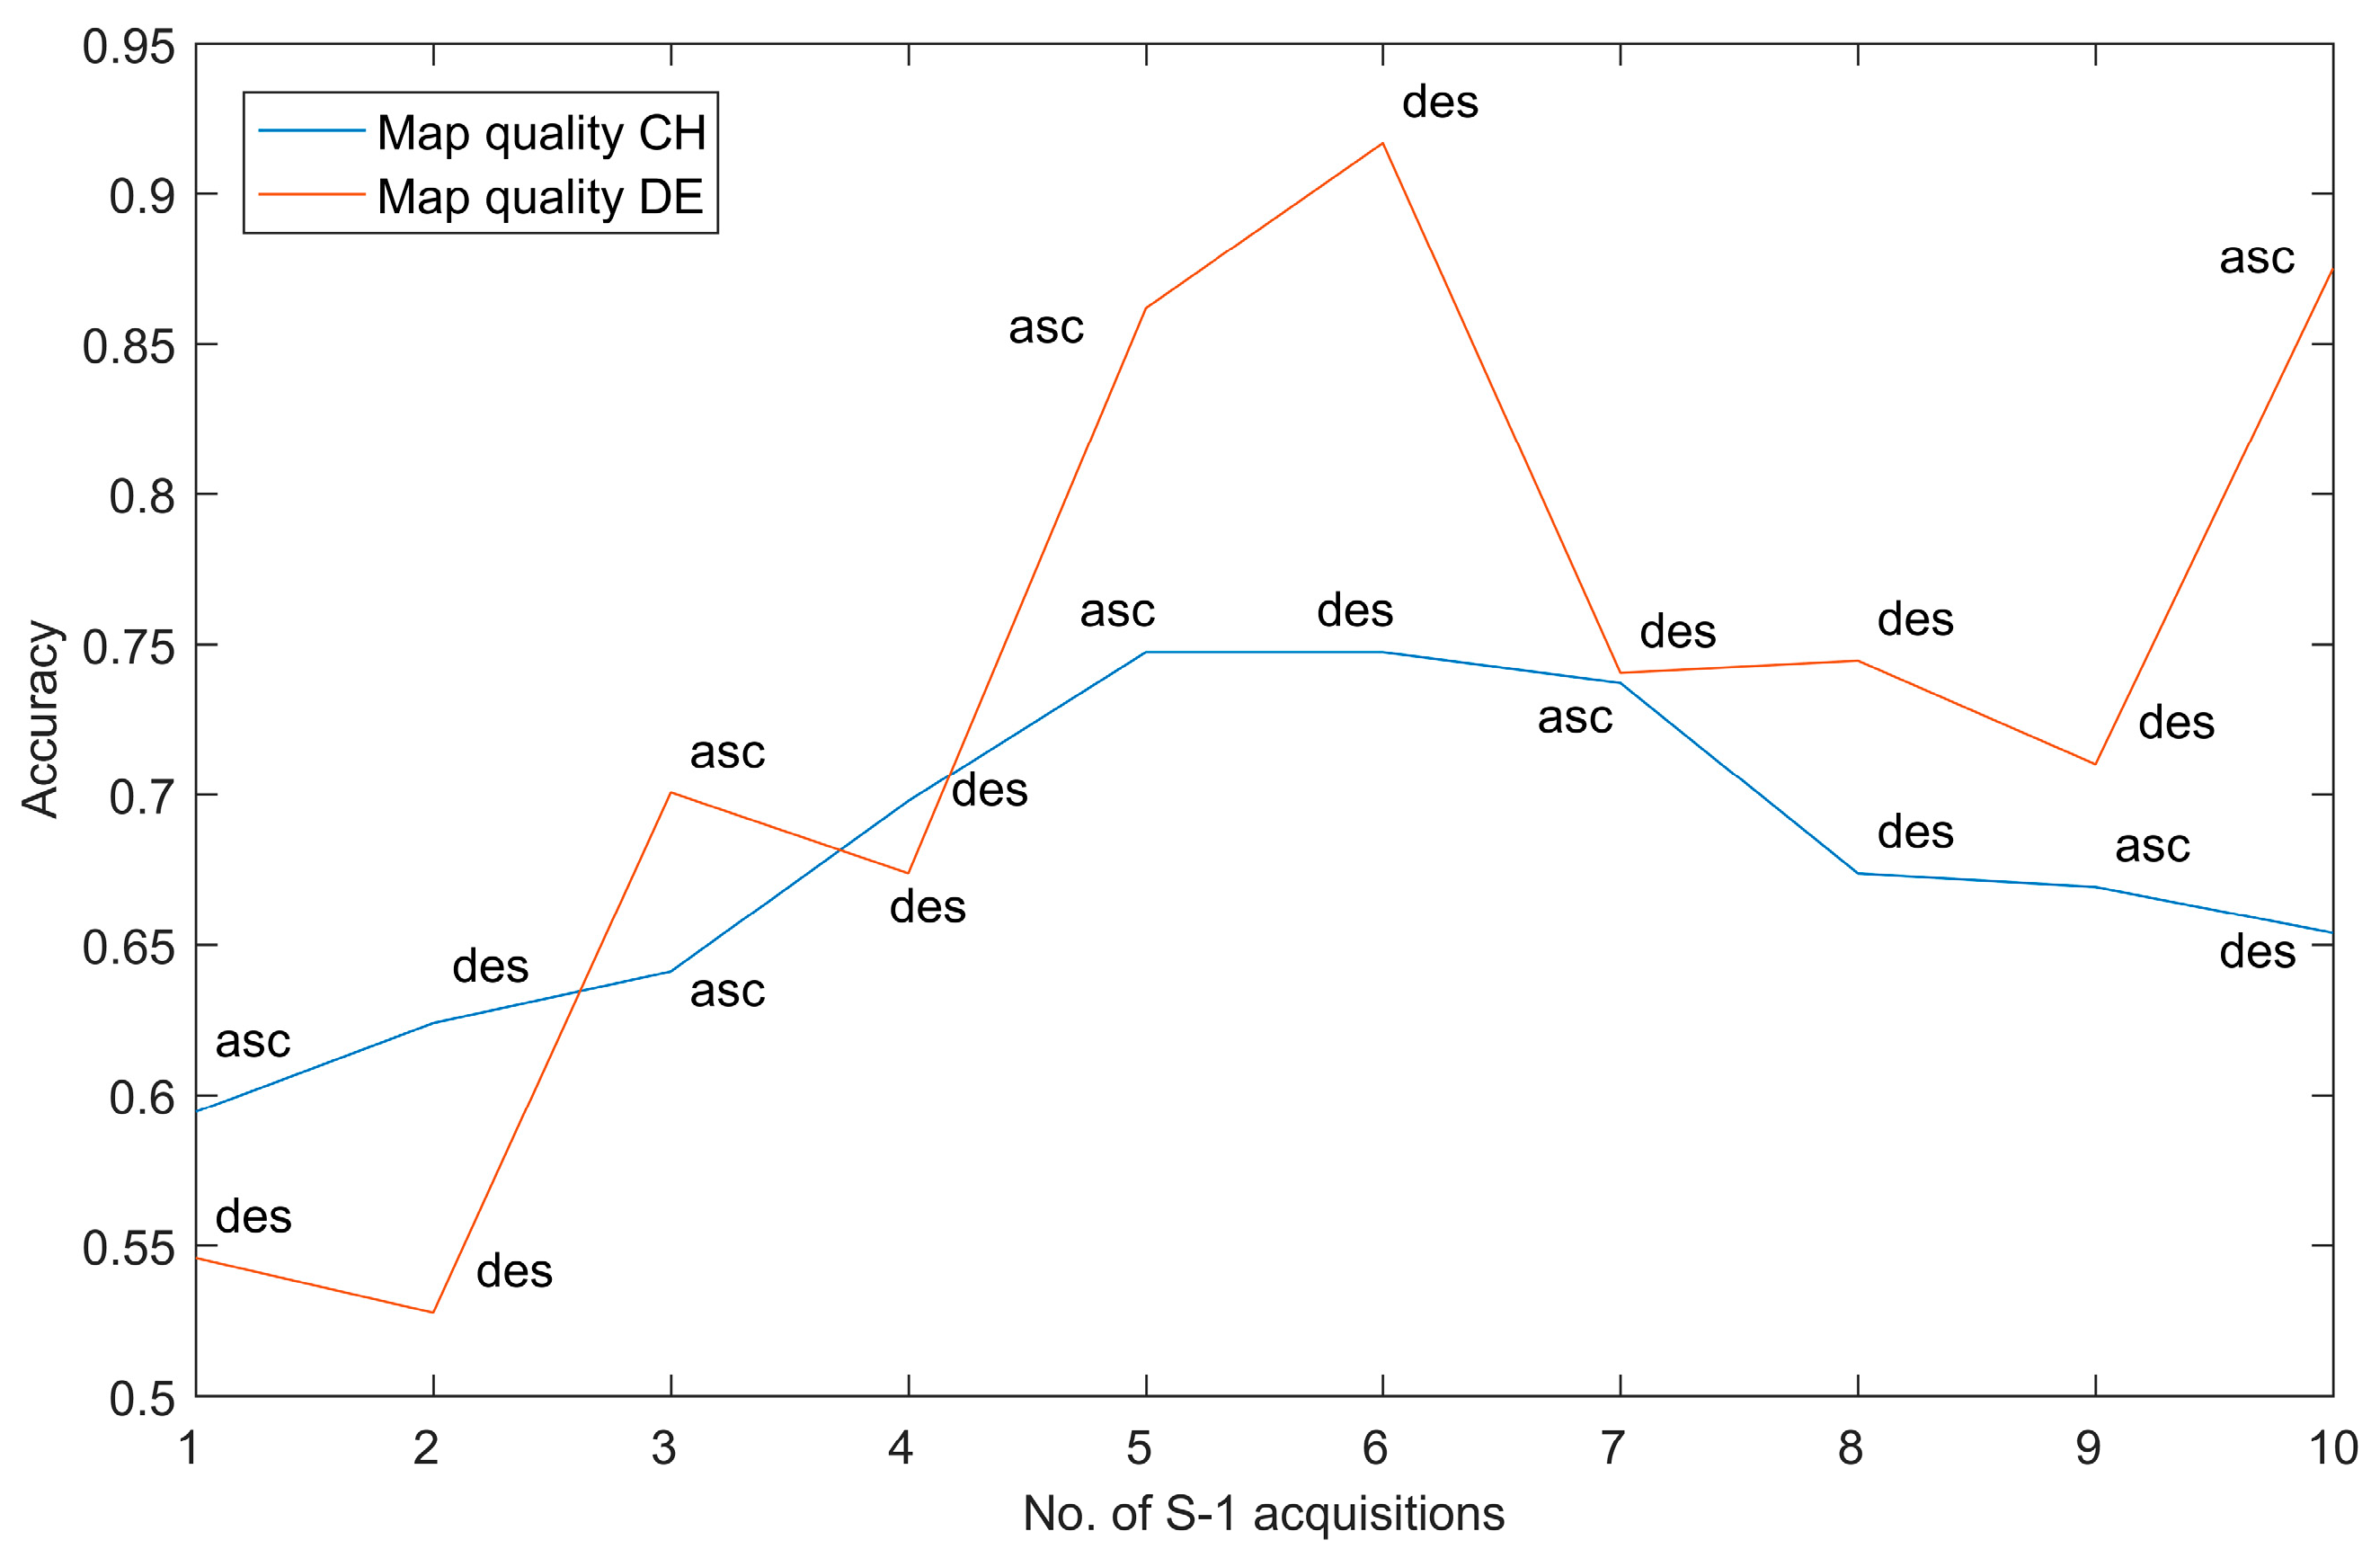
3.4. Influence of the Number of S-1 Acquisitions
4. Discussion
4.1. Diverging Backscatter Behaviour between Windthrown and Intact Forest Areas
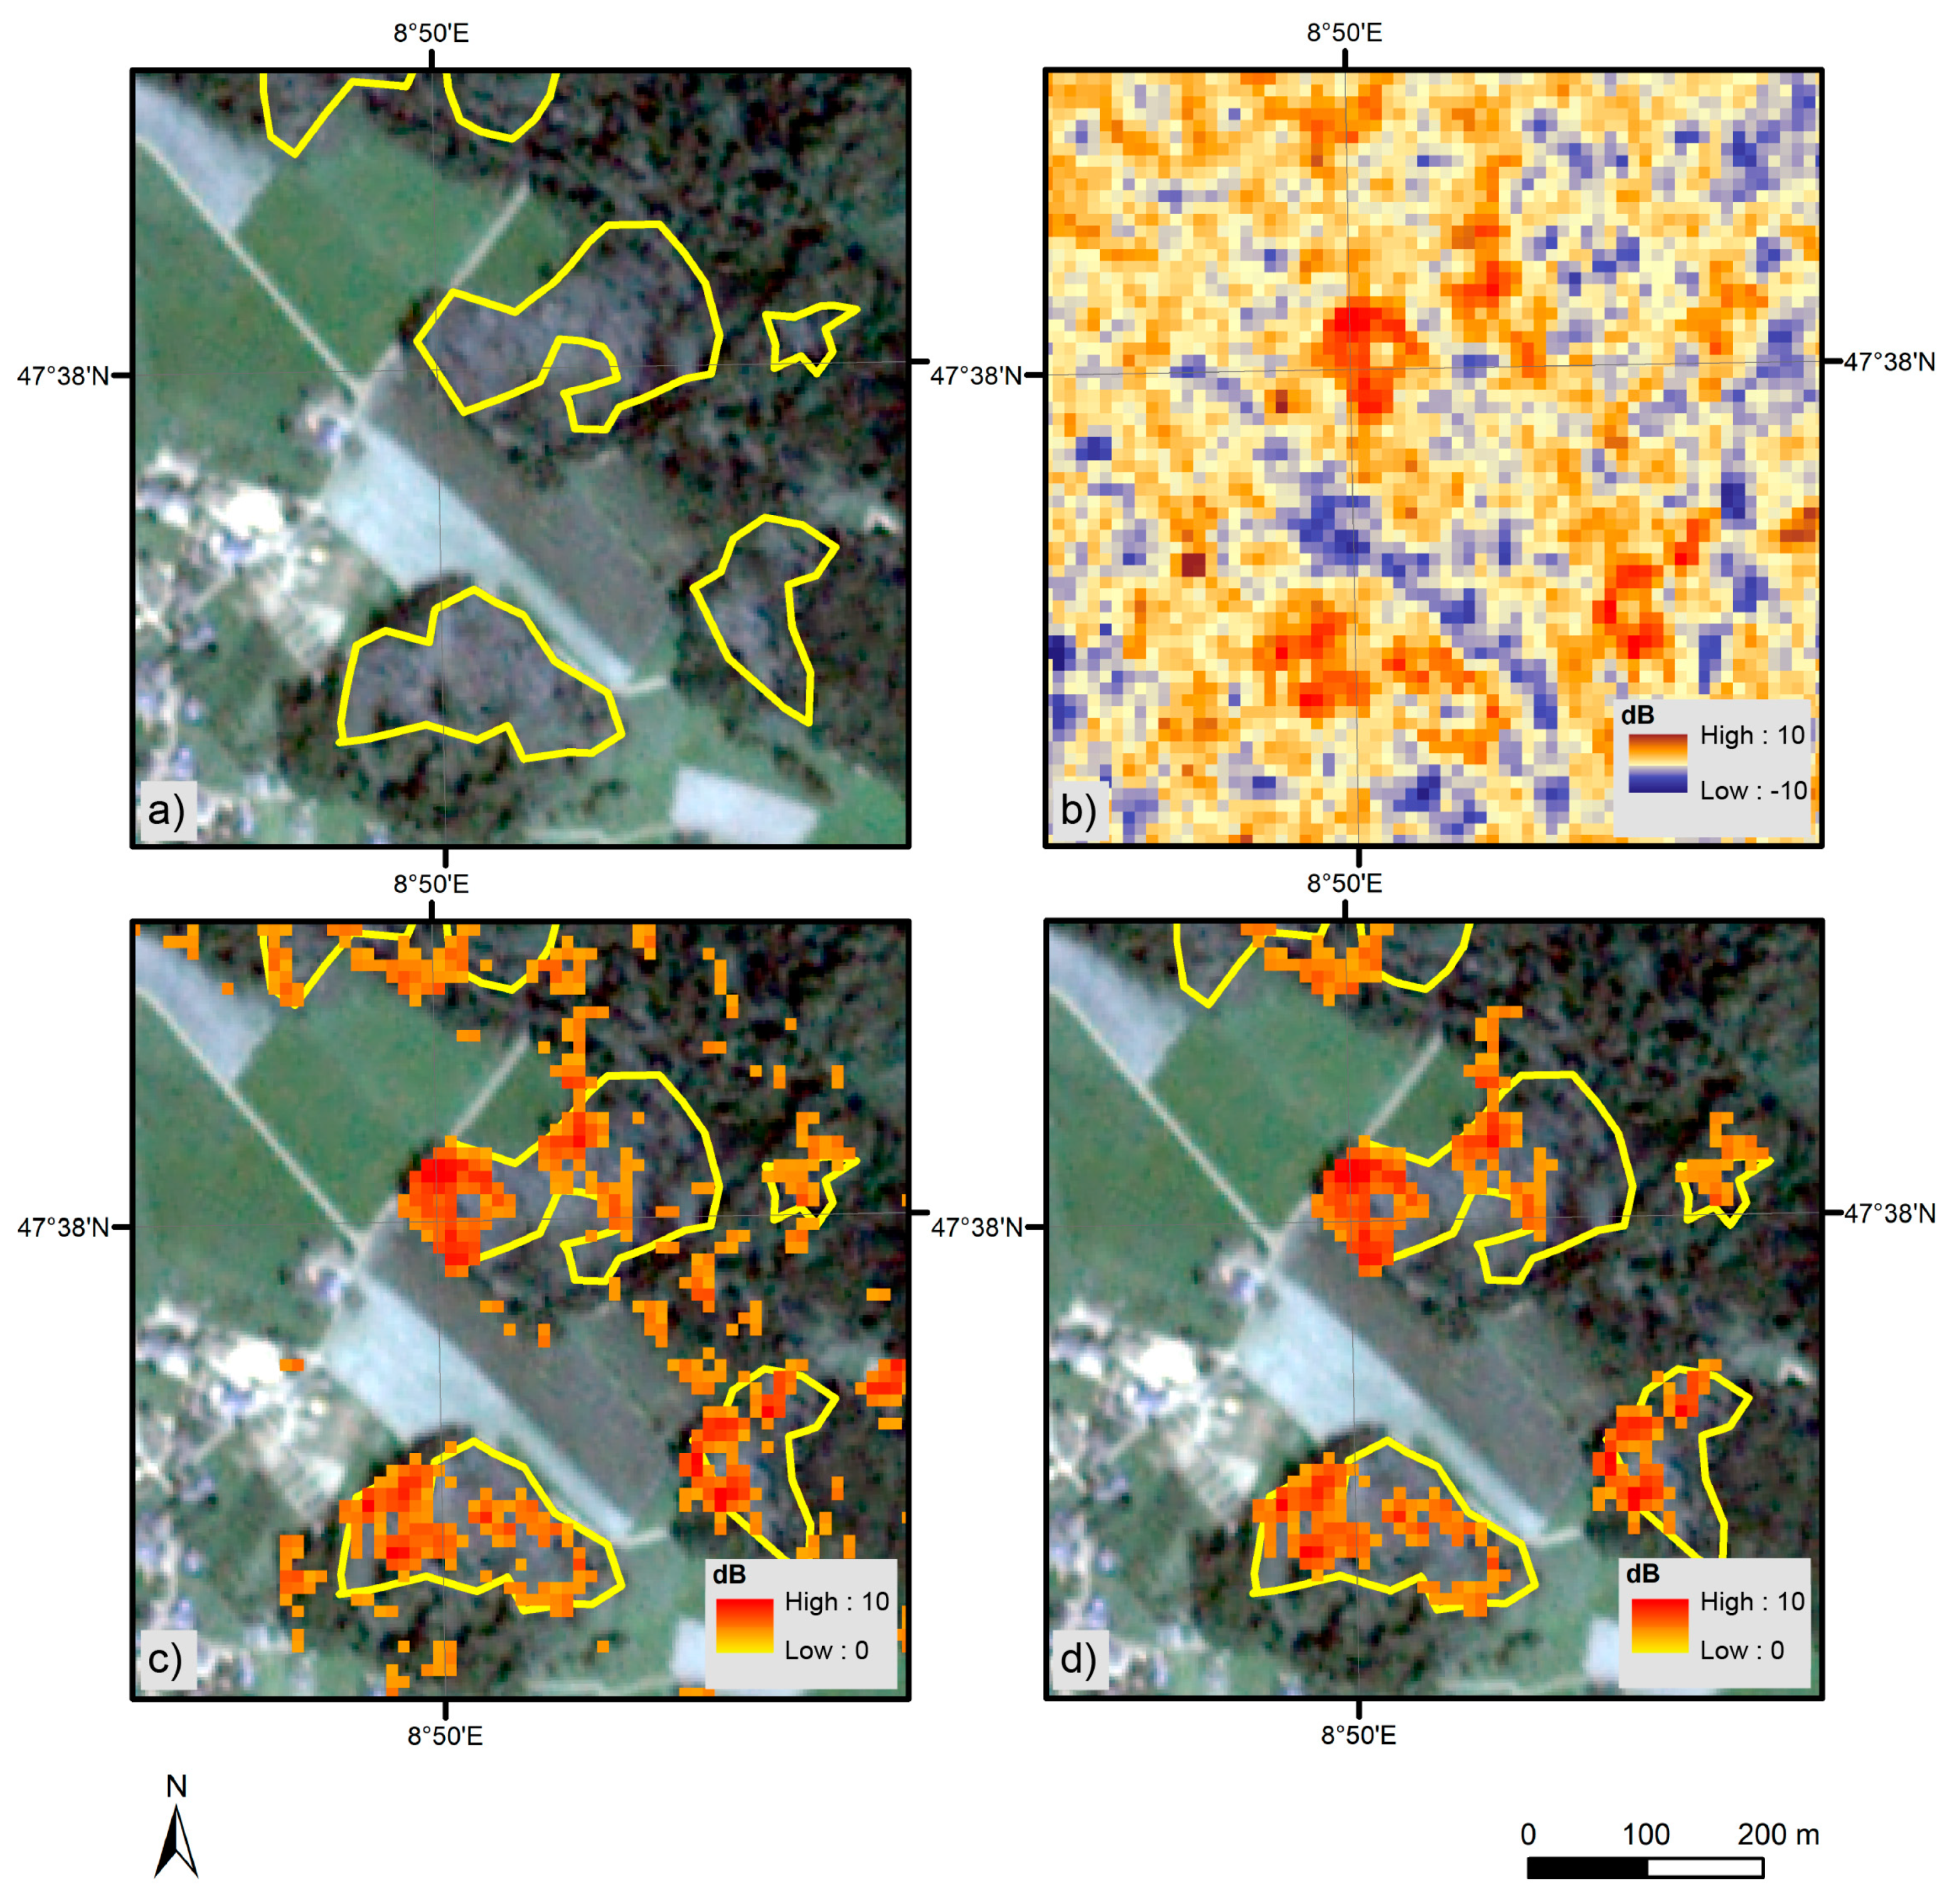
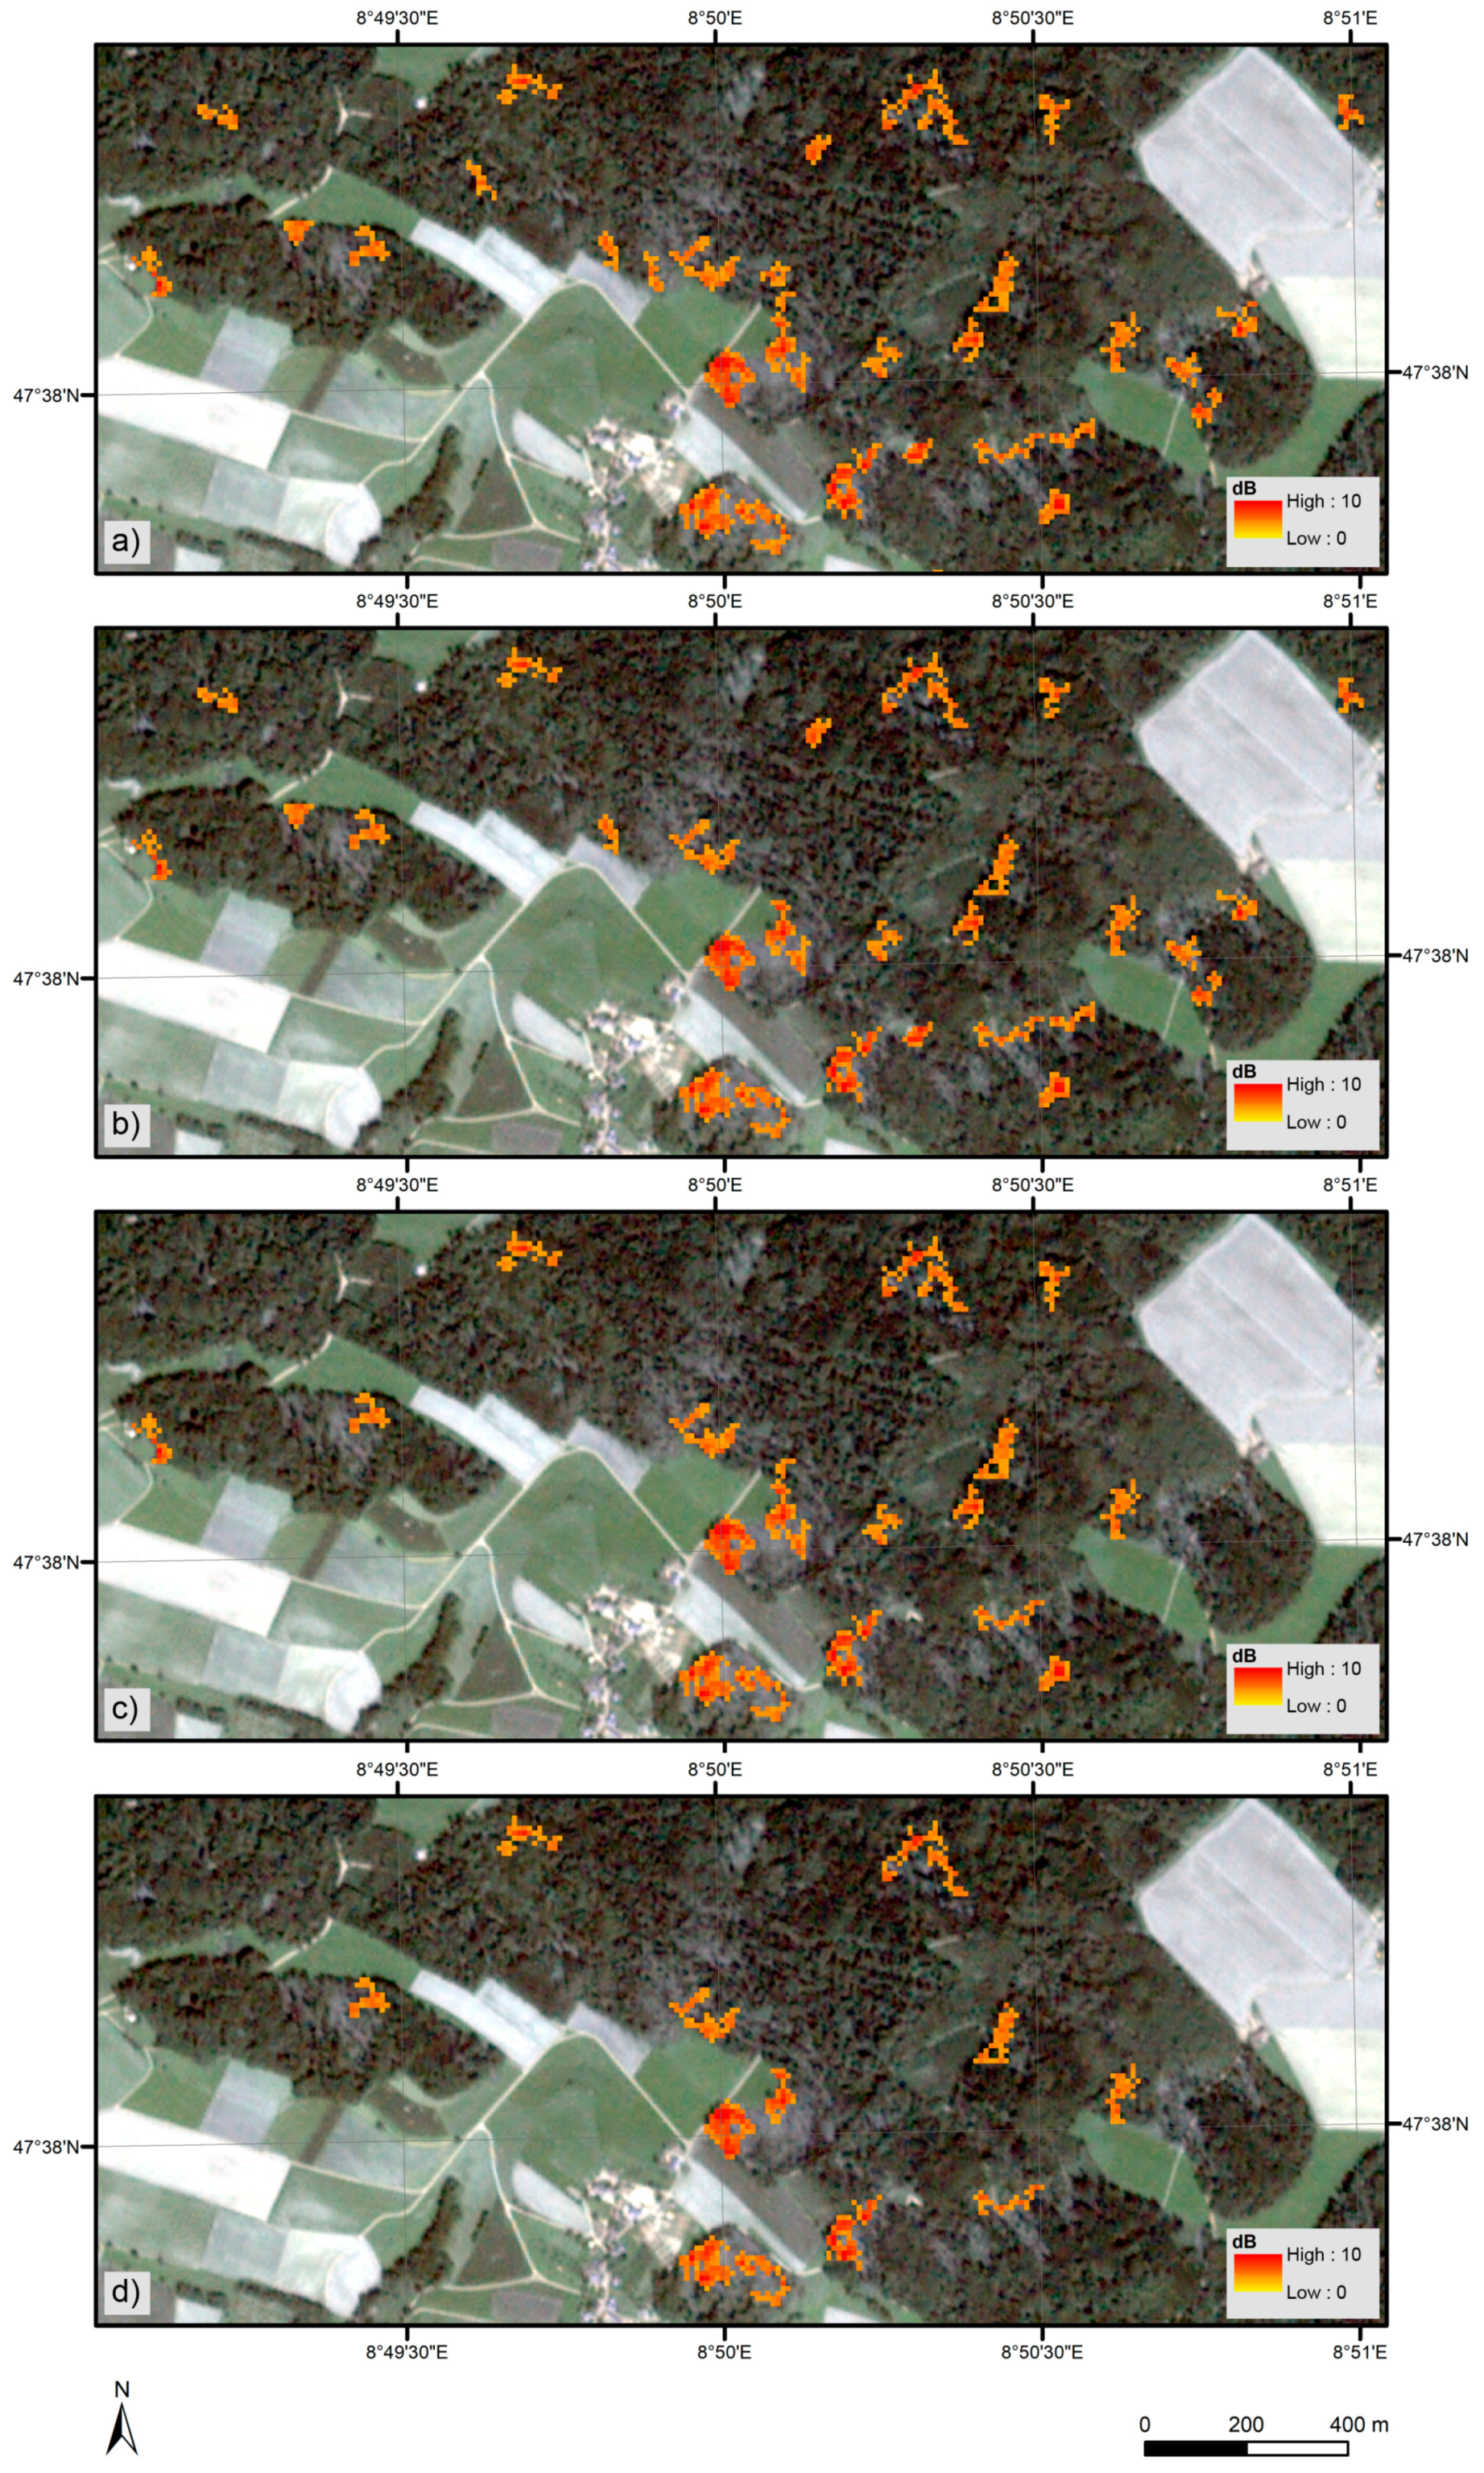
4.2. Windthrow Maps
4.3. Influence of the Number of S-1 Acquisitions
4.4. Comparison with Existing Windthrow Detection Methods
4.5. Practical Use
4.6. Outlook
5. Conclusions
Author Contributions
Funding
Acknowledgments
Conflicts of Interest
Appendix A

| SA | Pre/Post | Date | Copernicus Open Access Hub Identifier | Asc/Des |
|---|---|---|---|---|
| CH | pre | 20 July 2017 | S1B_IW_GRDH_1SDV_20170720T053411_20170720T053436_006567_00B8C9_0638 | des |
| CH | pre | 22 July 2017 | S1A_IW_GRDH_1SDV_20170722T171516_20170722T171541_017587_01D6BC_2029 | asc |
| CH | pre | 26 July 2017 | S1A_IW_GRDH_1SDV_20170726T053445_20170726T053510_017638_01D85F_736D | des |
| CH | pre | 28 July 2017 | S1B_IW_GRDH_1SDV_20170728T171438_20170728T171503_006691_00BC4A_0F41 | asc |
| CH | pre | 1 August 2017 | S1B_IW_GRDH_1SDV_20170801T053411_20170801T053436_006742_00BDCE_523B | des |
| CH | post | 3 August 2017 | S1A_IW_GRDH_1SDV_20170803T171517_20170803T171542_017762_01DC14_352F | asc |
| CH | post | 7 August 2017 | S1A_IW_GRDH_1SDV_20170807T053446_20170807T053511_017813_01DDB3_C117 | des |
| CH | post | 9 August 2017 | S1B_IW_GRDH_1SDV_20170809T171439_20170809T171504_006866_00C15B_856D | asc |
| CH | post | 13 August 2017 | S1B_IW_GRDH_1SDV_20170813T053412_20170813T053437_006917_00C2E7_8219 | des |
| CH | post | 15 August 2017 | S1A_IW_GRDH_1SDV_20170815T171517_20170815T171542_017937_01E169_D0CF | asc |
| CH | post | 19 August 2017 | S1A_IW_GRDH_1SDV_20170819T053446_20170819T053511_017988_01E302_08B5 | des |
| CH | post | 21 August 2017 | S1B_IW_GRDH_1SDV_20170821T171439_20170821T171504_007041_00C672_489A | asc |
| CH | post | 25 August 2017 | S1B_IW_GRDH_1SDV_20170825T053413_20170825T053438_007092_00C7F7_4EAB | des |
| CH | post | 27 August 2017 | S1A_IW_GRDH_1SDV_20170827T171518_20170827T171543_018112_01E6B4_8BA5 | asc |
| CH | post | 31 August 2017 | S1A_IW_GRDH_1SDV_20170831T053447_20170831T053512_018163_01E845_EBD7 | des |
| DE | pre | 25 September 2017 | S1B_IW_GRDH_1SDV_20170925T052421_20170925T052446_007544_00D51A_43AE | des |
| DE | pre | 28 September 2017 | S1B_IW_GRDH_1SDV_20170928T165954_20170928T170019_007595_00D689_FC15 | asc |
| DE | pre | 30 September 2017 | S1B_IW_GRDH_1SDV_20170930T053234_20170930T053259_007617_00D737_E3E3 | des |
| DE | pre | 1 October 2017 | S1A_IW_GRDH_1SDV_20171001T052455_20171001T052520_018615_01F62C_8AAB | des |
| DE | pre | 4 October 2017 | S1A_IW_GRDH_1SDV_20171004T170038_20171004T170103_018666_01F7B5_BA85 | asc |
| DE | post | 6 October 2017 | S1A_IW_GRDH_1SDV_20171006T053308_20171006T053333_018688_01F871_C8DA | des |
| DE | post | 7 October 2017 | S1B_IW_GRDH_1SDV_20171007T052421_20171007T052446_007719_00DA22_3499 | des |
| DE | post | 10 October 2017 | S1B_IW_GRDH_1SDV_20171010T165954_20171010T170019_007770_00DB8C_FCFD | asc |
| DE | post | 12 October 2017 | S1B_IW_GRDH_1SDV_20171012T053234_20171012T053259_007792_00DC33_6B31 | des |
| DE | post | 16 October 2017 | S1A_IW_GRDH_1SDV_20171016T170038_20171016T170103_018841_01FD0D_D8CC | asc |
| DE | post | 18 October 2017 | S1A_IW_GRDH_1SDV_20171018T053308_20171018T053333_018863_01FDCC_6C39 | des |
| DE | post | 19 October 2017 | S1B_IW_GRDH_1SDV_20171019T052421_20171019T052446_007894_00DF19_7084 | des |
| DE | post | 24 October 2017 | S1B_IW_GRDH_1SDV_20171024T053234_20171024T053259_007967_00E134_627A | des |
| DE | post | 25 October 2017 | S1A_IW_GRDH_1SDV_20171025T052455_20171025T052520_018965_0200D3_BC00 | des |
| DE | post | 28 October 2017 | S1A_IW_GRDH_1SDV_20171028T170038_20171028T170103_019016_02025E_D4A5 | asc |
References
- McCarthy, J.K.; Hood, I.A.; Kimberley, M.O.; Didham, R.K.; Bakys, R.; Fleet, K.R.; Brownlie, R.K.; Flint, H.J.; Brockerhoff, E.G. Effects of season and region on sapstain and wood degrade following simulated storm damage in Pinus radiata plantations. For. Ecol. Manag. 2012, 277, 81–89. [Google Scholar] [CrossRef]
- Økland, B.; Berryman, A. Resource dynamic plays a key role in regional fluctuations of the spruce bark beetles Ips typographus. Agric. For. Entomol. 2004, 6, 141–146. [Google Scholar] [CrossRef]
- Havašová, M.; Ferenčík, J.; Jakuš, R. Interactions between windthrow, bark beetles and forest management in the Tatra national parks. For. Ecol. Manage. 2017, 391, 349–361. [Google Scholar] [CrossRef]
- Schwarz, M.; Steinmeier, C.; Holecz, F.; Stebler, O.; Wagner, H. Detection of Windthrow in Mountainous Regions with Different Remote Sensing Data and Classification Methods. Scand. J. For. Res. 2003, 18, 525–536. [Google Scholar] [CrossRef]
- Usbeck, T.; Wohlgemuth, T.; Dobbertin, M.; Pfister, C.; Bürgi, A.; Rebetez, M. Increasing storm damage to forests in Switzerland from 1858 to 2007. Agric. For. Meteorol. 2010, 150, 47–55. [Google Scholar] [CrossRef]
- Seidl, R.; Schelhaas, M.J.; Rammer, W.; Verkerk, P.J. Increasing forest disturbances in Europe and their impact on carbon storage. Nat. Clim. Chang. 2014, 4, 806–810. [Google Scholar] [CrossRef] [PubMed] [Green Version]
- Dyukarev, E.A.; Pologova, N.N.; Golovatskaya, E.A.; Dyukarev, A.G. Forest cover disturbances in the South Taiga of West Siberia. Environ. Res. Lett. 2011, 6. [Google Scholar] [CrossRef]
- Jonikavičius, D.; Mozgeris, G. Rapid assessment of wind storm-caused forest damage using satellite images and stand-wise forest inventory data. iForest 2013, 6, 150–155. [Google Scholar] [CrossRef] [Green Version]
- Baumann, M.; Ozdogan, M.; Wolter, P.T.; Krylov, A.; Vladimirova, N.; Radeloff, V.C. Landsat remote sensing of forest windfall disturbance. Remote Sens. Environ. 2014, 143, 171–179. [Google Scholar] [CrossRef]
- Elatawneh, A.; Wallner, A.; Manakos, I.; Schneider, T.; Knoke, T. Forest cover database updates using multi-seasonal rapideye data-storm event assessment in the Bavarian Forest National Park. Forests 2014, 5, 1284–1303. [Google Scholar] [CrossRef]
- Einzmann, K.; Immitzer, M.; Böck, S.; Bauer, O.; Schmitt, A.; Atzberger, C. Windthrow Detection in European Forests with Very High-Resolution Optical Data. Forests 2017, 8, 21. [Google Scholar] [CrossRef]
- Honkavaara, E.; Litkey, P.; Nurminen, K. Automatic Storm Damage Detection in Forests Using High-Altitude Photogrammetric Imagery. Remote Sens. 2013, 5, 1405–1424. [Google Scholar] [CrossRef]
- Mokroš, M.; Výbošt’ok, J.; Merganič, J.; Hollaus, M.; Barton, I.; Koreň, M.; Tomaštík, J.; Čerňava, J. Early stage forest windthrow estimation based on unmanned aircraft system imagery. Forests 2017, 8, 306. [Google Scholar] [CrossRef]
- Duan, F.; Wan, Y.; Deng, L. A novel approach for coarse-to-fine windthrown tree extraction based on unmanned aerial vehicle images. Remote Sens. 2017, 9, 306. [Google Scholar] [CrossRef]
- Nyström, M.; Holmgren, J.; Fransson, J.E.S.; Olsson, H. Detection of windthrown trees using airborne laser scanning. Int. J. Appl. Earth Obs. Geoinf. 2014, 30, 21–29. [Google Scholar] [CrossRef]
- Polewski, P.; Yao, W.; Heurich, M.; Krzystek, P.; Stilla, U. Learning a constrained conditional random field for enhanced segmentation of fallen trees in ALS point clouds. ISPRS J. Photogramm. Remote Sens. 2018, 140, 33–44. [Google Scholar] [CrossRef]
- Kellndorfer, J.M.; Pierce, L.E.; Dobson, M.C.; Ulaby, F.T. Toward consistent regional-to-global-scale vegetation characterization using orbital SAR systems. IEEE Trans. Geosci. Remote Sens. 1998, 36, 1396–1411. [Google Scholar] [CrossRef]
- Solimini, D. Understanding Earth Observation; Springer International Publishing: Basel, Switzerland, 2016; pp. 1–703. ISBN 978-3-319-25633-7. [Google Scholar]
- Leckie, D.G.; Ranson, K.J. Forestry Applications Using Imaging Radar. In Manual of Remote Sensing: Principles and Applications of Imaging Radar, 3rd ed.; Henderson, F.M., Lewis, A.J., Eds.; John Wiley & Sons, Inc.: New York, NY, USA, 1998; pp. 435–510. ISBN 978-0471294061. [Google Scholar]
- Way, J.; Parist, J.; Kasischke, E.; Slaughter, C.; Viereck, L.; Christensen, N.; Dobson, M.C.; Ulaby, F.; Richards, J.; Milne, A.; et al. The effect of changing environmental conditions on microwave signatures of forest ecosystems: Preliminary results of the March 1988 Alaskan aircraft SAR experiment. Int. J. Remote Sens. 1990, 11, 1119–1144. [Google Scholar] [CrossRef]
- Wegmüller, U.; Holecz, F.; Wan, Y.; Kattenborn, G. Theoretical sensitivity of ERS-1 SAR backscatter over forest. In Proceedings of the International Geoscience and Remote Sensing Symposium (IGARSS), Pasadena, CA, USA, 8–12 August 1994; pp. 2477–2479. [Google Scholar]
- Proisy, C.; Mougin, E.; Dufrêne, E.; Le Dantec, V. Monitoring seasonal changes of a mixed temperate forest using ERS SAR observations. IEEE Trans. Geosci. Remote Sens. 2000, 38, 540–552. [Google Scholar] [CrossRef]
- Sharma, R.; Leckie, D.; Hill, D.; Crooks, B.; Bhogal, A.S.; Arbour, P.; D’eon, S. Hyper-Temporal Radarsat SAR data of a Forested Terrain. In Proceedings of the International Workshop on the Analysis of Multi-Temporal Remote Sensing Images, Biloxi, MA, USA, 16–18 May 2005; pp. 71–75. [Google Scholar]
- Koskinen, J.T.; Pulliainen, J.T.; Hallikainen, M.T. The Use of ERS-1 SAR Data in Snow Melt Monitoring. IEEE Trans. Geosci. Remote Sens. 1997, 35, 601–610. [Google Scholar] [CrossRef]
- Westman, W.E.; Paris, J.F. Detecting forest structure and biomass with C-band multipolarization Radar: Physical model and field tests. Remote Sens. Environ. 1987, 22, 249–269. [Google Scholar] [CrossRef]
- Dobson, M.C.; Ulaby, F.T.; LeToan, T.; Beaudoin, A.; Kasischke, E.S.; Christensen, N. Dependence of radar backscatter on coniferous forest biomass. IEEE Trans. Geosci. Remote Sens. 1992, 30, 412–415. [Google Scholar] [CrossRef]
- Imhoff, M.L. A Theoretical Analysis of the Effect of Forest Structure on Synthetic Aperture Radar Backscatter and the Remote Sensing of Biomass. IEEE Trans. Geosci. Remote Sens. 1995, 33, 341–352. [Google Scholar] [CrossRef]
- Ahern, F.J.; Leckie, D.J.; Drieman, J.A. Seasonal changes in relative C-band backscatter of northern forest cover types. IEEE Trans. Geosci. Remote Sens. 1993, 31, 668–680. [Google Scholar] [CrossRef]
- Rüetschi, M.; Schaepman, M.E.; Small, D. Using multitemporal Sentinel-1 C-band backscatter to monitor phenology and classify deciduous and coniferous forests in northern Switzerland. Remote Sens. 2018, 10, 55. [Google Scholar] [CrossRef]
- Green, R.M. The sensitivity of SAR backscatter to forest windthrow gaps. Int. J. Remote Sens. 1998, 19, 2419–2425. [Google Scholar] [CrossRef]
- Fransson, J.E.S.; Walter, F.; Blennow, K.; Gustavsson, A.; Ulander, L.M.H. Detection of storm-damaged forested areas using airborne CARABAS-II VHF SAR image data. IEEE Trans. Geosci. Remote Sens. 2002, 40, 2170–2175. [Google Scholar] [CrossRef] [Green Version]
- Eriksson, L.E.B.; Fransson, J.E.S.; Soja, M.J.; Santoro, M. Backscatter signatures of wind-thrown forest in satellite SAR images. In Proceedings of the International Geoscience and Remote Sensing Symposium (IGARSS), Munich, Germany, 22–27 July 2012; pp. 6435–6438. [Google Scholar]
- Thiele, A.; Boldt, M.; Hinz, S. Automated detection of storm damage in forest areas by analyzing TerraSAR-X data. In Proceedings of the International Geoscience and Remote Sensing Symposium (IGARSS), Munich, Germany, 22–27 July 2012; pp. 1672–1675. [Google Scholar]
- Ulander, L.M.H.; Smith, G.; Eriksson, L.; Folkesson, K.; Fransson, J.E.S.; Gustavsson, A.; Hallberg, B.; Joyce, S.; Magnusson, M.; Olsson, H.; et al. Mapping of wind-thrown forests in southern Sweden using space- and airborne SAR. In Proceedings of the International Geoscience and Remote Sensing Symposium (IGARSS), Seoul, South Korea, 25–29 July 2005; pp. 3619–3622. [Google Scholar]
- Tanase, M.A.; Aponte, C.; Mermoz, S.; Bouvet, A.; Le Toan, T.; Heurich, M. Detection of windthrows and insect outbreaks by L-band SAR: A case study in the Bavarian Forest National Park. Remote Sens. Environ. 2018, 209, 700–711. [Google Scholar] [CrossRef]
- Torres, R.; Snoeij, P.; Geudtner, D.; Bibby, D.; Davidson, M.; Attema, E.; Potin, P.; Rommen, B.Ö.; Floury, N.; Brown, M.; et al. GMES Sentinel-1 mission. Remote Sens. Environ. 2012, 120, 9–24. [Google Scholar] [CrossRef]
- Swiss Severe Weather Database 20170802 01 Downburst Nordschweiz. Available online: http://www. sturmarchiv.ch/index.php?title=20170802_01_Downburst_Nordschweiz (accessed on 3 November 2018).
- German Weather Service Sturmtief XAVIER zieht am 5. Oktober 2017 mit Orkanböen über Deutschland. Available online: https://www.dwd.de/DE/leistungen/besondereereignisse/stuerme/20171009_sturmtief _xavier_deutschland.pdf?__blob=publicationFile&v=4 (accessed on 3 November 2018).
- Schubert, A.; Miranda, N.; Geudtner, D.; Small, D. Sentinel-1A/B Combined Product Geolocation Accuracy. Remote Sens. 2017, 9, 607. [Google Scholar] [CrossRef]
- Federal Office of Topography Swisstopo swissALTI3D. Available online: https://www.swisstopo.admin. ch/content/swisstopo-internet/de/home/products/height/alti3d/_jcr_content/contentPar/tabs/items/dokmente/tabPar/downloadlist/downloadItems/846_1464690554132.download/swissALTI3D_detaillierteProduktinfo_201802_DE.pdf (accessed on 12 October 2018).
- Copernicus EU-DEM v1.1. Available online: https://land.copernicus.eu/pan-european/satellite-derived- products/eu-dem/eu-dem-v1.1/view (accessed on 2 November 2018).
- Planet. Planet Imagery Product Specifications. Available online: https://www.planet.com/products/ satellite-imagery/files/Planet_Combined_Imagery_Product_Specs_December2017.pdf (accessed on 3 November 2018).
- GDAL Geospatial Data Abstraction Library. Available online: http://www.gdal.org (accessed on 7 October 2018).
- Ginzler, C.; Hobi, M.L. Countrywide stereo-image matching for updating digital surface models in the framework of the swiss national forest inventory. Remote Sens. 2015, 7, 4343–4370. [Google Scholar] [CrossRef]
- Small, D. Flattening Gamma: Radiometric terrain correction for SAR imagery. IEEE Trans. Geosci. Remote Sens. 2011, 49, 3081–3093. [Google Scholar] [CrossRef]
- Small, D. SAR backscatter multitemporal compositing via local resolution weighting. In Proceedings of the International Geoscience and Remote Sensing Symposium (IGARSS), Munich, Germany, 22–27 July 2012; pp. 4521–4524. [Google Scholar] [CrossRef]
- Lu, D.; Mausel, P.; Brondízio, E.; Moran, E. Change detection techniques. Int. J. Remote Sens. 2003, 25, 2365–2401. [Google Scholar] [CrossRef]
- Tewkesbury, A.P.; Comber, A.J.; Tate, N.J.; Lamb, A.; Fisher, P.F. A critical synthesis of remotely sensed optical image change detection techniques. Remote Sens. Environ. 2015, 160, 1–14. [Google Scholar] [CrossRef] [Green Version]
- Waser, L.T.; Fischer, C.; Wang, Z.; Ginzler, C. Wall-to-wall forest mapping based on digital surface models from image-based point clouds and a NFI forest definition. Forests 2015, 6, 4510–4528. [Google Scholar] [CrossRef]
- ESA Revisit and Coverage. Available online: https://sentinel.esa.int/web/sentinel/user-guides/sentinel-1- sar/revisit-and-coverage (accessed on 14 October 2018).
- Dabboor, M.; Iris, S.; Singhroy, V. The RADARSAT Constellation Mission in Support of Environmental Applications. Proceedings 2018, 2, 323. [Google Scholar] [CrossRef]

| ex (ha) | n |
|---|---|
| 0.51–1 | 12 |
| 1–1.5 | 4 |
| 1.5–2 | 2 |
| 2–2.5 | 5 |
| 2.5–3 | 2 |
| 3–3.07 | 1 |
| All | 26 |
| ‘Single Windthrown Trees’ | ‘Single Standing Trees’ | ‘Areal Windthrow’ | All | |||
|---|---|---|---|---|---|---|
| ex (ha) | n | ex (ha) | n | ex (ha) | n | n |
| 0.5–1 | 117 | 0.54–1 | 13 | 0.51–1 | 4 | 134 |
| 1–1.5 | 46 | 1–1.32 | 4 | 1–1.5 | 1 | 51 |
| 1.5–2 | 18 | 1.5–2 | 0 | 1.5–2 | 1 | 19 |
| 2–2.5 | 11 | 2–2.5 | 0 | 2–2.5 | 1 | 12 |
| 2.5–3 | 8 | 2.5–3 | 0 | 2.5–3 | 0 | 8 |
| 3–13.49 | 25 | 3–3.5 | 0 | 3–3.37 | 1 | 26 |
| All | 225 | All | 17 | All | 8 | 250 |
| Polarisation | Within Whole Forest Mask | Within Windthrow Reference Mask | ||||
|---|---|---|---|---|---|---|
| n | mn (dB) | sd (dB) | n | mn (dB) | sd (dB) | |
| VV | 80354 | 0.05 | 1.58 | 4101 | 0.5 | 1.78 |
| VH | 0.31 | 1.6 | 0.97 | 1.81 | ||
| ‘Areal Windthrow’ | ‘Single Standing Trees’ | ‘Single Windthrown Trees’ | |||||||||
|---|---|---|---|---|---|---|---|---|---|---|---|
| Reference | Product | Reference | Product | Reference | Product | ||||||
| w | nw | PA | w | nw | PA | w | nw | PA | |||
| w | 7 | 1 | 0.88 | w | 5 | 12 | 0.29 | w | 16 | 209 | 0.07 |
| nw | 26 | - | nw | 28 | - | nw | 17 | - | |||
| UA | 0.21 | UA | 0.15 | UA | 0.48 | ||||||
| Remote Sensing System | Latency | Cost | Areal Coverage | Examples |
|---|---|---|---|---|
| Airborne optical | short-long * | high | small | [12,13,14] |
| Airborne ALS | short-long * | high | small | [15,16] |
| Airborne SAR | short-long * | high | small | [30,31] |
| Spaceborne optical | short-long * | low-medium ** | large | [7,8,9,10,11] |
| Spaceborne exact repeat track SAR | medium | low-medium ** | large | [32,33,34,35] |
| Spaceborne LRW SAR (multi-track) | short | low-medium ** | large | - |
© 2019 by the authors. Licensee MDPI, Basel, Switzerland. This article is an open access article distributed under the terms and conditions of the Creative Commons Attribution (CC BY) license (http://creativecommons.org/licenses/by/4.0/).
Share and Cite
Rüetschi, M.; Small, D.; Waser, L.T. Rapid Detection of Windthrows Using Sentinel-1 C-Band SAR Data. Remote Sens. 2019, 11, 115. https://doi.org/10.3390/rs11020115
Rüetschi M, Small D, Waser LT. Rapid Detection of Windthrows Using Sentinel-1 C-Band SAR Data. Remote Sensing. 2019; 11(2):115. https://doi.org/10.3390/rs11020115
Chicago/Turabian StyleRüetschi, Marius, David Small, and Lars T. Waser. 2019. "Rapid Detection of Windthrows Using Sentinel-1 C-Band SAR Data" Remote Sensing 11, no. 2: 115. https://doi.org/10.3390/rs11020115
APA StyleRüetschi, M., Small, D., & Waser, L. T. (2019). Rapid Detection of Windthrows Using Sentinel-1 C-Band SAR Data. Remote Sensing, 11(2), 115. https://doi.org/10.3390/rs11020115