Article

2D Image-To-3D Model: Knowledge-Based 3D Building Reconstruction (3DBR) Using Single Aerial Images and Convolutional Neural Networks (CNNs)

1
School of Surveying and Geospatial Engineering, College of Engineering, University of Tehran, Tehran 1439957131, Iran
2
Chair for Computer Aided Medical Procedures & Augmented Reality, Faculty of Computer Science, Technical University of Munich, Boltzmannstr. 3, 85748 Garching b. Munich, Germany
3
Google Inc., 8002 Zurich, Switzerland
*
Author to whom correspondence should be addressed.
Remote Sens. 2019, 11(19), 2219; https://doi.org/10.3390/rs11192219
Submission received: 22 July 2019 / Revised: 7 September 2019 / Accepted: 13 September 2019 / Published: 23 September 2019
(This article belongs to the Section Urban Remote Sensing)

Abstract

:
In this study, a deep learning (DL)-based approach is proposed for the detection and reconstruction of buildings from a single aerial image. The pre-required knowledge to reconstruct the 3D shapes of buildings, including the height data as well as the linear elements of individual roofs, is derived from the RGB image using an optimized multi-scale convolutional–deconvolutional network (MSCDN). The proposed network is composed of two feature extraction levels to first predict the coarse features, and then automatically refine them. The predicted features include the normalized digital surface models (nDSMs) and linear elements of roofs in three classes of eave, ridge, and hip lines. Then, the prismatic models of buildings are generated by analyzing the eave lines. The parametric models of individual roofs are also reconstructed using the predicted ridge and hip lines. The experiments show that, even in the presence of noises in height values, the proposed method performs well on 3D reconstruction of buildings with different shapes and complexities. The average root mean square error (RMSE) and normalized median absolute deviation (NMAD) metrics are about 3.43 m and 1.13 m, respectively for the predicted nDSM. Moreover, the quality of the extracted linear elements is about 91.31% and 83.69% for the Potsdam and Zeebrugge test data, respectively. Unlike the state-of-the-art methods, the proposed approach does not need any additional or auxiliary data and employs a single image to reconstruct the 3D models of buildings with the competitive precision of about 1.2 m and 0.8 m for the horizontal and vertical RMSEs over the Potsdam data and about 3.9 m and 2.4 m over the Zeebrugge test data.

1. Introduction

Due to the significant advances in remote sensing technologies, the interest in the development of automatic and robust approaches to extract accurate and up-to-date 3D geo-information of land covers from remotely sensed data is rapidly increasing. Buildings are the most prominent objects in urban scenes, thus the measuring and analyzing of 3D shapes and positions of buildings is essential for many applications such as land management, climate change monitoring, disaster management, ecological studies, urbanization and monitoring, and resource management. However, because of the spatial and spectral variety and complexity of buildings, including shape, size, material, color, texture, structure, interference of building shadows, occluded areas by trees, as well as uncompleted and inaccurate data in urban areas, the 3D reconstruction of buildings still faces many challenges.
There is extensive literature on 3D building reconstruction, which can be categorized according to the concept of levels of details (LoDs), defined by the city geography markup language (CityGML) standard [1]. In this paper, the literature review focuses on the recent studies on 3D building reconstruction (3DBR) at the first and second LoDs (LoD1 and LoD2). As a general categorization, current methodologies and algorithms for 3DBR can be divided into three basic methods: data-driven, model-driven, and hybrid methods. The differences between the data-driven and model-driven methods have been discussed in previous studies [2,3]. In data-driven methods, corresponding points of roof planes are extracted using point- or image-based segmentation techniques, and the 3D shapes of roofs are reconstructed by merging different roof planes. Thanks to airborne light detection and ranging (LiDAR) technologies, which deliver high-resolution point cloud data over urban areas, most of the previous approaches on 3DBR are data-driven methods. These approaches use the combination of the LiDAR-based point cloud and remote sensing images, and the reconstruction can be performed semi-automatically or even automatically [4,5]. However, the 3D model generated by data-driven methods suffers from noisy, uncompleted, or low-density and low-resolution point cloud. Wang et al. [6] used the random sample consensus (RANSAC) algorithm to extract the roof planes from a very dense LiDAR data with a low level of noises. They also proposed a splitting–merging methodology based on applying different empirical thresholds to the points to merge different vertical and horizontal roof planes. If digital surface models (DSMs) are employed instead of point-based data, various image-based segmentation techniques can be employed to extract the building footprints from DSMs. As a novel segmentation technique, Yan et al. [7] proposed a hierarchical framework based on the active contour models and occlusions of random texture for segmentation (ORTSEG) [8] to derive the footprint of buildings from a DSM. To detect the points of facades and reconstruct the exact shapes of roofs, they used a least-squared optimization technique, which is only applicable for an oblique DSM. Awrangjeb et al. [9] developed a method in which the footprints’ points are first extracted by a thresholding-based segmentation. Then, the Euclidean distances between roof planes and a roof topology graph are calculated to partition the footprints into roofs’ planes. However, their segmentation method depends on several well-defined threshold values and works on only flat areas.
On the other hand, in the model-driven approaches, the primitives of buildings are extracted, and the most appropriate models are fitted to the buildings’ points. In past studies on model-driven reconstruction, the LiDAR-based point cloud has been mostly utilized to generate 3D models semi-automatically [10,11]. However, the types of final models generated by the model-driven approaches are limited to the primitives in the library. Huang et al. [11] proposed a new representation method for roofs’ planes based on a library of roof primitives. They also defined a rule-based search strategy to fit the primitive models to the point cloud. Zhang et al. [12] developed an algorithm, in which the roof segments are extracted using the RANSAC algorithm from the LiDAR point cloud and aerial ortho-photos. Then, a library of five common roof primitives is considered to generate 3D models of roofs by minimizing the distance between the reconstructed models and point cloud. Zheng et al. [13] proposed a binary decision tree classification to detect different types of roofs from the LiDAR-DSM. To generate the 3D model of roofs, they also calculated the main parameters of roofs such as length, width, and the orientation based on the detected points. Moreover, it is possible to integrate the benefits of both data- and model-driven approaches and propose a hybrid method to improve the accuracy and quality of 3DBR. Zhang et al. [14] proposed a multiple-stage approach for LoD2 reconstruction using very high-resolution ortho-photos, normalized DSMs (nDSMs) as well as building footprints. They used Canny-based line segmentation to divide building footprints into main plane-based partitions as well as a rule-based technique to classify different types of roofs based on the slope and orientation values of the planes. Also, the ridge lines of roofs are extracted using a watershed analysis algorithm.
With the emergence of deep learning methods within the recent years and their massive influence on the remote sensing domain, the problem of building extraction and DSM prediction from single images has been addressed as well by many researchers. Recently, convolution neural networks (CNNs), as an important branch of the deep learning family, have been fast emerged as the leading machine learning methodology for 3D reconstruction using monocular images. Compared to those traditional methods applied to 3D reconstruction, CNNs are able to learn a high level of representation automatically without any manual interventions to project a single image to the desired outputs such as building footprints or nDSMs. Prior studies have investigated the CNN-based image segmentation methods for building footprint extraction and CNN-based regression methods for nDSM estimation from a single aerial/satellite ortho-photo. Kaiser et al. [15] employed the fully convolutional networks (FCNs) including skip connection layers to classify the buildings and roads in aerial images. Persello and Stein [16] developed an FCN, in which novel convolutional layers including dilated kernels were used for binary segmentation of satellite images which resulted in two building and non-building segments. Wen et al. [17] modified the mask region CNN to extract the oriented bounding boxes of buildings. Srivastava et al. [18] proposed a pyramidal encoder–decoder CNN for both building extraction and DSM prediction to jointly estimate height and semantically label monocular aerial images. Their convolutional neural network (CNN) architecture had two losses: One in performing the semantic labeling, and another in predicting the nDSM from the pixel values. To predict DSMs from ortho-photos, Ghamisi and Yokoya [19] utilized conditional generative adversarial nets (cGANs) whose architecture was based on an encoder–decoder network including skip connection layers and penalizing structures at the scale of image patches. Mou and Zhu [20] trained a fully convolutional–deconvolutional network based on residual learning to model the ambiguous mapping between monocular remote sensing images and height maps. Recently, Amini and Arefi [21] proposed a Residual-based CNN (ResNet) to predict nDSM from aerial ortho-photos. Their network included an up-sampling technique based on interleaving feature maps, yielding an output of roughly half the input resolution. Regarding the building reconstruction, Bittner et al. [22] developed a conditional generative adversarial network (cGAN) based on the U-Net to generate high-resolution LoD2-like DSM from a low-resolution DSM. They showed that cGAN could achieve better performance using a least-square loss function.
According to the studies mentioned above, LiDAR data and aerial images are two widely used data sources for 3DBR. Unlike images, high-resolution point cloud data generated by LiDAR, photogrammetry, or SAR technologies are not available everywhere and generation of updated DSMs needs a considerable amount of effort, time, and cost, especially for urban areas. To address these issues, a knowledge-based 3DBR approach is proposed in this paper by exploiting CNNs to extract high-level information from a single image. This valuable knowledge includes the location of buildings, the linear elements of building roofs, such as eave, ridge, and hip lines as well as the heights (e.g., nDSMs) of buildings, which are essential for 3DBR and reduce the complexity of reconstruction. To this end, an automatic framework is proposed including the detection and extraction of buildings’ outlines and roofs’ linear elements simultaneously, as well as nDSM estimation and 3D reconstruction from a single aerial image. The contributions of the current study are as follows:
  • It proposes a novel procedure to extract latent and inherent information from a single 2D image contributing to understanding and interpreting the 3D scenes;
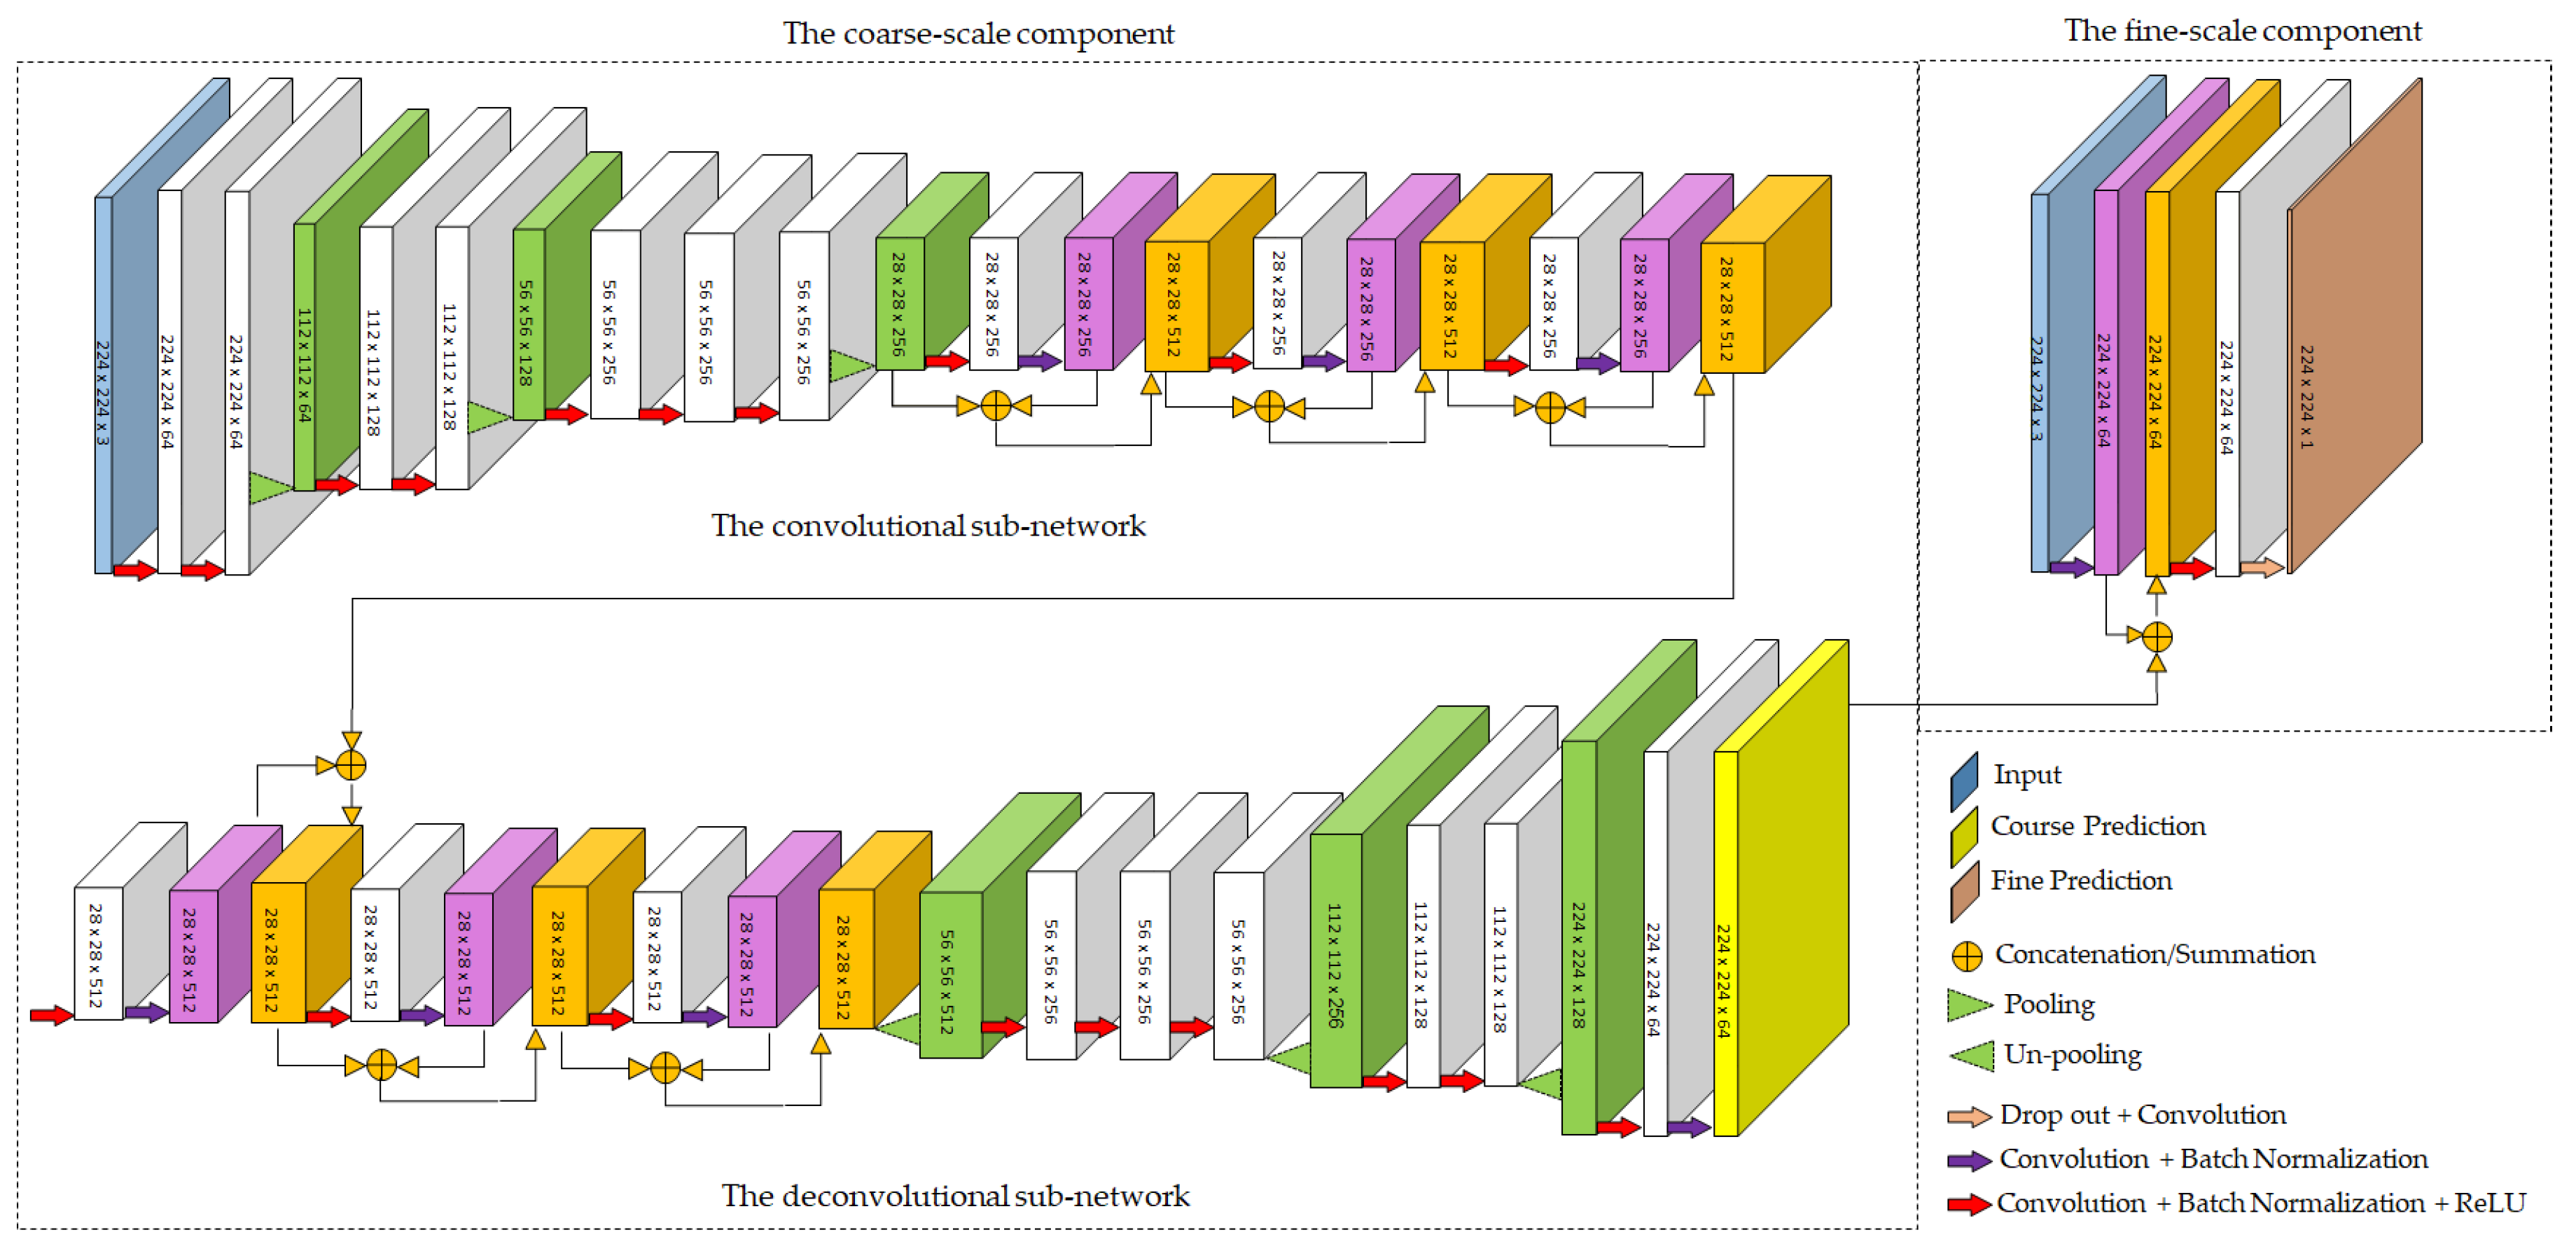
  • An optimized multi-scale convolutional–deconvolutional network (MSCDN) is designed for height prediction as well as extraction of the linear elements of roofs from single aerial images;
  • The building detection, building boundary extraction, and segmentation of roofs can be performed simultaneously using one network, trained by a manually generated training dataset;
  • In the proposed framework, the prismatic and parametric models of the individual buildings are reconstructed from a single aerial image without the need for any additional data;
  • A training dataset (https://github.com/loosgagnet/Roofline-Extraction) including linear elements of different roofs is created manually, which can be used for different applications such as 3D city modeling and CAD models.

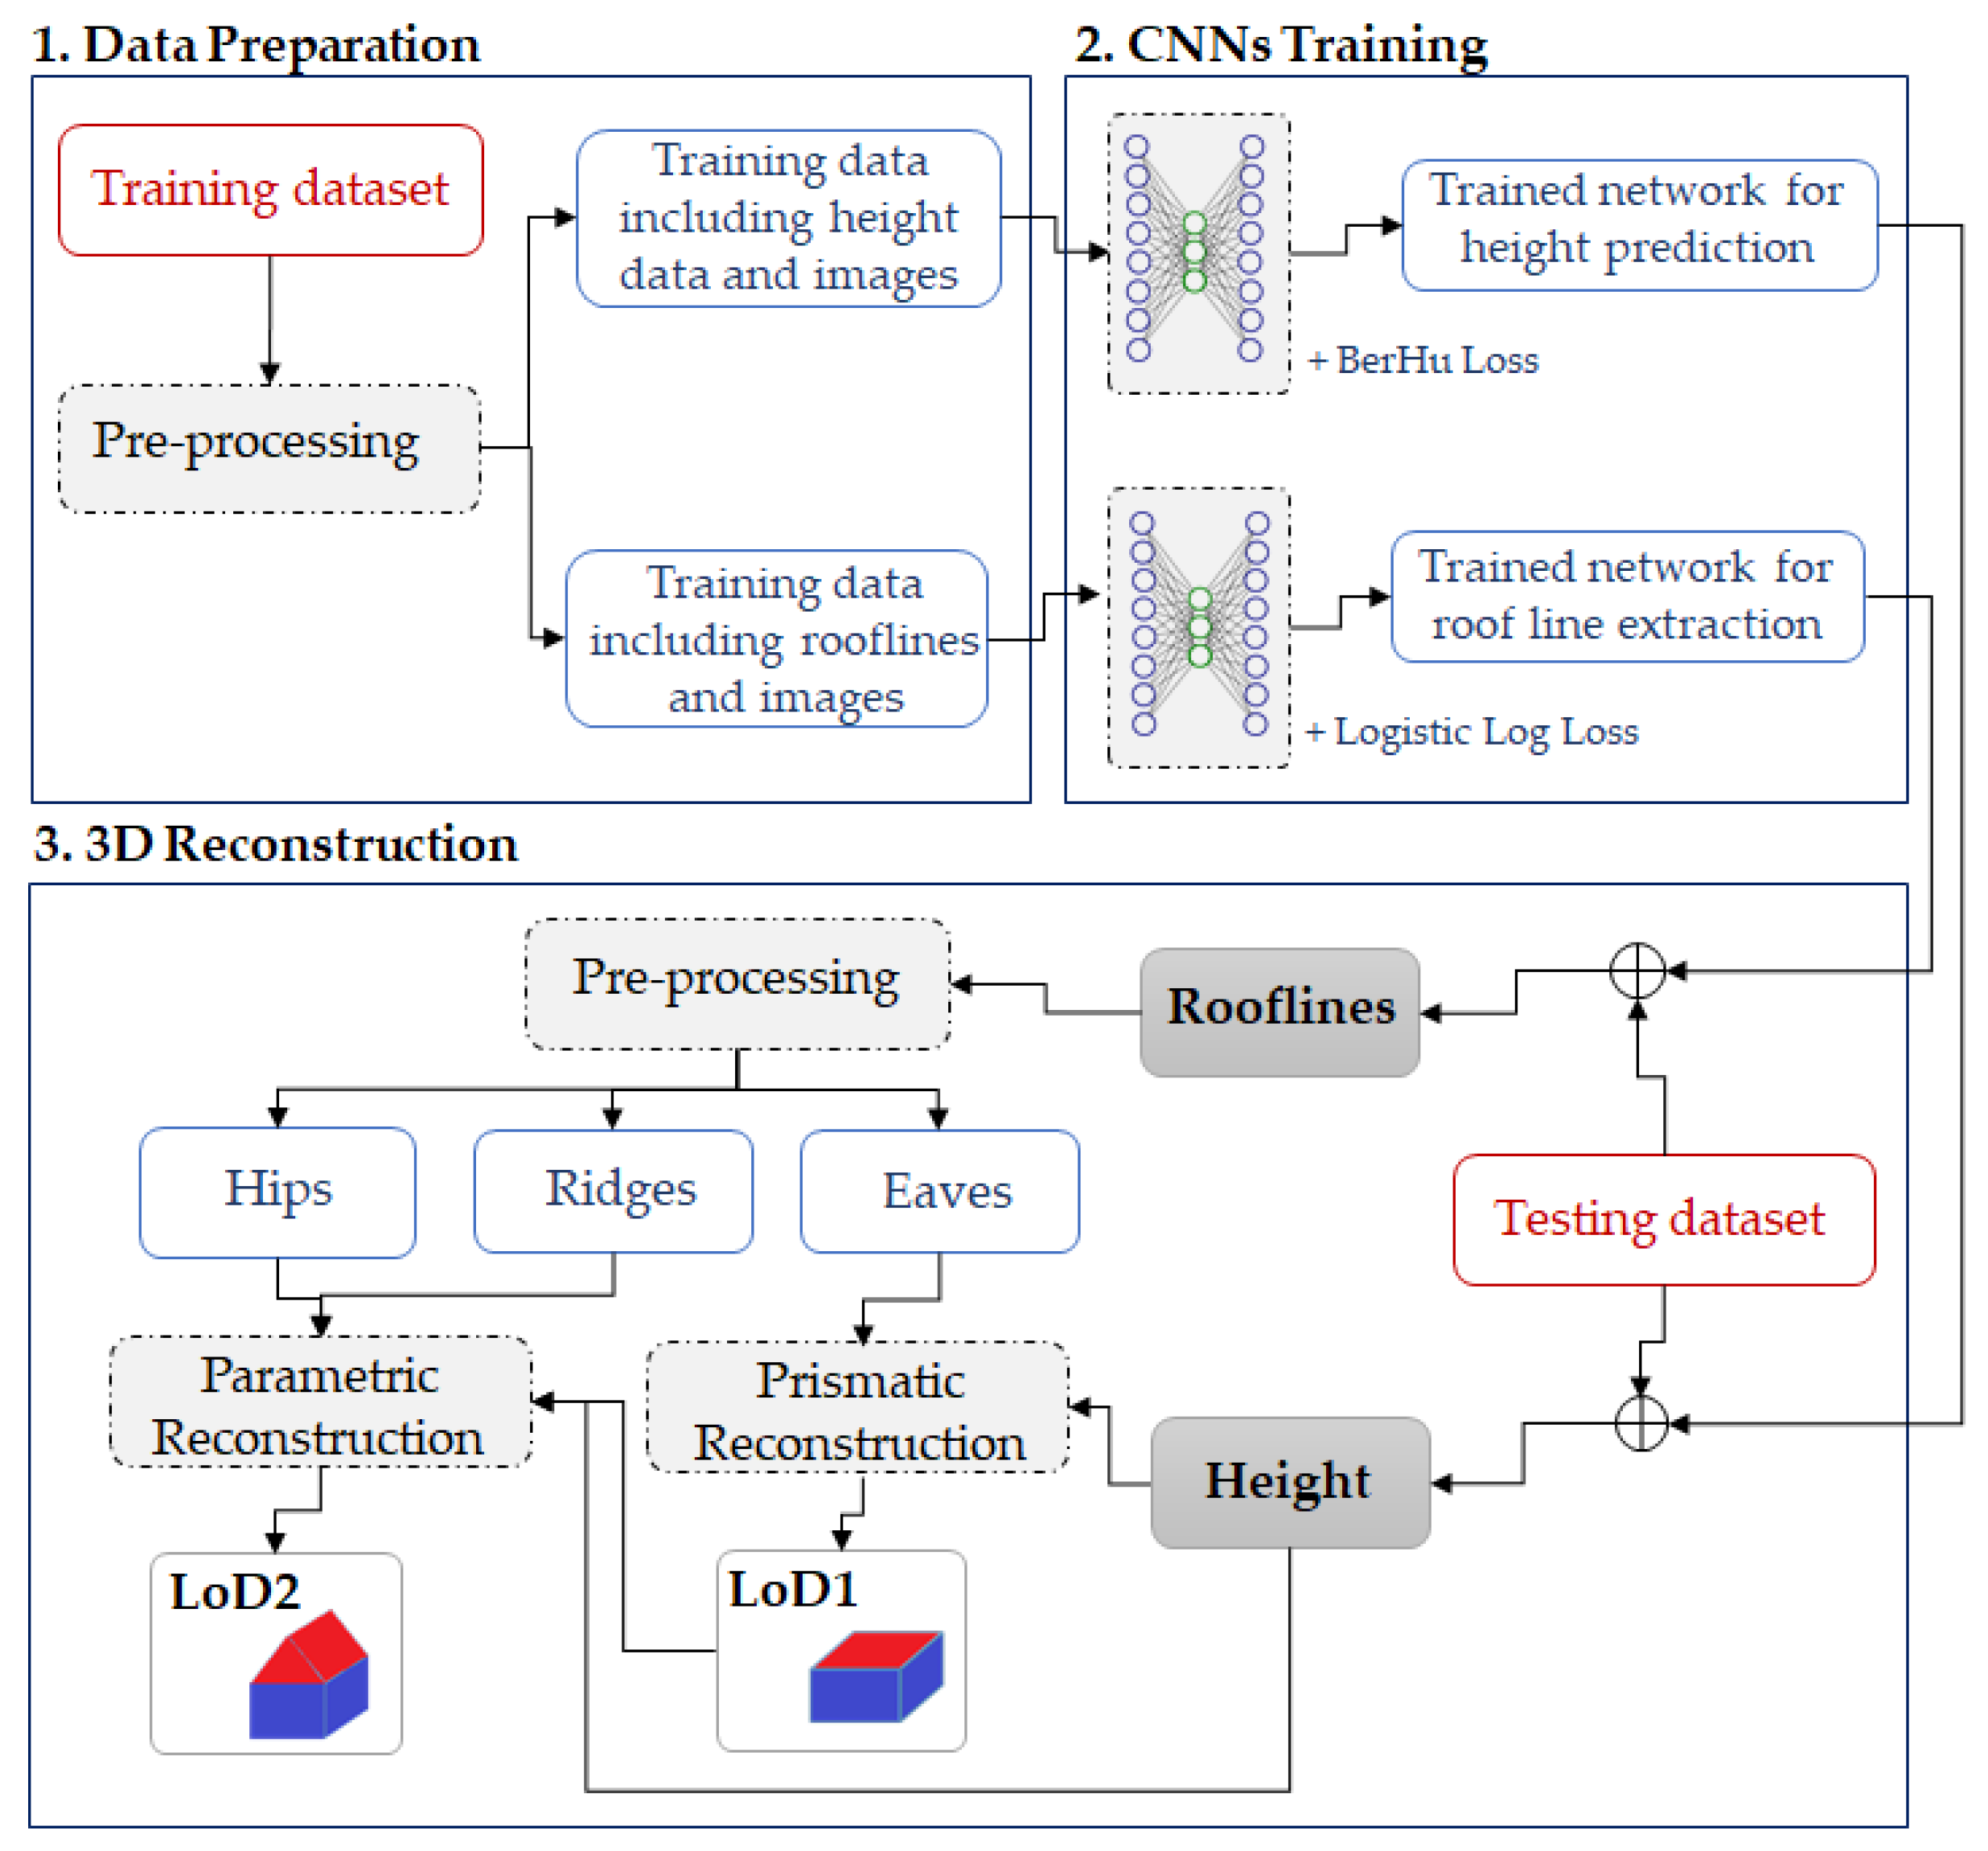
2. Materials and Methods

In this paper, a sequential framework is proposed for knowledge-based 3DBR using supervised CNNs as shown in Figure 1. The main steps include data preparation, CNNs training, and 3D reconstruction. First, two different training datasets are generated for height prediction and linear element extraction tasks, respectively. The absolute height values of urban objects are extracted from nDSMs. Next, an optimized multi-scale convolutional–deconvolutional network (MSCDN) is designed and trained for both training datasets. Next, the height and linear elements of roofs are predicted by applying the trained MSCDNs to the test dataset. Finally, the 3D models of buildings in the test area are reconstructed based on the LoD1 and LoD2 using the predicted information. In the proposed framework, single aerial RGB images are the only inputs of the networks. The summary of each step and their main components are given in the following sub-sections.

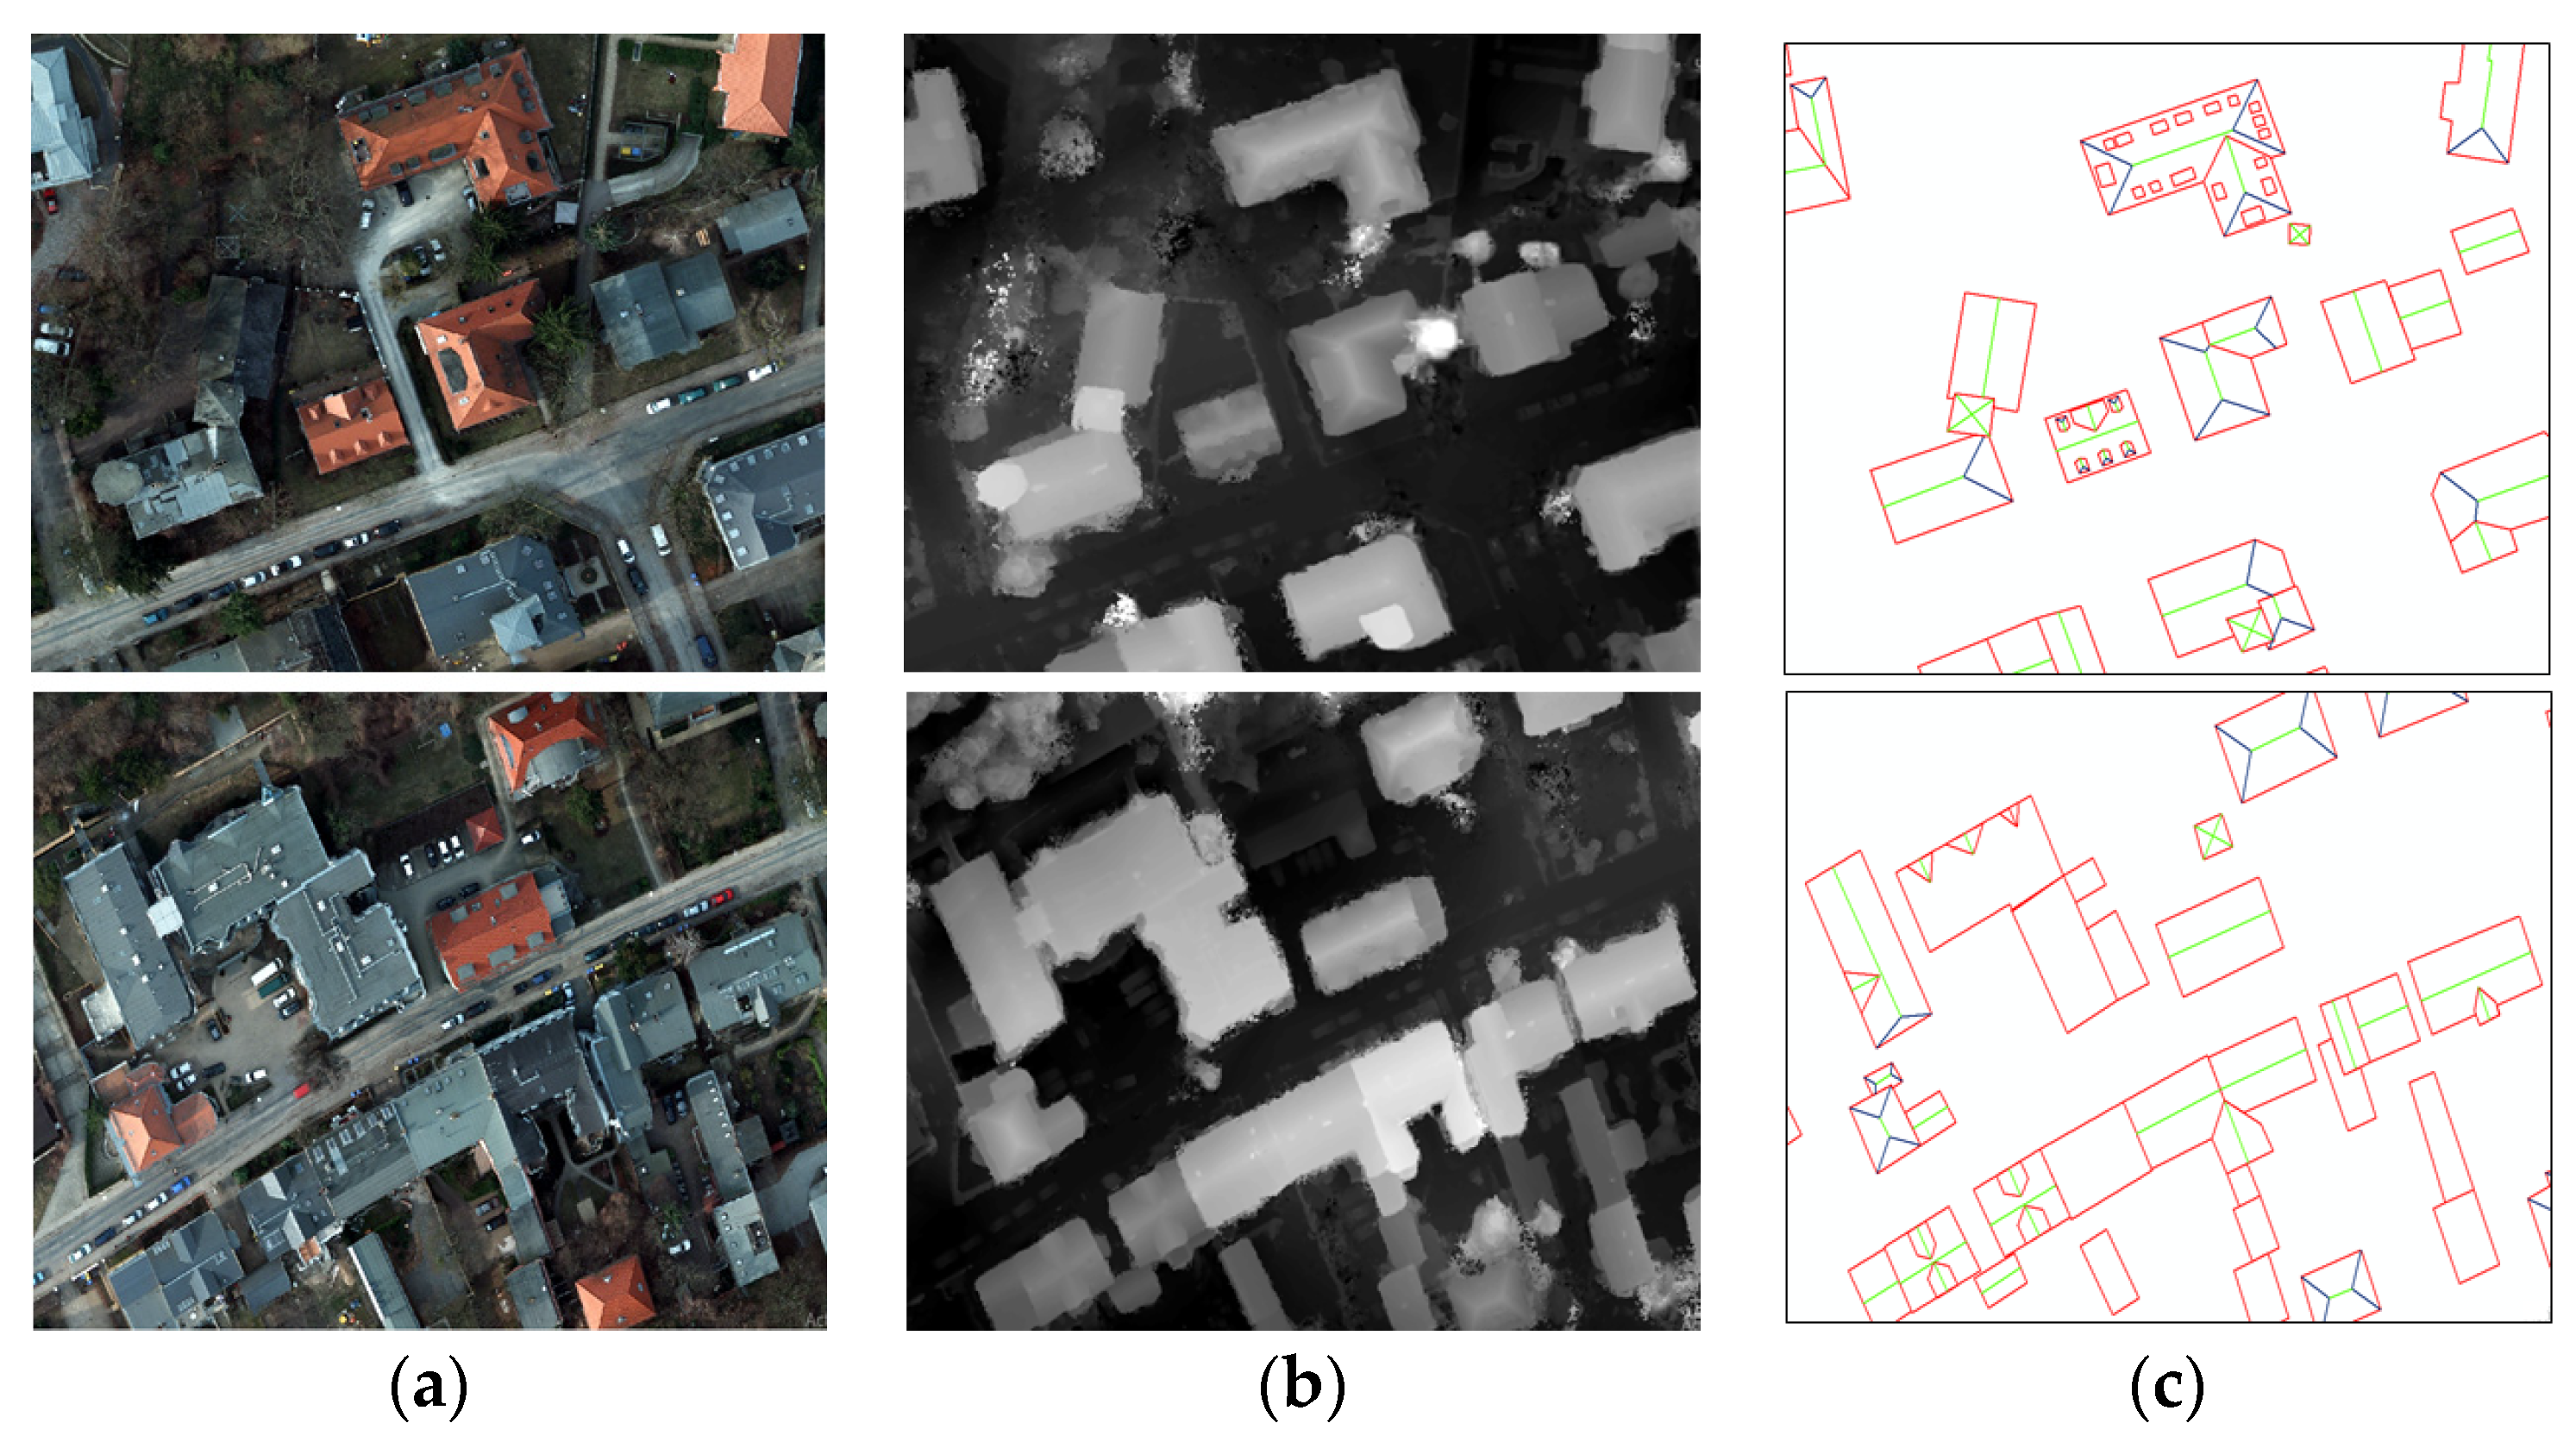
2.1. Data Preparation

In this study, the training area includes aerial ortho-photos and corresponding DSMs. To train two MSCDNs for height prediction as well as roof lines extraction, two different training datasets are generated from the training area. The nDSM is the difference between the digital terrain model (DTM), generated by employing the progressive TIN densification algorithm [23], and the DSM. The nDSMs includes the absolute height values of urban objects. The second training dataset includes the ortho-photo tiles and corresponding segmented images of roofs (Figure 2c). The segmented images are generated by manually digitizing the ortho-photos for linear elements of individual roofs and are composed of three image channels for each class of rooflines as eave, ridge, and hip lines. To uniformly digitize different roofs in several training images, a library including 13 roof shapes is defined as shown in Figure 3 demonstrating the rule of roof digitizing for 3 classes of linear elements. Therefore, each pixel of the segmented image contains a binary code as [1, 0, 0] if it belongs to eave lines, [0, 1 0] if it belongs to ridge lines, or [0, 0, 1] if it belongs to hip lines.
In the pre-processing step, several image tiles are cropped from training datasets and resized to the size of 224 × 224 × n, so that n is equal to 3 for ortho-photos and linear segments, and 1 for nDSM tiles. Moreover, the number of training samples increases using different data augmentation techniques as follows:
  • Scale: all image tiles are randomly scaled by s ∈ [1, 1.5];
  • Rotation: all image tiles are randomly rotated by r ∈ [−5, 5] degrees;
  • Color: ortho-photo tiles are multiplied globally by a random RGB value c ∈ [0.8, 1.2];
  • Flips: all image tiles are horizontally and vertically flipped with a probability of 0.5.

2.2. CNNs Training

In spite of the general segmentation networks such as SegNet [24] including one-level prediction, in this study, the proposed CNN is a multi-scale convolutional–deconvolutional network (MSCDN) which includes two components, as shown in Figure 4. A coarse-scale network is composed of convolutional and deconvolutional sub-networks to extract global information. The second component is a fine-scale network which is utilized to refine the coarse prediction by adding the details and local features extracted from the input image.
The convolutional sub-network is composed of 13 convolutional layers followed by batch normalization (BN) and rectified linear unit (ReLU) layers to generate feature maps, as well as three max-pooling layers to reduce the size of feature maps by a factor of 2. The convolutional layers include 3 × 3 kernels which are applied to the input feature maps using a stride of 1. The max-pooling layers include 2 × 2 kernels with a stride of 2. By applying the pooling operators in three times, the size of the input image (e.g., 224 × 224 pixels) will be changed into 28 × 28 pixels. The deconvolutional sub-network is exactly the opposite of the convolutional sub-network. However, three un-pooling layers are designed to increase the size of the feature maps by a factor of 2 and generate the final output with the size of 224 × 224 pixels. As illustrated in Figure 5, the un-pooling operator increases the size of the input feature map by adding zero values between pixels in the input feature map.
The input, feature map, and output sizes are also given in Table 1. The size of the input receptive field is 224 × 224 × 3, while the output sizes are 224 × 224 × 1 and 224 × 224 × 3 for predicted depth maps and predicted linear segments, respectively. Therefore, unlike the previous studies [25,26], the resolution of the output is the same as the input. Another advantage of the proposed network is that the number of total learnable parameters is about 24 million which is significantly less than the number of parameters in the developed networks by the previous studies [25,26].
In order to boost the performance of the network, skip connection layers are also added at the end of the convolutional sub-network as well as at the beginning of the deconvolutional sub-network. The ideas of skip connections and residual blocks are first introduced in the study by [27]. As shown in Figure 6, the residual block predicts a residual that is added to the block’s input feature map, followed by a ReLU layer. Since the ReLU layers perturb the data flowing through the identity connections, we removed this layer at the end of the residual block and observed a significant improvement in the performance of the network. The skip connection type in the convolutional sub-network is based on the concatenation operator which allows the subsequent layers to re-use middle representations, maintaining more information which can lead to better performances and better gradient propagation across the network. While in the deconvolutional sub-network, the element-wise summation is employed in the skip connection layers to keep the number of parameters fixed.
The task of the fine-scale network is to enhance the resolution of the final prediction by incorporating more details, directly extracted from the input image, along with the coarse prediction, resulted by the deconvolutional sub-network. To accomplish it, a convolution filter is applied to the input image and the resulted feature maps are summed with the feature maps generated by the deconvolutional sub-network (Figure 4).
To learn parameters, the proposed networks are initialized based on random values, and trained separately using two datasets generated in the previous sub-section. For depth prediction, the berHu loss function [25] is applied, given by Equation (1).
L ( x ) = { | x | | x | c x 2 + c 2 2 c | x | > c ,
where, x is the difference between the predicted and ground truth values, and c is 20% of the maximal per-batch error.
For roofline segmentation, the logistic log loss (Equation (2)) is used which normalizes the predicted values (x) into a probability using the logistic (sigmoid) function.
L ( x ,   c ) = log ( 1 + exp ( c . x ) ) ,
where, c is a binary attribute of ground truth values in (+1, −1). Here, +1 denotes the presence of an attribute, and −1 denotes its absence.
Moreover, the mini-batch stochastic gradient descent (SGD) algorithm [28,29] with momentum as well as the Adam optimizer [30] are employed as training optimizers for depth prediction and roofline segmentation, respectively. Because of some limitations on the hardware capacities (e.g., GPUs and RAMs) as well as the size of the input matrices for training a single multi-task network, two MSCDNs are trained for height prediction and roof lines extraction tasks, separately. Besides, the complexity of a single multi-task network and combining two different loss functions could make the learning convergence more difficult.

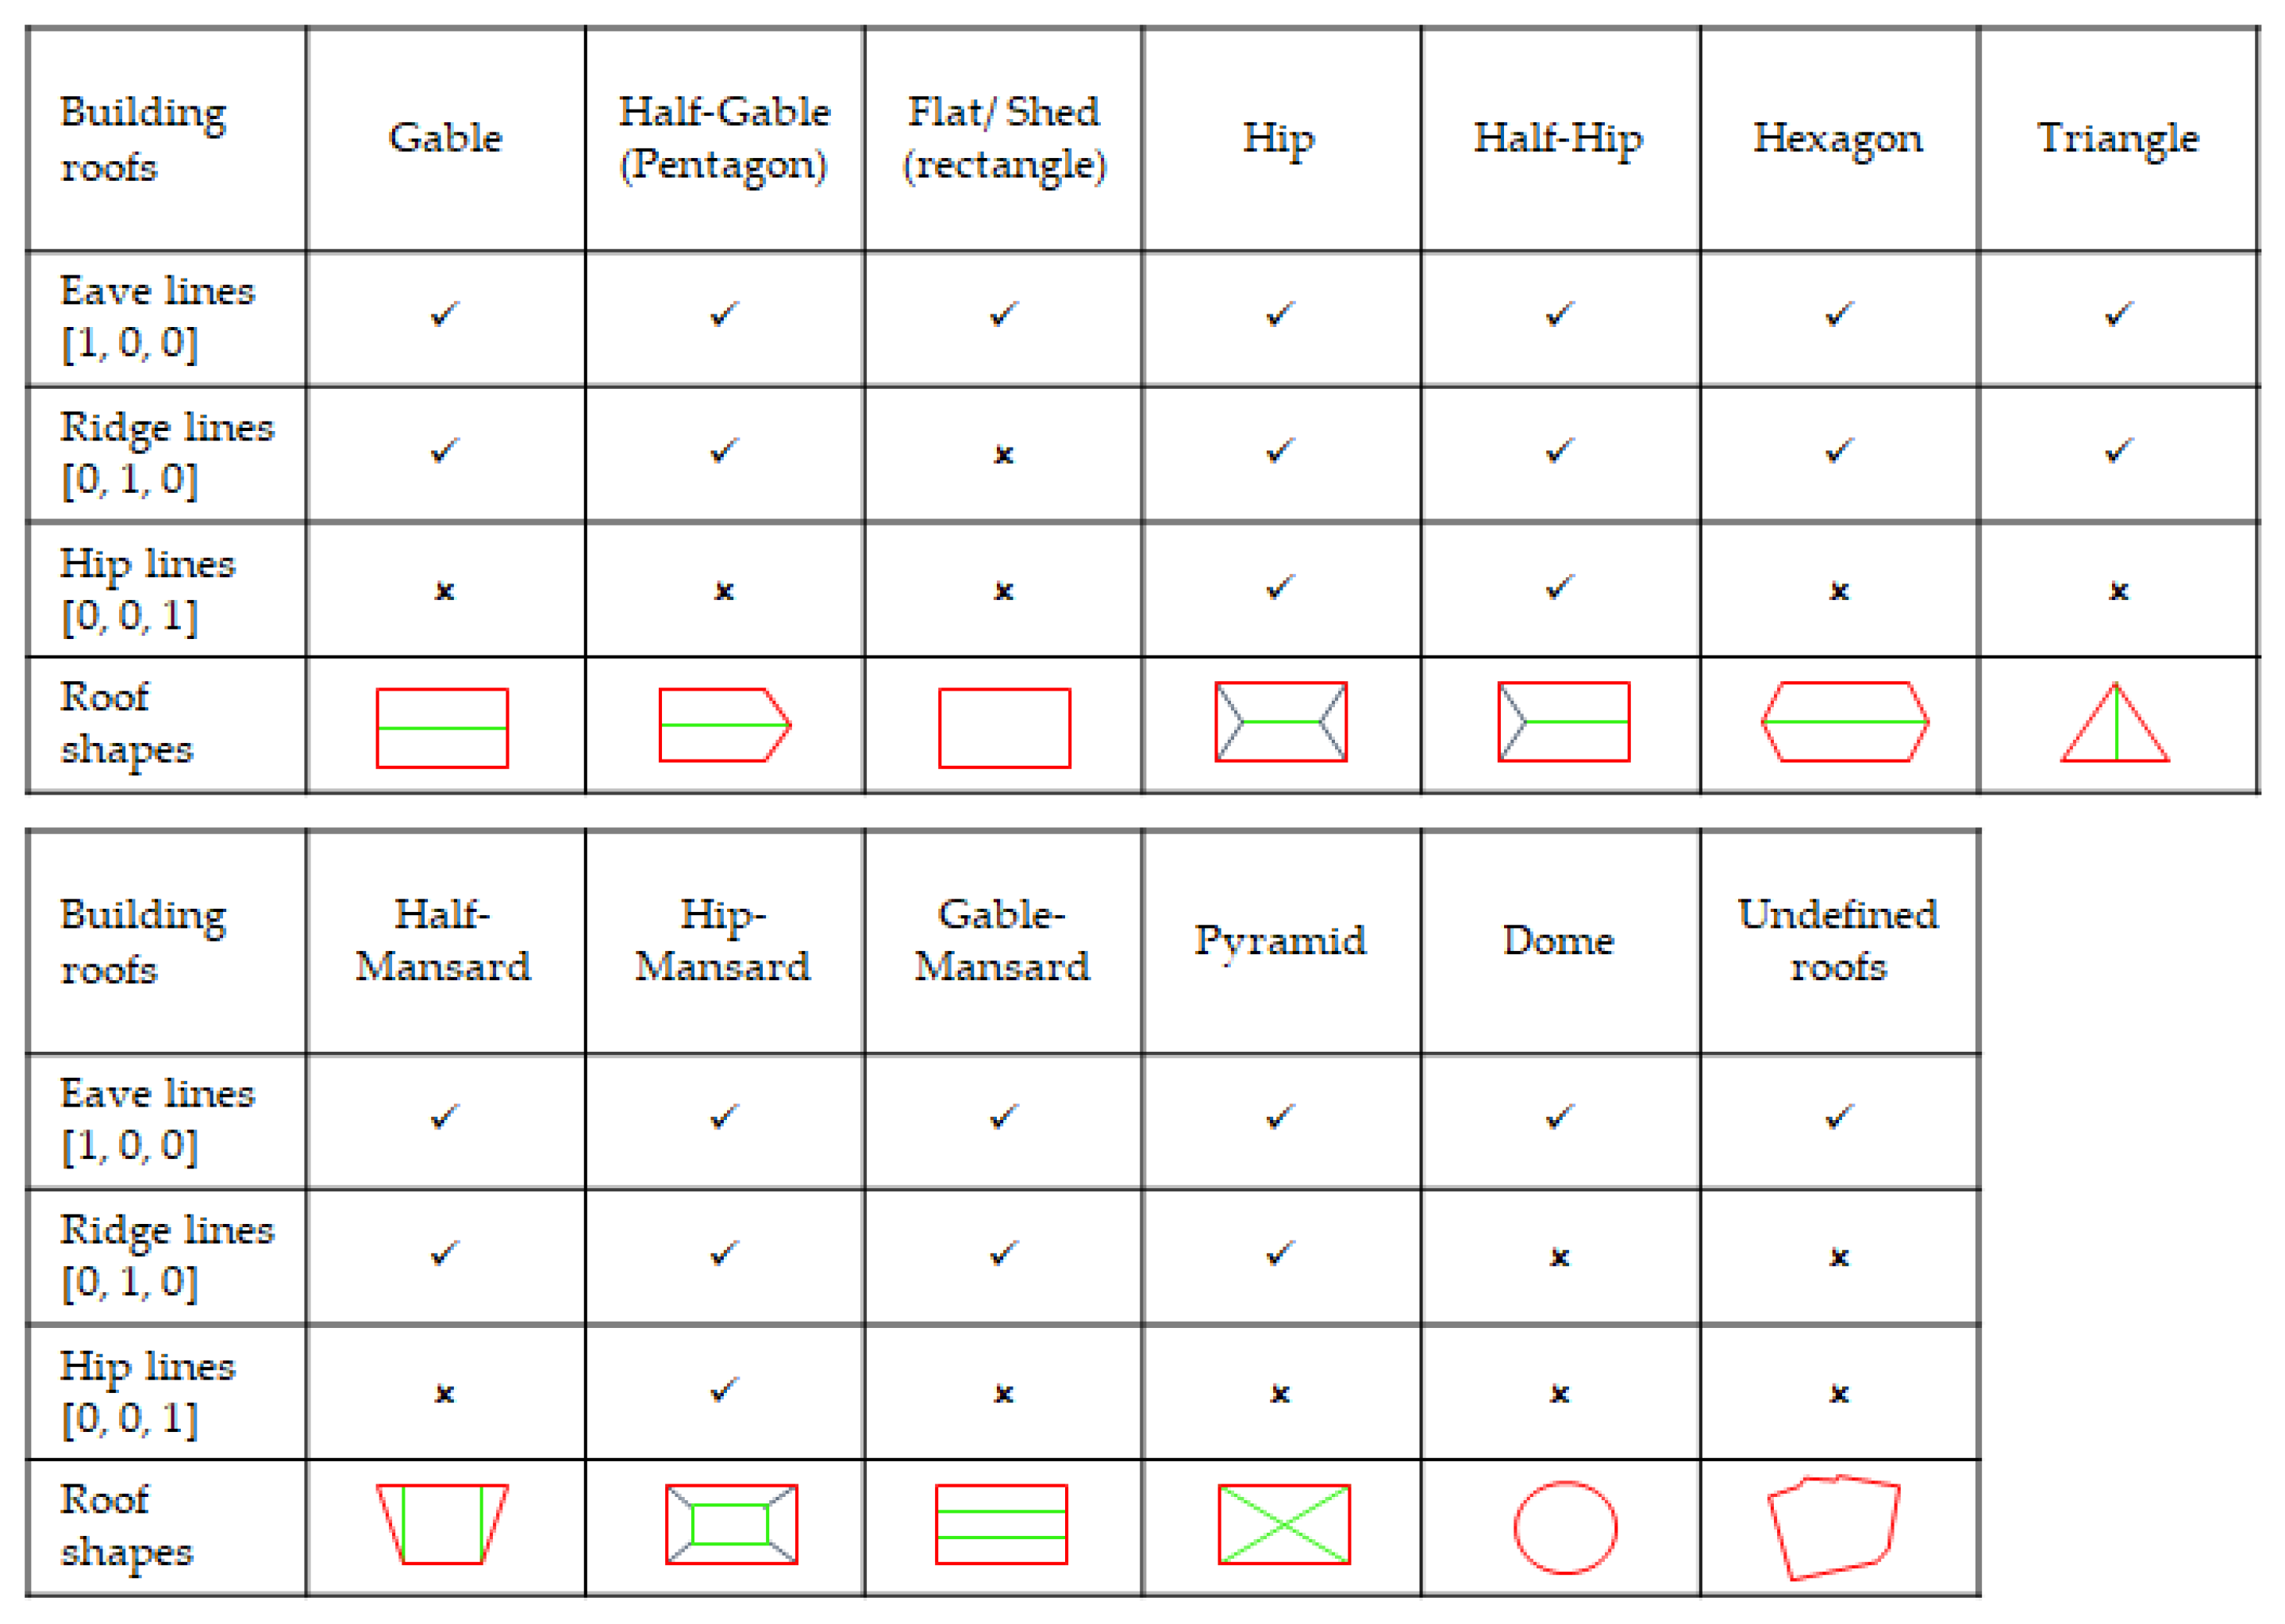
2.3. 3D Reconstruction

Information about footprints or locations of buildings, the shape of roofs, as well as the height values of buildings are very important parameters for knowledge-based 3DBR and reduces the complexity of the reconstruction procedure. In the third step of the proposed approach, the test RGB image (Figure 7a) is fed into two trained networks to extract the nDSM (Figure 7b) and linear elements of roofs in three channels of eave, ridge, and hip lines (Figure 7c). The idea of 3DBR, proposed in this study, is to simplify the reconstruction procedure by decomposing the buildings blocks into individual shapes based on the locations of the predicted linear elements (Figure 7k). Another advantage of the linear elements is the ability to detect building objects and classify building and non-building objects, automatically. For each building, the prismatic (Figure 7l) and parametric (Figure 7p) models are then reconstructed based on the estimated nDSM (Figure 7b). The details of the proposed reconstruction procedure are as follows.
To generate the prismatic models, the first channel of linear elements is utilized which is mostly composed of eave lines of buildings. The eave lines define the boundaries of building blocks, which are considered as the basis of the prismatic models. However, the predicted eave lines include several small and noisy segments. Therefore, in the pre-processing step, a binary polygon is generated by applying a set of morphological operators such as opening and closing to the predicted eave lines to remove the small segments and also disconnect two individual segments (Figure 7d). With the assumption of the smallest building area of ca. 50 m2 based on the pixel size of images (e.g., 5 cm), all binary segments with the areas smaller than 50 m2 can be removed. Next, a closing morphological operator including a disk-shaped structuring element with the radius of 50 cm (e.g., 10 pixels) is applied to the binary image to close all linear segments which belong to a linear object. Next, all of polygons are filled to create the filled binary segments. Finally, an opening morphological operator including a disk-shaped structuring with the radius of 100 cm (e.g., 20 pixels) is applied to the binary image to separate all linear segments which do not belong to a linear object.
The generated binary polygon is an initial primitive for the prismatic model. To enhance the binary polygon, the boundaries should be regularized and simplified using approximation methods. To do this, the main orientation of the eave lines is calculated using the standard Hough transform (SHT), as illustrated in Figure 7e. The peak values in the SHT represent potential lines in the polygon. The maximum peak is related to the line with the maximum length. The angle between the x-axis and this line is measured as the main orientation of the binary polygon. For a rectangular polygon, other orientations are parallel or perpendicular to the main orientation. Therefore, there is only one main orientation for a rectangular polygon. As shown in Figure 7e, the green line is a Hough line and the orientation of the green line is the main orientation of the binary polygon. The polygon is then rotated based on the main orientation (Figure 7f).
Next, the minimum bounding rectangle (MBR)-based technique [31] is employed for approximation of the rectangular polygons. The MBR-based technique is an iterative method based on searching the best rectangular polygon by fitting the bounding boxes to the initial polygon at each iteration. The workflow of the MBR-based technique is shown in Figure 8a. However, the MBR-based technique can only be applied to the polygons with rectangular shapes including one main orientation. For non-rectangular buildings with more than one main orientation, we proposed the minimum bounding triangle (MBT)-based technique for polygon approximation. Accordingly, the number of main orientations extracted by the SHT algorithm is used to decide between the MBR- and MBT-based techniques. The procedure of the MBT-based technique is similar to the MBR-based method but using the triangles instead of the rectangles for non-rectangular segments, as shown in Figure 8b. To improve the performance of the MBR- and MBT-based algorithms and reduce the number of iterations, the absolute value of differences between the approximated and initial segments are calculated at each iteration, instead of normal subtraction. As the results of this step, the approximated polygons of building blocks can be derived from the initial polygons (Figure 7h). The MBR/MBT-based techniques are free-parameter algorithms. However, after each subtraction (Figure 8), the area of remained binary segments are calculated and the small segments with the area smaller than 2.5 m2 are removed.
The next step is to decompose a building block into individual primitives. However, in this study, the predicted nDSM from a single image is not as accurate as the LiDAR-based nDSM and therefore, the predicted nDSM cannot be employed to extract the edges and linear elements of roofs for the partitioning of the individual buildings. On the other hand, the predicted linear elements include rich information about individual roofs, and they can be employed to divide a building block into the building parts. To accomplish it, a rule-based search strategy is proposed, as shown in Figure 9. As the first step, the approximated polygon and the corresponding eave lines are rotated based on the main orientation of the building block (Figure 9a,b). Then, all vertical and horizontal eave lines are analyzed to search for separator lines, which represent the individual roof boundaries (Figure 9c). An eave line is a separator line if the pixels values of the approximated polygon are 1 at both sides of the line and the endpoints of the line are also on the boundary of the approximated polygon, as shown in Figure 9d. Accordingly, a building block can be divided into individual parts using the separator lines (Figure 9e).
Since the eave lines of individual buildings are not completely predicted by the trained network, a splitting and merging algorithm is proposed for the L-shape parts in order to divide the remained polygons (Figure 9e) to the individual primitives, where there are no separator lines. In the splitting step, the boundary of the approximated polygon is first generated, as shown in Figure 10b. Next, the bounding lines, as well as supporting lines of the boundary, are extracted (Figure 10c). To extract the supporting lines, the locations of the bounding lines are moved pixel by pixel and the number of supporting pixels are counted. The lines with the maximum number of pixels are considered as the supporting lines. A predefined threshold (e.g., 50 cm) can be applied to merge collinear lines which are very close to each other. Then, all lines are analyzed based on the approximated polygon. If the pixel values of the approximated polygon are not the same on both sides of a line, the line must be removed (Figure 10c). In the merging step, according to a predefined assumption that polygons with a smaller width are the additional parts the remained lines, are sorted based on their lengths and the smallest line is selected as the separator line for dividing the L-shape polygon into two main parts and the additional parts, as shown in Figure 10d. This results in the individual regularized polygons generated for buildings (Figure 7k).
In the final step of the prismatic reconstruction, the median of height values corresponding to each individual polygon is calculated using the predicted nDSM, and the prismatic models are produced for all individual roof parts (Figure 7l).
The second channel of the extracted linear elements is composed of the ridge lines, which can be utilized to generate parametric models of buildings. Similar to LoD1, a binary mask of ridge lines is first produced and enhanced (Figure 7m). Then, corresponding individual ridge lines are extracted using individual polygons generated in the previous step. If there is more than one candidate for a ridge line inside a polygon, the following rule-based search strategy is proposed to find the best candidate, (as shown in Figure 11):
Rule 1: The lines, which are parallel to the main orientation of the individual polygon, are only considered. A predefined deviation threshold (e.g., ±10 degrees) can be applied to extract all possible lines.
Rule 2: The lines which are crossing the center of the segments based on a distance threshold (e.g., 50 cm) are considered as ridge lines.
Then, the optimized line is fitted to the candidate line to generate the regularized ridge line for each polygon (Figure 11c). If the distances between the endpoints of the ridge line and the segment sides are less than 3 m, the ridge line is extended.
In this step, the different building types can also be classified into three classes of flat, gable, and hip buildings by comparing the ridge lines, as follows.
Flat buildings: there are no ridge lines in the individual polygon.
Gable buildings: the length of the ridge line is almost equal to the length of the building.
Hip buildings: the difference between the length of the ridge line and the length of the building sides is more than a predefined threshold (e.g., more than 3 m).
Finally, the hip lines can be shaped by connecting the end points of ridge lines to the vertexes of eave polygon (Figure 7o) and the median height values of the ridge and hip lines are then extracted from the predicted nDSM. Next, the 3D lines of roofs are integrated into the prismatic models to generate the 3D parametric models (Figure 7p). In this study, the quality of the final reconstruction highly depends on the quality of the predicted linear elements. If the rooflines are not extracted for a building, completely and correctly, the accuracy of 3D models is consequently decreased. The most important challenges in 3D reconstruction are discussed in the next section.

3. Results

In this study, an airborne image dataset from Potsdam, Germany, provided by ISPRS [32], is utilized to evaluate the proposed framework. The dataset consists of very high-resolution true ortho-photo tiles with a ground sampling distance (GSD) of 5 cm and corresponding DSMs derived from dense image matching techniques. This dataset shows a typical historic city with large building blocks, narrow streets, and dense settlement structures. Two non-overlapping areas of this dataset are selected for training the MSCDNs and 3D reconstruction, as shown in Figure 12. In addition, the second test dataset from Zeebrugge, Belgium, provided by IEEE [33], was employed to assess the transferability of the trained networks. As shown in Figure 12, this dataset includes ortho-photos with the GSD of 5 cm and LiDAR data with a 10 cm point spacing. Also, the is more complexity of buildings in this dataset compared to the Potsdam test data.
According to the proposed library for rooflines (Figure 3), the training tiles are manually digitized for different building types and roof shapes (Figure 12). To train two MSCDNs for height prediction as well as roofline segmentation, several image tiles, corresponding nDSMs, as well as linear elements were randomly selected from the training area with the size of 224 × 224. After data augmentation, the number of training samples was increased to about 48,000 image tiles. Two networks were trained using the MATLAB deep learning toolbox on a single NVIDIA GTX 1080 Ti with a batch size of 16 for 100 epochs for depth prediction and line segmentation tasks, separately. The learning rate and the momentum were about 0.01 and 0.9, respectively for the SGD algorithm. Moreover, the learning rate, beta 1, beta 2, and epsilon parameters are selected as 0.01, 0.9, 0.999, and 1 × 10⁻⁸ for the Adam optimizer.
To evaluate the performance of the trained networks, a test area was selected outside the training area composed of different shapes and types of buildings, such as individuals, blocks, rectilinear, or tilted buildings (Figures 14a and 15a). The input size of the proposed networks was 224 × 224, while the size of the test area was about 3615 × 3525. If the test area was resized to 224 × 224, then the accuracy of the output was degraded significantly, as illustrated in Figure 13. Therefore, the test area was divided into smaller tiles and the predicted nDSM tiles were stitched together to improve the resolution of the final nDSM. The stitching of the two nDSM patches was based on the inverse distance weighting (IDW) algorithm [34] to interpolate the best height values for pixels in the margins. The predicted nDSM and linear elements of roofs for the Potsdam and Zeebrugge’s test areas are shown in Figure 14 and Figure 15, respectively.
The predicted linear elements of roofs include valuable knowledge of building boundaries, building orientations, roof boundaries, as well as roof types such as gable, hip, and flat shapes. The 3D models of buildings can be reconstructed from a 2D image using this knowledge as well as the estimated nDSM. The initial binary polygons of the predicted linear elements are illustrated in Figure 16a, and were generated using a set of morphological operators. The initial polygons can be converted to the individual approximated polygons (Figure 16b) based on the proposed MBR- and MBT-based techniques, as well as the splitting and merging algorithms. Since the predicted nDSM includes some outliers as well as systematic errors, the median of height values is calculated for each individual polygon as the corresponding height of each building. The results of the prismatic models (i.e., LoD1) are shown in Figure 16d. The second and third channels of the predicted linear elements include the ridge and hip lines. Therefore, the parametric models (i.e., LoD2) can also be generated according to the mentioned procedure in Section 2.3. Moreover, the different types of building can be detected as gable, hip, and flat roofs based on analyzing the ridge lines. The results of regularized linear elements and final parametric models are presented in Figure 17.

4. Discussion

The quality and accuracy of the results are evaluated using the ground truth for three tasks of nDSM prediction, roofline extraction, and 3D reconstruction as follows.

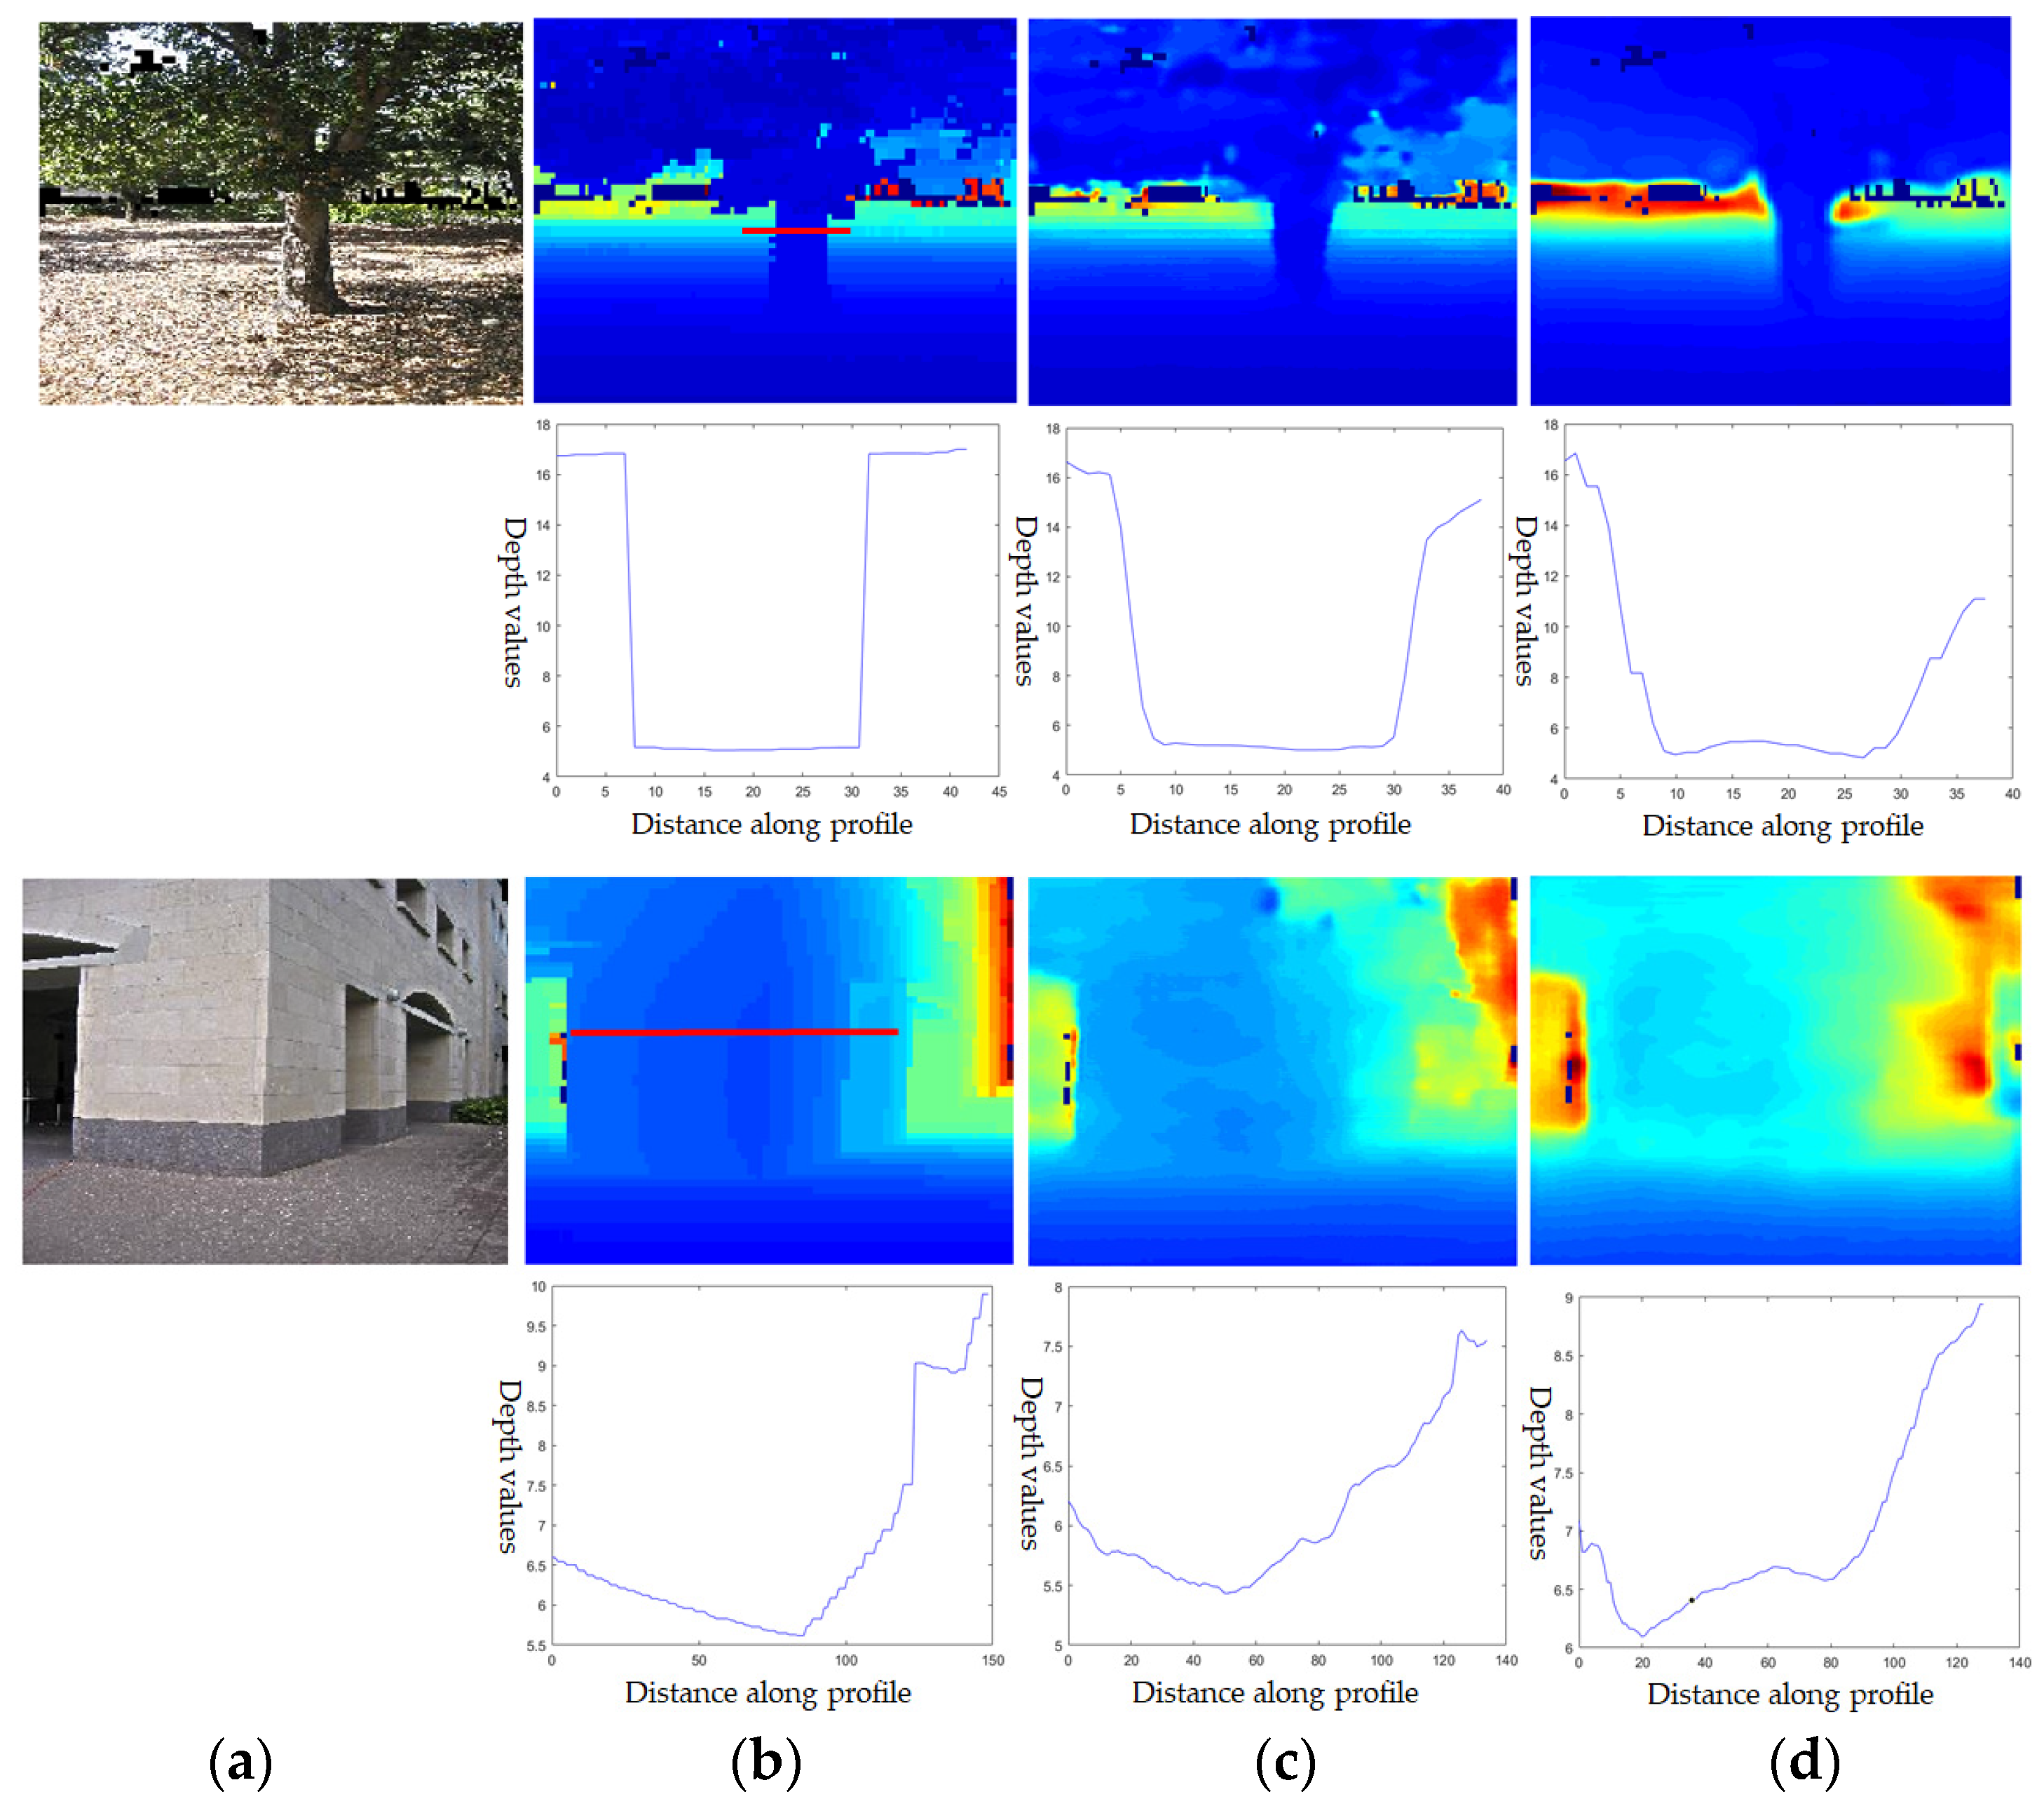
4.1. Quality Assessment of Depth Prediction

The accuracy of the predicted nDSM is evaluated using the ground truth. Table 2 presents the standard as well as robust statistical metrics against outliers to have accurate and reliable assessments. According to the median of errors, there is a systematic vertical bias of about 1.35 m between the predicted nDSM and the ground truth. On the other hand, the root mean square error (RMSE) metric is a widely employed measure of conformity between two data, and if the RMSE and standard deviation (SD) values are similar, then it could be concluded that the distribution of errors is normal and there are no outliers or systematic errors in the predicted nDSM. However, in this study, the RMSE is about 3.57 m for the Potsdam test data, while the SD is about 1.31 m showing that the predicted nDSM suffers from the outliers. To locate these large height differences, analysis of sample quantiles of errors is useful. As shown in Table 2, the accuracy of 68.3% of the predicted height values is about 2.16 m. The pixels with large errors can be detected by visualizing the height differences between the predicted nDSM and the ground truth (Figure 18). As shown in Figure 18, these pixels are mostly outside the building areas. In addition, a single building in the test area (Figure 18a, lower left) is the main source of errors. Therefore, the value of normalized median absolute deviation (NMAD) (about 1.32 m) can be reported as the reliable accuracy for the predicted nDSM in the building areas, instead of the RMSE. For the Zeebrugge test data the large errors are in the flat buildings where the materials of the flat roofs and consequently the RGB values of roofs are similar to the roads.
Since nDSM prediction from a single image is similar to the depth prediction task, the results are compared to the single image depth prediction studies. In order to compare the performance of the proposed network and the state of the art methods, the Make3D dataset [35] is selected and the quantitative results are reported in Table 3. According to the RMSE values, the predicted depth maps from the proposed MSCDN are as accurate as the results of the fully convolutional residual network (FCRN) [25] including ResNet50 [27]. However, as shown in Table 1, the number of total learnable parameters of the proposed architecture is about 24 million and there are only six skip connection layers, while these values are about 62 million and 12 layers for the FCRN [25] and 218 million and 0 layers for Eigen et al. [36]. Consequently, the proposed network includes fewer parameters and results in a higher accuracy (the lower RMSE), as reported in Table 3. Therefore, the proposed MSCDN is an optimized network based on the number of parameters and skip connection layers. In addition, the geometrical accuracies of the proposed MSCDN and the FCRN are compared using the depth profiles on edges, as shown in Figure 19. The results show that the proposed MSCDN is able to predict depth values more accurate, especially on edges where more accurate depth values are required for 3D reconstruction.

4.2. Quality Assessment of Roof Line Segmentation

As shown in Figure 17, not only the linear elements of roofs are extracted appropriately, but the buildings are also classified and distinguished from non-building objects such as trees and roads. To evaluate the predicted linear elements, a pixel-based confusion matrix is provided and the standard quality measures of completeness (or recall), correctness (or precision), quality [43,44], as well as the F1 score are computed based on Equation (3).
C o m p .   =   T P T P + F N ;   C o r r .   = T P T P + F P ;   Q u a l . = T P T P + F N + F P ;   F 1 s c o r e = 2 · C o r r .   ×   C o m p . C o r r .   + C o m p . ,
where, TP is the true positive and pixels are derived from the main diagonal elements, FP is the false positive computed from the sum per column, excluding the main diagonal element. Likewise, FN is the false negative and is the sum along the row, excluding the main diagonal element. The confusion matrix, as well as the quality measures, are presented for the test areas in Table 4 and Table 5.
As shown in Table 4 and Table 5, in this study, the completeness, correctness, and F1 score metrics have the same value of 95.46% and 91.12% because of global averaging of four classes, while the quality metric, showing the accuracy of segmentation is about 91.31% and 83.69%for the Potsdam and Zeebrugge test data. There are different reasons for the low accuracy such as misclassification of linear elements, the low quality of the ortho-photo, especially in eave lines, and the effect of the non-building objects like trees and shadows. It is clear that the accuracy of the trained network is decreased for the Zeebrugge test data where the spatial-spectral characteristics are not covered by training data. To improve the generalization capability of the networks the training dataset should be enriched by data over different cities.

4.3. Quality Assessment of 3D Reconstruction

The geometrical accuracy of building reconstruction is evaluated based on the 3D coordinates of roof planes’ vertexes. The RMSxy is computed as the 2D Euclidean distances (d) between the corresponding vertexes in the reference and generated parametric models. In addition, the height accuracy (RMSz) is calculated based on the Z coordinates of vertexes [45].
R M S x y = d 2 N ; R M S z = d z 2 N ,
where N is the number of the corresponding vertexes. In this study, the RMSxy are about 1.2 m and 3.9 m, while the RMSz are about 0.8 m and 2.4 m for the Potsdam and Zeebrugge test data, respectively, promising results for 3D reconstruction without accurate or even complete 3D data, compared to the state-of-the-art methods, which employ accurate height data [46]. Also, the intersection over union (IoU) metric is calculated to quantify the overlap percentage between the binary polygons generated from the reference linear elements (Figure 20a) and the approximated polygons generated from the predicted linear elements (Figure 20b), which is about 82%. The difference map between two binary polygons at the per-pixel level is shown in Figure 20c. The green segments are true-positive pixels, the red segments are false-negative pixels, and the blue segments are false-positive pixels. Consequently, there is a similarity ratio of about 95.8% between two binary polygons in Potsdam building areas, while this value is about 88.4% for the Zeebrugge data. As shown in Figure 20, the large differences are corresponding to the small or flat buildings where the discrimination capability of the trained networks is decreased for flat roofs and roads. The final results of 3D building reconstruction superimposed on the predicted nDSM are shown in Figure 21, presenting the high visual quality while the spatial patterns of the predicted DSM resemble that of 3D models.
The quality of the final 3D reconstruction highly depends on the quality and accuracy of the predicted linear elements as well as nDSMs. The most important challenges are as follows.
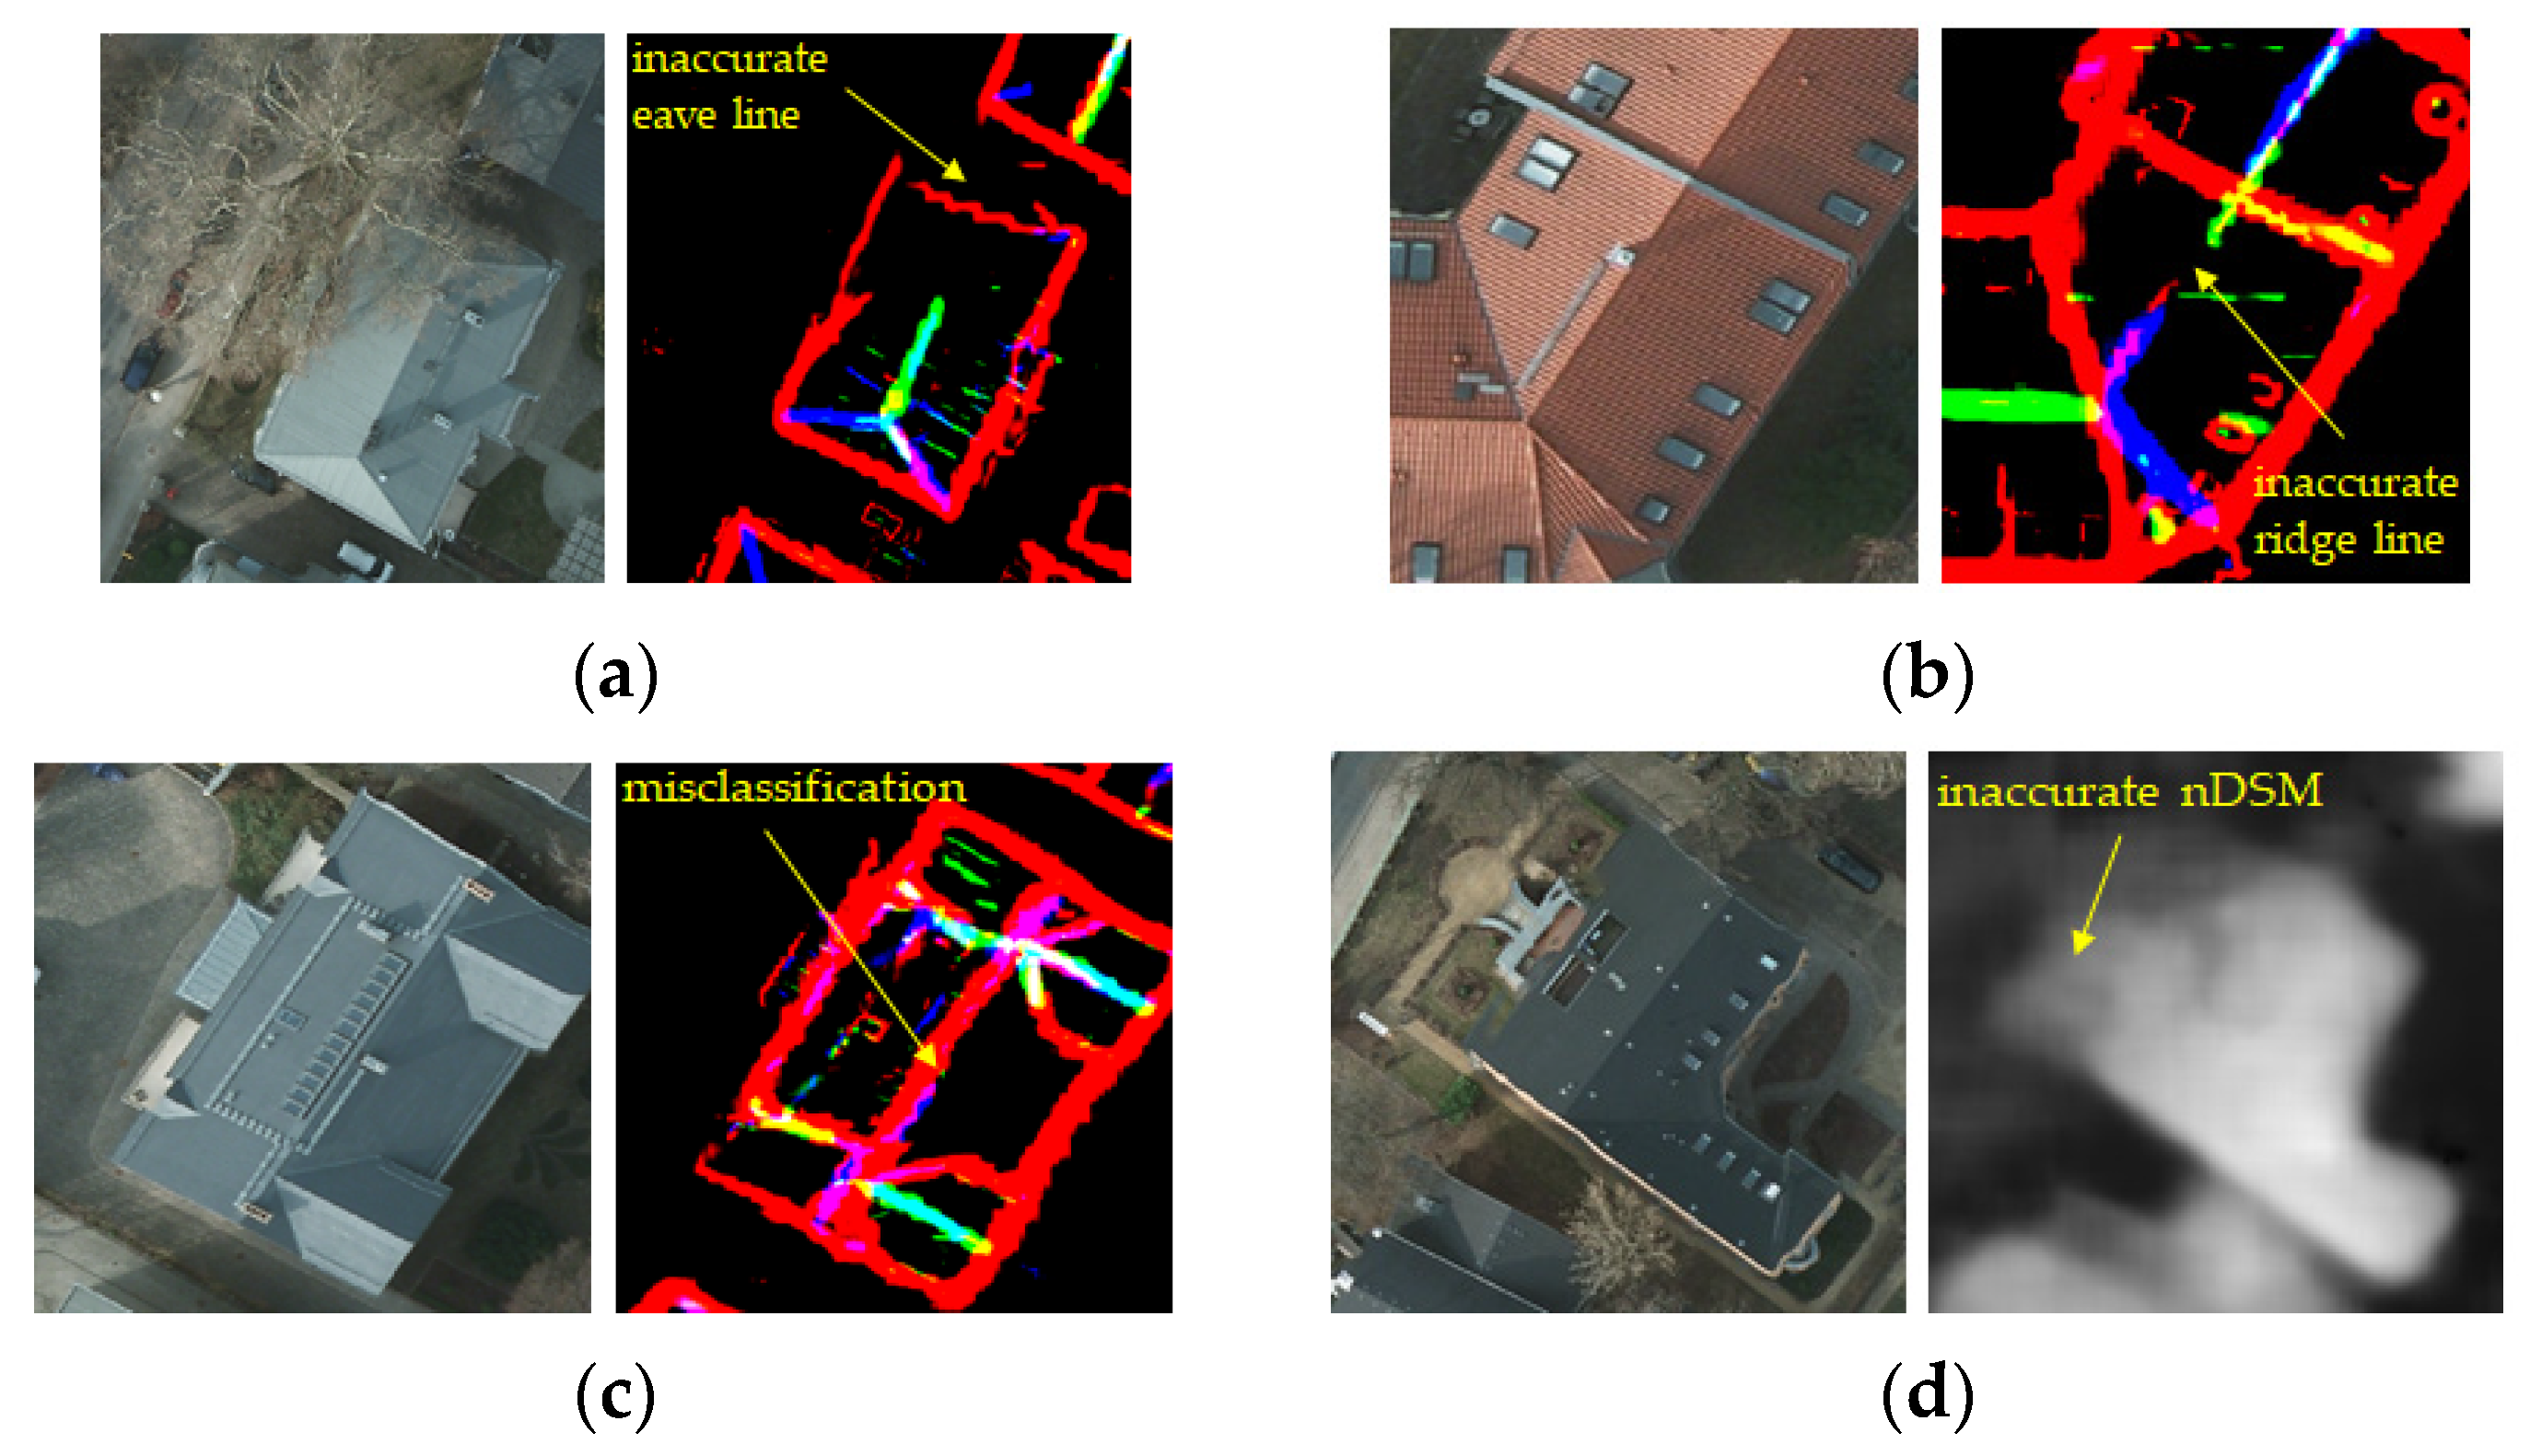
  • Trees are one of the common error sources which decrease the accuracy of the predicted eave lines, significantly (Figure 22a);
  • If the ridge lines are not extracted, the tilted roofs could be modeled as the flat roofs (Figure 22b).
  • There are some classification errors between the eave and ridge lines (Figure 22c);
  • If there are some errors in the predicted nDSM, the median values of the eave lines are not measured accurately (Figure 22d).

5. Conclusions

In this study, a novel approach is presented for 3D reconstruction of buildings based on the vital knowledge predicted from a single 2D image. Unlike recent approaches in photogrammetry and remote sensing requiring often both ortho-photos and high-resolution DSMs, the proposed method utilizes the power of CNNs to extract the inherent and latent features from a single image and interpret them as 3D information for building reconstruction. Although there were some limitations in providing the proper training datasets, two optimized MSCDNs were trained for height prediction and roofline segmentation tasks. The results over test datasets showed the reasonable performance of the proposed method in predicting height values with the average RMSE of 3.43 m and NMAD of 1.13 m. For the Potsdam test data, the total quality of 91% has been obtained for extracting the linear elements of individual roofs in three classes of eave, ridge, and hip lines, while this value is about 83.4% for the Zeebrugge. Moreover, the precise boundaries of individual buildings (e.g., the regularized polygons) are extracted with the accuracy of 95.8% and 88.4% for the Potsdam and Zeebrugge data, respectively showing the effectiveness of our work to classify building and non-building objects, automatically. In addition, the result of 3D reconstruction was visually very promising, which was also numerically confirmed by the RMSE values of about 1.2 m and 0.8 m for the Potsdam data as well as 3.9 m and 2.4 m for the Zeebrugge data for the horizontal and vertical accuracies, respectively. However, for a test data with different spatial-spectral characteristics as well as the complicated buildings (e.g., the Zeebrugge test data), the accuracy of the proposed method is degraded. To improve the generalization and transferability of the trained networks, training data over different cities need to be employed in future studies.

Author Contributions

Conceptualization, F.A., H.A. and F.T.; methodology, F.A. and H.A.; software, F.A. and F.T.; validation, F.A.; formal analysis, F.A. and H.A.; investigation, F.A.; resources, H.A. and F.T.; writing—original draft preparation, F.A.; writing—review and editing, H.A. and F.T.; visualization, F.A.; supervision, H.A. and F.T.

Funding

This research received no external funding.

Acknowledgments

The Potsdam data are provided by the ISPRS WG II/4 which is acknowledged by authors. The authors would like to thank the Belgian Royal Military Academy for acquiring and providing the data used in this study, and the IEEE GRSS Image Analysis and Data Fusion Technical Committee.

Conflicts of Interest

The authors declare no conflict of interest.

References

  1. Kolbe, T.H.; Gröger, G.; Plümer, L. CityGML—Interoperable Access to 3D City Models. In Proceedings of the Int. Symposium on Geo-information for Disaster Management, Delft, The Netherlands, 21–23 March 2005. [Google Scholar]
  2. Tarsha-Kurdi, F.; Landes, T.; Grussenmeyer, P.; Koehl, M. Model-Driven and Data-Driven Approaches Using Lidar Data: Analysis and Comparison. In Proceedings of the International Archives of Photogrammetry, Remote Sensing and Spatial Information Sciences, Munich, Germany, 19–21 September 2006; Volume 36, pp. 87–92. [Google Scholar]
  3. Wang, R.; Peethambaran, J.; Chen, D. LiDAR Point Clouds to 3D Urban Models: A Review. IEEE J. Sel. Top. Appl. Earth Obs. Remote Sens. 2018, 11, 606–627. [Google Scholar] [CrossRef]
  4. Cheng, L.; Gong, J.; Li, M.; Liu, Y. 3D Building Model Reconstruction from Multi-view Aerial Imagery and Lidar Data. Photogramm. Eng. Remote Sens. 2011, 77, 125–139. [Google Scholar] [CrossRef]
  5. Kim, K.; Shan, J. Building roof modeling from airborne laser scanning data based on level set approach. ISPRS J. Photogramm. Remote Sens. 2011, 66, 484–497. [Google Scholar] [CrossRef]
  6. Wang, Y.; Xu, H.; Cheng, L.; Li, M.; Wang, Y. Three-Dimensional Reconstruction of Building Roofs from Airborne LiDAR Data Based on a Layer Connection and Smoothness Strategy. Remote Sens. 2016, 8, 415. [Google Scholar] [CrossRef]
  7. Yan, Y.; Gao, F.; Deng, S.; Su, N. A Hierarchical Building Segmentation in Digital Surface Models for 3D Reconstruction. Sensors 2017, 17, 222. [Google Scholar] [CrossRef] [PubMed]
  8. Mccann, M.T.; Member, S.; Mixon, D.G.; Fickus, M.C.; Castro, C.A.; Ozolek, J.A.; Kovacevic, J. Images as Occlusions of Textures: A Framework for Segmentation. IEEE Trans. Image Process. 2014, 23, 2033–2046. [Google Scholar] [CrossRef] [PubMed]
  9. Awrangjeb, M.; Ali, S.; Gilani, N. An Effective Data-Driven Method for 3-D Building Roof Reconstruction and Robust Change Detection. Remote Sens. 2018, 10, 1512. [Google Scholar] [CrossRef]
  10. Lafarge, F.; Descombes, X.; Zerubia, J.; Pierrot-deseilligny, M. Structural Approach for Building Reconstruction from a Single DSM. J. Latex Cl. Files 2007, 6, 1–14. [Google Scholar] [CrossRef] [PubMed]
  11. Huang, H.; Brenner, C.; Sester, M.; Hannover, D. 3D Building Roof Reconstruction from Point Clouds via Generative Models Categories and Subject Descriptors. In Proceedings of the 19th ACM SIGSPATIAL International Conference on Advances in Geographic Information Systems, Chicago, IL, USA, 1–4 November 2004. [Google Scholar]
  12. Zhang, W.; Wang, H.; Chen, Y.; Yan, K.; Chen, M. 3D Building Roof Modeling by Optimizing Primitive’s Parameters Using Constraints from LiDAR Data and Aerial Imagery. Remote Sens. 2014, 6, 8107–8133. [Google Scholar] [CrossRef]
  13. Zheng, Y.; Weng, Q. Model-driven Reconstruction of 3D Buildings Using LiDAR Data. IEEE Geosci. Remote Sens. Lett. 2015, 12, 1541–1545. [Google Scholar] [CrossRef]
  14. Zheng, Y.; Weng, Q.; Zheng, Y. A Hybrid Approach for Three-Dimensional Building Reconstruction in Indianapolis from LiDAR Data. Remote Sens. 2017, 9, 310. [Google Scholar] [CrossRef]
  15. Kaiser, P.; Wegner, J.D.; Aurélien, L.; Jaggi, M.; Hofmann, T.; Schindler, K. Learning Aerial Image Segmentation from Online Maps. IEEE Trans. Geosci. Remote Sens. 2017, 55, 6054–6068. [Google Scholar] [CrossRef]
  16. Persello, C.; Stein, A. Deep Fully Convolutional Networks for the Detection of Informal Settlements in VHR Images. IEEE Geosci. Remote Sens. Lett. 2017, 14, 2325–2329. [Google Scholar] [CrossRef] [Green Version]
  17. Wen, Q.; Jiang, K.; Wang, W.; Liu, Q.; Guo, Q.; Li, L.; Wang, P. Automatic building extraction from google earth images under complex backgrounds based on deep instance segmentation network. Sensors 2019, 19, 333. [Google Scholar] [CrossRef] [PubMed]
  18. Srivastava, S.; Volpi, M.; Tuia, D. Joint Height Estimation and Semantic Labeling of Monocular Aerial Images with CNNs. In Proceedings of the 2017 IEEE International Geoscience and Remote Sensing Symposium (IGARSS), Fort Worth, TX, USA, 23–28 July 2017. [Google Scholar]
  19. Ghamisi, P.; Yokoya, N. IMG2DSM: Height Simulation from Single Imagery Using Conditional Generative Adversarial Net. IEEE Geosci. Remote Sens. Lett. 2018, 5, 794–798. [Google Scholar] [CrossRef]
  20. Mou, L.; Member, S.; Zhu, X.X.; Member, S. IM2HEIGHT: Height Estimation from Single Monocular Imagery via Fully Residual Convolutional-Deconvolutional Network. arXiv 2018, arXiv:1802.10249, 1–13. [Google Scholar]
  21. Amirkolaee, H.A.; Arefi, H. Height estimation from single aerial images using a deep convolutional encoder-decoder network. ISPRS J. Photogramm. Remote Sens. 2019, 149, 50–66. [Google Scholar] [CrossRef]
  22. Bittner, K.; D’Angelo, P.; Körner, M.; Reinartz, P. DSM-to-LoD2: Spaceborne Stereo Digital Surface Model Refinement. Remote Sens. 2018, 10, 1926. [Google Scholar] [CrossRef]
  23. Axelsson, P.E. DEM generation from laser scanner data using adaptive TIN models. In Proceedings of the International Archives of the Photogrammetry and Remote Sensing, Amsterdam, The Netherlands, 16–22 July 2000; pp. 110–117. [Google Scholar]
  24. Badrinarayanan, V.; Kendall, A.; Cipolla, R. SegNet: A Deep Convolutional Encoder-Decoder Architecture for Image Segmentation. IEEE Trans. Pattern Anal. Mach. Intell. 2017, 39, 2481–2495. [Google Scholar] [CrossRef]
  25. Laina, I.; Rupprecht, C.; Belagiannis, V.; Tombari, F.; Navab, N. Deeper Depth Prediction with Fully Convolutional Residual Networks. In Proceedings of the IEEE International Conference on 3D Vision (3DV), Stanford, CA, USA, 25–28 October 2016. [Google Scholar]
  26. Eigen, D.; Fergus, R. Predicting Depth, Surface Normals and Semantic Labels with a Common Multi-Scale Convolutional Architecture. In Proceedings of the International Conference on Computer Vision (ICCV), Washington, DC, USA, 7–13 December 2015; pp. 2650–2658. [Google Scholar]
  27. Kaiming, H.; Xiangyu, Z.; Shaoqing, R.; Sun, J. Deep Residual Learning for Image Recognition. In Proceedings of the 2016 IEEE Conference on Computer Vision and Pattern Recognition (CVPR), Las Vegas, NV, USA, 26 June–1 July 2016; pp. 1–9. [Google Scholar]
  28. Robbins, H.; Monro, S. A Stochastic Approximation Method. Ann. Math. Stat. 2007, 22, 400–407. [Google Scholar] [CrossRef]
  29. Kiefer, J.; Wolfowitz, J. Stochastic Estimation of the Maximum of a Regression Function. Ann. Math. Stat. 1952, 23, 462–466. [Google Scholar] [CrossRef]
  30. Kingma, D.P.; Ba, J.L. Adam: A Method for Stochastic Optimization. In Proceedings of the the 3rd International Conference on Learning Representations (ICLR), San Diego, CA, USA, 7–9 May 2015; pp. 1–15. [Google Scholar]
  31. Arefi, H.; Reinartz, P. Building Reconstruction Using DSM and Orthorectified Images. Remote Sens. 2013, 5, 1681–1703. [Google Scholar] [CrossRef] [Green Version]
  32. ISPRS 2D Semantic Labeling Contest-Potsdam. Available online: http://www2.isprs.org/commissions/comm3/wg4/2d-sem-label-potsdam.html. (accessed on 15 September 2019).
  33. 2015 IEEE GRSS Data Fusion Contest. Available online: http://www.grss-ieee.org/community/technical-committees/data-fusion. (accessed on 15 September 2019).
  34. Shepard, D. A two-dimensional interpolation function for irregularly-spaced data. In Proceedings of the the 1968 ACM National Conference, New York, NY, USA, 27–29 August 1968; pp. 517–524. [Google Scholar]
  35. Saxena, A.; Sun, M.; Ng, A.Y. Make3D: Learning 3D Scene Structure from a Single Still Image. IEEE Trans. Pattern Anal. Mach. Intell. 2009, 12, 824–840. [Google Scholar] [CrossRef]
  36. Eigen, D.; Puhrsch, C.; Fergus, R. Depth Map Prediction from a Single Image using a Multi-Scale Deep Network. Int. Conf. Neural Inf. Process. Syst. 2014, 2, 2366–2374. [Google Scholar]
  37. Zhao, S.; Fu, H.; Gong, M.; Tao, D. Geometry-Aware Symmetric Domain Adaptation for Monocular Depth Estimation. In Proceedings of the IEEE Conference on Computer Vision and Pattern Recognition, Long Beach, CA, USA, 16–20 June 2019; pp. 9788–9798. [Google Scholar]
  38. Liu, F.; Shen, C.; Lin, G. Deep Convolutional Neural Fields for Depth Estimation from a Single Image. In Proceedings of the Conference on Computer Vision and Pattern Recognition (CVPR), Boston, MA, USA, 7–12 June 2015; pp. 5162–5170. [Google Scholar]
  39. Goldman, M.; Hassner, T.; Avidan, S. Learn Stereo, Infer Mono: Siamese Networks for Self-Supervised, Monocular, Depth Estimation. In Proceedings of the Computer Vision and Pattern Recognition Workshops (CVPRW), Long Beach, CA, USA, 16–20 June 2019. [Google Scholar]
  40. Li, B.; Shen, C.; Dai, Y.; Van Den Hengel, A.; He, M. Depth and surface normal estimation from monocular images using regression on deep features and hierarchical CRFs. In Proceedings of the Conf. Computer Vision and Pattern Recognition (CVPR), Boston, MA, USA, 7–12 June 2015; pp. 1119–1127. [Google Scholar]
  41. He, L.; Wang, G.; Hu, Z. Learning depth from single images with deep neural network embedding focal length. IEEE Trans. Image Process. 2018, 27, 4676–4689. [Google Scholar] [CrossRef]
  42. Li, Z.; Snavely, N. MegaDepth: Learning Single-View Depth Prediction from Internet Photos. In Proceedings of the IEEE Computer Society Conference on Computer Vision and Pattern Recognition, Salt Lake City, UT, USA, 18–22 June 2018; pp. 2041–2050. [Google Scholar]
  43. McGlone, J.C.; Shufelt, J.A. Projective and object space geometry for monocular building extraction. In Proceedings of the IEEE Conference on Computer Vision and Pattern Recognition CVPR-94, Seattle, WA, USA, 21–23 June 1994; IEEE Computer Society Press: Washington, DC, USA; pp. 54–61. [Google Scholar]
  44. McKeown, D.M.; Bulwinkle, T.; Cochran, S.; Harvey, W.; McGlone, C.; Shufelt, J.A. Performance evaluation for automatic feature extraction. In Proceedings of the International Archives of the Photogrammetry, Remote Sensing and Spatial Information Sciences, Amsterdam, The Netherlands, 16–22 July 2000; pp. 379–394. [Google Scholar]
  45. Rottensteiner, F.; Trinder, J.; Clode, S.; Kubik, K. Using the Dempster-Shafer method for the fusion of LIDAR data and multi-spectral images for building detection. Inf. Fusion 2005, 6, 283–300. [Google Scholar] [CrossRef]
  46. ISPRS. ISPRS Test Project on Urban Classification and 3D Building Reconstruction. Available online: http://www2.isprs.org/commissions/comm3/wg4/results/a3_recon.html (accessed on 15 September 2019).
Figure 1. The flowchart of the proposed method.
Remotesensing 11 02219 g001
Figure 2. Two samples of training data: (a) RGB images; (b) normalized digital surface models (nDSMs); and (c) linear elements of roofs.
Remotesensing 11 02219 g002
Figure 3. The library of roofs’ linear elements in three classes.
Remotesensing 11 02219 g003
Figure 4. The proposed multi-scale convolutional–deconvolutional network.
Remotesensing 11 02219 g004
Figure 5. The un-pooling operator.
Remotesensing 11 02219 g005
Figure 6. The difference between the standard and proposed residual blocks: (a) the standard residual block [27], and (b) the proposed residual block.
Remotesensing 11 02219 g006
Figure 7. The 3D reconstruction workflow: (a) The input RGB image; (b) the predicted nDSM; (c) the predicted linear elements of roofs; (d) the initial binary segment; (e) the extracted eave lines including the Hough line and the main orientation of the building block; (f) the rotated binary segment; (g) the first approximation of the building block; (h) the final approximation of the building block; (i) the overlay of the final approximation on the RGB image; (j) eave and separator lines of roofs; (k) individual roofs; (l) prismatic reconstruction; (m) predicted ridge lines; (n) regularized eave lines; (o) calculated hip lines of roofs; and (p) parametric reconstruction.
Remotesensing 11 02219 g007
Figure 8. The approximation methods: (a) The MBR-based technique and (b) the MBT-based technique.
Remotesensing 11 02219 g008
Figure 9. The rule to define the separator lines for different building blocks: (a) The approximated polygon; (b) the corresponding eave lines; (c) a rule-based search strategy to find separator lines; (d) final separator lines; and (e) individual building parts.
Remotesensing 11 02219 g009
Figure 10. The proposed splitting and merging algorithm: (a) The approximated polygon; (b) the corresponding boundaries; (c) the supporting lines; (d) the merging rule; (e) the individual polygons.
Remotesensing 11 02219 g010
Figure 11. A rule-based search strategy to find an appropriate ridge line: (a) original ridge lines; (b) the ridge line parallel to the main orientation of the polygon; and (c) the fitted ridge line.
Remotesensing 11 02219 g011
Figure 12. Overview of training and testing areas: (a) the training area from Potsdam, Germany; (b) the testing area from Potsdam, Germany; (c) the testing area from Zeebrugge, Belgium.
Remotesensing 11 02219 g012
Figure 13. The effect of tiling on the output.
Remotesensing 11 02219 g013
Figure 14. The results of the MSCDNs compared to the ground truths for the Potsdam test dataset: (a) the input RGB image; (b) the reference nDSM; (c) the predicted nDSM; (d) the reference linear elements of roofs; and (e) the predicted linear elements.
Remotesensing 11 02219 g014
Figure 15. The results of the MSCDNs compared to the ground truths for the Zeebrugge test dataset: (a) the input RGB image; (b) the reference nDSM; (c) the predicted nDSM; (d) the reference linear elements of roofs; and (e) the predicted linear elements.
Remotesensing 11 02219 g015
Figure 16. The results of prismatic reconstruction: (a) The initial binary polygons, derived from the predicted linear elements (the first row for Potsdam and the second row for Zeebrugge); (b) the regularized polygons of building blocks (the first row for Potsdam and the second row for Zeebrugge); (c) the overlay of the regularized polygons on the RGB image (the first row for Potsdam and the second row for Zeebrugge); and (d) the 3D reconstruction results in levels of details (LoD1) (the left image for Potsdam and the right image for Zeebrugge).
Remotesensing 11 02219 g016aRemotesensing 11 02219 g016b
Figure 17. The results of parametric reconstruction for Potsdam (the left image) and Zeebrugge (the right image): (a) The individual regularized linear elements superimposed on the approximated polygons; (b) the individual regularized linear elements superimposed on the RGB image; and (c) the 3D reconstruction results in LoD2.
Remotesensing 11 02219 g017
Figure 18. The height difference map between the predicted nDSM and the ground truth: (a) the Potsdam test data; (b) the Zeebrugge test data.
Remotesensing 11 02219 g018
Figure 19. The geometrical accuracy of proposed MSCDN: (a) the input image; (b) the ground truth; (c) the predicted depth using MSCDN; and (d) the predicted depth using fully convolutional residual network (FCRN) [25].
Remotesensing 11 02219 g019
Figure 20. The difference map (c) between the reference polygons (a) and approximated polygons (b) for the Potsdam (the first row) and Zeebrugge (the second row) datasets.
Remotesensing 11 02219 g020
Figure 21. The final result of 3D building reconstruction (3DBR) superimposed on the predicted nDSM for the Potsdam (the first row) and Zeebrugge (the second row) datasets.
Remotesensing 11 02219 g021
Figure 22. The error sources in 3D reconstruction: (a) errors of predicted eave lines; (b) errors of predicted ridge lines; (c) errors of line classification; and (d) errors of the predicted nDSM.
Remotesensing 11 02219 g022
Table 1. The proposed architecture for the multi-scale convolutional–deconvolutional network (MSCDNs).
EncoderAct.Output sizeParam.DecoderAct.Output sizeParam.Fine-scaleAct.Output sizeParam.
Input image-224 × 224 × 3-Conv 3 × 3, s1 + BNReLU28 × 28 × 5122.3 MInput image-224 × 224 × 3-
2x {Conv 3 × 3, s1 + BN}ReLU224 × 224 × 643.6 kConv 3 × 3, s1 + BN-28 × 28 × 5122.3 MConv 3 × 3, s1 + BN-224 × 224 × 641.8 k
Pooling 2 × 2, s2-112 × 112 × 64-Summation-28 × 28 × 512-Summation-224 × 224 × 64-
2x {Conv 3 × 3, s1 + BN}ReLU112 × 112 × 6473.8 kConv 3 × 3, s1 + BNReLU28 × 28 × 5122.3 MConv 3 × 3, s1 + BNReLU224 × 224 × 6436.9 k
Pooling 2 × 2, s2-56 × 56 × 64-Conv 3 × 3, s1 + BN-28 × 28 × 5122.3 MConv 3 × 3, s1-224 × 224 × 1577
3x {Conv 3 × 3, s1 + BN}ReLU56 × 56 × 256443.1 kSummation-28 × 28 × 512-
Pooling 2 × 2, s2-28 × 28 × 256-Conv 3 × 3, s1 + BNReLU28 × 28 × 5122.3 M
Conv 3 × 3, s1 + BNReLU28 × 28 × 256590.1 kConv 3 × 3, s1 + BN-28 × 28 × 5122.3 M
Conv 3 × 3, s1 + BN-28 × 28 × 256590.1 kSummation-28 × 28 × 512-
Concatenation-28 × 28 × 512-Un-pooling 2 × 2-56 × 56 × 512-
Conv 3 × 3, s1 + BNReLU28 × 28 × 2561.2 M3x {Conv 3 × 3, s1 + BN}ReLU56 × 56 × 2563.5 M
Conv 3 × 3, s1 + BN-28 × 28 × 256590.1 kUn-pooling 2 × 2-112 × 112 × 256-
Concatenation-28 × 28 × 512-2x {Conv 3 × 3, s1 + BN}ReLU112 × 112 × 2561.2 M
Conv 3 × 3, s1 + BNReLU28 × 28 × 2561.2 MUn-pooling 2 × 2-224 × 224 × 256-
Conv 3 × 3, s1 + BN-28 × 28 × 256590.1 kConv 3 × 3, s1 + BNReLU224 × 224 × 64147.5 k
Concatenation-28 × 28 × 512-
Total Parameters:5.2 MTotal Parameters:19.0MTotal Parameters:39.3 k
Table 2. The standard and robust metrics to evaluate the accuracy of the predicted nDSM.
MetricsDescriptorsThe Potsdam Test DataThe Zeebrugge Test Data
StandardMean Error1.69 m2.03 m
Standard Deviation (SD)1.31 m1.26 m
Root Mean Square Error (RMSE)3.57 m3.30 m
Relative Error (REL)0.4%0.9%
Root Mean Squared Logarithmic Error (RMSLE)0.23 m1.19 m
RobustMedian Error1.35 m1.68 m
Normalized Median Absolute Deviation (NMAD)1.32 m0.98 m
Quantile 68.3%2.16 m2.27 m
Quantile 95%4.31 m4.75 m
Table 3. Comparison between the proposed MSCDN and the state-of-the-art methods for depth prediction.
DatasetMethodRMSE [m]REL [%]RMSLE [m]
Make3DZhao et al. [37]10.4240.403-
Liu et al. [38]9.490.3550.137
Goldman et al. [39]8.7890.4060.183
Li et al. [40]7.190.2780.092
Eigen et al. [36]7.160.1900.270
He et al. [41]6.8010.2080.087
Laina et al. [25] 4.460.1760.072
Li et al. [42]4.250.1780.064
Proposed MSCDN4.310.1840.074
PotsdamGhamisi et al. [19]3.89--
Amini et al. [21]3.4680.5710.259
Proposed MSCDN3.570.40.23
Table 4. The confusion matrix and the quality metrics for the predicted linear elements of roofs in Potsdam test data.
Classes of Linear ElementsPre._eave
[1, 0, 0]
Pre._ridge
[0, 1, 0]
Pre._hip
[0, 0, 1]
Pre._black
[0, 0, 0]
Quality Measures[%]
Ref._eave
[1, 0, 0]
49,181287332155653Comp.95.46
Ref._ridge
[0, 1, 0]
521793325984968Corr.95.46
Ref._hip
[0, 0, 1]
95613013258803Qual.91.31
Ref._black
[0, 0, 0]
1,300,905210,002187,72236,224,481F1 score95.46
Table 5. The confusion matrix and the quality metrics for the predicted linear elements of roofs in Zeebrugge test data.
Classes of Linear ElementsPre._eave
[1, 0, 0]
Pre._ridge
[0, 1, 0]
Pre._hip
[0, 0, 1]
Pre._black
[0, 0, 0]
Quality Measures[%]
Ref._eave
[1, 0, 0]
237,91423,9947161292,100Comp.91.12
Ref._ridge
[0, 1, 0]
11,20332,59013,54011,093Corr.91.12
Ref._hip
[0, 0, 1]
6804199611,2485627Qual.83.69
Ref._black
[0, 0, 0]
968,694121,21675,59115,514,881F1 score91.12

