Article

Combining Deep Learning and Prior Knowledge for Crop Mapping in Tropical Regions from Multitemporal SAR Image Sequences

by
Laura Elena Cué La Rosa
1,*,
Raul Queiroz Feitosa
1,
Patrick Nigri Happ
1,
Ieda Del’Arco Sanches
2 and
Gilson Alexandre Ostwald Pedro da Costa
3
1
Department of Electrical Engineering, Pontifical Catholic University of Rio de Janeiro, Rio de Janeiro 22451-900, Rio de Janeiro, Brazil
2
National Institute for Space Research (INPE), São Jose dos Campos 12227-010, São Paulo, Brazil
3
Department of Informatics and Computer Science, Rio de Janeiro State University, Rio de Janeiro 20550-900, Rio de Janeiro, Brazil
*
Author to whom correspondence should be addressed.
Remote Sens. 2019, 11(17), 2029; https://doi.org/10.3390/rs11172029
Submission received: 11 July 2019 / Revised: 14 August 2019 / Accepted: 20 August 2019 / Published: 29 August 2019
(This article belongs to the Special Issue Remote Sensing for Crop Mapping)

Abstract

:
Accurate crop type identification and crop area estimation from remote sensing data in tropical regions are still considered challenging tasks. The more favorable weather conditions, in comparison to the characteristic conditions of temperate regions, permit higher flexibility in land use, planning, and management, which implies complex crop dynamics. Moreover, the frequent cloud cover prevents the use of optical data during large periods of the year, making SAR data an attractive alternative for crop mapping in tropical regions. This paper evaluates the effectiveness of Deep Learning (DL) techniques for crop recognition from multi-date SAR images from tropical regions. Three DL strategies are investigated: autoencoders, convolutional neural networks, and fully-convolutional networks. The paper further proposes a post-classification technique to enforce prior knowledge about crop dynamics in the target area. Experiments conducted on a Sentinel-1 multitemporal sequence of a tropical region in Brazil reveal the pros and cons of the tested methods. In our experiments, the proposed crop dynamics model was able to correct up to 16.5% of classification errors and managed to improve the performance up to 3.2% and 8.7% in terms of overall accuracy and average F1-score, respectively.

Graphical Abstract

1. Introduction

1.1. Crop Mapping from Remote Sensing Data

Recent reports on food security estimate that over 800 million people in the world can be considered malnourished and that approximately two billion suffer from deficiencies in micronutrients such as iron, iodine, vitamin A, folate, and zinc [1,2]. Furthermore, with the expected increase in the human population to more than 9.8 billion by 2050 [3], coupled with the predicted worldwide growth of per capita income, the demand for food is expected to escalate in the near future [4]. The consequent intensification of agricultural production to meet such high projected demands may, however, have strong environmental impacts, such as: (i) important increase in greenhouse gas emissions; (ii) biodiversity loss; (iii) soil degradation; and (iv) catastrophic effects on freshwater resources [4]. There is, therefore, an urgent need for conceiving of efficient and sustainable strategies for the agricultural sector in order to enhance food security for the current and future human population.
In this context, in order to support the successful production, processing, marketing, and distribution of the major crop types, timely and accurate information about agricultural activities is essential. Accurate estimation of crop area extents, for instance, is indispensable for irrigation management and for the calculation of yield estimates. To meet the challenge of sustaining agricultural productivity growth, scientists and decision-makers require data produced by efficient agricultural monitoring processes.
Climate and weather unsurprisingly affect cropping area and, hence, agricultural practices. In temperate regions, agriculture is strongly characterized by seasonality, leading to more standardized agricultural practices and regular growing periods. The analysis of crop dynamics is simplified by the fact that there is usually a single crop per parcel during the whole productive season. Crop dynamics in tropical regions is considerately more complex, as multiple harvests per year are possible and due to particular practices such as crop rotation, non-tillage, and irrigation [5]. Considering also the large agricultural extents and the diversity of possible crop types, the production of detailed and reliable crop maps in tropical regions is a very challenging task.
Remote Sensing (RS) data have been used in natural resource mapping for many decades, being currently the main data source for various environmental modeling techniques, which include crop recognition and crop area estimation [6,7,8,9,10]. This notwithstanding, automatic crop mapping is still a hard problem. An important issue is related to the fact that the spectral appearance of crops changes over time. Additionally, different crop types may present similar spectral characteristics at a given point in time. Consequently, the analysis of the temporal context, i.e., multitemporal analysis, is very important for crop discrimination, especially in regions characterized by complex and diverse crop dynamics, such as tropical areas. Indeed, multitemporal RS data have proven to be very useful for improving classification accuracy in crop and vegetation mapping [11,12].
Recently-launched optical and Synthetic Aperture Radar (SAR) orbital systems with high temporal (low revisit time) and spatial resolutions are a valuable asset for crop mapping applications. However, although optical data have been widely used for crop recognition [13,14], missing data due to cloud cover and shadows are an important problem, especially in tropical regions [15]. In this case, the (almost) all-weather, all-time acquisition capability of radar-based imaging systems makes multitemporal SAR image sequences very interesting options for crop mapping applications.
As an active RS system, SAR systems transmit radio waves and register the echoes (backscatter) reflected by Earth surface objects. Moreover, the characteristic wavelength ranges of SAR imaging systems enable the transmitted signals to penetrate clouds, making such systems almost insensitive to adverse atmospheric conditions [16] and thus highly reliable in terms of data provisioning [17].
The backscatter intensities recorded by SAR systems are mostly a function of the size, shape, orientation, and dielectric constant of the scatters [18]. In crop analysis studies, backscatter intensities would therefore differ depending on the particular characteristics of the crop components (leaves, stalks, seeds, etc.) and of soil moisture content. Crops with different intrinsic structures can therefore be distinguished up to some point, based on their backscatter intensities [19]. The development of multi-polarized acquisition modes in many available systems further increases the discriminative capacity of SAR data [20]. SAR images are, however, granular in appearance due to the effect of speckle, which causes inter-class confusion, thus hindering classification. Texture features, such as statistics derived from the Grey-Level Co-occurrence Matrix (GLCM), are known to be robust to speckle noise and have been widely used in the analysis of SAR data.
In this work, however, no prior knowledge about the particular characteristics of the SAR image data or about the particular interactions of radar waves with different crop types were used in the definition of the investigated Deep Learning (DL) classification methods, as they are supposed to autonomously learn features or representations to be used in the crop classification task.

1.2. Related Works

Traditional classification techniques for Remote Sensing (RS) images generally make use of unsupervised (e.g., k-means) or supervised (e.g., maximum likelihood, neural network, support vector machine, random forests) methods to perform pixel-wise classification [14,21,22,23,24]. These approaches rely on the spectral variables associated with image pixels and their transformations (e.g., principal components, vegetation indices, etc.) as input to per-pixel classifiers, ignoring, however, the spatial and temporal context. Spatio-contextual techniques such as texture extraction have also been used [25,26]. Features derived from the GLCM have been probably the most widely-used texture features in SAR data classification [27]. Nevertheless, the discriminative ability of these low-level features is limited. Object-based classification, by extracting quantitative attributes from segments (spectral statistics, area, shape) has been also employed [28,29], but this approach relies on segments, the delineation of which ignores semantics, and its performance strongly depends on the choice of features to be used in the classification procedure. To cope with the inherent problems of pixel-wise and object-based approaches, probabilistic graphical models, such as Markov random fields [30] and Conditional Random Fields (CRFs) [31], have successfully exploited both spatial and temporal contexts in the classification of RS imagery, including in the crop identification task. Hidden Markov Models (HMM) have been also used in crop classification, associating hidden variables with phenological stages [32,33]. These approaches deliver high accuracies, but at the cost of a high computational effort, and they also require expert knowledge about the problem. All the above-mentioned methods rely on feature engineering, and we argue that there are no universal hand-crafted features (i.e., that are manually designed based on domain-specific knowledge), equally discriminative for different applications and datasets.
Deep Learning (DL) techniques encompass specific supervised and unsupervised representation-learning algorithms, which learn features from labeled and non-labeled data. In fact, state-of-the-art performance in RS image classification has been achieved with DL-based techniques, such as Autoencoders (AEs), Convolutional Neural Networks (CNNs), and Fully-Convolutional Networks (FCNs); which can integrate the spatial, spectral, and temporal contexts in unsupervised and/or supervised ways [34,35,36,37,38,39].
An AE [40] is a neural network designed to reproduce at its output the pattern presented at its input. The basic architecture of an AE involves an encoder function, whose outcome is a compact representation of the input data, and a decoder function, that maps back the learned representation to the input space. After training, the encoder function is used to compute a feature representation of any input sample. As AEs rely on unsupervised learning, they do not require labeled data for training, which is an interesting characteristic considering the difficulties involved in data labeling. Conversely, as no labeled data are used in training, AEs are not able to determine which information is relevant for a specific application. As examples of the use of AEs in RS applications, Firat et al. [34] trained a sparse convolutional autoencoder for object detection in RS images; Romero et al. [35] proposed a deep convolutional sparse autoencoder for learning spectral-spatial features.
A Convolutional Neural Network (CNN) [41,42] is a neural network capable of dealing with some spatial context. In image analysis, CNNs are typically employed for assigning a single class label to an entire image/scene. The CNN forward pass involves the sequential processing of many layers, thus learning a hierarchy of feature representations. Its typical building blocks are linear convolution operations followed by nonlinear activation, spatial pooling, fully-connected layers, and a classification layer. A convolutional layer consists of a set of trainable filters applied to local receptive fields (i.e., the regions of the input space that are path-connected to the filter) in order to extract (interesting) features. The basic characteristic of the convolution layer is that all input spatial locations are subjected to the same filters, and as each filter is applied by sliding it over the input, the number of parameters to be learned is relatively small when compared with traditional neural networks. The pooling layer is a downsampling layer. Its objective is two-fold: to provide some shift invariance and to summarize spatial information while preserving discrimination, both at a low computational cost. A fully-connected layer is commonly used at the end of a CNN model and implies that every neuron in the previous layer is connected to every neuron of the next layer. In sequence comes the classification layer, which delivers scores (class membership probabilities) that are usually determined by the softmax activation function. Recently, in the context of RS applications, Kussul et al. [36] proposed 1D and 2D CNN architectures to exploit spectral and spatial features, respectively. They integrated spatial and temporal contexts in a supervised way and concluded that an ensemble of 1D and 2D CNNs outperformed the Random Forest (RF) classifier in a crop recognition task. In a previous work [43], we also used AEs and CNNs for crop recognition in multitemporal SAR images sequences, obtaining results that outperformed the RF classifier.
In the aforementioned CNN-based approaches, the trained network computes a descriptor for a given image patch and predicts a single label for the entire patch; this label is then assumed to be the label of the patch’s central pixel. During the test phase, the map is constructed by making a prediction for each patch associated with each image position. Obviously, that approach can be extremely inefficient for large images. Additionally, such an approach is not appropriate for pixel-wise semantic labeling tasks, as it assigns a label to a patch independently of the surrounding labels. This often leads to a salt-and-pepper-like result and limits the power of the network to learn intra- and inter-class spatial relations. To deal with this problem, a post-processing stage is often employed to perform a structured prediction on the probabilities given by the CNN, using, for instance, conditional random fields [44].
More recent approaches predict jointly all labels in an image patch, instead of a single label for the central pixel. In this scenario, the so-called Fully-Convolutional Network (FCNs) came into play. FCNs [45] were specifically proposed for semantic labeling; those networks employ an upsampling strategy at the second half set of layers of a CNN in order to recover the original input image size and perform dense predictions. In this approach, the fully-connected layer of a CNN is viewed as a convolution layer with large receptive fields, and the segmentation is achieved using coarse class score maps obtained by feed-forwarding the input image. The network performs an end-to-end learning, downsampling the input space (typically by successive convolution, activation, and pooling layers) and then upsampling (deconvolution) it again, in order to predict dense output labels for an arbitrary size input. In practice, deconvolution is commonly implemented as the transposed convolution operator and can be understood as the backward-pass implementation of the standard convolution. FCNs also use the so-called skip connections, which transfer local information by concatenating feature maps from the downsampling path with feature maps from the upsampling path.
These connections aim to combine context/semantic information with spatial/appearance information. In FCNs, both learning and inference are performed for the whole image at once in order to get a probability map of semantic labels, without loss in terms of spatial resolution. The model is trained by minimizing the pixel-wise cross-entropy loss. The loss is not computed over a single prediction, as for a CNN, but over the grid of spatial predictions. Since every label is learned in association with its neighbors, the method can be seen as a structured one. Such an approach has delivered impressive performances in RS applications, as reported in [46,47]. In [48], an FCN-based approach was compared with a CNN-based approach for crop classification in SAR images. The study reports similar results in terms of thematic and spatial accuracy for both approaches, in terms of computational cost; however, the inference time of the FCN-based approach was more than one hundred times shorter than that of the CNN approach.

1.3. Goals and Contributions

Despite the success of the above-mentioned methods, most crop recognition studies on multitemporal RS images rely on datasets obtained in temperate regions [13,49,50,51,52,53]. Those works aim at determining for a particular geographic extent a single crop type, for the whole productive season. We argue, however, that such techniques are inappropriate to model the complex crop dynamics observed in tropical areas.
Deep Learning (DL) techniques have been recently the focus of much attention in the RS field, mostly due to their capacity to learn features automatically from data, which in many cases are associated with a better discriminative power, as compared to handcrafted features. Moreover, DL in agriculture has gained popularity. The work in [54] reviewed recent efforts that employ DL techniques in agricultural-related problems, pointing out that such methods deliver higher accuracies, outperforming traditional image processing techniques.
Inspired by the above works, this study explores the use of Deep Learning (DL) techniques for crop mapping using multitemporal SAR image sequences. The study further proposes the use of a priori knowledge to model inter-class and intra-class relationships within the SAR images sequence. In short, the major contributions in this article are:
  • We propose a prior knowledge-based method to model complex crop dynamics in tropical regions, which enforces crop type classification to be consistent in both the spatial and temporal domains.
  • We evaluate and compare three different approaches for crop type classification, namely: Autoencoders (AEs), Convolutional Neural Networks (CNNs), and Fully Convolutional Networks (FCNs), upon a SAR multitemporal image sequence.
The rest of this paper is organized as follows. In Section 2, we describe the investigated frameworks for performing crop type mapping and provide a detailed explanation of the prior knowledge-based method. In Section 3, we evaluate the devised methods on a public dataset from a tropical region, present the experimental results, and discuss the strengths/weaknesses of the proposed method. Finally, in Section 4, we conclude the paper by summarizing its contributions and give directions for further research.

2. Materials and Methods

2.1. Crop Classification Approaches Considered in This Study

Three different DL-based classification approaches were considered in the present analysis: unsupervised feature learning using autoencoders for patch-based classification ( A E p a t c h ); patch-wise classification with CNNs, with spatially-independent predictions ( C N N p a t c h ); and pixel labeling with FCNs, with structured predictions ( F C N p i x e l ). A Random Forest (RF) classifier was also included in the analysis for pixel-based classification ( R F p i x e l ), to serve as the baseline.
In all aforementioned classification schemes, temporal context was exploited by the feature stacking technique. Spatially-correspondent pixels or features at all dates were concatenated along the third dimension, and the resulting tensor was the input of the classification procedure. This has been probably the most widely-used strategy to capture temporal context in multitemporal applications [55,56,57]. In the following, we provide a detailed explanation of each classification approach tested in this work.

2.1.1. Random Forest/pixel-wise (RFpixel)

The R F p i x e l approach basically employs an RF classifier trained separately for each date. The RF classifier takes as input the concatenated texture features measured at common spatial coordinates on all dates. In this approach, pixels at the same spatial coordinates share a unique representation over the whole image sequence. The procedure comprises three main steps: (1) texture feature extraction: this is carried out for each image in the sequence separately; (2) feature stacking: textural features of all images related to the same pixel coordinates are stacked one upon the other, forming the feature vector for that location; and (3) classification: a date-specific RF classifier maps feature vectors to posterior class probability vectors. The class with the highest posterior is selected as the final classification of the corresponding pixel. Notice that the texture features are calculated from the neighborhood of each pixel and thus capture the spatial context.

2.1.2. Autoencoder/patch-wise (AEpatch)

In the A E p a t c h approach, a date-specific AE network computes pixel’s features based on the image patch centered at that pixel. The features generated this way form the input to a classifier that assigns a class label to each pixel on the corresponding date. The procedure comprises four main steps: (1) patch extraction: three-dimensional patches centered at each pixel are cropped from each image and subsequently flattened into one-dimensional vectors; (2) unsupervised feature extraction: each one-dimensional vector produced in the previous step is submitted to a date-specific AE to produce the pixel-wise feature vector for each date; (3) feature stacking: the feature vectors corresponding to the same spatial coordinate, on all dates, are concatenated, forming the final pixel descriptor; (4) classification: an RF classifier trained for each date separately delivers a posterior class probability vector for each input feature vector on each date. The classifier assigns the pixel to the class corresponding to the highest posterior. Furthermore, in this approach, spatial context is taken into account because the pixel features derive from its surrounding patch.

2.1.3. Convolutional Neural Network/patch-wise (CNNpatch)

As in [46], the C N N p a t c h approach relies on CNNs trained on 3D image patches. The CNNs predict a single label per patch, which is then assigned to the patch central pixel on the correspondent date. This approach comprises three main steps. (1) image stacking: the coregistered images are stacked, forming a tensor that contains the bands/polarization of all images of the multitemporal sequence; (2) patch extraction: 3D patches centered at each pixel location are extracted from the stacked image, for all spatial coordinates; (3) supervised feature extraction and classification: in this step, date-specific CNNs extract features and compute a posterior probability vector for each 3D patch on each date. The label of the class with the highest probability is then assigned to the patch’s central pixel. It should be noted that the training data are the same for all dates. However, the training labels are generally different from date to date. As a consequence, there will be a different CNN for each date. Similar to the previous scheme, the C N N p a t c h approach captures the pixels’ contexts from the patches centered at them.

2.1.4. Fully Convolutional Network/pixel-wise (FCNpixel)

The F C N p i x e l approach has in common with the previous scheme that it processes 3D patches of the stacked multitemporal images. However, instead of assigning a single class label to the patch’s central pixel, the F C N p i x e l approach classifies all pixels in the patch by using a fully-convolutional network. The F C N p i x e l approach comprises three main stages: (1) image stacking: as in the previous scheme, all images in the sequence are stacked to create a single tensor, which represents the entire sequence. (2) patch extraction: the image stack is decomposed into non-overlapping 3D patches, which together cover the entire multitemporal image tensor; (3) classification: in the classification step, the 3D image patches are submitted to an FCN to obtain a class score map with the same resolution as the input patches. Each pixel in a patch is assigned to the class corresponding to the highest score. As in the previous approaches, F C N p i x e l also captures the spatial context, but in a different way. It not only explores the data in the neighborhood around each pixel, but also considers the spatial arrangement of the class labels in the output map.

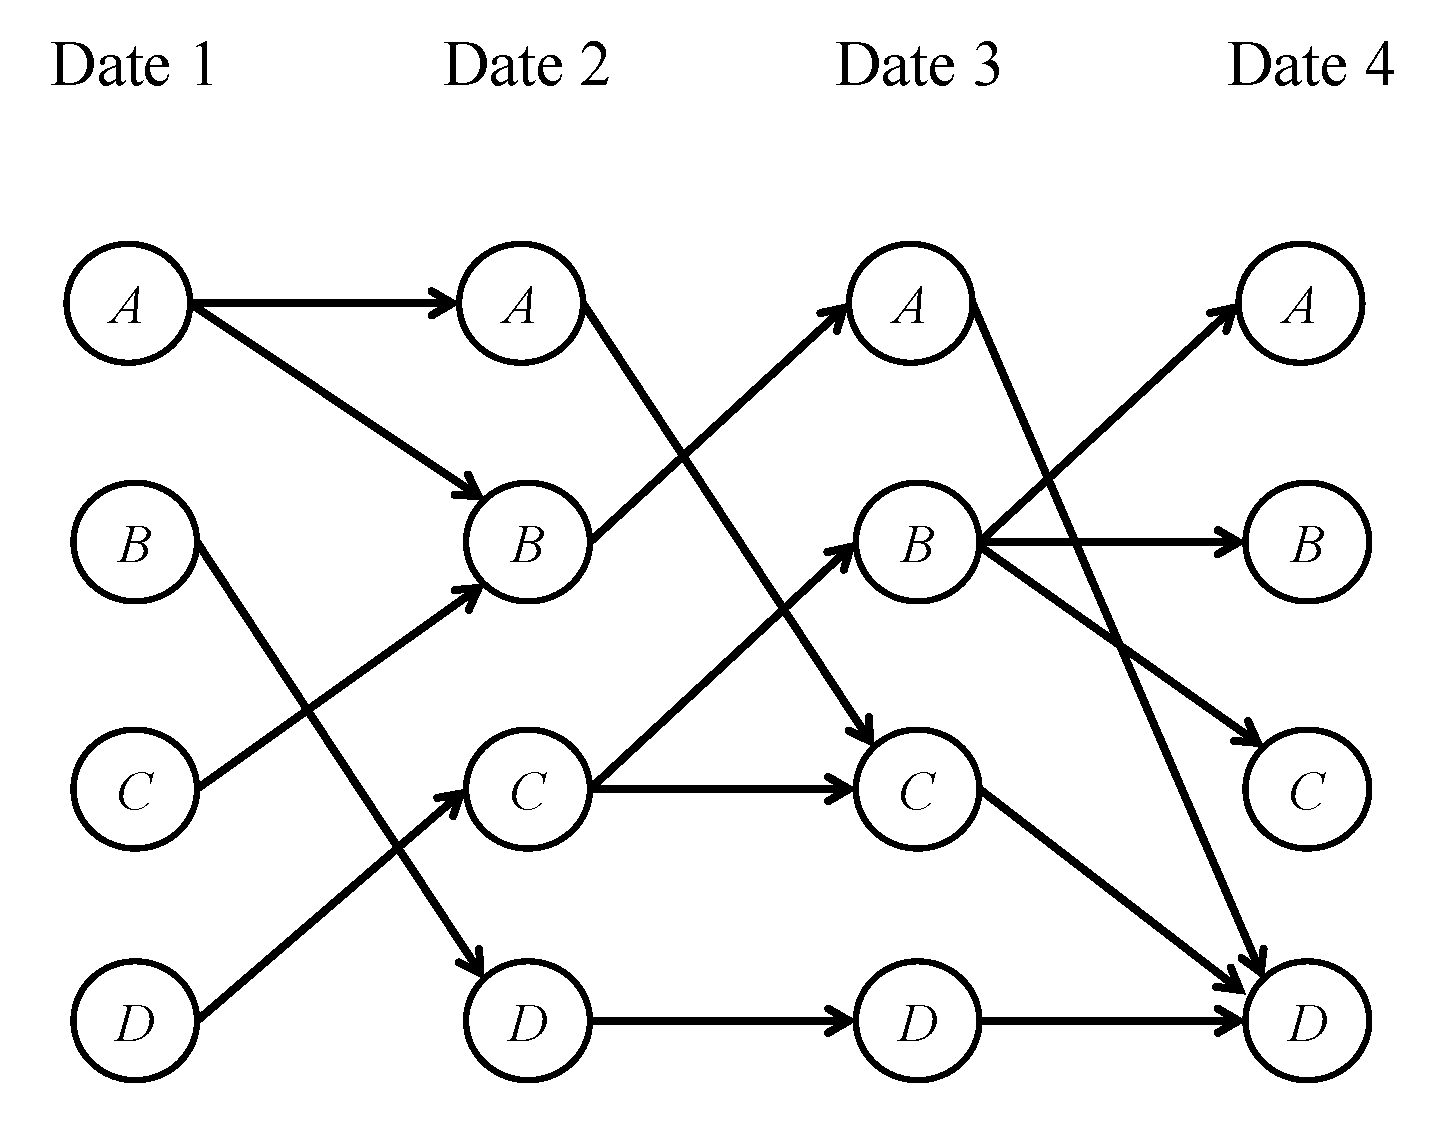
2.2. Modelling Crop Dynamics

All approaches described in the prior section employ feature/image stacking to capture temporal context. In this work, we propose a post-classification stage to enforce prior knowledge about the temporal dynamics of crop types in the imaged region. The method, called Most Likely Class Sequence (MLCS), was inspired by an earlier work, in which the crop dynamics in a given image site was represented by a hidden Markov model [32].
Crops over time can be represented by a directed graphical model like the one shown in Figure 1, where y i stands for the crop class, and x i denotes the observation vector at date i, for i = { 1 , . . . , T } .
According to this graphical model, the posterior probability that a particular sequence of crop classes ( y 1 , y 2 , . . . , y T ) occurs in a given image site over T dates, is given by:
p ( y 1 , y 2 , . . . , y T | x ) p ( y 1 ) p ( x 1 | y 1 ) p ( y 2 | y 1 ) p ( x 2 | y 2 ) . . . p ( x T 1 | y T 1 ) p ( y T | y T 1 ) p ( x T | y T )
where p ( x i | y i ) is the likelihood of x i given the crop class y i at date i, p ( y i + 1 | y i ) is the crop transition probability from date i to i + 1 , x = { x 1 , . . . , x T } is the set of observations over the sequence, and p ( y i ) denotes the prior class probability at date i, for all i. Making use of the Bayes rule, i.e.,
p ( x i | y i ) = p ( y i | x i ) p ( x i ) / p ( y i )
and introducing in the relation (1) the simplifying assumption that the classes are equiprobable at any date, we obtain:
p ( y 1 , y 2 , . . . , y T | x ) p ( y 1 | x 1 ) p ( y 2 | y 1 ) p ( y 2 | x 2 ) . . . p ( y T 1 | x T 1 ) p ( y T | y T 1 ) p ( y T | x T )
The final classification result will be the sequence ( y ^ 1 , y ^ 2 , . . . , y ^ T ) that corresponds to the highest posterior, formally:
( y ^ 1 , y ^ 2 , . . . , y ^ T ) = arg max { y i } [ p ( y 1 | x 1 ) p ( y 2 | y 1 ) . . . p ( y T 1 | y T ) p ( y T | x T ) ]
The posterior probabilities p ( y i | x i ) can be calculated by any discriminative classifier, in particular the ones described in the previous section.
As for the transition probabilities p ( y i | y i 1 ) , we propose to exploit prior knowledge. Human experts on crop dynamics in the target site may inform the crop transitions that might or never occur for each pair of consecutive dates. For instance, under a proper temporal resolution, a change from m a i z e to s o y b e a n must necessarily go through the class s o i l . Hence, the transition m a i z e s o y b e a n cannot occur on two consecutive dates.
Estimating the probabilities of possible transitions is not an easy task. Even experienced experts may find it difficult to choose a value between zero and one that accurately represents the probability of each possible transition. Considering this difficulty, we propose to replace the transition probabilities p ( y i | y i 1 ) by one, if the transition y i 1 y i is possible, and by zero otherwise. If the image stacking technique is used, we further replace p ( y i | x i ) by p ( y i | x ) . Introducing these modifications in Equation (5) yields:
( y ^ 1 , y ^ 2 , . . . , y ^ T ) = arg max p o s s i b l e { y i } [ p ( y 1 | x ) . . . p ( y T | x ) ]
whereby only sequences with no forbidden class transition are considered. In relation to the methods discussed in the preceding section, Equation (5) merely discards as a potential solution every sequence containing at least one impossible transition.
The crop dynamics model can be pictorially represented by a Markov chain as in Figure 2, for four classes ( A , B , C , D ) and four dates. Columns correspond to dates and rows to crop classes. Therefore, the nodes represent a crop class on a particular date. The edges identify possible class transitions on adjacent dates. From this graph, we can infer the set of admissible sequences to be evaluated in the computation of Equation (5). In this way, we reduce the number of sequences to be evaluated. As an example, any sequence involving a transition A B on Dates 2–3 will be disregarded, because there is no edge connecting these classes on Dates 2 and 3.
Beyond eliminating sequences inconsistent with the prior knowledge, the method can potentially improve the classification accuracy. However, this simple form of the method still admits wrong solutions since it only enforces consistency over two consecutive dates. Figure 3a shows a simplified example where a wrong solution is not prevented by the aforesaid dynamics model. Let us assume that the only two possible class sequences in the target site are the ones shown in the upper part of the figure (reference sequences). Both sequences consist of class A occurring in three consecutive dates, but shifted in time. Notice that in this example, transition B A between Dates 2 and 3 and transition A A between Dates 3 and 4 are permitted. Such a model would allow solutions other than the ones enrolled as admissible. Starting either from class A or class B on Date 1, the possible sequences can contain a wrong temporal path after Date 3, allowing a sequence consisting of class A from Dates 1–5, as well as a sequence with class A only om Date 3 preceded and followed by class B. In both cases, the sequences would be inconsistent with the known crop dynamics.
In order to avoid these kinds of errors, we refined the MLCS model (see Figure 3b) by taking into consideration the crops’ sequence lengths. After posterior probabilities are calculated, each crop type is divided into a number of subclasses that correspond to the number of times a particular crop type can occur consecutively within a sequence. Taking, for instance, the reference sequences in Figure 3b, the new (sub)class labels would be: A 1 A 2 A 3 B 1 B 2 , for Reference Sequence 1; and B 1 B 2 A 1 A 2 A 3 , for Reference Sequence 2. With this refinement, the transition matrix between Dates 3 and 4 only accepts as possible transitions: A 3 B 1 and A 1 A 2 , thus preventing the aforementioned incorrect paths (see Figure 3b, middle).
Moreover, in the computation of Equation (3), the posterior probability of a subclass is set equal to the posterior probability of the crop type with which it is associated. For example, the posterior probabilities of subclasses A 1 , A 2 , A 3 and B 1 , B 2 , on Date 3, are set equal to the posterior probabilities calculated on that date for classes A and B, respectively. The same applies to all dates.
After following the algorithm described above, all subclasses are grouped back into their original crop types. In the example, subclasses A 1 , A 2 , A 3 and B 1 , B 2 are relabeled as classes A and B, respectively (see Figure 3b, bottom).

2.3. Dataset and Study Site

In order to evaluate the proposed classification schemes for tropical regions we carried out experiments on a public dataset called Campo Verde dataset, available in IEEE DataPort at https://ieee-dataport.org/documents/campo-verde-database.
The experimental site was situated in Campo Verde, a municipality in the state of Mato Grosso in the central west region of Brazil (1532 48 S, 5510 08 W) (see Figure 4). The average annual precipitation is 1726 mm, and the average annual temperature is 22.3 C. The major crops found in this area are soybean, maize and cotton. Some minor crops, such as beans and sorghum, are also present. The class Non-Commercial Crops (NCC) includes millet, Brachiaria, and Crotalaria. Other classes present in the dataset are pasture, eucalyptus, uncultivated soil (e.g., bare soil, soil with weeds, soil with crop residues), turfgrass, and Cerrado (Brazilian savanna). The site covers an extension of 4782 km 2 .
This study relies on a dataset that contains a series of 14 pre-processed SAR Sentinel-1A images and the reference data (ground truth) for a total of 513 fields (∼6 million pixels). The SAR images were dual polarized (VV and VH) and were captured from October 2015–July 2016 (see Table 1).
Sentinel-1A is a polar-orbiting satellite that carries a 12 m-long advanced SAR working in the C-band. To cover the Campo Verde municipality along the crop year 2015/2016, 27 Sentinel-1 images were originally acquired in the Interferometric Wide Swath Level-1 Mode, with a swath of 250 km and a geometric resolution of 20 m. Two images per date were necessary to cover the whole municipality area, except for the image of 21 January, which covered the entire area of interest, resulting in a sequence of 14 images. The images were acquired from the Sentinels Scientific Data Hub, in Level-1 Ground Range Detected (GRD), and preprocessed using the Sentinel-1 Toolbox. First, a radiometric correction was performed, using the calibration coefficients provided with the Sentinel Level-1 products. Then, a range Doppler terrain correction was applied using a Shuttle Radar Topography Mission (SRTM) Digital Elevation Model (DEM). Next, the VV and VH bands in linear scale were converted to dB. The bands were stacked to form single images, which were then georeferenced to the UTM projection (Zone 21S) and WGS84 Datum and resampled to 10-m spatial resolution.
Further details on the dataset, and particularly on the process used to produce the reference data, can be found in [5].
The crop year spans from late August to July with two seeding periods. The phenological cycles of the main crops can span 3–4 months (soybeans and maize) and 4–6 months (cotton). Figure 5 shows the crop calendar for the major crops and illustrates how complex the crop dynamics is in this region. Some crop rotations present in the dataset are soybeans-maize, soybeans-cotton, soybeans-sorghum, soybeans-pasture, soybeans-beans, beans-cotton, and maize-cotton. Figure 6 shows how the area is distributed among different crops along the months. The graph shows that the cycle of the same crop, e.g., soybean, does not start in the same month in all fields, and its duration can also vary from one field to another. As mentioned before, such crop dynamics is characteristic of tropical regions.

2.4. Implementation of Classification Approaches

The hyperparameters of each DL method were defined empirically. The DL frameworks’ batch sizes were selected experimentally and fixed to 128 for AEpatch and CNNpatch and 32 for the FCNpixel. For optimization, we used the AdaGrad method with a learning rate of 0.01. The implementation details of each approach are described in the following.

2.4.1. RFpixel

For the RFpixel approach, hand-crafted features were used. Following [51], we computed texture features (correlation, homogeneity, mean, and variance) from Gray-Level Co-occurrence Matrices (GLCM) in four directions (0, 45, 90, and 135 degrees) using 7 × 7 windows per polarization (VV and VH in this case). We tested three window sizes (3, 5, 7 pixels) and decided to use 7 × 7 regions since a better performance was observed with this dimension. This approach yielded 32-dimensional feature vectors for each pixel on each date. After some initial tests, the RF classifier was fixed to 250 random trees with a maximum depth of 25.

2.4.2. AEpatch

Patches from the original images were selected as input features. Based on preliminary tests, we decided to take patches with 7 × 7 pixels as the input to the AE; thus, the final vector comprised 7 × 7 × 2 elements, which amounted to 98 features for each image. The patches were flattened into one-dimensional vectors, standardized to zero mean and unit variance. The hidden layer was composed of 128 neurons, with the t a n h activation function and an L 1 regularization fixed to 0 . 001 . The feature maps obtained this way were the inputs to an RF classifier, as described before.

2.4.3. CNNpatch

The network took as input a patch and assigned class posterior probabilities to the central pixel of the patch. Patches from the original images were selected as primary input features. After having tested square patches of a width/height equal to 5, 7, 9, and 16, we decided to work with 7 × 7 patches, because they delivered the best tradeoff, considering accuracy and memory requirements. The downsampling stage was built with 3 × 3 convolution filers, using ReLU as the activation function, followed by a 2 × 2 max pooling. Since the patch size was set to 7 × 7 , we implemented a shallow CNN architecture with only one downsampling stage. The convolution stride was fixed to one pixel. Spatial padding was employed in order to preserve the spatial dimension after convolution. At the end, a fully-connected layer with a dropout of 20 % followed by a softmax layer were added. The aforementioned architecture was the same for all dates in the dataset. However, the number of parameters of each network (for each date) depended on the image sequence length and the number of classes present on the target date. For example, Table 2 summarizes the model that corresponds to July 2016, with inputs consisting of a stack of 14 images (i.e., 28 channels) and nine classes, as soybean and beans crops were not present in the study area during that period. Hence, the output of the network during that month was a posterior class probability vector of size nine.

2.4.4. FCNpixel

As in [48], the FCNpixel consists of two downsampling and upsampling stages. Each downsampling step is implemented as a Dense Block (DB), followed by a convolution and a max-pooling layer. A DB corresponds to the concatenation of an earlier feature map with the last convolution output forming a data cube, which is then submitted to a convolution operation [58]. The DB architecture used in the downsampling path was composed of two convolutional steps, whereby the input of a DB was concatenated with its output. From then on, two upsampling layers restored the original resolution, and a final convolution layer computed the class scores. Contrary to [48], each upsampling stage was designed with a DB followed by a deconvolution (previous experiments were performed, and this configuration achieved best results compared to the original). Each of these DB comprised two convolutional steps, but unlike the downsampling ones, their input was not concatenated with their output. By skipping this concatenation step, we reduced the number of learnable parameters in an attempt to avoid overfitting, as proposed in [58]. Since FCNpixel is a more complex model, we present a general description of the architecture in Figure 7.
Patches from the original images were selected as input features. Since our reference is not dense (i.e., some pixels are unassigned) we labeled background pixels with a constant value. In order to exploit the advantages of the FCN architecture, large patches were considered, specifically of size 16, 32, 64, and 128 pixels. Preliminary experiments showed that 32 × 32 pixel patches delivered the best results. As in CNNpatch approach, the basic network architecture was the same for all dates, but the number of parameters depends on the image sequence length and the number of classes at the target date. Table 3 summarizes the model that corresponds to July 2016, with inputs consisting of a stack of 14 images (i.e., 28 channels) and 10 classes (the 9 classes present on that epoch, plus a background class). The basic network architecture is as follows. First, an initial convolution was applied with zero padding (Conv-1), followed by the two dense block (DB-1 and DB-2) and two downsampling stages (DS-1 and DS-2). Each downsampling stage was composed of Batch Normalization (BN), ReLU activation, 1 × 1 convolution, dropout of 20%, and 2 × 2 average pooling. DB layers were composed of BN, followed by ReLU, a 3 × 3 convolution, and dropout with probability 20%. The growth rate of the DB layers was set to k = 16 (for more information about the dense block, refer to [58]).
The final volume after these operations can be understood as the encoded representation of the input patch in a coarse map of crop types present in the patch. This spatial map (after two downsampling blocks, the original 32 × 32 image patch was reduced to an 8 × 8 map of activations) was then upsampled back to the original input patch size through the two upsampling stages mentioned above composed of two DB (DB-3 and DB-4) and two 3 × 3 Transposed Convolutions with stride two and skip connections (TConv-1 and TConv-2). At the end, a 1 × 1 convolution with softmax activation (Conv-2) delivered the class score for all pixels within the patch.

2.5. Training and Validation Sample Sets

As mentioned before, the original reference data consisted of 513 crop fields, but in order to produce training and validation sets with at least one field for each class, some fields were split up, thus generating a total of 608 fields. To avoid pixels from the same field falling in the training and validation sets, the selection was performed at the crop field level: we selected the image from December 2015, which included all classes, and used it as a reference for sample selection. Two disjoint sets of fields were then selected, one for training and the other for validation, using stratified random sampling.
Approximately 50% of the polygons of each class were selected for training and the other 50% for validation. In order to balance the number of training samples for all classes, we defined a maximum number of training samples per class, N S . For classes with less than N S samples, we replicated samples until the threshold was reached. For classes with larger numbers of samples, exactly N S samples were randomly selected.
It is worth noting that for the RFpixel method, each sample corresponded to a pixel, and N S was set to 130,000, whereas for the other methods, each sample was associated with an image patch. For the AEpatch and CNNpatch methods, patch labels corresponded to the class of the central pixel, and N S was also set to 130,000. For FCNpixel, since each pixel had a different label inside a patch, the balancing procedure considered the group of different classes in each patch. In this case, N S was set to 300 patches per group of classes.
The input patches for all DL methods were standardized with zero mean and unit variance. For the FCNpixel approach, image regions not labeled in the dataset (background) were set to a constant value.

2.6. Accuracy Assessment

The performance of the evaluated methods was expressed in terms of Overall Accuracy (OA) and F1 score (F1). A brief description of these metrics is given below (more details can be found in [59]).
The confusion matrix records correctly- and incorrectly-recognized examples for each class. Table 4 presents the matrix in mathematical terms. The true classes are denoted as C i ( 1 i h ) , whereas the estimated classes defined by the classifier are denoted as C j ^ ( 1 j h ) .
The terms c m i j ( 1 i , j h ) denote the number of samples recognized as class i in the classification map, when they actually belong to class j in the reference data. Consequently, diagonal terms ( i = j ) correspond to correctly-classified samples, and the off-diagonal ( i j ) terms represent incorrectly-classified ones. The sums of the confusion matrix elements over row i and column j are denoted as c m i + and c m + j , respectively.
The Overall Accuracy (OA) represents the proportion of correctly-classified samples with respect to reference data. Thus, OA is a global measure of accuracy, so it depends on larger classes. This measure ranges from 0 (perfect misclassification) to 1 (perfect classification) and can be stated as the trace of the confusion matrix divided by the total number c m of classified instances:
O A = i = 1 h c m i i c m
The Producer’s Accuracy (PA) value represents the probability that a certain class in the reference is correctly classified. The PA for the class C j can be computed by:
P A C j = c m j j c m + j
The User’s Accuracy (UA) represents the probability that a pixel classified into a given class actually represents that class in the reference. The UA for the class C i can be computed by:
U A C i = c m i i c m i +
Finally, the F1 score (F1) is the harmonic mean of UA and PA. F1 is usually more useful than accuracy, especially if the class distribution is uneven. The F1 measure for the class C i can be computed by:
F 1 C i = 2 × P A C i × U A C i P A C i + U A C i

3. Results and Discussion

In this section, we firstly report and discuss the results of a group of experiments that aimed to compare the methods described in Section 2. Two different protocols were considered for all four approaches (RFpixel, AEpatch, CNNpatch, and FCNpixel), as described next. Additionally, an assessment of the improvements brought by the crop dynamics model, as proposed in Section 2.2, was done using only the results from Protocol II.
Protocol I: The main objective of this protocol was to evaluate how the performance of the different approaches, on each date, behaved as more information from the past was exploited. Thus, we classified each image in the dataset taking into account different sequence lengths, which were produced by adding earlier images successively to that target image. For conciseness, we only classified the latest image from each month, instead of the 14 images.
Protocol II: In this protocol, we classified all images within the whole sequence using the whole set of images. The main objective of this protocol was to evaluate the performance of the different approaches on each date, when the information from the past, present, and future was exploited. The images were grouped into nine sets corresponding to the months the ground truth data were available.

3.1. Results for Protocol I

Figure 8 shows the results obtained for RFpixel, AEpatch, CNNpatch, and FCNpixel in experiments conducted according to Protocol I in terms of average F1 (grayish bars) and OA (blueish bars) for each image. Each bar group corresponds to the classification accuracy of the latest image in the dataset at the acquisition month indicated on the horizontal axis (i.e., “Oct” corresponds to 29 October, “Nov” corresponds to 22 November, and so on). The bars within a group represent different sequence lengths. Thus, the leftmost bar of each group corresponds to a single image, the one being classified. The bars to the right indicate the classification performance of the same target image when earlier images were added to the input. Notice that the leftmost group has only the classification for October, the earliest image in the dataset. The rightmost group has 14 bars, corresponding to the maximum number of images in the database.
The plots show that accuracy increased as prior images were added to the sequence. This held true for both metrics in almost all experiments on RFpixel, AEpatch, and CNNpatch. Few exceptions came about in the three leftmost groups for longer sequences. In some cases, the inclusion of one more image to the sequence brought no improvement or was slightly deleterious. This behavior can be understood by considering Figure 6. Prior to March, soybean was the dominant crop, which was replaced in March by maize and cotton. Thus, for some fields, pre-March data added no useful information to discriminate prevailing crops much later in the sequence. For RFpixel, AEpatch, and CNNpatch, the improvement was generally significant for sequences with 2–6 images, staying nearly constant for longer sequences.
FCNpixel showed a somewhat different behavior, being the most accurate approach for short sequences (almost all images reached more than 60% in terms of OA for sequences containing one or two images) and the less accurate one for longer sequences. In spite of comparatively higher values for OA, the average F1 values were lower due to low accuracies for the minority classes. Recall that for RFpixel, AEpatch, and CNNpatch sample replication helped mitigate the class imbalance in the training set. However, FCNpixel classifies all pixels in a patch, and not only the center pixel, and some classes may be a minority even in the patches where they come about. This is illustrated in Figure 9 for the class beans, which was weakly represented in our dataset. In such cases, patch replication was less effective to mitigate class imbalance for FCNpixel.
Figure 10 presents details of the prediction maps produced by the four approaches for the last image of May (i.e., 20 May), when the accuracy of FCNpixel started declining. For conciseness, we show the results for sequence lengths of 1, 3, 7, and 11 only. Clearly, temporal information improved performance for all approaches, FCNpixel being the most accurate one for shorter sequences, as we mentioned before. A comparison of the results for each sequence separately revealed that FCNpixel tended to produce smoother results when compared with its counterparts. The salt-and-pepper pattern was indeed less apparent in FCNpixel results than in the other methods. However, this effect was in some cases deleterious because the misclassified spots were broadened, rather than eliminated.
Such behavior is due to the particularities of FCNpixel when applied to our problem. With the exception of FCNpixel, all tested methods adopted the sliding window approach, whereby a class was assigned to the central pixel. Thus, the classification of each pixel exploited a different neighborhood or context, even considering that windows of close pixels has a large overlap. In contrast, for FCNpixel, all pixels inside a patch shared exactly the same context. In addition, FCNpixel learns the class structure within the patches. Since most patches selected for training comprised a single class, FCNpixel tended to assign the same class to most pixels in the patch, producing a “patchy” outcome.
Most errors refer to three minority classes: beans, sorghum, and turfgrass. In fact, beans and turfgrass were not recognized at all, rendering F1-scores equal to zero. Actually, beans was not recognized by FCNpixel in any experiment. Other errors occurred among pasture-eucalyptus-Cerrado, which were related to the similarity of the backscatter response among these crops.

3.2. Results for Protocol II

Figure 11 shows the results of experiments carried out following Protocol II. The conclusions drawn from Protocol I were confirmed by the data in Figure 11. Furthermore, we confirmed the expectation that the exploitation of data on later dates, in addition to the previous dates, improved the precision of the generated crop maps. Figure 11 provides a clearer view about the relative performance of the tested methods. First, the results revealed that RFpatch consistently outperformed AEpatch both in terms of OA and average F1-score, however by a low margin. Second, FCNpixel delivered the lowest average F1-scores on all dates, essentially because of the same reasons raised in the previous section. Third, RFpatch and CNNpatch alternated as the best performing methods in almost all months. Recall that CNNpatch learns features in an end-to-end way, whereas RFpatch relies on engineered features. Therefore, training the random forest classifier was computationally remarkably less demanding than for a CNN. Additionally, random forests typically require much less labeled samples for training than CNN.
Figure 12 presents examples of the results predicted by the four approaches. For conciseness, we show the results for November, December, May, and June only. Notice that the prediction maps were more accurate for more abundant classes: soil for November, soybeans for December, maize and cotton for May and June. The first and second rows of Figure 12, referring to November 2015 and December 2015, show a kind of classification error that occurred quite often in our experiments. Notice that all methods assigned most pixels of a parcel erroneously to the class soybean in November 2015, whereas the ground truth (left most column) was soil. On the next date (December 2015), most parcels moved to class soybean. Between November and December 2015, it was the soybean seeding time, which did not happen on exactly the same date for all parcels. In this period of time, soybean was in some parcels in its early growing stages and could easily be confused with soil. A similar problem came about around the harvest time. This is shown for example in the third and forth rows of Figure 12 referring to May 2016 and June 2016. According to the reference data, the parcel on the upper right part of the imaged region moved from maize to soil. However, most methods misclassified parts of this parcel in June 2016 as if they still were maize.

3.3. Assessment of the crop dynamics model

The MLCS method essentially rejects solutions that imply sequences that conflict with previous knowledge about class dynamics. We first checked the number of different class sequences prior to and after the application of MLCS. Table 5 shows the results. In fact, the number of sequences after MLCS fell by up to 145 times.
The important thing is to assess how this affects the accuracy. Figure 13 shows the percentage of errors corrected by the MLCS post-processing algorithm in relation to the aforementioned methods for each month. Clearly, the MLCS post-processing brought benefits for all methods. Between 0.5% and 16.5% of the errors produced by each method on different dates were corrected by MLCS. RFpixel and AEpatch were the methods that least benefited from MLCS, whereas FCNpixel consistently presented the highest improvements, followed by CNNpatch.
Figure 14 presents the gains brought by MLCS in terms of average F1 score for classes covering at least 2% of the target area, specifically soybean, maize, cotton, pasture, eucalyptus, and Cerrado. Soil was not considered, as it represents a transition between crop classes. Similarly, we disregarded NCC because it encompasses a number of different crop classes. In terms of F1 score, FCNpixel presented the highest improvements, followed by CNNpatch, RFpixel, and AEpatch. Nonetheless, the F1 score decreased slightly in March for RFpixel and more sharply for AEpatch. Looking at the results for each class individually, we realized that MLCS increased the F1-score AEpatch of all classes with the exception of Cerrado, which was responsible for the observed drop in the average F1-score.
Figure 15 summarizes the results of Figure 11 and Figure 13. As stated before, the enforcement of prior knowledge by MLCS was beneficial on all dates in terms of OA. Similarly, Figure 16 summarizes Figure 14 and Figure 16, whereby in this case, the average F1 score considered all classes. As explained before, the MLCS algorithm tended to smooth the results produced by the classifiers. This effect was detrimental on some dates for some minority classes, whose individual F1 score fell, pushing down the F1 average score. This occurred often with beans, turfgrass, and sorghum.
Figure 15 shows that MLCS consistently improved the accuracy in terms of OA. However, Figure 16 reveals that on some dates, the average F1-score decreased for RFpixel and AEpatch. In fact, in our experiments, MLCS improved the classification for most pixels, but in a few cases, it produced the opposite effect. Figure 17a shows one simple example of a misclassification induced by MLCS.
Consider the task of assigning the samples x 1 , x 2 , and x 3 related to the same image site over the dates t 1 , t 2 , and t 3 into one out of three classes (A, B, and C). Let us assume that the sequence AAA is the ground truth (circles with a thick contour), and the posterior probabilities estimated by a generic classifier are shown above each circle in Figure 17. Consider a first approach without MLCS. It consists of choosing the class with the highest posterior on each date. The final result in this case will be ABA (shadowed circles), which corresponds to 67% correctly-classified samples. In a second approach, the posteriors are submitted to MLCS, which discards sequences involving class transitions that conflict with the prior knowledge about class dynamics in the target area. Let’ us assume that AAA, BBB, and CCC are the only admissible sequences, as indicated by the arrows in Figure 17a. The probabilities of each of those sequences is given by the product of the posteriors in each sequence, as shown on the right side of Figure 17a. In this example, MLCS selected CCC (enclosed by a box) as the final solution, classifying erroneously the samples on all dates. Thus, in relation to the first approach, MLCS reduced the accuracy from 67% to 0%. Figure 17b shows a similar example where the posteriors are more concentrated in one class. The first approach predicted classes ABA, as in the prior example. MLCS improved this result and predicted the sequence AAA, which perfectly matched the ground truth. These examples showed that MLCS was generally more effective when the classifiers that estimated the posterior probabilities were more confident in their predictions.
Figure 18 sheds more light on this issue. It presents the classification maps prior to and after MLCS for each tested method for a selected area in February 2016. Figure 18 also presents the probability heat maps for each approach (red: maximum value; yellow: intermediate value; blue: minimum value). The plot shows how MLCS deteriorated the result produced by RFpixel and AEpatch. This was manifested in the increment of class pasture (greenish) within a parcel corresponding to class cotton (greyish). The heat maps in the figure show that these classifiers were not confident about the true class. Contrarily, MLCS improved the results delivered by CNNpath and FCNpixel, which were comparatively more confident about their predictions in the same regions.

4. Conclusions

In this work, three Deep Learning (DL)-based methods for crop recognition from multitemporal SAR image sequences were investigated: Autoencoders (AE), Convolutional Neural Networks (CNN), and Fully-Convolutional Networks (FCN). The AE method combined unsupervised feature learning with a Random Forest (RF) classifier in a pixel-wise analysis. The CNN method used a shallow network for supervised patch-based classification with spatially-independent predictions. Finally, the FCN method implemented a full patch semantic segmentation with structured predictions. As the baseline, we took an RF classifier running on hand-crafted textural features.
The CNN patch-based approach alternated with RF and FCN as the best-performing method in most experiments. Moreover, the CNN approach presented a more stable behavior when compared with FCN. Although the FCN approaches performed close to the other methods, their full potential was not fully exploited in our experiments, mainly due to the difficulty in balancing the number of training samples from minority classes.
For all methods, the accuracy tended to improve as more multitemporal data were added to the input data sequence, until it stabilized. This trend reflected that the method required some amount of temporal data to achieve its full potential. Additionally, the inclusion of data from outside the crop cycle brought no improvement.
This work further introduced a post-classification strategy that enforced prior knowledge about the crop dynamics in the imaged area. It should be emphasized that the strategy consisted of a method for modeling crop dynamics in a geographical region and incorporating the model into an automatic classification process. Therefore, each model created according to the proposed method would always be restricted to a limited geographical area. The extent of the area in which a given model will be valid is an interesting question that exceeds the scope of this paper. However, the modeling strategy was not restricted to any specific area, though its benefits were most evident in areas with complex crop dynamics, such as in tropical regions.
Tests conducted on SAR data of a public dataset from a tropical region with complex crop dynamics demonstrated the effectiveness of the proposed strategy. Indeed, the post classification improved the accuracy by correcting between 0.5% and 16.5% of the errors produced by each method, which implied gains up to 3.2% for OA and 8.7 for the average F1 score.
It should be emphasized that these methods were not restricted to SAR data and can be straightforwardly applied to any multitemporal remote sensing data.

Author Contributions

Experiments and writing, original draft preparation, L.E.C.L.R.; overall study design, R.Q.F.; dataset preparation and experimental analysis, I.D.S.; co-supervision, writing, review and editing, G.A.O.P.d.C. and P.N.H.

Funding

This research received no external funding.

Acknowledgments

This research was supported by Conselho Nacional de Desenvolvimento Científico e Tecnológico (CNPq), by Coordenação de Aperfeiçoamento de Pessoal de Nível Superior (CAPES), and by Fundação de Amparo à Pesquisa do Estado do Rio de Janeiro (FAPERJ).

Conflicts of Interest

The authors declare no conflict of interest.

References

  1. Food and Agriculture Organiztaion of the United Nations. The State of Food Insecurity in the World Meeting the 2015 International Hunger Targets: Taking Stock of Uneven Progress; Working Papers, eSocialSciences; FAO: Rome, Italy, 2015. [Google Scholar]
  2. Tulchinsky, T.H. Micronutrient deficiency conditions: Global health issues. Public Health Rev. 2010, 32, 243. [Google Scholar] [CrossRef]
  3. Nations, U. World Population Prospects: The 2017 Revision, Key Findings and Advance Tables; Working Paper No. ESA/P/WP/248; Department of Economic and Social Affairs, Population Division: New York, NY, USA, 2017. [Google Scholar]
  4. Ramankutty, N.; Mehrabi, Z.; Waha, K.; Jarvis, L.; Kremen, C.; Herrero, M.; Rieseberg, L.H. Trends in global agricultural land use: Implications for environmental health and food security. Ann. Rev. Plant Biol. 2018, 69, 789–815. [Google Scholar] [CrossRef] [PubMed]
  5. Sanches, I.D.; Feitosa, R.Q.; Diaz, P.M.A.; Soares, M.D.; Luiz, A.J.B.; Schultz, B.; Maurano, L.E.P. Campo Verde Database: Seeking to Improve Agricultural Remote Sensing of Tropical Areas. IEEE Geosci. Remote Sens. Lett. 2018, 15, 369–373. [Google Scholar] [CrossRef]
  6. Anderson, J.R. A Land Use and Land Cover Classification System for Use with Remote Sensor Data; US Government Printing Office: Washington, DC, USA, 1976; Volume 964.
  7. Moran, M.S.; Inoue, Y.; Barnes, E. Opportunities and limitations for image-based remote sensing in precision crop management. Remote Sens. Environ. 1997, 61, 319–346. [Google Scholar] [CrossRef]
  8. Panigrahy, S.; Sharma, S. Mapping of crop rotation using multidate Indian Remote Sensing Satellite digital data. ISPRS J. Photogramm. Remote Sens. 1997, 52, 85–91. [Google Scholar] [CrossRef]
  9. Wardlow, B.D.; Egbert, S.L. Large-area crop mapping using time-series MODIS 250 m NDVI data: An assessment for the U.S. Central Great Plains. Remote Sens. Environ. 2008, 112, 1096–1116. [Google Scholar] [CrossRef]
  10. Immitzer, M.; Vuolo, F.; Atzberger, C. First experience with Sentinel-2 data for crop and tree species classifications in central Europe. Remote Sens. 2016, 8, 166. [Google Scholar] [CrossRef]
  11. Lu, D.; Weng, Q. A survey of image classification methods and techniques for improving classification performance. Int. J. Remote Sens. 2007, 28, 823–870. [Google Scholar] [CrossRef]
  12. Belgiu, M.; Csillik, O. Sentinel-2 cropland mapping using pixel-based and object-based time-weighted dynamic time warping analysis. Remote Sens. Environ. 2018, 204, 509–523. [Google Scholar] [CrossRef]
  13. Skakun, S.; Kussul, N.; Shelestov, A.Y.; Lavreniuk, M.; Kussul, O. Efficiency Assessment of Multitemporal C-Band Radarsat-2 Intensity and Landsat-8 Surface Reflectance Satellite Imagery for Crop Classification in Ukraine. IEEE J. Sel. Top. Appl. Earth Obs. Remote Sens. 2016, 9, 3712–3719. [Google Scholar] [CrossRef]
  14. Inglada, J.; Arias, M.; Tardy, B.; Morin, D.; Valero, S.; Hagolle, O.; Dedieu, G.; Sepulcre, G.; Bontemps, S.; Defourny, P. Benchmarking of algorithms for crop type land-cover maps using Sentinel-2 image time series. In Proceedings of the International Geoscience and Remote Sensing Symposium (IGARSS), Milan, Italy, 26–31 July 2015; pp. 3993–3996. [Google Scholar] [CrossRef]
  15. Eberhardt, I.; Schultz, B.; Rizzi, R.; Sanches, I.; Formaggio, A.; Atzberger, C.; Mello, M.; Immitzer, M.; Trabaquini, K.; Foschiera, W.; et al. Cloud cover assessment for operational crop monitoring systems in tropical areas. Remote Sens. 2016, 8, 219. [Google Scholar] [CrossRef]
  16. Henderson, F.M.; Chasan, R.; Portolese, J.; Hart, T., Jr. Evaluation of SAR-optical imagery synthesis techniques in a complex coastal ecosystem. Photogramm. Eng. Remote Sens. 2002, 68, 839–846. [Google Scholar]
  17. Forkuor, G.; Conrad, C.; Thiel, M.; Ullmann, T.; Zoungrana, E. Integration of Optical and Synthetic Aperture Radar Imagery for Improving Crop Mapping in Northwestern Benin, West Africa. Remote Sens. 2014, 6, 6472–6499. [Google Scholar] [CrossRef] [Green Version]
  18. Haack, B. A comparison of land use/cover mapping with varied radar incident angles and seasons. GISci. Remote Sens. 2007, 44, 305–319. [Google Scholar] [CrossRef]
  19. Soria-Ruiz, J.; Fernandez-Ordonez, Y.; McNairn, H. Corn monitoring and crop yield using optical and microwave remote sensing. In Geoscience and Remote Sensing; IntechOpen: London, UK, 2009. [Google Scholar]
  20. Jia, K.; Li, Q.; Tian, Y.; Wu, B.; Zhang, F.; Meng, J. Crop classification using multi-configuration SAR data in the North China Plain. Int. J. Remote Sens. 2012, 33, 170–183. [Google Scholar] [CrossRef]
  21. Atkinson, P.M.; Tatnall, A. Introduction neural networks in remote sensing. Int. J. Remote Sens. 1997, 18, 699–709. [Google Scholar] [CrossRef]
  22. Pal, M. Random forest classifier for remote sensing classification. Int. J. Remote Sens. 2005, 26, 217–222. [Google Scholar] [CrossRef]
  23. Melgani, F.; Bruzzone, L. Classification of hyperspectral remote sensing images with support vector machines. IEEE Trans. Geosci. Remote Sens. 2004, 42, 1778–1790. [Google Scholar] [CrossRef] [Green Version]
  24. Nitze, I.; Schulthess, U.; Asche, H. Comparison of machine learning algorithms random forest, artificial neural network and support vector machine to maximum likelihood for supervised crop type classification. In Proceedings of the 4th GEOBIA, Rio de Janeiro, Brazil, 7–9 May 2012; pp. 7–9. [Google Scholar]
  25. Lucieer, A.; Stein, A.; Fisher, P. Multivariate texture-based segmentation of remotely sensed imagery for extraction of objects and their uncertainty. Int. J. Remote Sens. 2005, 26, 2917–2936. [Google Scholar] [CrossRef]
  26. Ruiz, L.; Fdez-Sarría, A.; Recio, J. Texture feature extraction for classification of remote sensing data using wavelet decomposition: A comparative study. In Proceedings of the 20th ISPRS Congress, Istanbul, Turkey, 12–23 July 2004; Volume 35, pp. 1109–1114. [Google Scholar]
  27. He, D.C.; Wang, L. Texture unit, texture spectrum, and texture analysis. IEEE Trans. Geosci. Remote Sens. 1990, 28, 509–512. [Google Scholar]
  28. Blaschke, T. Object based image analysis for remote sensing. ISPRS J. Photogramm. Remote Sens. 2010, 65, 2–16. [Google Scholar] [CrossRef] [Green Version]
  29. Peña-Barragán, J.M.; Ngugi, M.K.; Plant, R.E.; Six, J. Object-based crop identification using multiple vegetation indices, textural features and crop phenology. Remote Sens. Environ. 2011, 115, 1301–1316. [Google Scholar] [CrossRef]
  30. Melgani, F.; Serpico, S.B. A Markov random field approach to spatio-temporal contextual image classification. IEEE Trans. Geosci. Remote Sens. 2003, 41, 2478–2487. [Google Scholar] [CrossRef]
  31. Achanccaray, P.; Feitosa, R.Q.; Rottensteiner, F.; Sanches, I.; Heipke, C. Spatial-temporal conditional random field based model for crop recognition in tropical regions. In Proceedings of the 2017 IEEE International Geoscience and Remote Sensing Symposium (IGARSS), Fort Worth, TX, USA, 23–28 July 2017; pp. 3007–3010. [Google Scholar]
  32. Leite, P.B.C.; Feitosa, R.Q.; Formaggio, A.R.; da Costa, G.A.O.P.; Pakzad, K.; Sanches, I.D.A. Hidden Markov Models for crop recognition in remote sensing image sequences. Pattern Recognit. Lett. 2011, 32, 19–26. [Google Scholar] [CrossRef]
  33. Siachalou, S.; Mallinis, G.; Tsakiri-Strati, M. A hidden Markov models approach for crop classification: Linking crop phenology to time series of multi-sensor remote sensing data. Remote Sens. 2015, 7, 3633–3650. [Google Scholar] [CrossRef]
  34. Firat, O.; Can, G.; Vural, F.T.Y. Representation learning for contextual object and region detection in remote sensing. In Proceedings of the 2014 22nd International Conference on Pattern Recognition (ICPR), Stockholm, Sweden, 24–28 August 2014; pp. 3708–3713. [Google Scholar]
  35. Romero, A.; Gatta, C.; Camps-Valls, G. Unsupervised deep feature extraction for remote sensing image classification. IEEE Trans. Geosci. Remote Sens. 2016, 54, 1349–1362. [Google Scholar] [CrossRef]
  36. Kussul, N.; Lavreniuk, M.; Skakun, S.; Shelestov, A. Deep Learning Classification of Land Cover and Crop Types Using Remote Sensing Data. IEEE Geosc. Remote Sens. Lett. 2017, 14, 778–782. [Google Scholar] [CrossRef]
  37. Rußwurm, M.; Körner, M. Multi-temporal land cover classification with sequential recurrent encoders. ISPRS Int. J. Geo-Inf. 2018, 7, 129. [Google Scholar] [CrossRef]
  38. Ndikumana, E.; Ho Tong Minh, D.; Baghdadi, N.; Courault, D.; Hossard, L. Deep recurrent neural network for agricultural classification using multitemporal SAR Sentinel-1 for Camargue, France. Remote Sens. 2018, 10, 1217. [Google Scholar] [CrossRef]
  39. Zhong, L.; Hu, L.; Zhou, H. Deep learning based multi-temporal crop classification. Remote Sens. Environ. 2019, 221, 430–443. [Google Scholar] [CrossRef]
  40. Hinton, G.E.; Zemel, R.S. Autoencoders, Minimum Description Length and Helmholtz Free Energy. In Proceedings of the Advances in Neural Information Processing Systems, Denver, CO, USA, 28 November–1 December 1994; pp. 3–10. [Google Scholar]
  41. LeCun, Y.; Boser, B.; Denker, J.S.; Henderson, D.; Howard, R.E.; Hubbard, W.; Jackel, L.D. Backpropagation applied to handwritten zip code recognition. Neural Comput. 1989, 1, 541–551. [Google Scholar] [CrossRef]
  42. LeCun, Y.; Bottou, L.; Bengio, Y.; Haffner, P. Gradient-based learning applied to document recognition. Proc. IEEE 1998, 86, 2278–2324. [Google Scholar] [CrossRef] [Green Version]
  43. Castro, J.D.B.; Feitoza, R.Q.; Rosa, L.C.L.; Diaz, P.M.A.; Sanches, I.D.A. A Comparative Analysis of Deep Learning Techniques for Sub-Tropical Crop Types Recognition from Multitemporal Optical/SAR Image Sequences. In Proceedings of the 2017 30th SIBGRAPI Conference on Graphics, Patterns and Images (SIBGRAPI), Niteroi, Brazil, 17–20 October 2017; pp. 382–389. [Google Scholar] [CrossRef]
  44. Tuia, D.; Volpi, M.; Moser, G. Decision Fusion With Multiple Spatial Supports by Conditional Random Fields. IEEE Trans. Geosci. Remote Sens. 2018, 56, 3277–3289. [Google Scholar] [CrossRef]
  45. Long, J.; Shelhamer, E.; Darrell, T. Fully convolutional networks for semantic segmentation. In Proceedings of the IEEE Conference on Computer Vision and Pattern Recognition, Boston, MA, USA, 7–12 June 2015; pp. 3431–3440. [Google Scholar]
  46. Volpi, M.; Tuia, D. Dense semantic labeling of subdecimeter resolution images with convolutional neural networks. IEEE Trans. Geosci. Remote Sens. 2017, 55, 881–893. [Google Scholar] [CrossRef]
  47. Maggiori, E.; Tarabalka, Y.; Charpiat, G.; Alliez, P. Convolutional neural networks for large-scale remote-sensing image classification. IEEE Trans. Geosci. Remote Sens. 2017, 55, 645–657. [Google Scholar] [CrossRef]
  48. La Rosa, L.E.C.; Happ, P.N.; Feitosa, R.Q. Dense Fully Convolutional Networks for Crop Recognition from Multitemporal SAR Image Sequences. In Proceedings of the IGARSS 2018-2018 IEEE International Geoscience and Remote Sensing Symposium, Valencia, Spain, 22–27 July 2018; pp. 7460–7463. [Google Scholar]
  49. Waldhoff, G.; Curdt, C.; Hoffmeister, D.; Bareth, G. Analysis of Multitemporal and Multisensor Remote Sens. Data for Crop Rotation Mapping. ISPRS Ann. Photogramm. Remote Sens. Spat. Inf. Sci. 2012, I-7, 177–185. [Google Scholar] [CrossRef]
  50. Kussul, N.; Skakun, S.; Shelestov, A.; Kussul, O. The Use of Satellite Sar Imagery to Crop Classification in Ukraine Within Jecam Project Space Research Institute NAS Ukraine and SSA Ukraine; National Technical University of Ukraine “Kyiv Polytechnic Institute”; National University of Life and Environ. In Proceedings of the 2014 IEEE Geoscience and Remote Sensing Symposium, Quebec City, QC, Canada, 13–18 July 2014; pp. 1497–1500. [Google Scholar] [CrossRef]
  51. Kenduiywo, B.K.; Bargiel, D.; Soergel, U. Crop Type Mapping From A Sequence Of Terrasar-X Images with Dynamic Conditional Random Fields. ISPRS Ann. Photogramm. Remote Sens. Spat. Inf. Sci. 2016, 3, 59. [Google Scholar] [CrossRef]
  52. Inglada, J.; Vincent, A.; Arias, M.; Marais-Sicre, C. Improved early crop type identification by joint use of high temporal resolution SAR and optical image time series. Remote Sens. 2016, 8, 362. [Google Scholar] [CrossRef]
  53. Kenduiywo, B.K.; Bargiel, D.; Soergel, U. Higher Order Dynamic Conditional Random Fields Ensemble for Crop Type Classification in Radar Images. IEEE Trans. Geosci. Remote Sens. 2017, 55, 4638–4654. [Google Scholar] [CrossRef]
  54. Kamilaris, A.; Prenafeta-Boldú, F.X. Deep learning in agriculture: A survey. Comput. Electron. Agric. 2018, 147, 70–90. [Google Scholar] [CrossRef] [Green Version]
  55. Bargiel, D. Capabilities of high resolution satellite radar for the detection of semi-natural habitat structures and grasslands in agricultural landscapes. Ecol. Inform. 2013, 13, 9–16. [Google Scholar] [CrossRef]
  56. Sonobe, R.; Tani, H.; Wang, X.; Kobayashi, N.; Shimamura, H. Random forest classification of crop type using multi-temporal TerraSAR-X dual-polarimetric data. Remote Sens. Lett. 2014, 5, 157–164. [Google Scholar] [CrossRef] [Green Version]
  57. Larrañaga, A.; Álvarez-Mozos, J. On the added value of Quad-Pol Data in a multi-temporal crop classification framework based on RADARSAT-2 imagery. Remote Sens. 2016, 8, 335. [Google Scholar] [CrossRef]
  58. Jegou, S.; Drozdzal, M.; Vazquez, D.; Romero, A.; Bengio, Y. The One Hundred Layers Tiramisu: Fully Convolutional DenseNets for Semantic Segmentation. In Proceedings of the IEEE Computer Society Conference on Computer Vision and Pattern Recognition Workshops, Honolulu, HI, USA, 21–26 July 2017; pp. 1175–1183. [Google Scholar] [CrossRef]
  59. Congalton, R.G.; Green, K. Assessing the Accuracy of Remotely Sensed Data: Principles and Practices; CRC press: Boca Raton, FL, USA, 2008. [Google Scholar]
Figure 1. Most Likely Class Sequence (MLCS) Model.
Remotesensing 11 02029 g001
Figure 2. MLCS: example of possible transitions.
Remotesensing 11 02029 g002
Figure 3. (a) Possible wrong solution of MLCS and (b) MLCS refinement with the correct solution after incorporating the crop’s sequence lengths information.
Remotesensing 11 02029 g003
Figure 4. Campo Verde, Brazil(taken with permission from [43]).
Remotesensing 11 02029 g004
Figure 5. Crop calendar for major crops in Campo Verde.
Remotesensing 11 02029 g005
Figure 6. Class occurrences per month in Campo Verde. NCC, Non-Commercial Crops.
Remotesensing 11 02029 g006
Figure 7. FCNpixel architecture.
Remotesensing 11 02029 g007
Figure 8. Performances for different sequence lengths on each date for each method: (a) RFpixel, (b) AEpatch, (c) CNNpatch and (d) FCNpixel. OA (blueish bars) and average F1 (grayish bars).
Remotesensing 11 02029 g008
Figure 9. Example of training patches for the FCNpixel approach for classes beans and maize. The same color legend as in Figure 6: beans (black); maize (yellow); background (white).
Remotesensing 11 02029 g009
Figure 10. Maps of classification results for selected areas for different sequences length in 20 May. GT stands for ground truth. Same color legend as in Figure 6.
Remotesensing 11 02029 g010
Figure 11. OA and average F1-score at each date—Protocol II. From left to right in each bar-group RFpixel, AEpatch, CNNpatch and FCNpixel repectively.
Remotesensing 11 02029 g011
Figure 12. Maps of classification results of Protocol II for selected areas. GT stands for ground truth. Same color legend as in Figure 6.
Remotesensing 11 02029 g012
Figure 13. Percentage of error corrected by MLCS. From left to right in each bar-group RFpixel, AEpatch, CNNpatch, and FCNpixel, respectively.
Remotesensing 11 02029 g013
Figure 14. Average F1 score improvement for crops with more than 2% of the total samples of the dataset. From left to right in each bar-group RFpixel, AEpatch, CNNpatch and FCNpixel, respectively.
Remotesensing 11 02029 g014
Figure 15. OA before and after MLCS algorithm. From left to right in each bar-group RFpixel, AEpatch, CNNpatch and FCNpixel repectively.
Remotesensing 11 02029 g015
Figure 16. Average F1 score before and after MLCS algorithm. From left to right in each bar-group RFpixel, AEpatch, CNNpatch and FCNpixel repectively.
Remotesensing 11 02029 g016
Figure 17. Examples of how MLCS performs: (a) missclassification and (b) correct output. Ground truth (circles with thick borders); maximum probability classes on each date (shadowed circles); final MLCS outcome (box).
Remotesensing 11 02029 g017
Figure 18. Maps of the class output before and after MLCS for each method for selected area on December 2016. GT stands for ground truth and Heatmap Prob for a heat map of the output probabilities. Same color legend as in Figure 6.
Remotesensing 11 02029 g018
Table 1. Sentinel-1 Acquisition dates over Campo Verde.
YearMonthDate
October29
2015November10, 22
December04, 16
January21
February14
2016March09, 21
May08, 20
June13
July07, 21
Table 2. Architecture details of the CNNpatch model: d stands for the input channels, and c stands for the number of classes.
TypeOutput SizeParams
Input 7 × 7 × 28 ( i n p u t s c h a n n e l s ) -
Conv 7 × 7 × 100 70,100
Pool 3 × 3 × 100 -
FC200180,200
Drop200-
Softmax 9 ( c l a s s e s ) 1809
Total-252,109
Table 3. Architecture details of the FCNpixel model. k corresponds to the number of feature maps. d stands for the input channels, and c stands for the number of classes. TConv, Transposed Convolution.
TypeOutput SizeParams
Input 32 × 32 × 28 -
Conv-1 32 × 32 × 48 12,096
DB-1 32 × 32 × 80 16,576
DS-1 16 × 16 × 80 6720
DB-2 16 × 16 × 112 26,048
DS-2 8 × 8 × 112 12,992
DB-3 8 × 8 × 32 35,520
TConv-1 16 × 16 × 144 9248
DB-4 16 × 16 × 32 44,992
TConv-2 32 × 32 × 112 9248
Conv-2 32 × 32 × 10 1120
Total params-174,560
Trainable params-172,512
Table 4. Mathematical example of confusion matrix.
C 1 C 2 ... C h
C 1 ^ c m 11 c m 12 ... c m 1 h
C 2 ^ c m 21 c m 22 ... c m 2 h
...............
C h ^ c m h 1 c m h 2 ... c m h h
Table 5. Total of output sequences before and after MLCS algorithm.
RFpixelAEpatchCNNpatchFCNpixel
Before MLCS15,60917,53234,59116,478
After MLCS183173238252
ReferenceTotal of 71 sequences

