Microphysical Characteristics of Three Convective Events with Intense Rainfall Observed by Polarimetric Radar and Disdrometer in Eastern China

 , , , ,
Abstract
:
1. Introduction
2. Data and Methodology
2.1. The NJU-CPOL Radar and Disdrometer
2.2. Raindrop Size Distribution Parameters
2.3. Hydrometeor Identification Algorithm (HID)
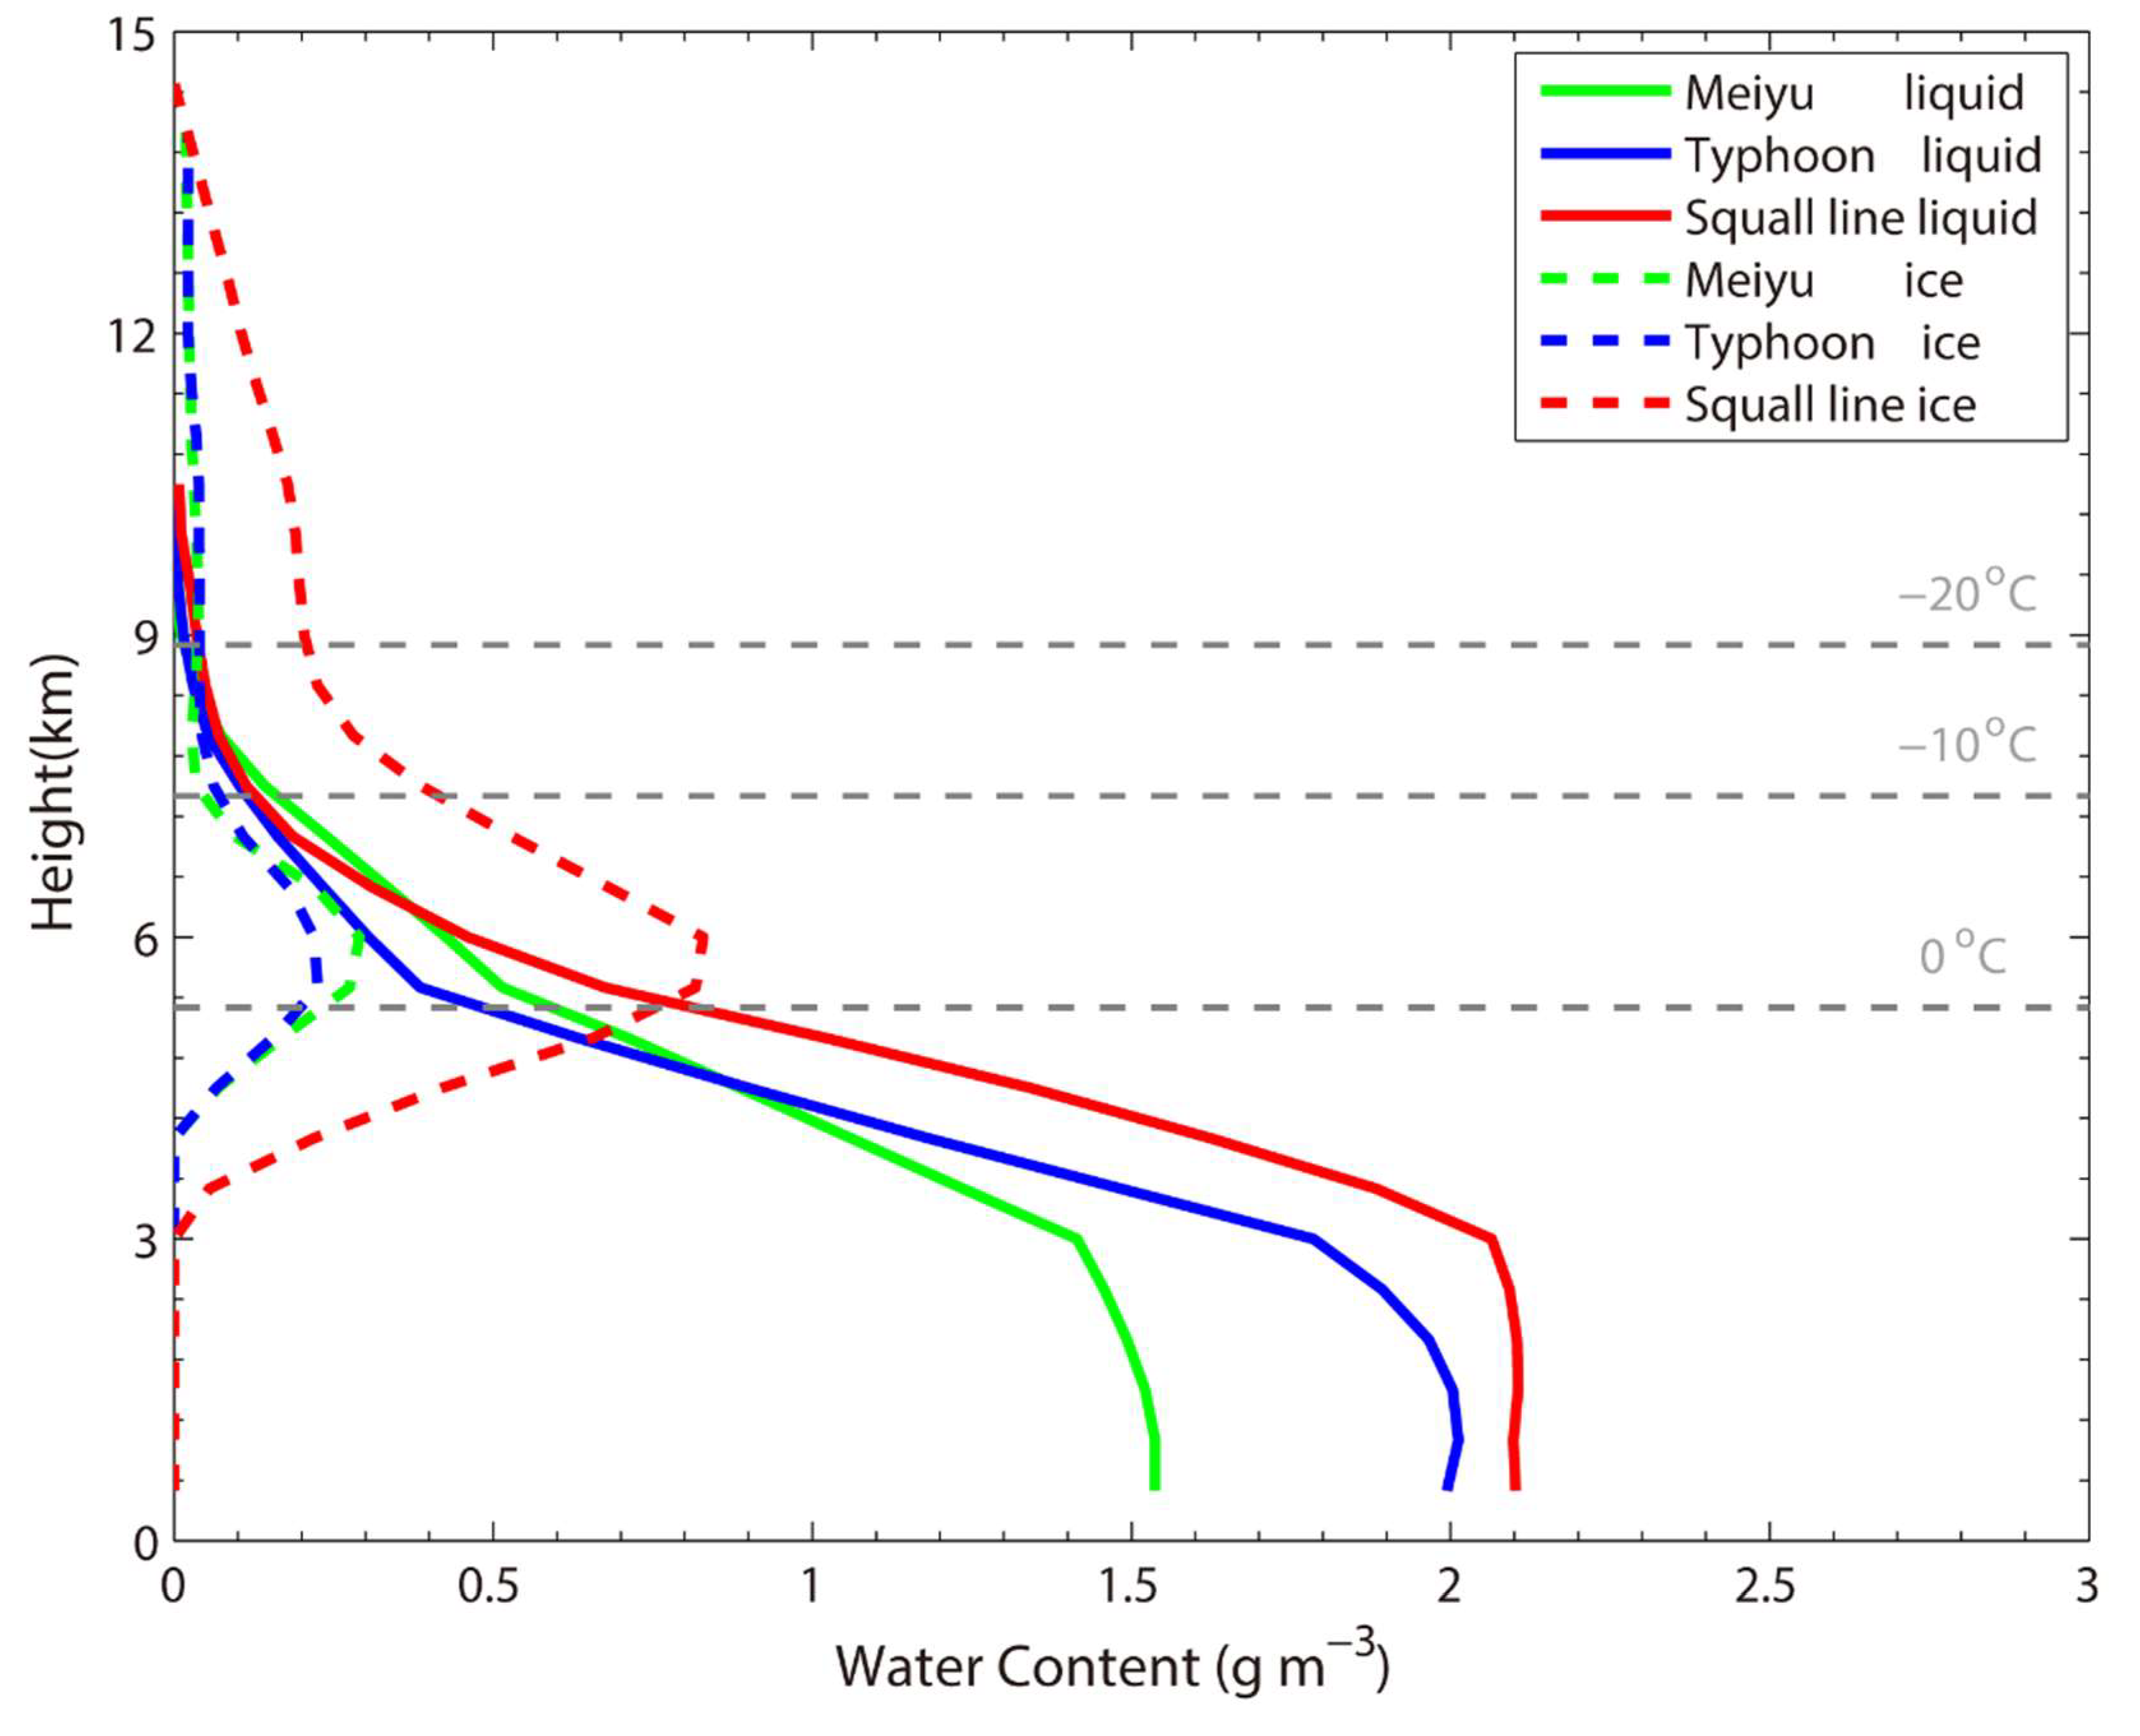
2.4. Rain and Ice Water Content Estimation
3. Results
3.1. Environmental Conditions and OTT-2 Observations
3.1.1. Event Description and Environmental Conditions
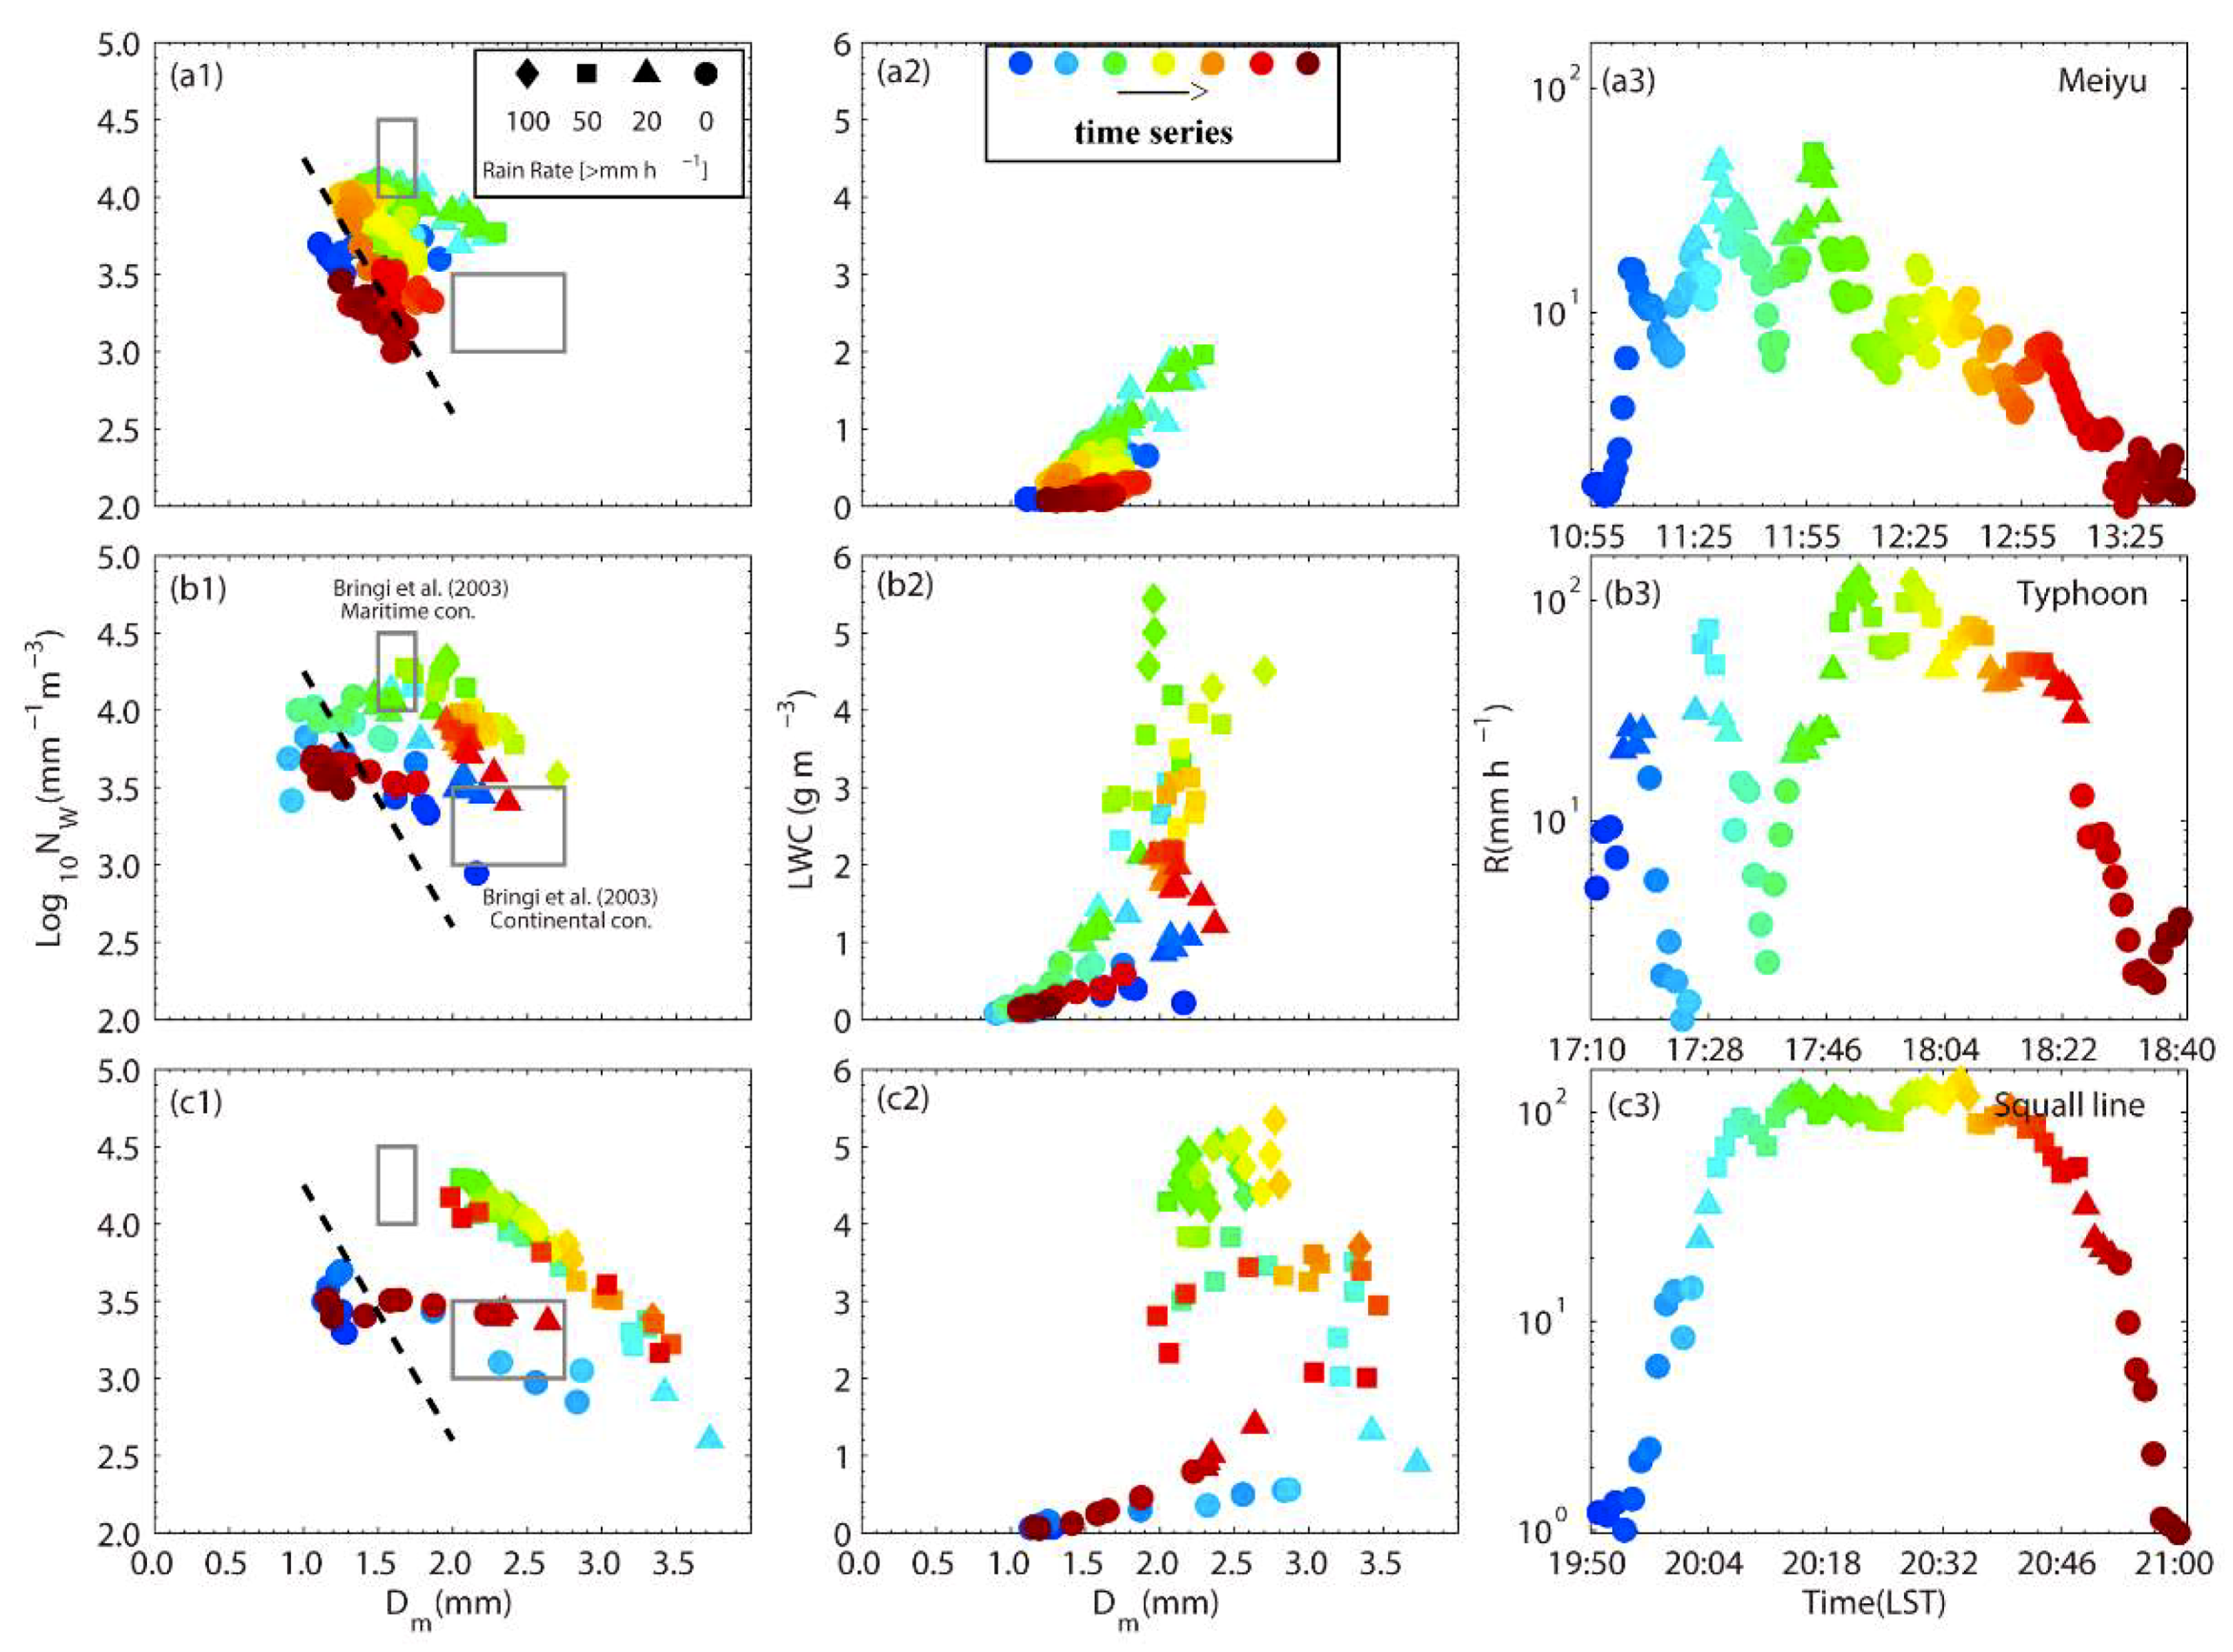
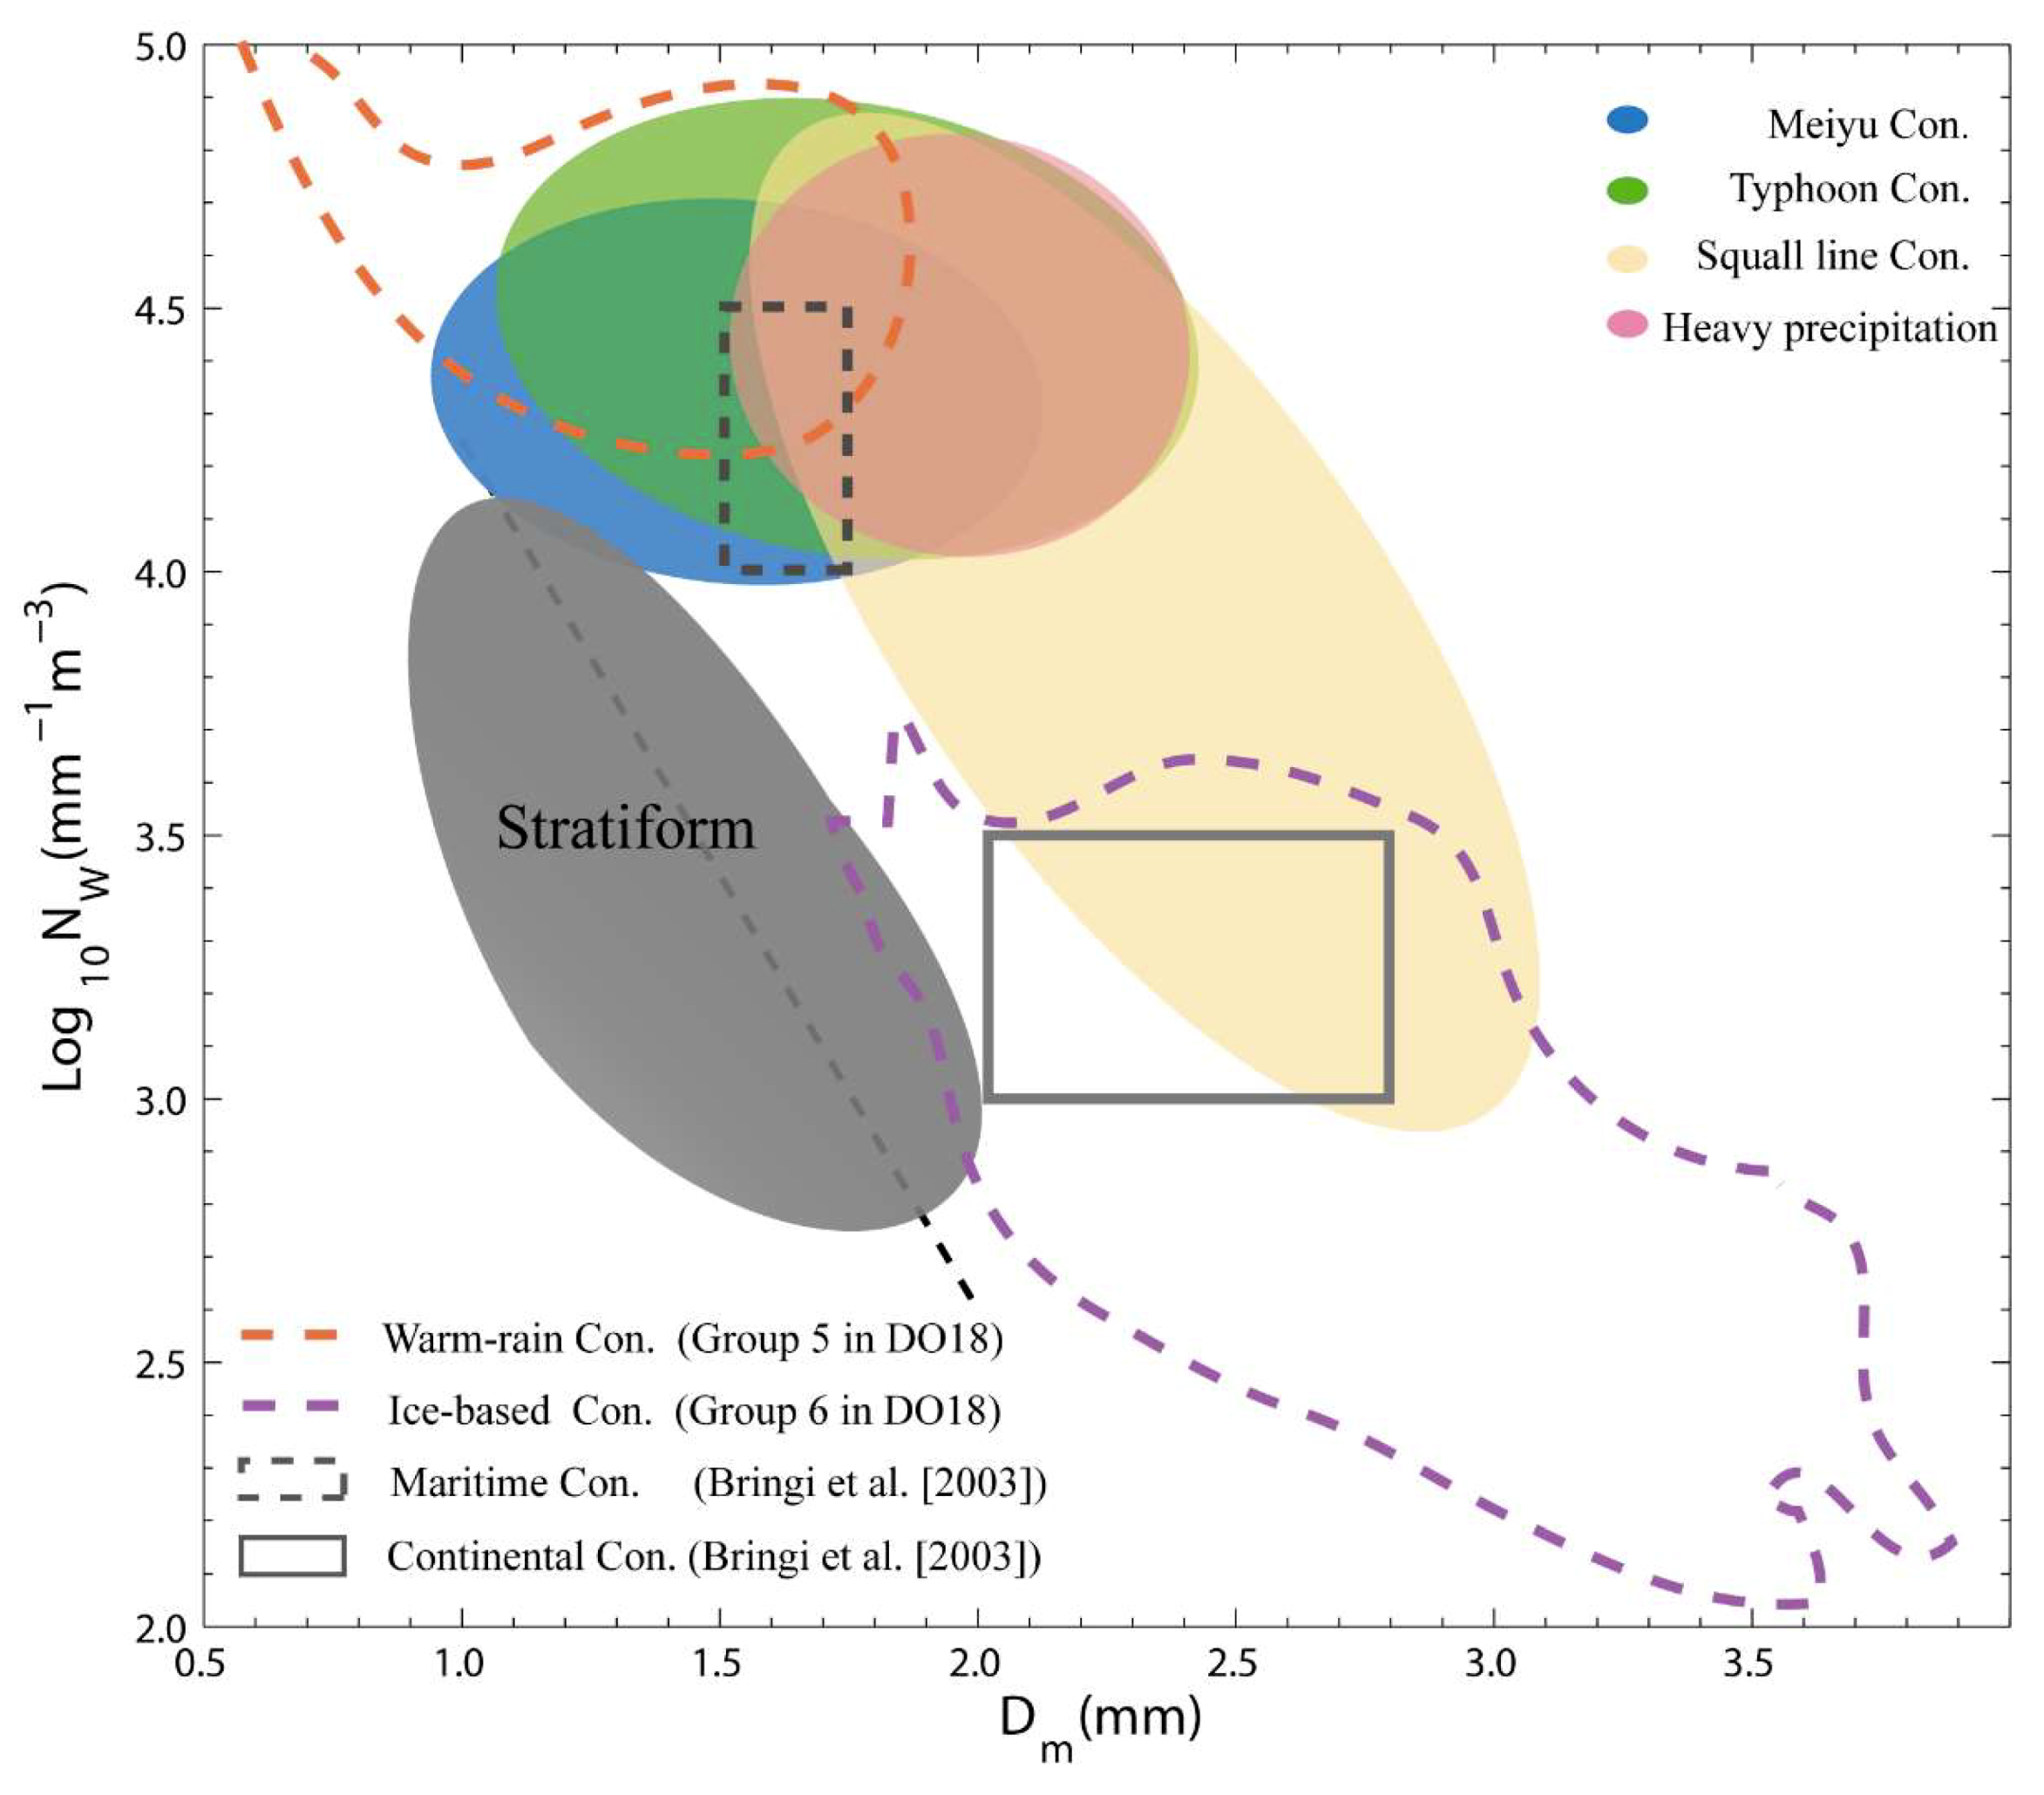
3.1.2. Evolution of Rainfall and Accompanied Drop Size Distributions
3.2. Precipitation Features with Radar Observations
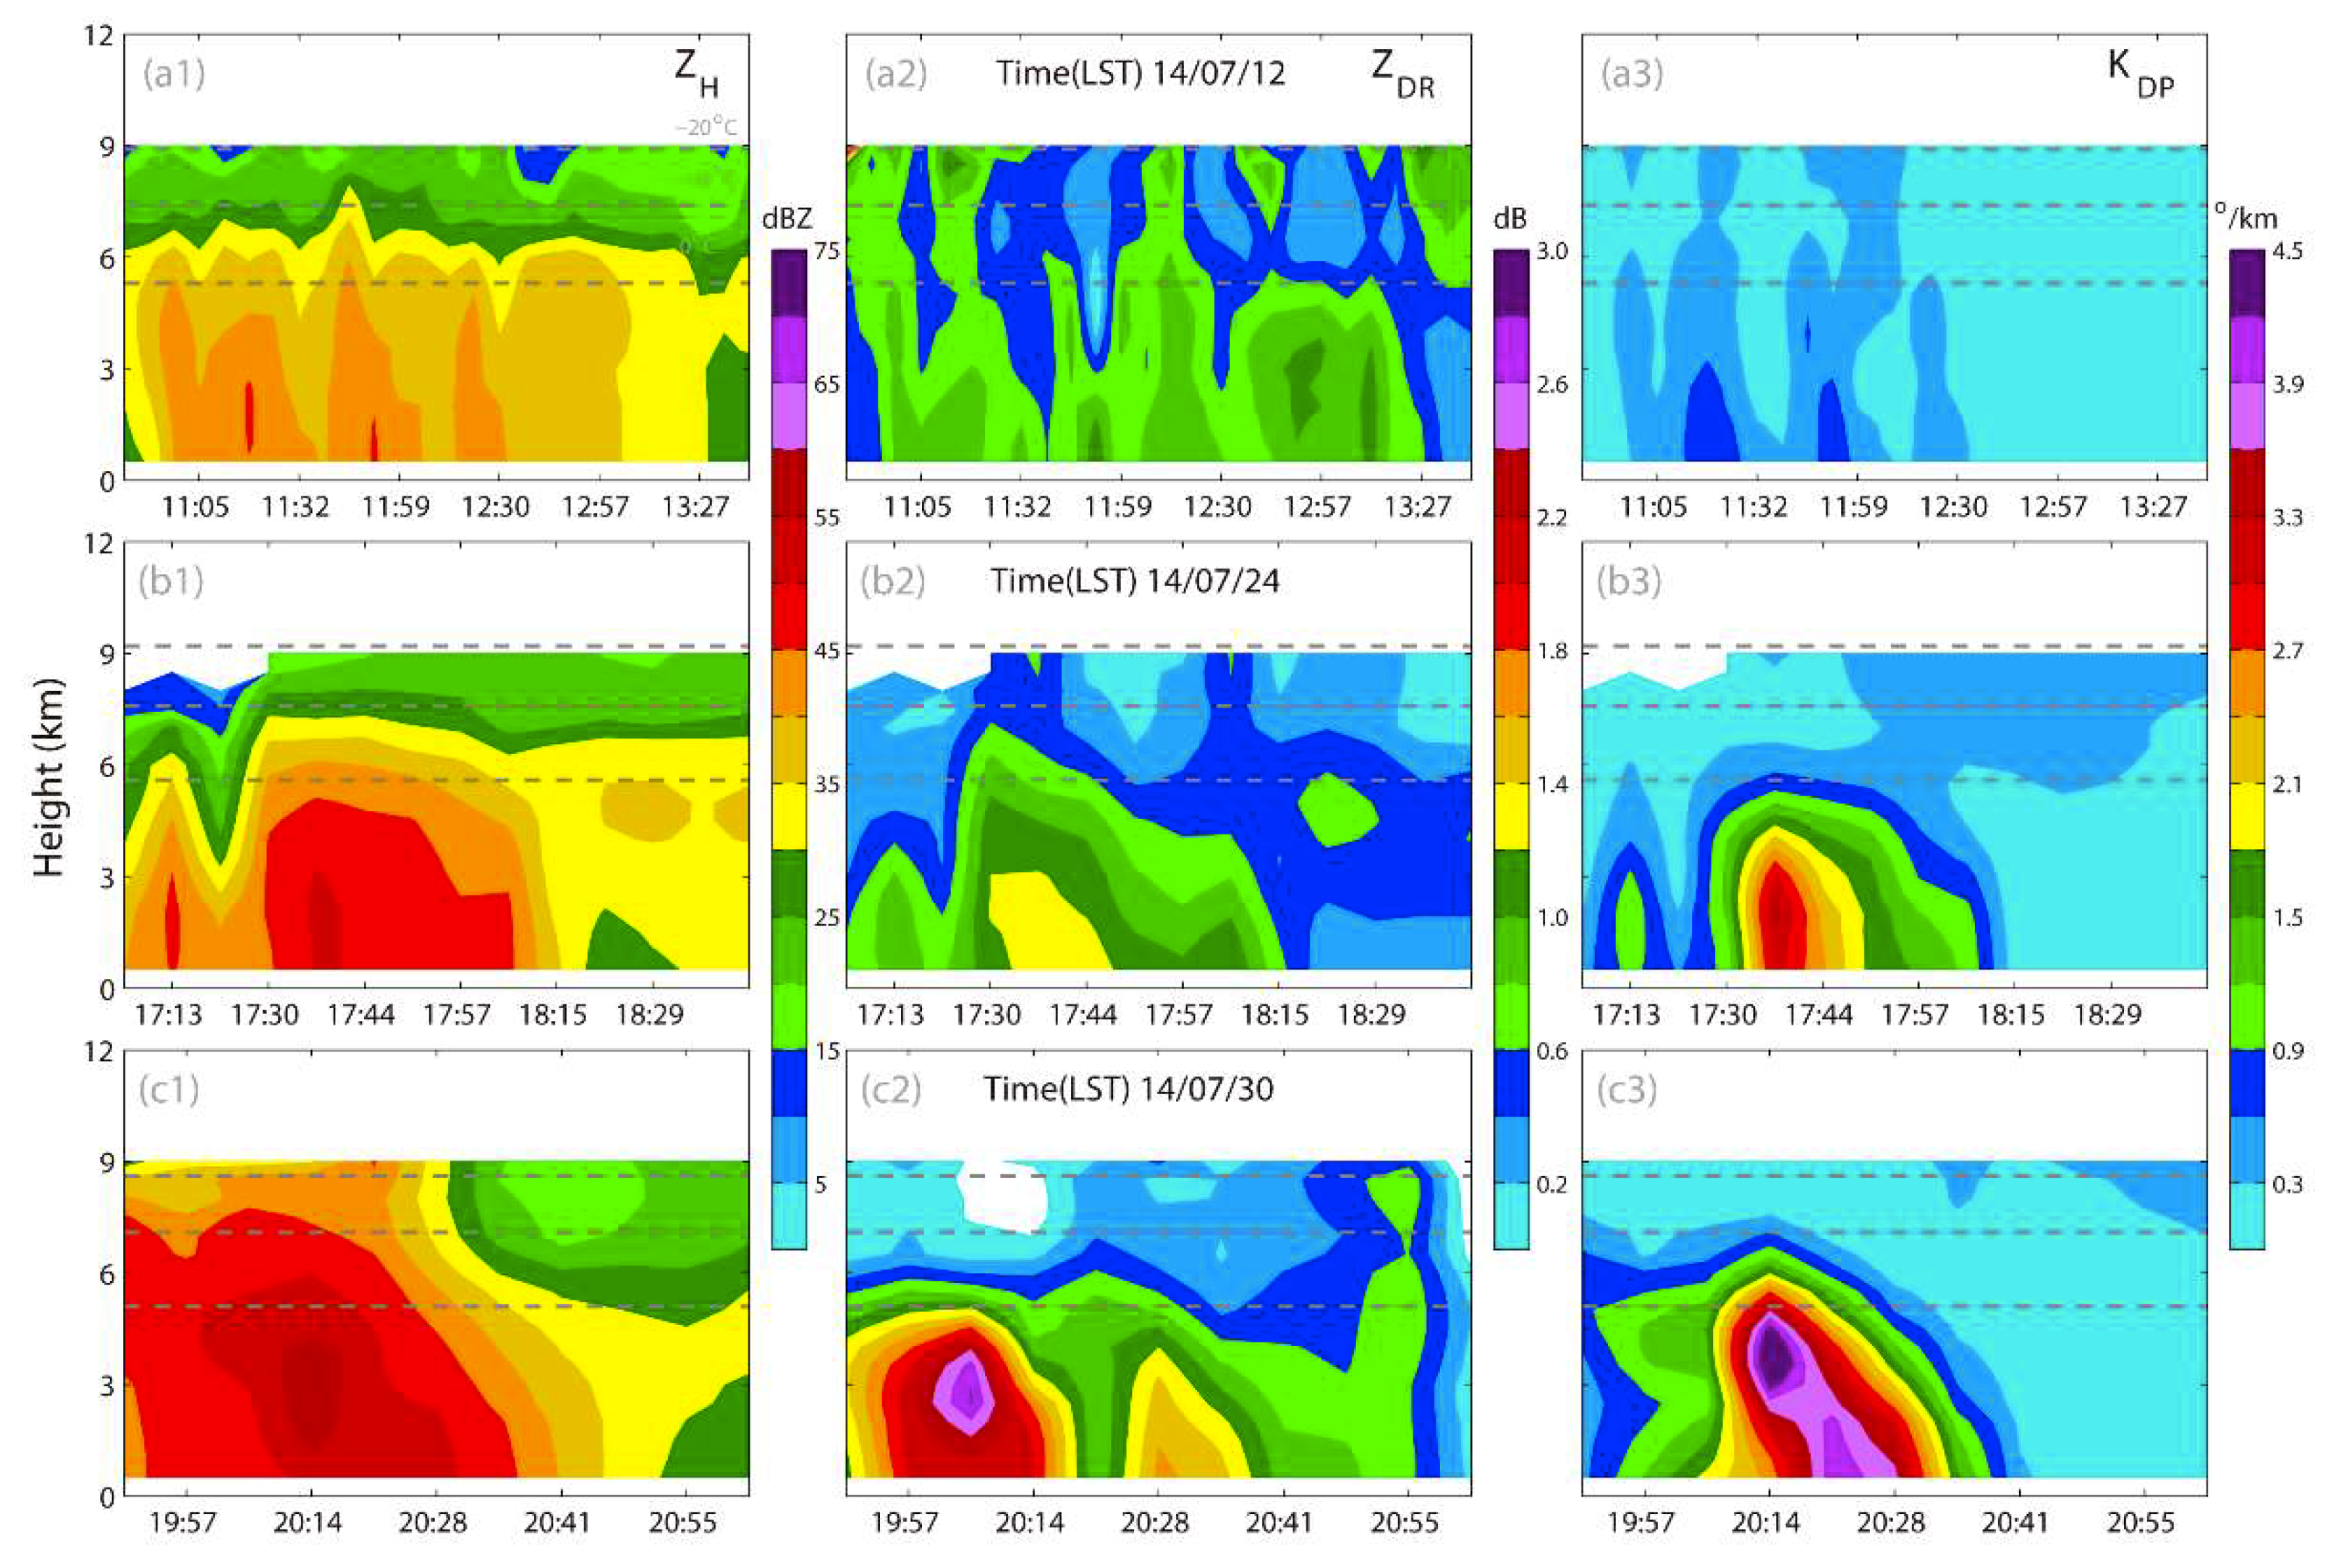
3.2.1. Vertical Evolution at the OTT-2 Site
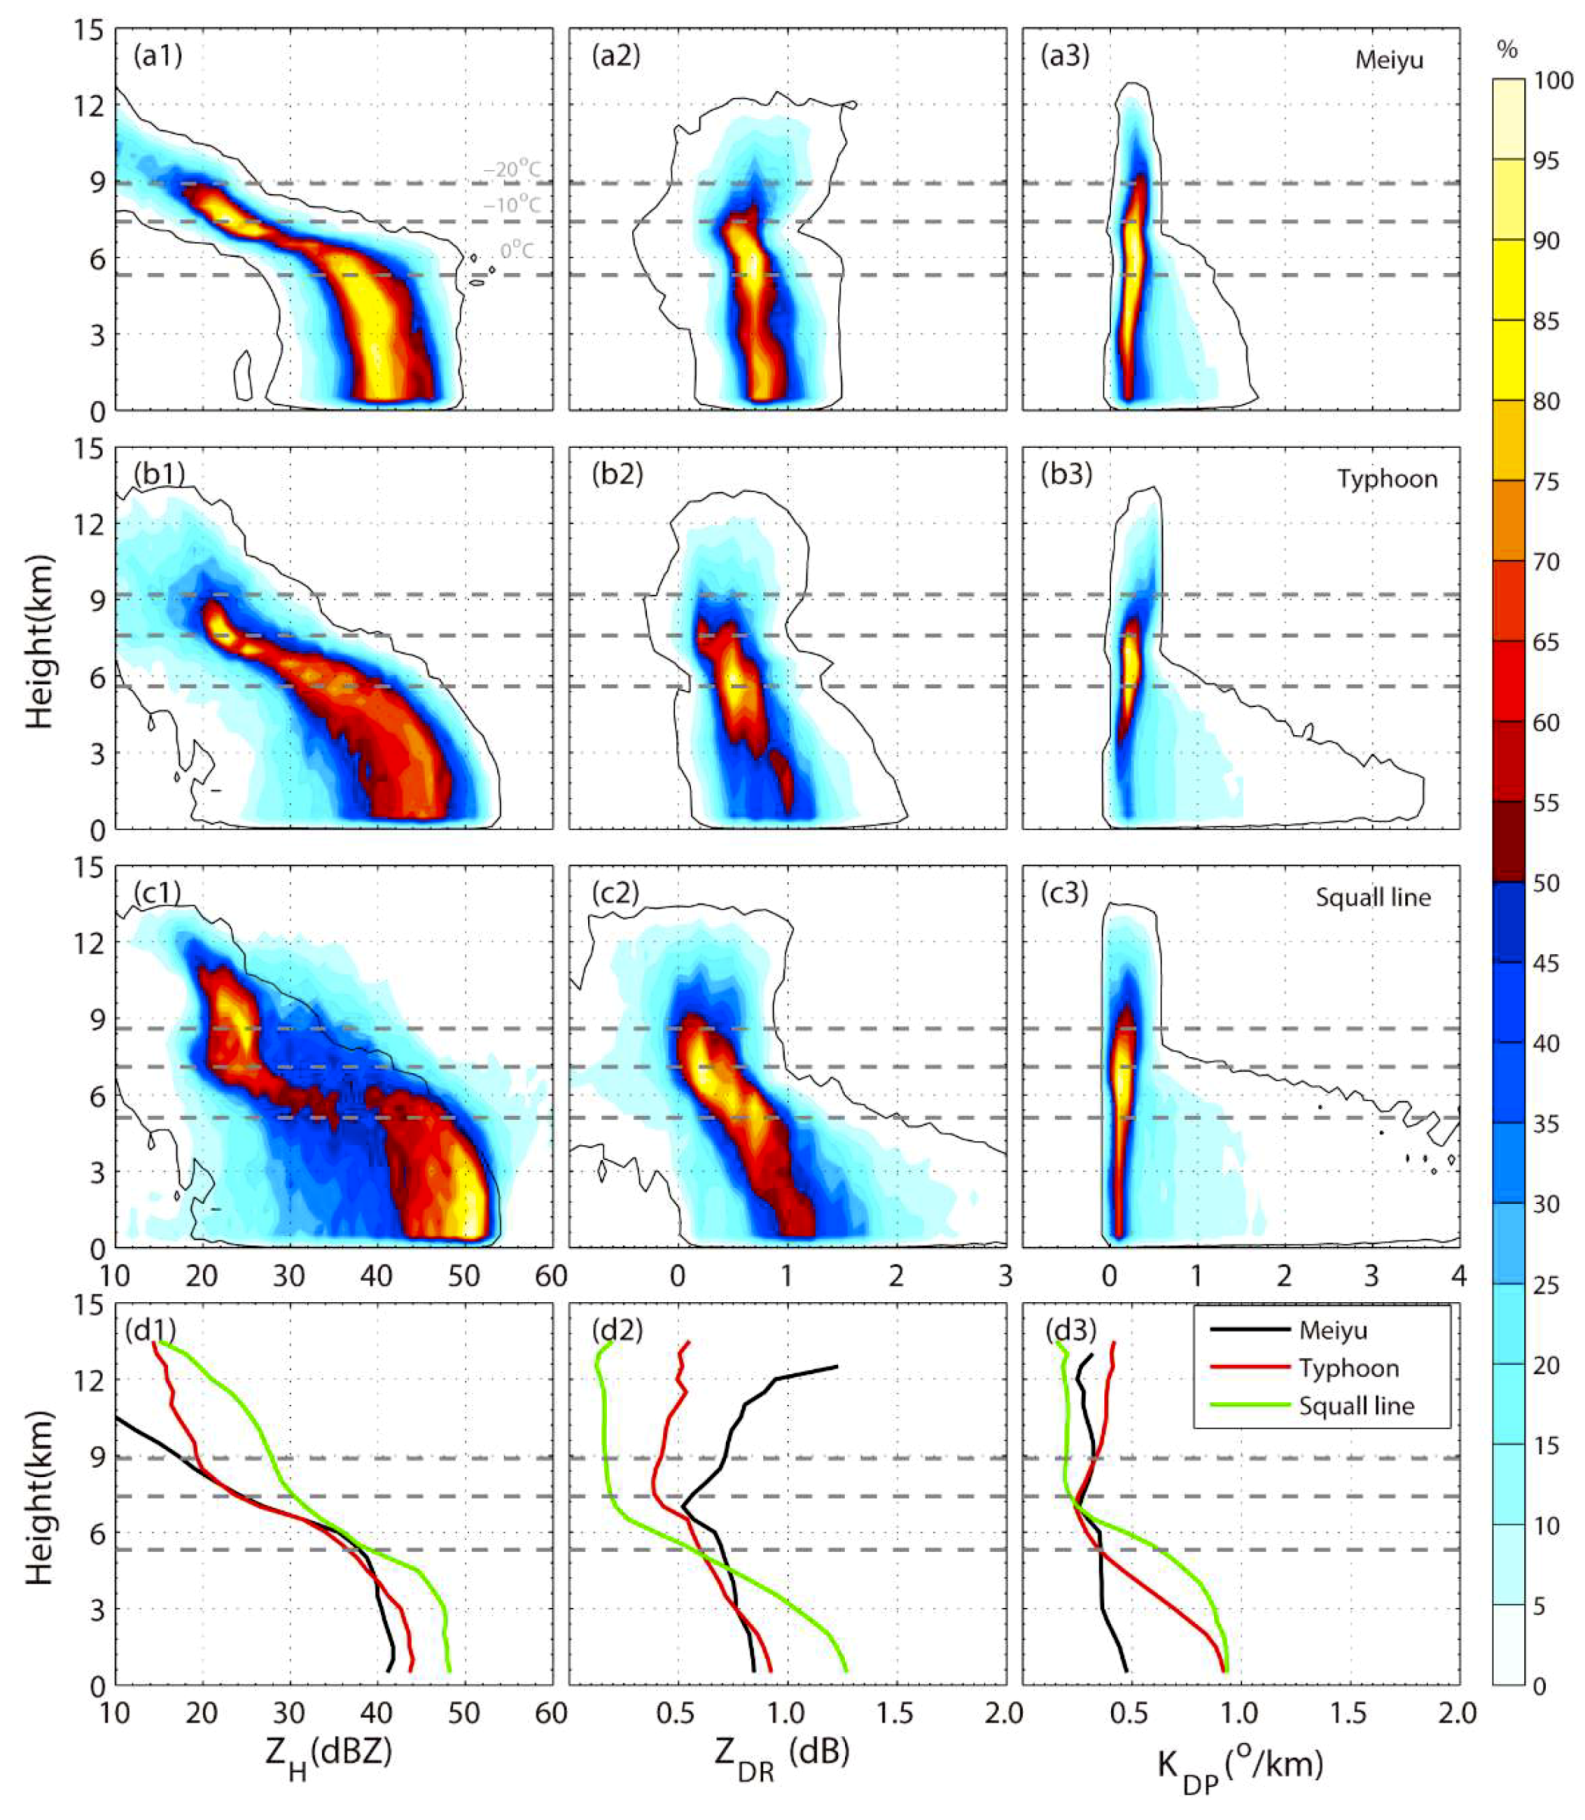
3.2.2. Composite Vertical Structure of Radar Variables
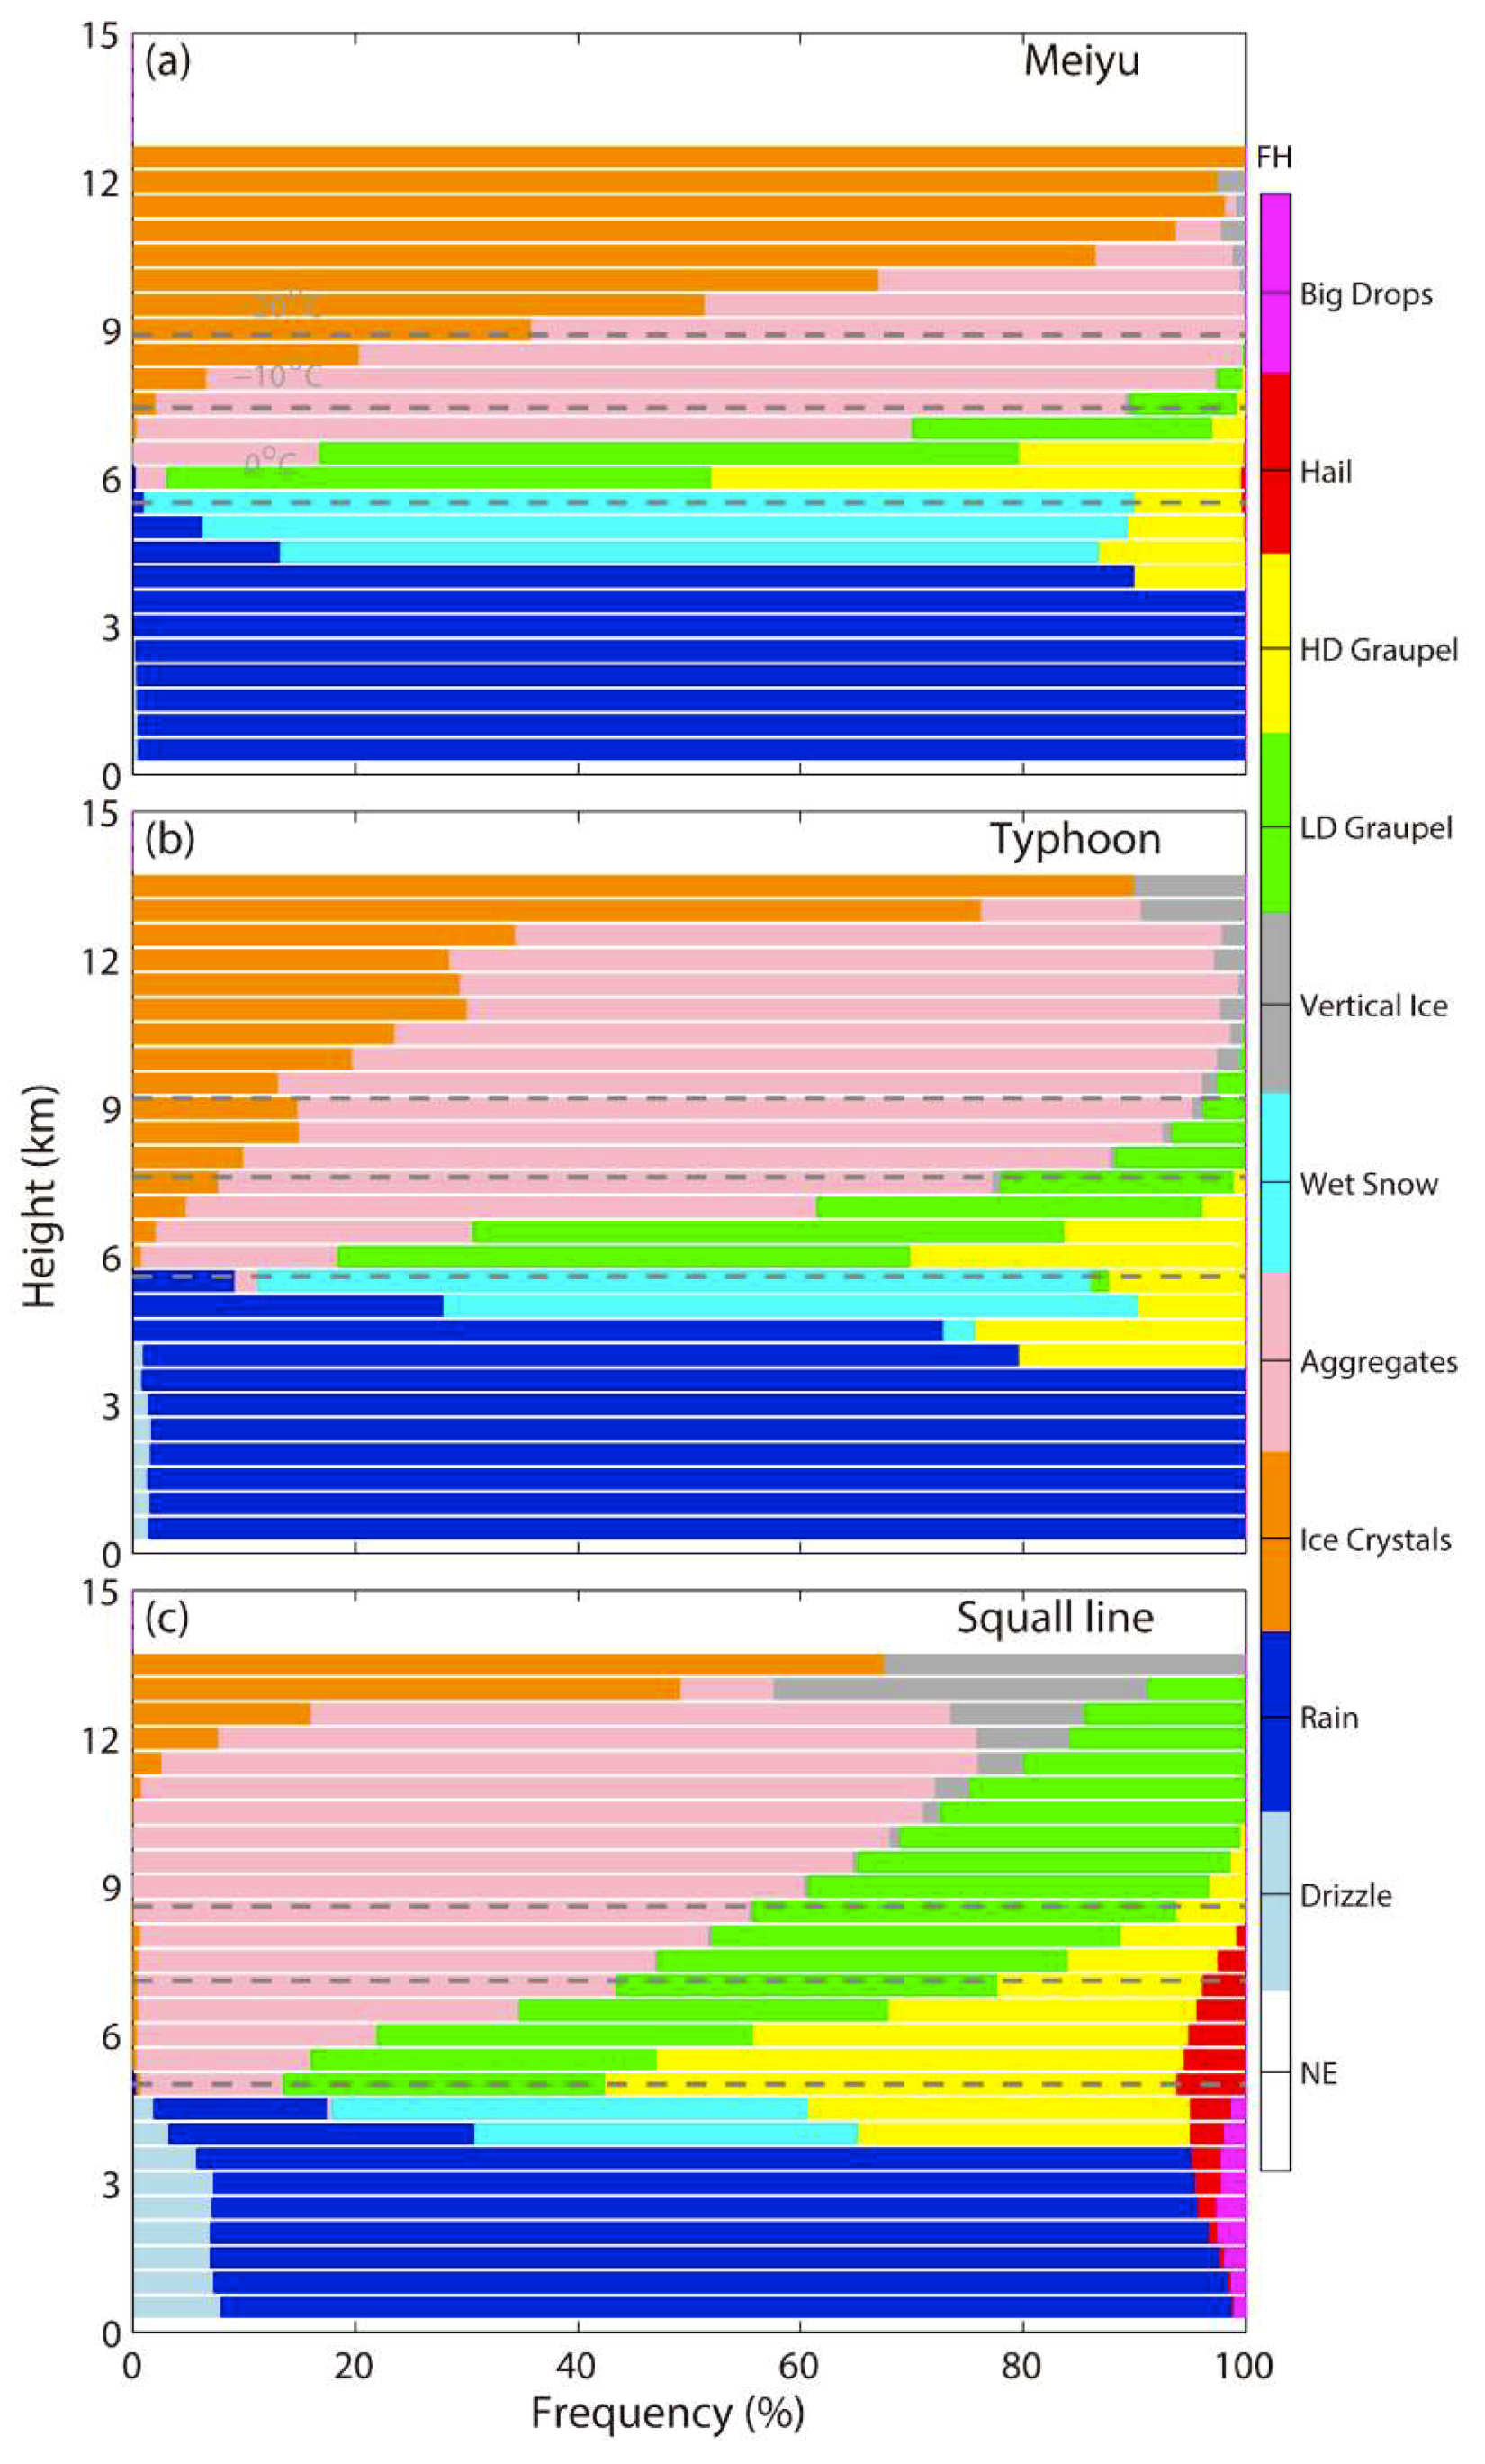
3.2.3. HID Results
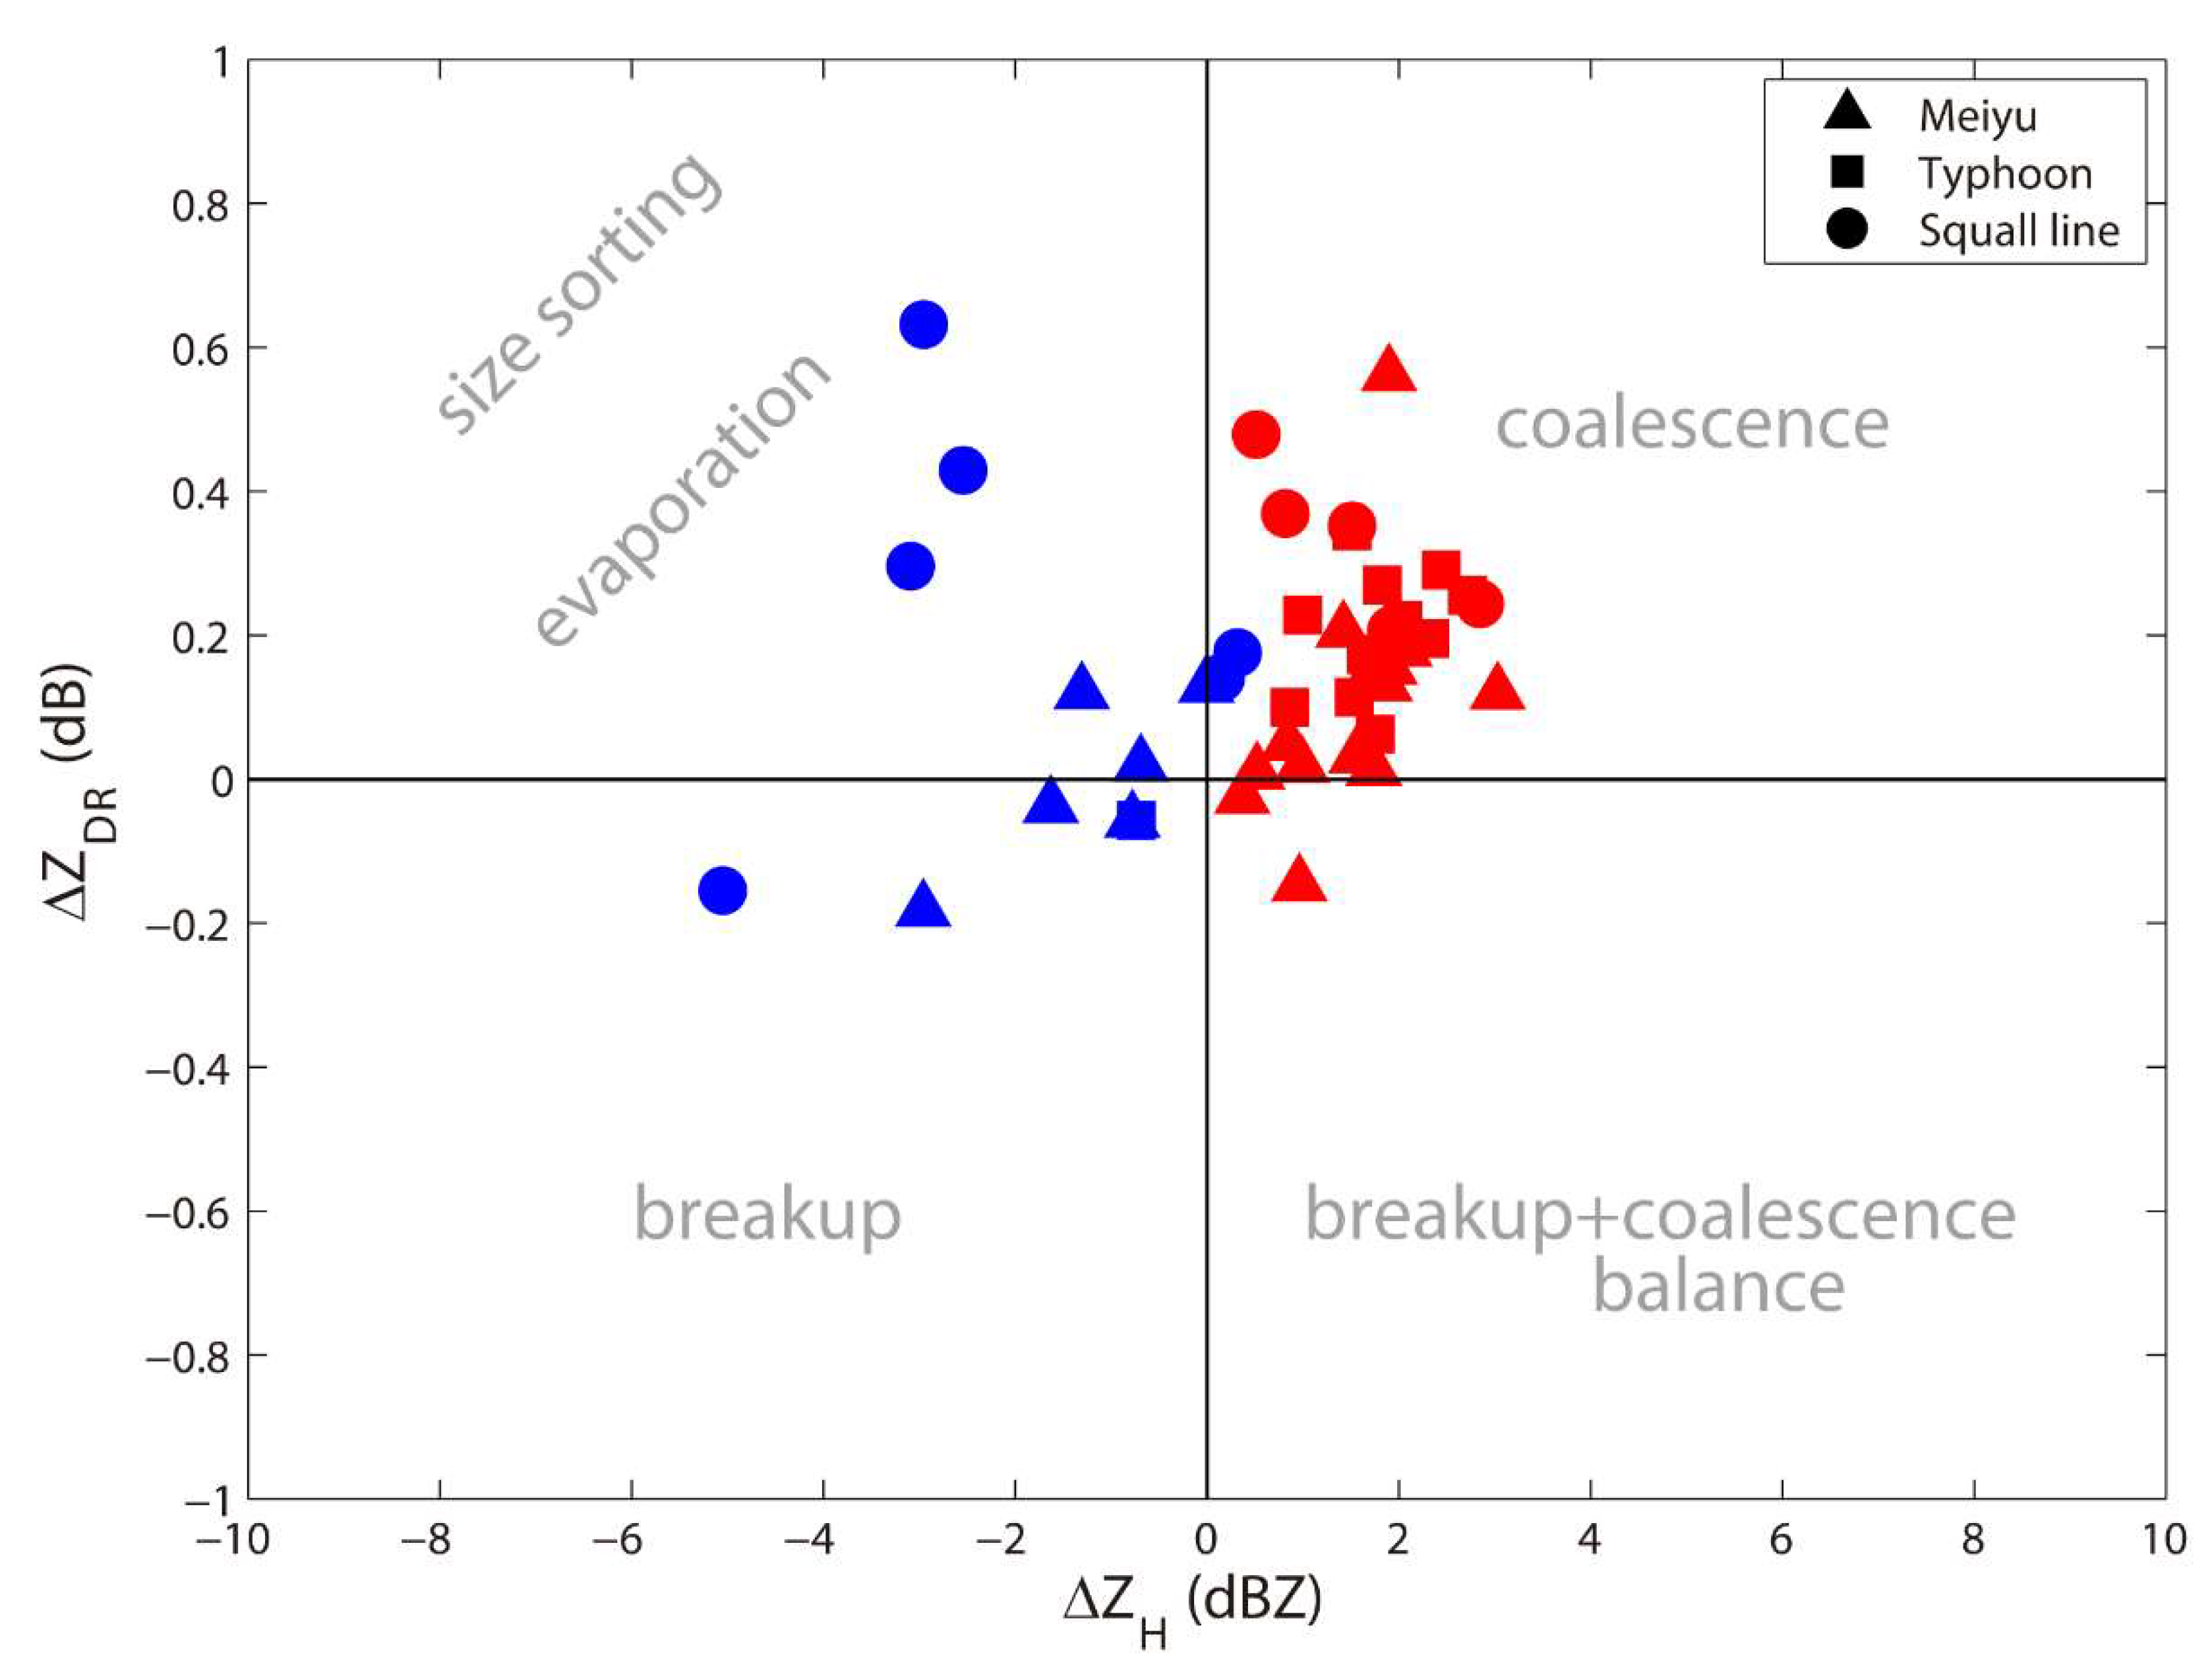
3.2.4. Inferred Microphysical Processes
4. Discussion
5. Conclusions
Supplementary Materials
Author Contributions
Funding
Acknowledgments
Conflicts of Interest
References
- Xu, W. Precipitation and Convective Characteristics of Summer Deep Convection over East Asia Observed by TRMM. Mon. Weather Rev. 2013, 141, 1577–1592. [Google Scholar] [CrossRef]
- Wen, L.; Zhao, K.; Zhang, G.; Xue, M.; Liu, B.Z.; Chen, X. Statistical Characteristics of Raindrop Size Distributions Observed in East China during the Asian Summer Monsoon Season using 2D-Video Disdrometer and Micro-rain Radar Data. J. Geophys. Res. Atmos. 2016, 121, 2265–2282. [Google Scholar] [CrossRef]
- Barnes, H.C.; Houze, R.A. Comparison of observed and simulated spatial patterns of ice microphysical processes in tropical oceanic mesoscale convective systems. J. Geophys. Res. Atmos. 2016, 121, 1–28. [Google Scholar] [CrossRef]
- Brown, B.R.; Bell, M.M.; Frambach, A.J. Validation of simulated hurricane drop size distributions using polarimetric radar. Geophys. Res. Lett. 2016, 43, 910–917. [Google Scholar] [CrossRef]
- Putnam, B.J.; Xue, M.; Jung, Y.; Snook, N.A.; Zhang, G. Ensemble Probabilistic Prediction of a Mesoscale Convective System and Associated Polarimetric Radar Variables using Single-Moment and Double-Moment Microphysics Schemes and EnKF Radar Data Assimilation. Mon. Weather Rev. 2017, 145, 2257–2279. [Google Scholar] [CrossRef]
- Cao, Q.; Zhang, G.; Brandes, E.; Schuur, T.; Ryzhkov, A.; Ikeda, K. Analysis of Video Disdrometer and Polarimetric Radar Data to Characterize Rain Microphysics in Oklahoma. J. Appl. Meteorol. Climatol. 2008, 47, 2238–2255. [Google Scholar] [CrossRef] [Green Version]
- Friedrich, K.; Kalina, E.A.; Aikins, J.; Steiner, M.; Gochis, D.; Kucera, P.A.; Ikeda, K.; Sun, J. Raindrop Size Distribution and Rain Characteristics during the 2013 Great Colorado Flood. J. Hydrometeorol. 2015, 17, 53–72. [Google Scholar] [CrossRef]
- Chen, B.; Wang, J.; Gong, D. Raindrop Size Distribution in a Midlatitude Continental Squall Line Measured by Thies Optical Disdrometers over East China. J. Appl. Meteorol. Climatol. 2016, 55, 151016095254003. [Google Scholar] [CrossRef]
- Barnes, H.C.; Houze, R.A. Precipitation hydrometeor type relative to the mesoscale airflow in mature oceanic deep convection of the Madden-Julian Oscillation. J. Geophys. Res. Atmos. 2015, 119, 13990–14014. [Google Scholar] [CrossRef]
- Friedrich, K.; Kalina, E.A.; Aikins, J.; Gochis, D.; Rasmussen, R. Precipitation and cloud structures of intense rain during the 2013 Great Colorado Flood. J. Hydrometeorol. 2016, 17, 27–52. [Google Scholar] [CrossRef]
- Lang, T.J.; Rutledge, S.A.; Cifelli, R. Polarimetric radar observations of convection in northwestern Mexico during the North American Monsoon Experiment. J. Hydrometeorol. 2009, 11, 1345–1357. [Google Scholar] [CrossRef]
- Bringi, V.N.; Chandrasekar, V.; Hubbert, J.; Gorgucci, E.; Randeu, W.L.; Schoenhuber, M. Raindrop Size Distribution in Different Climatic Regimes from Disdrometer and Dual-Polarized Radar Analysis. J. Atmos. Sci. 2003, 60, 354–365. [Google Scholar] [CrossRef]
- Chang, W.Y.; Wang, T.C.; Lin, P.L. Characteristics of the raindrop size distribution and drop shape relation in typhoon systems in the western Pacific from the 2D video disdrometer and NCU C-band polarimetric radar. J. Atmos. Ocean. Technol. 2009, 26, 1973–1993. [Google Scholar] [CrossRef]
- Thompson, E.J.; Rutledge, S.A.; Dolan, B.; Thurai, M. Drop Size Distributions and Radar Observations of Convective and Stratiform Rain over the Equatorial Indian and West Pacific Oceans. J. Atmos. Sci. 2015, 72, 4091–4125. [Google Scholar] [CrossRef]
- Dolan, B.; Fuchs, B.; Rutledge, S.A.; Barnes, E.A.; Thompson, E.J. Primary modes of global drop-size distributions. J. Atmos. Sci. 2018, 75, 1453–1476. [Google Scholar] [CrossRef]
- Wang, M.; Zhao, K.; Xue, M.; Zhang, G.; Liu, S.; Wen, L.; Chen, G. Precipitation microphysics characteristics of a Typhoon Matmo (2014) rainband after landfall over eastern China based on polarimetric radar observations. J. Geophys. Res. Atmos. 2016, 121, 12415–12433. [Google Scholar] [CrossRef]
- Wen, J.; Zhao, K.; Huang, H.; Zhou, B.; Yang, Z.; Chen, G.; Wang, M.; Wen, L.; Dai, H.; Xu, L.; et al. Evolution of Microphysical Structure of a Subtropical Squall Line Observed by a Polarimetric Radar and a disdrometer during OPACC in Eastern China. J. Geophys. Res. Atmos. 2017, 122, 8033–8050. [Google Scholar] [CrossRef]
- Zhang, G.; Sun, J.; Brandes, E.A. Improving Parameterization of Rain Microphysics with Disdrometer and Radar Observations. J. Atmos. Sci. 2006, 63, 1273–1290. [Google Scholar] [CrossRef] [Green Version]
- Rowe, A.K.; Rutledge, S.A.; Lang, T.J. Investigation of Microphysical Processes Occurring in Organized Convection during NAME. Mon.Weather Rev. 2012, 140, 2168–2187. [Google Scholar] [CrossRef]
- Kumjian, M.R.; Prat, O.P. The Impact of Raindrop Collisional Processes on the Polarimetric Radar Variables. J. Atmos. Sci. 2013, 71, 3052–3067. [Google Scholar] [CrossRef]
- Luo, Y.; Wu, M.; Ren, F.; Jian, L.; Wong, W.K. Synoptic situations of extreme hourly precipitation over China. J. Clim. 2016, 29, 8703–8719. [Google Scholar] [CrossRef]
- Chen, G.; Zhao, K.; Zhang, G.; Huang, H.; Liu, S.; Wen, L.; Yang, Z.; Yang, Z.; Xu, L.; Zhu, W. Improving Polarimetric C-Band Radar Rainfall Estimation with Two-dimensional Video Disdrometer Observations in Eastern China. J. Hydrometeorol. 2017, 18, 1375–1391. [Google Scholar] [CrossRef]
- Huang, H.; Zhao, K.; Zhang, G.; Giangrande, S. A Hybrid Method to Estimate Specific Differential Phase and Rainfall with Linear Programming and Physics Constraints. IEEE Trans. Geosci. Remote Sens. 2016, 54, 96–111. [Google Scholar] [CrossRef]
- Löffler-Mang, M.; Joss, J. An optical disdrometer for measuring size and velocity of hydrometeors. J. Atmos. Ocean. Technol. 2000, 17, 130–139. [Google Scholar] [CrossRef]
- Kruger, A.; Krajewski, W.F. Two-Dimensional Video Disdrometer: A Description. J. Atmos. Ocean. Technol. 2002, 19, 602–617. [Google Scholar] [CrossRef]
- Thurai, M.; Bringi, V.N. Drop Axis Ratios from a 2D Video Disdrometer. J. Atmos. Ocean. Technol. 2004, 22, 966–978. [Google Scholar] [CrossRef]
- Friedrich, K.; Higgins, S.; Masters, F.J.; Lopez, C.R. Articulating and Stationary PARSIVEL Disdrometer Measurements in Conditions with Strong Winds and Heavy Rainfall. J. Atmos. Ocean. Technol. 2013, 30, 2063–2080. [Google Scholar] [CrossRef]
- Battaglia, A.; Rustemeier, E.; Tokay, A.; Blahak, U.; Simmer, C. PARSIVEL snow observations: A critical assessment. J. Atmos. Ocean. Technol. 2010, 27, 333–344. [Google Scholar] [CrossRef]
- Tokay, A.; Petersen, W.A.; Gatlin, P.; Wingo, M. Comparison of Raindrop Size Distribution Measurements by Collocated Disdrometers. J. Atmos. Ocean. Technol. 2013, 30, 1672–1690. [Google Scholar] [CrossRef]
- Wen, L.; Zhao, K.; Zhang, G.; Liu, S.; Chen, G. Impacts of Instrument Limitations on Estimated Raindrop Size Distribution, Radar Parameters, and Model Microphysics during Mei-Yu Season in East China. J. Atmos. Ocean. Technol. 2017, 34, 1021–1037. [Google Scholar] [CrossRef]
- Brandes, E.A.; Zhang, G.; Vivekanandan, J. Experiments in rainfall estimation with a polarimetric radar in a subtropical environment. J. Appl. Meteorol. 2002, 41, 674–685. [Google Scholar] [CrossRef]
- Vivekanandan, J.; Ellis, S.M.; Oye, R.; Zrnic, D.S.; Ryzhkov, A.V.; Straka, J. Cloud Microphysics Retrieval Using S-band Dual-Polarization Radar Measurements. Bull. Am. Meteorol. Soc. 1999, 80, 381–388. [Google Scholar] [CrossRef]
- Park, H.S.; Ryzhkov, A.; Zrnic, D.; Kim, K.E. The hydrometeor classification algorithm for the polarimetric WSR-88D: Description and application to an MCS. Weather Forecast. 2009, 24, 730–748. [Google Scholar] [CrossRef]
- Dolan, B.; Rutledge, S.A.; Lim, S.; Chandrasekar, V.; Thurai, M. A robust C-band hydrometeor identification algorithm and application to a long-term polarimetric radar dataset. J. Appl. Meteorol. Climatol. 2013, 52, 2162–2186. [Google Scholar] [CrossRef]
- Rowe, A.K.; Houze, R.A. Microphysical characteristics of MJO convection over the Indian Ocean during DYNAMO. J. Geophys. Res. Atmos. 2014, 119, 2543–2554. [Google Scholar] [CrossRef]
- Chang, W.Y.; Lee, W.C.; Liou, Y.C. The Kinematic and Microphysical Characteristics and Associated Precipitation Efficiency of Subtropical Convection during SoWMEX/TiMREX. Mon. Weather Rev. 2015, 143, 317–340. [Google Scholar] [CrossRef]
- Carey, L.D.; Rutledge, S.A. The relationship between precipitation and lightning in tropical island convection: A C-band polarimetric radar study. Mon. Weather Rev. 2000, 128, 2687–2710. [Google Scholar] [CrossRef]
- Zhang, G.; Vivekanandan, J.; Brandes, E. A method for estimating rain rate and drop size distribution from polarimetric radar measurements. IEEE Trans. Geosci. Remote Sens. 2001, 39, 830–841. [Google Scholar] [CrossRef] [Green Version]
- Weisman, M.L.; Klemp, J.B.; Rotunno, R. Structure and Evolution of Numerically Simulated Squall Lines. J. Atmos. Sci. 1988, 45, 1990–2013. [Google Scholar] [CrossRef] [Green Version]
- Doswell, C.A., III; Brooks, H.E.; Maddox, R.A. Flash Flood Forecasting: An Ingredients-Based Methodology. Weather Forecast. 1996, 11, 560–581. [Google Scholar] [CrossRef]
- Markowski, P.; Richardson, Y. Mesoscale Meteorology in Midlatitudes; John Wiley & Sons: Hoboken, NJ, USA, 2010. [Google Scholar]
- Gochis, D.; Schumacher, R.; Friedrich, K.; Doesken, N.; Kelsch, M.; Sun, J.; Ikeda, K.; Lindsey, D.; Wood, A.; Dolan, B. The Great Colorado Flood of September 2013. Bull. Am. Meteorol. Soc. 2015, 96, 1461–1487. [Google Scholar] [CrossRef] [Green Version]
- Doswell, C.A. Severe convective storms—An overview. Am. Meteor. Soc. 2001, 50, 1–26. [Google Scholar]
- Yuter, S.E.; Houze, R.A. Three-Dimensional Kinematic and Microphysical Evolution of Florida Cumulonimbus. Part I: Spatial Distribution of Updrafts, Downdrafts and Precipitation. Mon. Weather Rev. 1995, 123, 1921–1940. [Google Scholar] [CrossRef]
- Steiner, M.; Houze, R.A., Jr.; Yuter, S.E. Climatological Characterization of Three-Dimensional Storm Structure from Operational Radar and Rain Gauge Data. J. Appl. Meteorol. 1995, 28, 1978–2007. [Google Scholar] [CrossRef]
- DeMott, C.A.; Rutledge, S.A. The vertical structure of TOGA COARE convection. Part I: Radar echo distributions. J. Atmos. Sci. 1998, 55, 2730–2747. [Google Scholar] [CrossRef]
- Petersen, W.A.; Rutledge, S.A. Regional variability in tropical convection: Observations from TRMM. J. Clim. 2001, 14, 3566–3586. [Google Scholar] [CrossRef]
- Rowe, A.K.; Rutledge, S.A.; Lang, T.J. Investigation of Microphysical Processes Occurring in Isolated Convection during NAME. Mon. Weather Rev. 2011, 139, 424–443. [Google Scholar] [CrossRef]
- Andrić, J.; Kumjian, M.R.; Zrnić, D.S.; Straka, J.M.; Melnikov, V.M. Polarimetric Signatures above the Melting Layer in Winter Storms: An Observational and Modeling Study. J. Appl. Meteorol. Climatol. 2013, 52, 682–700. [Google Scholar] [CrossRef]
- Schrom, R.S.; Kumjian, M.R. Connecting microphysical processes in Colorado winter storms with vertical profiles of radar observations. J. Appl. Meteorol. Climatol. 2015, 55. [Google Scholar] [CrossRef]
- Straka, J.M.; Zrnić, D.S.; Ryzhkov, A.V. Bulk hydrometeor classification and quantification using polarimetric radar data: Synthesis of relations. J. Appl. Meteorol. 2000, 39, 1341–1372. [Google Scholar] [CrossRef]
- Carr, N.; Kirstetter, P.E.; Gourley, J.J.; Hong, Y. Polarimetric Signatures of MidLatitude Warm-Rain Precipitation Events. J. Appl. Meteorol. Climatol. 2017, 56, 697–711. [Google Scholar] [CrossRef]


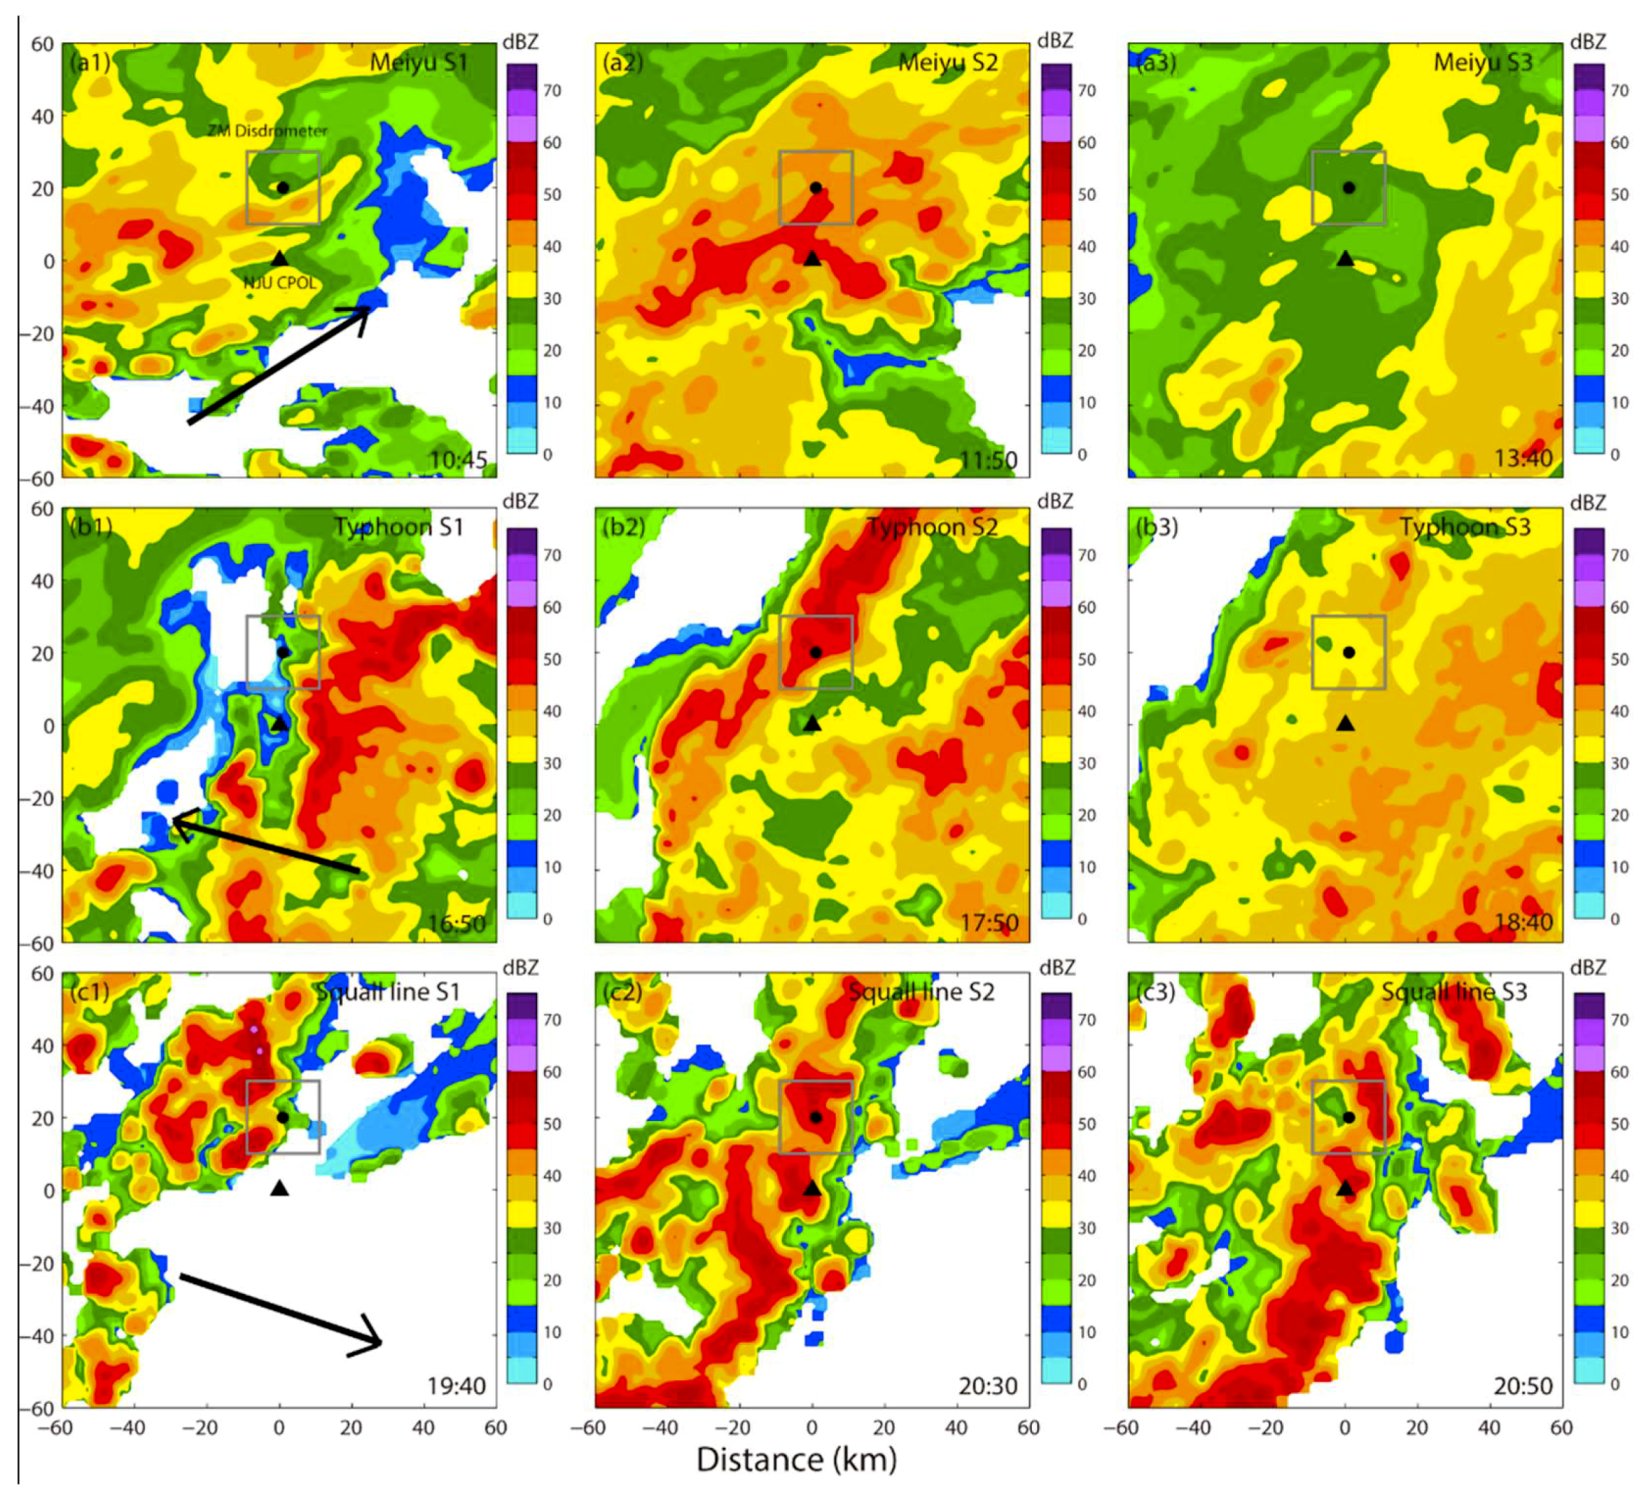
| Weather Systems | Time (LST) | Radar Volume Coverage Pattern (VCPs) |
|---|---|---|
| Meiyu | 12 July, 2014, 10:45–13:40 | 26 |
| Typhoon | 24 July, 2014, 17:00–18:40 | 14 |
| Squall line | 30 July, 2014 19:50–21:00 | 11 |
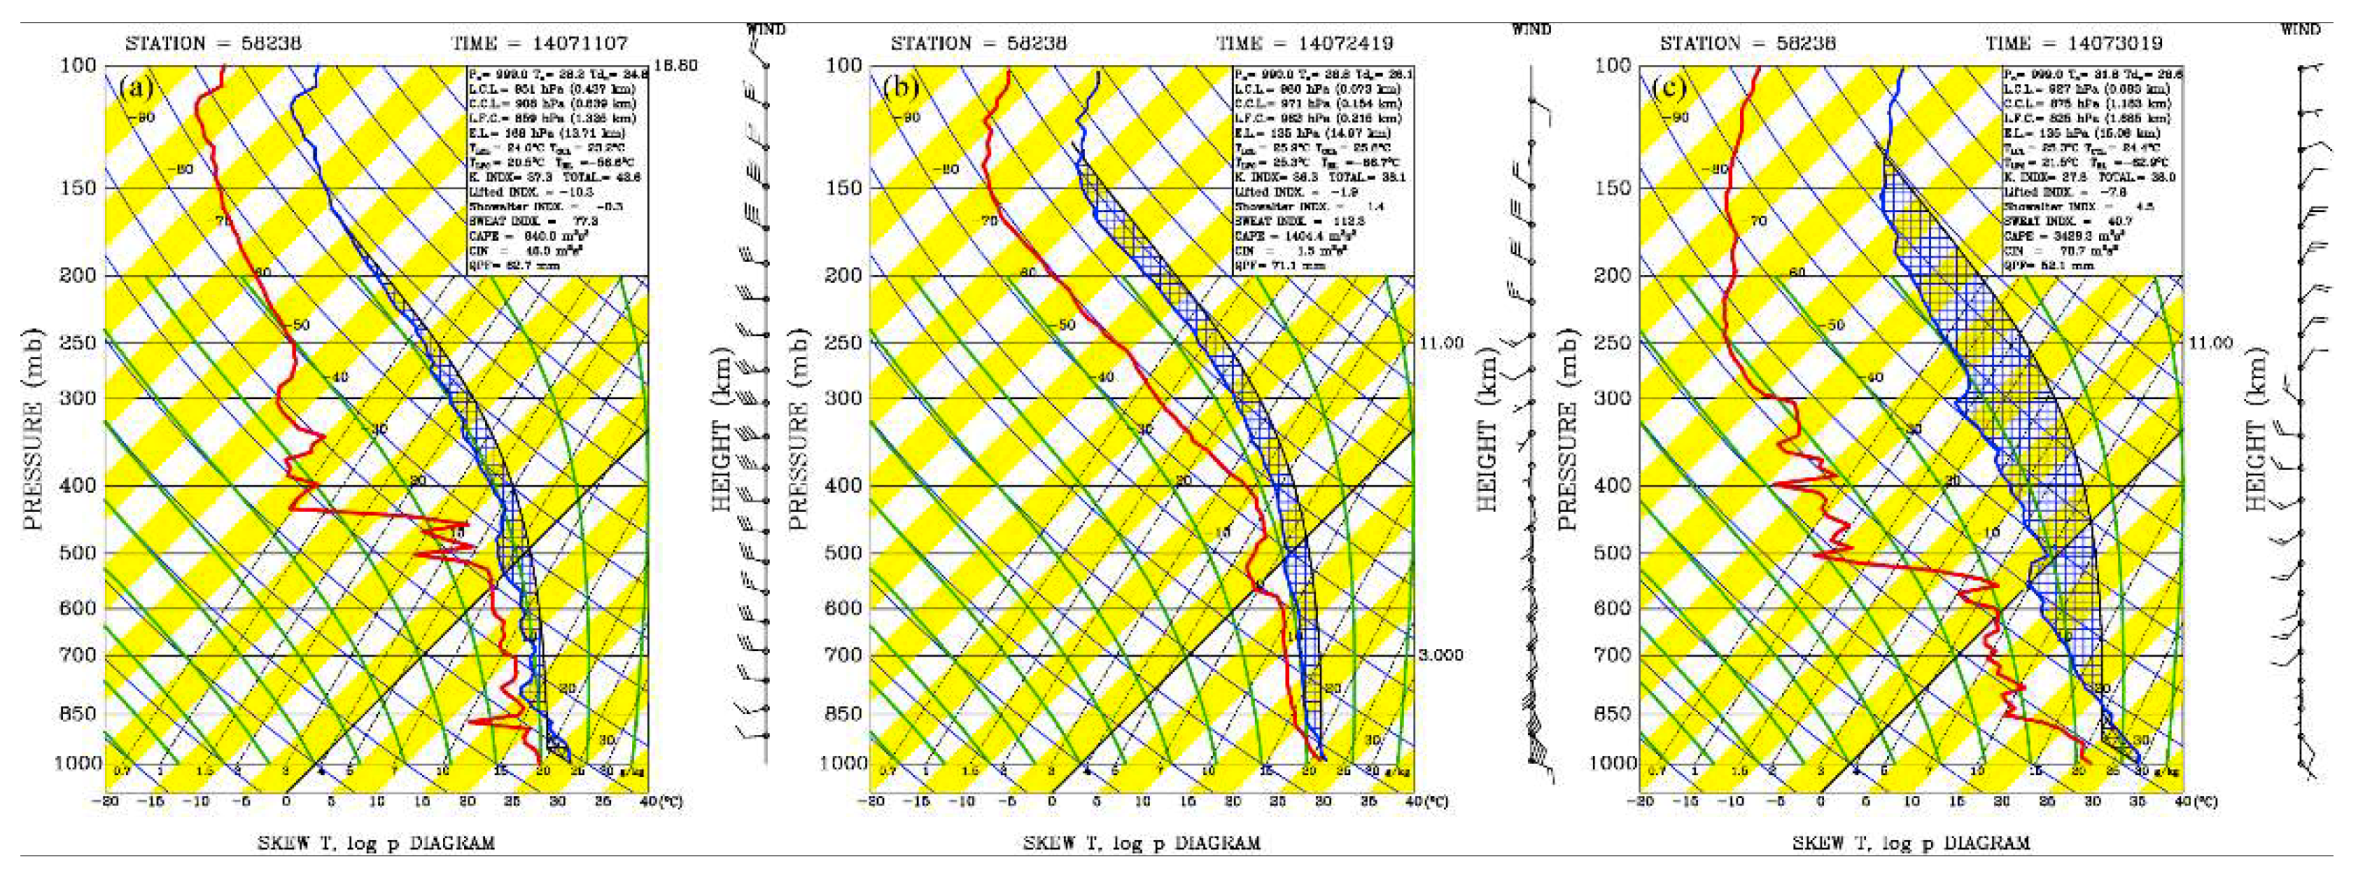
| Weather Systems | CAPE | 0–6 km Shear | PW (mm) | Relative Humidity (0.5–3.5 km) | LCL (km) | Freezing Level (km) | −10 °C Level (km) | −20 °C Level (km) |
|---|---|---|---|---|---|---|---|---|
| Meiyu | 940 | 13.9 | 62.7 | 84% | 0.4 | 5.3 | 7.4 | 8.9 |
| Typhoon | 1404 | 13.5 | 71.1 | 91% | 0.1 | 5.6 | 7.6 | 9.2 |
| Squall line | 3428 | 11.6 | 52.1 | 59% | 0.7 | 5.1 | 7.1 | 8.6 |
© 2019 by the authors. Licensee MDPI, Basel, Switzerland. This article is an open access article distributed under the terms and conditions of the Creative Commons Attribution (CC BY) license (http://creativecommons.org/licenses/by/4.0/).
Share and Cite
Chen, G.; Zhao, K.; Wen, L.; Wang, M.; Huang, H.; Wang, M.; Yang, Z.; Zhang, G.; Zhang, P.; Lee, W.-C. Microphysical Characteristics of Three Convective Events with Intense Rainfall Observed by Polarimetric Radar and Disdrometer in Eastern China. Remote Sens. 2019, 11, 2004. https://doi.org/10.3390/rs11172004
Chen G, Zhao K, Wen L, Wang M, Huang H, Wang M, Yang Z, Zhang G, Zhang P, Lee W-C. Microphysical Characteristics of Three Convective Events with Intense Rainfall Observed by Polarimetric Radar and Disdrometer in Eastern China. Remote Sensing. 2019; 11(17):2004. https://doi.org/10.3390/rs11172004
Chicago/Turabian StyleChen, Gang, Kun Zhao, Long Wen, Mengyao Wang, Hao Huang, Mingjun Wang, Zhengwei Yang, Guifu Zhang, Pengfei Zhang, and Wen-Chau Lee. 2019. "Microphysical Characteristics of Three Convective Events with Intense Rainfall Observed by Polarimetric Radar and Disdrometer in Eastern China" Remote Sensing 11, no. 17: 2004. https://doi.org/10.3390/rs11172004