Radar Measurements of Morphological Parameters and Species Identification Analysis of Migratory Insects


1
Radar Research Lab, School of Information and Electronics, Beijing Institute of Technology, Beijing 100081, China
2
Key Laboratory of Electronic and Information Technology in Satellite Navigation (Beijing Institute of Technology), Ministry of Education, Beijing 100081, China
*
Author to whom correspondence should be addressed.
Remote Sens. 2019, 11(17), 1977; https://doi.org/10.3390/rs11171977
Submission received: 19 July 2019
/
Revised: 17 August 2019
/
Accepted: 19 August 2019
/
Published: 22 August 2019
(This article belongs to the Special Issue Radar Aeroecology)
Abstract
:Migratory insect identification has been concerning entomology and pest managers for a long time. Their nocturnal behavior, as well as very small radar cross-section (RCS), makes individual detection challenging for any radar network. Typical entomological radars work at the X-band (9.4 GHz) with a vertical pencil beam. The measured RCS can be used to estimate insect mass and wingbeat frequency, and then migratory insects can be categorized into broad taxon classes using the estimated parameters. However, current entomological radars cannot achieve species identification with any higher precision or confidence. The limited frequency range of current insect radars have precluded the acquisition of more information useful for the identification of individual insects. In this paper, we report an improved measurement method of insect mass and body length using a radar with many more measurement frequencies than current entomological radars. The insect mass and body length can be extracted from the multi-frequency RCSs with uncertainties of 16.31% and 10.74%, respectively. The estimation of the thorax width and aspect ratio can also be achieved with uncertainties of 13.37% and 7.99%, respectively. Furthermore, by analyzing the statistical data of 5532 insects representing 23 species in East China, we found that the correct identification probabilities exceed 0.5 for all of the 23 species and are higher than 0.8 for 15 of the 23 species under the achievable measurement precision of the proposed technique. These findings provide promising improvements of individual parameter measurement for entomological radars and imply a possibility of species identification with higher precision.
1. Introduction
Animal migration is increasingly recognized to have ecological effects on both habitats and ecosystems by transport effects and trophic effects [1,2,3]. These ecological interactions make every species of migrant play an irreplaceable role in the entire circulatory system [4]. Among animal migrants, the migratory insects have the largest individual numbers [5]. Many migratory insects provide essential ecosystem services such as crop pollination, seed spreading and energy transfer [4], but some migratory pests cause losses to human society, such as crop damages [2,6] and virus transmission [7]. Therefore, studies on insect migration are critically important.
Most migratory insects are too small (a few milligrams of individual mass) for individual tracking, and their high flying altitudes (a few hundred meters, or even 2–3 km) during migration also limit their effective monitoring [8]. Therefore, the knowledge of insect migration has lagged behind that of other aerial organisms such as birds and bats. To study insect migration, many tools and techniques, including aerial net sampling and searchlight trapping have been applied [9,10]. In contrast to these traditional monitoring tools and techniques, radars have the advantages of a long detection range and the capability for continuous observation [1,11]. The distinctive capacity of radar to monitor over-flying nocturnal insects makes it widely used in the study of the migration behavior of high-altitude migratory insects. Researchers in entomology have built various kinds of entomological radars, including airborne entomological radar [12,13], scanning entomological radar [14], tracking entomological radar [15] and vertical-looking radar (VLR) [16,17,18]. Among these radars, scanning entomological radar and vertical entomological radar are the most widely used in the research of insect migration, which have greatly promoted the development of radar entomology. Since the late 2000s, radar-led research has refined our knowledge of the strategies and sensory capabilities employed by migratory insects in flight at night such as navigation, aggregation and orientation [19,20,21].
With the development of insect migration research, individual observation is becoming increasingly important. To study the behavior of individual insects, the first and the second generations of VLRs were built [22,23]. VLRs not only enable the long-term automated monitoring of migratory insects, but also have the ability to retrieve the mass, wing frequency and shape-related parameters of the target insect from the radar echo [24], which can be used to identify high-flying insect species [25]. The identification of insect migrants is an essential step in understanding the role of specific insects in population dynamics and community interactions, which may contribute to a better understanding of the ecological significance of insect migration. However, the ability of existing entomological radars to identify species identification is still insufficient. The detected insects can only be assigned to broad taxonomic classes (e.g., big moth or small moth) in most cases [26]. It is therefore necessary to improve the capability of the current entomological radar in species identification.
The morphological parameters of insects (e.g., shape and size) are the main basis of species identification [27]. To more precisely identify insect species, species-exclusive parameters should be estimated from radar data, and the estimation accuracy of these parameters must be improved. The wingbeat frequency, mass, body length, aspect ratio (i.e., the ratio of length to width) and thorax width are the five most important morphological parameters. The wingbeat frequency of a flying insect can be measured by a VLR with an uncertainty of 1 Hz [28]. For insect mass and body length, the multi-frequency radar cross-sections (RCSs) were investigated and the estimation of mass and body length could be achieved with uncertainties of 23.7% and 15.7%, respectively [29]. Aside from species identification, the estimation of biomass of high-flying insects can contribute to the study of the relationship between migration of insects and its impacts on the ecosystems, and it can be profoundly affected by the estimation of insect mass [2], with both requiring a higher estimation accuracy of insect mass. In addition, a significant relationship has been found between the aspect ratio and RCS shape (i.e., the ratio of the RCSs for the polarization direction parallel and perpendicular to the body axis), which is only limited to small insects [26]. Among the research of morphological parameter measurement with insect radar, little has been done to investigate the relationship between insect thorax width and radar data.
In our experiment, the multi-frequency RCSs of 15 insects (belonging to 11 species and 3 families, caught in Jiangsu, East China) were measured using an experimental multi-frequency radar. The frequency dependence of insect RCS was fully studied, and the estimation accuracy of mass and body length was further improved. The measured RCS vs. frequency curves were proven to contain information highly correlated with the aspect ratio and thorax width, and therefore using multi-frequency RCSs may be useful for improving the aspect ratio and thorax width estimation. Under the assumption that the mass, body length, wingbeat frequency, aspect ratio and thorax width of flying insects can be measured by insect radar using the proposed technique, an identification simulation was implemented by analyzing the statistical records of insect migrants (belong to 23 species and 7 families, trapped in the Bohai migration corridor, China). The results indicate that the correct identification probabilities exceed 0.5 for all of the 23 species and are higher than 0.8 for 15 of the 23 species. The identification simulation demonstrated that accurate estimations of the morphological parameters of migratory insects could increase the identification capability of entomological radar.
The remainder of this paper is organized as follows. In Section 2, the multi-frequency RCS measurements of migratory insects are first introduced and the estimation accuracy of the morphological parameters with experimental data is then analyzed. In Section 3, we provide an evaluation of the identification performance on the migratory insects based on their morphological parameters. Section 4 outlines the discussion concerning the strengths and weaknesses of the proposed method as well as its future improvement and application. Our main conclusion is outlined in Section 5.
2. Estimation of Morphological Parameters
RCS represents an inherent property (i.e., scattering ability) of a target and defines how a target intercepts and redirects an electromagnetic wave [30]. The measured RCS is a function of shape, composition and aspect of the target and the wavelength and polarization of the transmitted radiation [30,31]. For the radar scattering characteristics of insects, the polarization, temporal and angular variations of the RCSs are the main research foci [26,32,33]. Variations in RCS across the frequency range have been proven to carry some information that can be used to estimate the insect morphological parameters [29]. However, the morphological parameters that can be measured using radar are limited, and current inversion methods of insect mass and body length have insufficient accuracy [26,29]. Therefore, further research was conducted to extract other potential parameters and improve the estimation accuracy.
2.1. Multi-Frequency Insect RCS Measurements
The multi-frequency RCSs of migratory insects are required for research on the frequency dependence of insect RCSs. For this, an experimental multi-frequency radar was constructed with a vector network analyzer and four horn antennas (two antennas working at X-band and the other two antennas working at K-band) in a microwave anechoic chamber [29]. A total of 15 insects were trapped by a light trap the night before the experiment in our research base located in Soochow, China. Each insect adhered to a short polyethylene (PE) thread on its back, and then was hung directly above the antennas with its body axis direction parallel to the polarization direction of the antennas.
The variation of the RCS (i.e., ) with the direction of polarization angle can be represented as [31]
where α0 is the polarization-averaged RCS; and are dimensionless parameters with non-negative values [31,34]; and represents the insect’s body axis (i.e., the orientation of the insect).
These three coefficients (i.e., , and ) can be used to calculate the two conventional RCS values of the target ( and ) as follows [26]:
When the longitudinal axis of the insect’s body is parallel to the polarization plane, the RCS value is usually the maximum of the polarization pattern, denoted as . is the RCS value when the polarisation plane is orthogonal to that of [33,35].
Considering the selection of the polarization direction in our experiment, the measured RCS of the insects was also denoted as to be consistent with the former research [31,33]. The measurement results can be found in Tables S1 and S2. Each insect was alive during the experiment. Before the experiment, the mass, body length and thorax width of each insect were measured and recorded, and the aspect ratio was calculated as shown in Table S3. The mass, body length, thorax width and aspect ratio ranged from 11.5 to 514.5 mg, 6 to 28 mm, 1 to 5 mm and 5.0 to 8.4, respectively. For convenience, each insect was identified with a distinguished class label following an uppercase letter order.
2.2. Multi-Frequency Scattering Characteristic Analysis
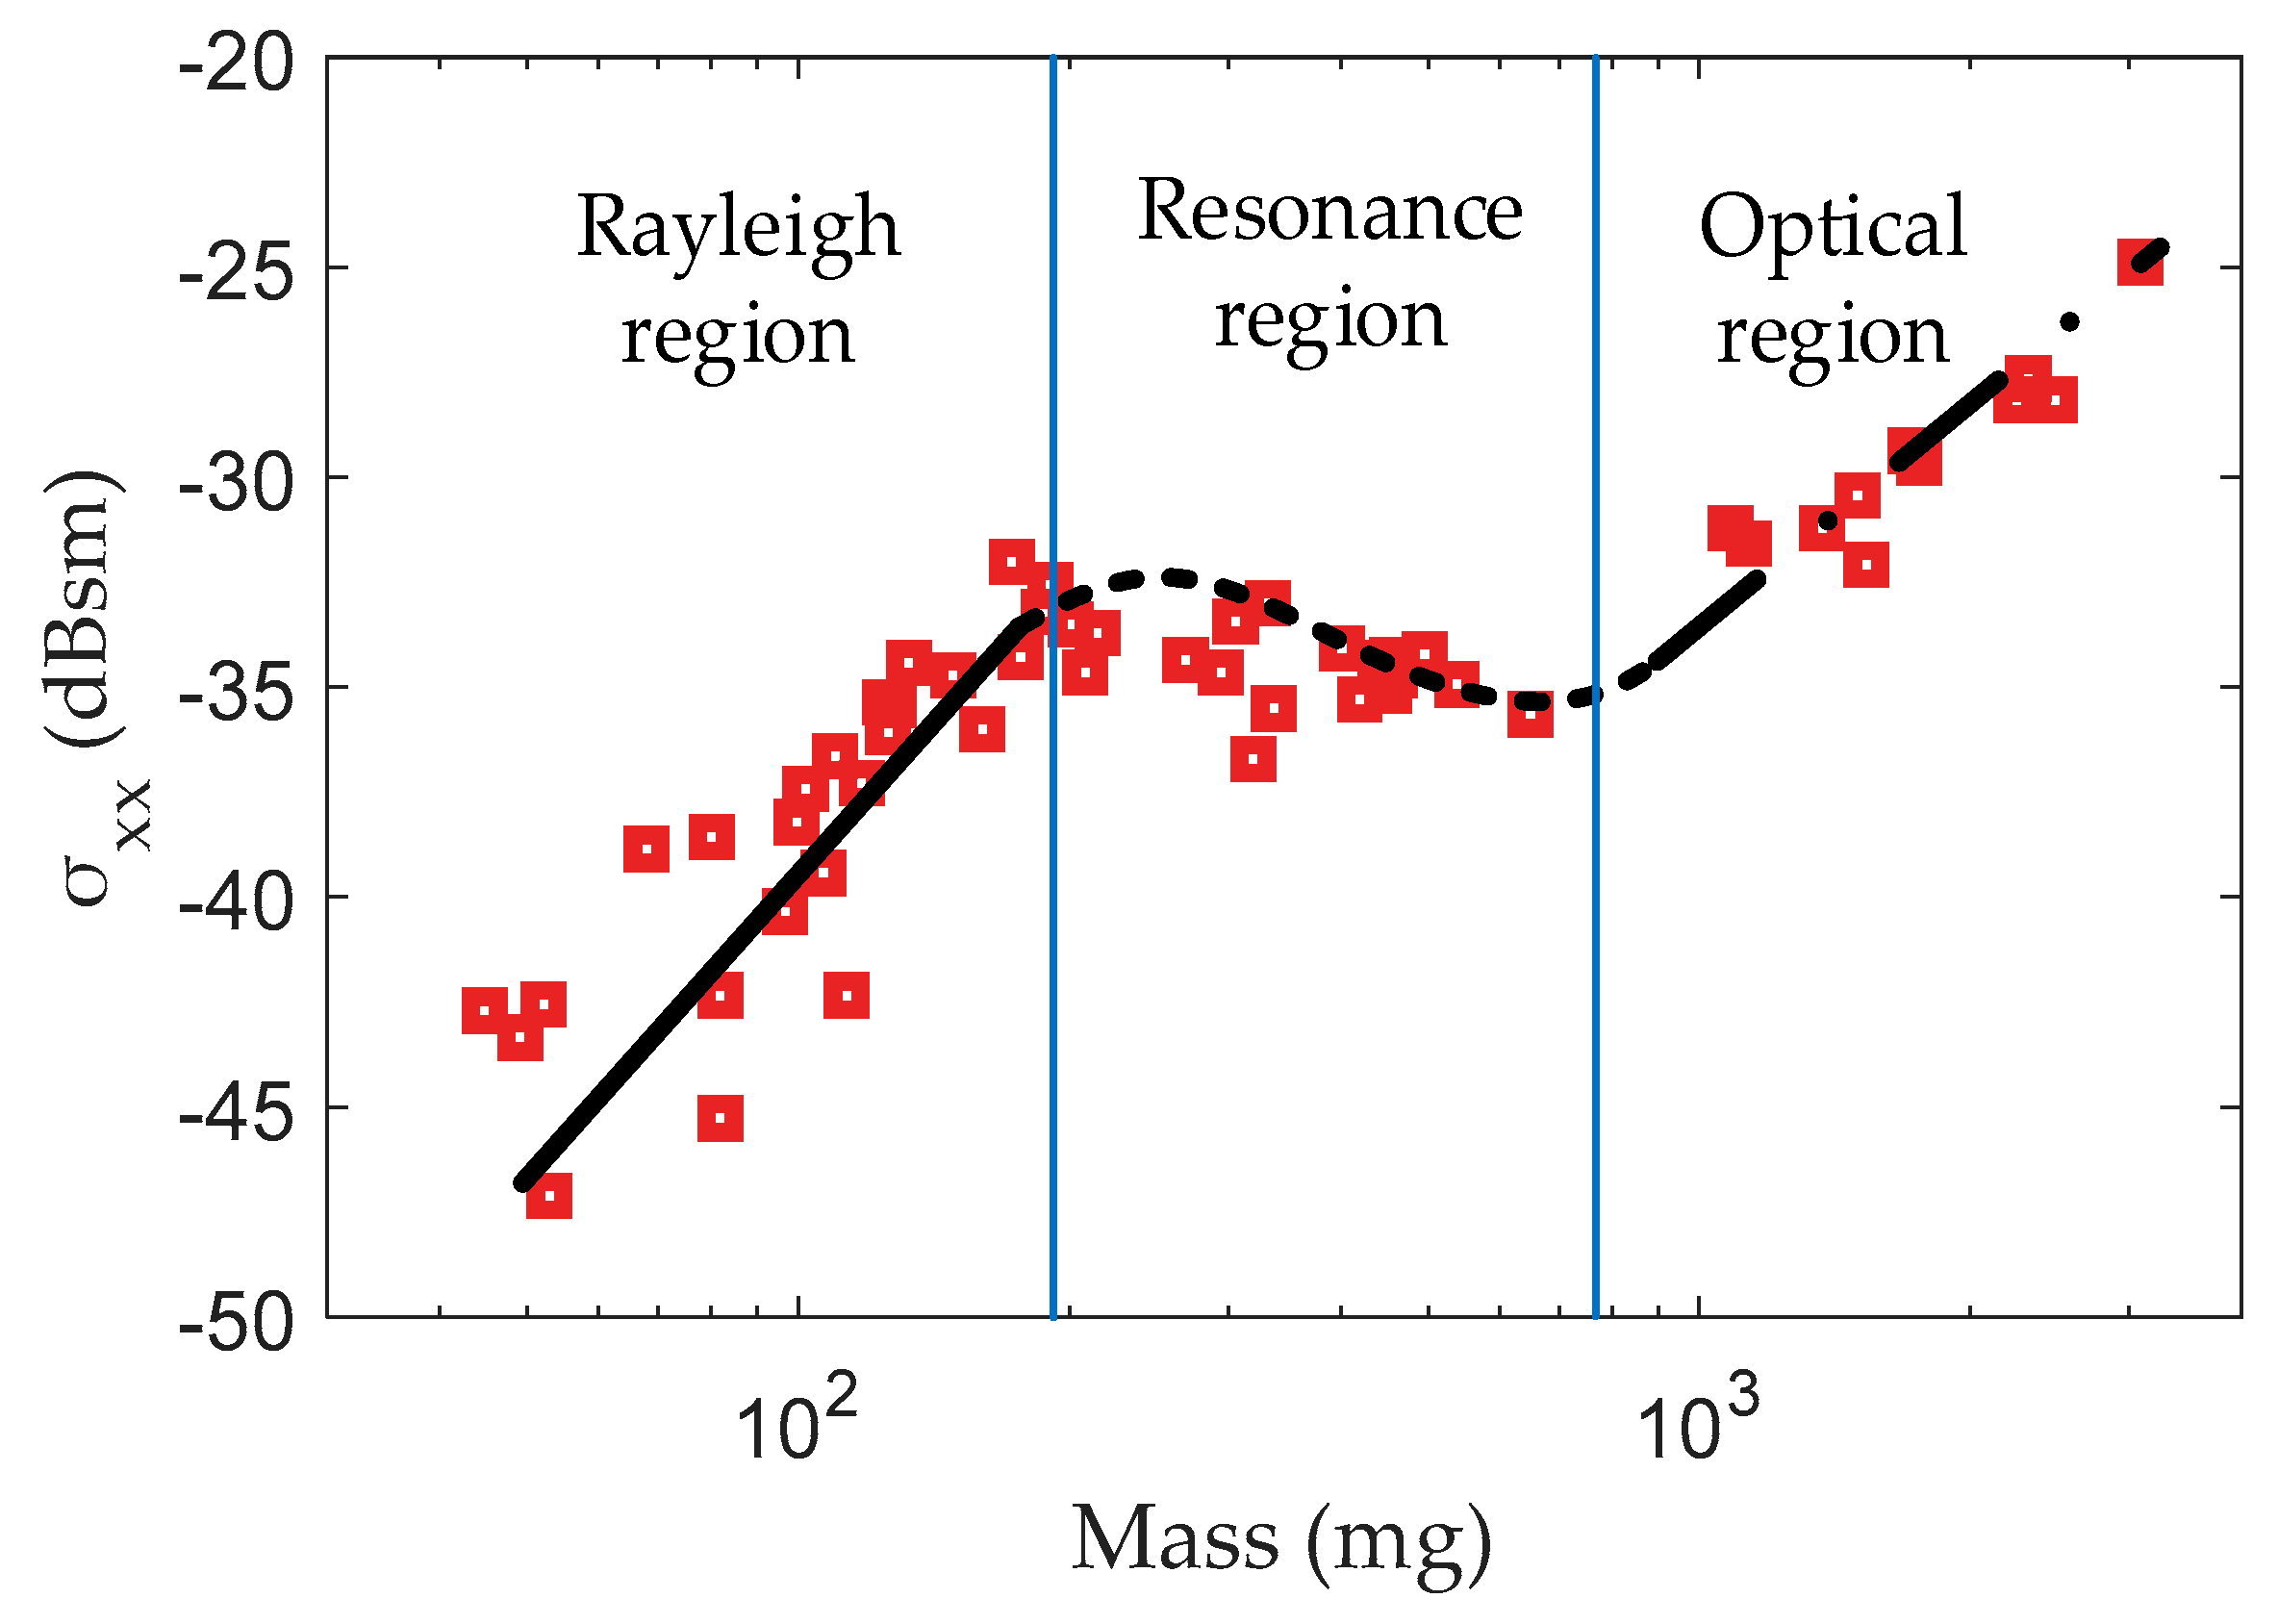
Hobbs et al. presented the RCS measurements for 68 insects, representing 24 species with an insect mass from 9 mg to 3 g at a frequency of 9.4 GHz [33]. The measured –mass curve is shown in Figure 1. The curve can be divided into three sections: Rayleigh region, resonance region and optical region. In the first section, when the scattering of small insects (mass < 100 mg) at X-band is generally in the Rayleigh region, is positively related to mass [33]. As the insect mass increases, the scattering of insects falls into the resonance region where the RCS varies in a more complicated way due to the size to wavelength ratio being close to unity. Therefore, the and mass are negatively related. When the insect is quite large (mass > 1000 mg), the scattering begins to fall into the optical region in which the target size is significantly larger than the wavelength. In the optical region, regains its positive correlation with mass.
RCS is related to insect mass [27]. To explore the variation of this relationship across the frequency range, the vs. mass curves at different frequencies obtained from our measurements are shown in Figure 2. Through contrastive analysis, we found that the vs. mass curves at other frequencies have similar shapes as those at a frequency of 9.4 GHz. The data presented in Figure 2a illustrate the behavior of the insects’ RCS at the end of the Rayleigh region towards the first RCS maxima for the X-band frequency. As expected, the RCS increases with the increase in frequency, and then reaches a maximum. The maximum point moves in negative directions for both the horizontal and vertical axes as the frequency increases. The data presented in Figure 2b illustrate the behavior in the resonance region toward the optical region for the K band frequency. These phenomena can be explained by the sizes of these insects becoming comparable to the wavelength for the K-band frequency, leading to the scattering of these insects in the resonance region toward the optical region. For the insects with a mass larger than 100 mg, the RCSs at K-band are smaller than those at X-band, which can be explained by RCS oscillating in the resonant region. In addition, a high frequency, such as K-band, has the advantage of a larger RCS when detecting small insects, which can provide recommendations for radar system designs.
2.3. Multi-Frequency Scattering Feature Extraction
The previous subsection explored how the vs. mass curve varies with frequency. To further investigate the frequency dependence of insect RCS, we explored the relationship between the vs. frequency curves and the morphological parameters of insects. Firstly, a simulation was conducted to comprehensively analyze the multi-frequency RCS characteristics due to the limited frequencies of our experimental data. As the shape and composition of insects are complex, a simple and acceptable digital model should be selected to emulate the scattering characteristics of the migratory insects. A prolate spheroid is widely used to emulate the body shape of all insect taxa [29,36]. Another important factor to consider is the dielectric composition [37]. Mirkovic demonstrated that a prolate ellipsoid with an internal dielectric of homogenized chitin and hemolymph mixture can emulate true insect characteristics [36]. A prolate ellipsoid with an internal dielectric of the spinal cord best replicates the experiment measurements [29]. In this study, the spinal cord prolate spheroids were used as the approximate model of insects for the qualitative analysis of multi-frequency scattering characteristics.
The simulation results for different prolate spheroids are shown in Figure 3. The lengths of these prolate spheroids ranged from 5 to 28 mm, and the aspect ratio was set to 5. Least squares polynomial fitting was adopted of the simulation data. The vs. frequency curves have similar shapes. The RCS increases or oscillates for each of the models as the frequency increases. As the length increases, the horizontal coordinates of the global maxima decrease and the vertical coordinates of the global maxima increase. The black dots represent the estimated global maxima, which were proven useful for the estimation of the body length and mass [29]. The global maximum of the RCS vs. frequency curve is the resonance parameter, which has a well-documented quantity, especially in radar meteorology [38]. The estimated global maxima were also considered as characteristic information for further analysis in this paper.
2.4. Estimation of Morphological Parameters
The experimental data were processed similarly to extract the estimated global maxima using least squares fitting. Further details for global maxima estimation are available in the original publication [29]. The global maximum of the vs. frequency curve is denoted as and as listed in Table S3. is expressed in dBsm and is expressed in mm, and these two parameters were applied to estimate insect morphological parameters.
Wang et al. demonstrate that the experimentally measured and are linearly related to the body length and logarithm of mass of an insect, respectively, and the estimation of body length and mass could be achieved with uncertainties (i.e., root mean square percentage error, see Appendix A) of 15.7% and 23.7%, respectively [29]. However, this linear relationship was proposed based on the simulated data, and some differences were observed between the simulation models and the experimental insects. Compared with the models, the insects have more complex shapes and the insects are composed of different materials and different portions of the insect bodies have different dielectric properties. Therefore, some differences may exist between the simulation and experimental data, indicating that the proposed linear relationship may be imprecise for the experimental data.
Through analysis, we found that improved mass and body length estimates could be obtained by adopting a high-order polynomial fitting as shown in Figure 4b,c. Insect mass estimated from has an uncertainty of 23.53%, and body length estimated from has an uncertainty of 11.25% (Table 1). The variations of mass with and body length with are also shown in Figure 4a,d. Based on these relationships, we found that the measured can also be used to extract the mass and the measured can be used to extract the body length. All Spearman’s rank correlation coefficients were larger than 0.85, indicating high correlations between the analyzed values. The thorax width is also an important insect characteristic and the variations of the body with and are shown in Figure 4e,f. Both these two parameters showed a significant relationship with the thorax width for these specimens. Therefore, the thorax width can also be estimated.
All estimation results were compared as listed in Table 1. The lowest estimation errors of the mass and body length were 16.31% and 10.74%, reduced from 23.7% and 15.7% in Wang et al. [29], respectively. For the thorax width, no paper has reported its estimation based on radar measurement. This is the first time that the thorax width has been extracted from multi-frequency RCSs with high accuracy. The aspect ratio is also an important feature used to characterize insect shape, and this shape parameter can be expected to provide further information on the target’s identity. Therefore, the aspect ratio is also estimated based on the measured body length and thorax width. The distribution of the estimated aspect ratio versus the true aspect ratio is shown in Figure 5. The aspect ratio has an estimation error of 7.99%. The best-fitting lines of insect mass, body length and thorax width can be respectively represented as
We also assessed the traditional mass estimation method with the laboratory-measured RCSs from a published database following the same process. A data set including 57 insects was taken as the test input. The data originated from two separate data sources: RCS data of 43 insects (mass ranging from 45 to 648 mg) measured by Aldhous [33], denoted here as A, and RCS data of 14 insects (mass ranging from 9 to 254 mg) measured by Wolf et al. [30], denoted here as W. Based on laboratory measurements of RCS and mass, Chapman presented two empirical equations to estimate the mass from the RCS parameters [24]. The calculated RMSPE is 0.446 for data A and 0.474 for data W, which are both three times as large as the value based on the new method. We also analyzed the distributions of percent relative error (PRE, see Appendix A) for the three datasets above (Figure 6). Figure 6 shows that the measurement results for our data are more concentrated in the area of small errors, indicating that a high estimation accuracy of the mass can be achieved for most insects based on the proposed method.
3. Species Identification of Migratory Insects
Insect identification with radars is critically important for insect migration research. The ability to identify a target has many application prospects for using radars as entomological tools [30]. However, establishing a radar classification scheme based on the present knowledge of radar measurements would be inadequate [30]. We stated that morphological features can be used to discriminate different insect species [39]. We proved that additional morphological features can be extracted from entomological radar data, yet lacking the multi-frequency capability at this moment makes it harder to implement insect identification. In the following section we explore the identification performance of various morphological parameters.
3.1. Data Description
In this study, insect classification between 23 species of 5532 total insects is carried out. All insects were caught using a search-light trap at Beihuangcheng Island, in Bohai Gulf, China, from August to October 2015. Beihuangcheng island has been proven to be an important stop for migratory insects and birds in the migration corridor between Shandong Peninsula and Liaodong Peninsula [40]. The species, quantities and measured thorax widths are listed in Table 2. The other morphological parameters (i.e., mass, body length, aspect ratio and wingbeat frequency) were published in former research [39]. The number 1 to 23 is representative of the species. All of the species are moths. Among them, seven species were trapped with less than 50 individuals. Due to the limited quantities of these species, a data extension approach was adopted to extend each species to 5000 samples [39]. Definite measurement errors were introduced into the extension dataset to evaluate the identification performance. Specifically, the constructed measurement deviations of morphological parameters (i.e., mass, body length, thorax width, aspect ratio and wingbeat frequency) were 17%, 11%, 14%, 8% and 1 Hz, respectively, which is consistent with the estimation precision of the proposed parameter estimation method. Next, the new dataset was used for further analysis.
3.2. Classification Method
The species identification of migratory insects is a multi-classification problem. Machine learning algorithms can be selected to solve the problem. Support vector machine (SVM) was originally put forward to solve binary classification problems with the advantages of global optimization, a simple structure and high practicability [41,42,43]. The SVM algorithm has been widely used in many research fields and works well with limited training samples [44]. Mayo et al. demonstrated that the algorithm SVM achieved the best result in the identification of 35 species of moths compared with four other machine learning methods (Bayes, instance-based learning, decision trees and random forests) [45].
Focusing on the classification issues in our study, the SVM algorithm is selected. In the classification process, SVM defines a maximal margin hyperplane in the feature space to separate two labeled targets [41]. To classify non-linearly separable classes, the radial basis function (RBF) is selected due to its superiority over other functions [46].
SVM is a binary classifier. To solve the multi-classification task, the decision-tree-based support vector machine (DTSVM) method was adopted [47]. DTSVM is a formulation of the SVM algorithm that converts a multi-class problem into the integration of several binary classification problems using a tree structure [47]. As shown in Figure 7, a binary tree is developed based on a certain separability measure. Four maximal margin hyperplanes should be calculated for the five-class classification problem.
3.3. Separability Analysis of the Thorax Width
We reported that the mass, body length, aspect ratio and wingbeat frequency can be combined to discriminate different insect species, and the distributions and separability of these four features have been fully analyzed and discussed [39]. In this paper, we proved that the thorax width could also be extracted from the radar signal with a high level of accuracy. The thorax width is a usual and important feature for characterizing insect size and is also easy to measure. Therefore, it is necessary to combine the thorax width for further analysis of insect identification.
For the intuitive analysis of the thorax width distribution, the median and min–max range are shown in Figure 8. The thorax width of all specimens ranges from 1 to 16 mm. The distribution range of the thorax width is relatively narrow for most species.
The thorax width probability distribution curves of the extended data are shown in Figure 9. The probability distribution curve of the thorax width of each species follows a Gaussian distribution, which is in accordance with the actual situation. The range of the thorax width overlaps severely for some species, which cannot be identified based only on the thorax width. However, some other species can be distinguished based only on the thorax width, so the thorax width can also be used as an identification feature that may contribute to further improvement of the identification accuracy. In the subsequent section, the thorax width is used to identify insects incorporating other features.
3.4. Classification Performance Achieved Using All Features
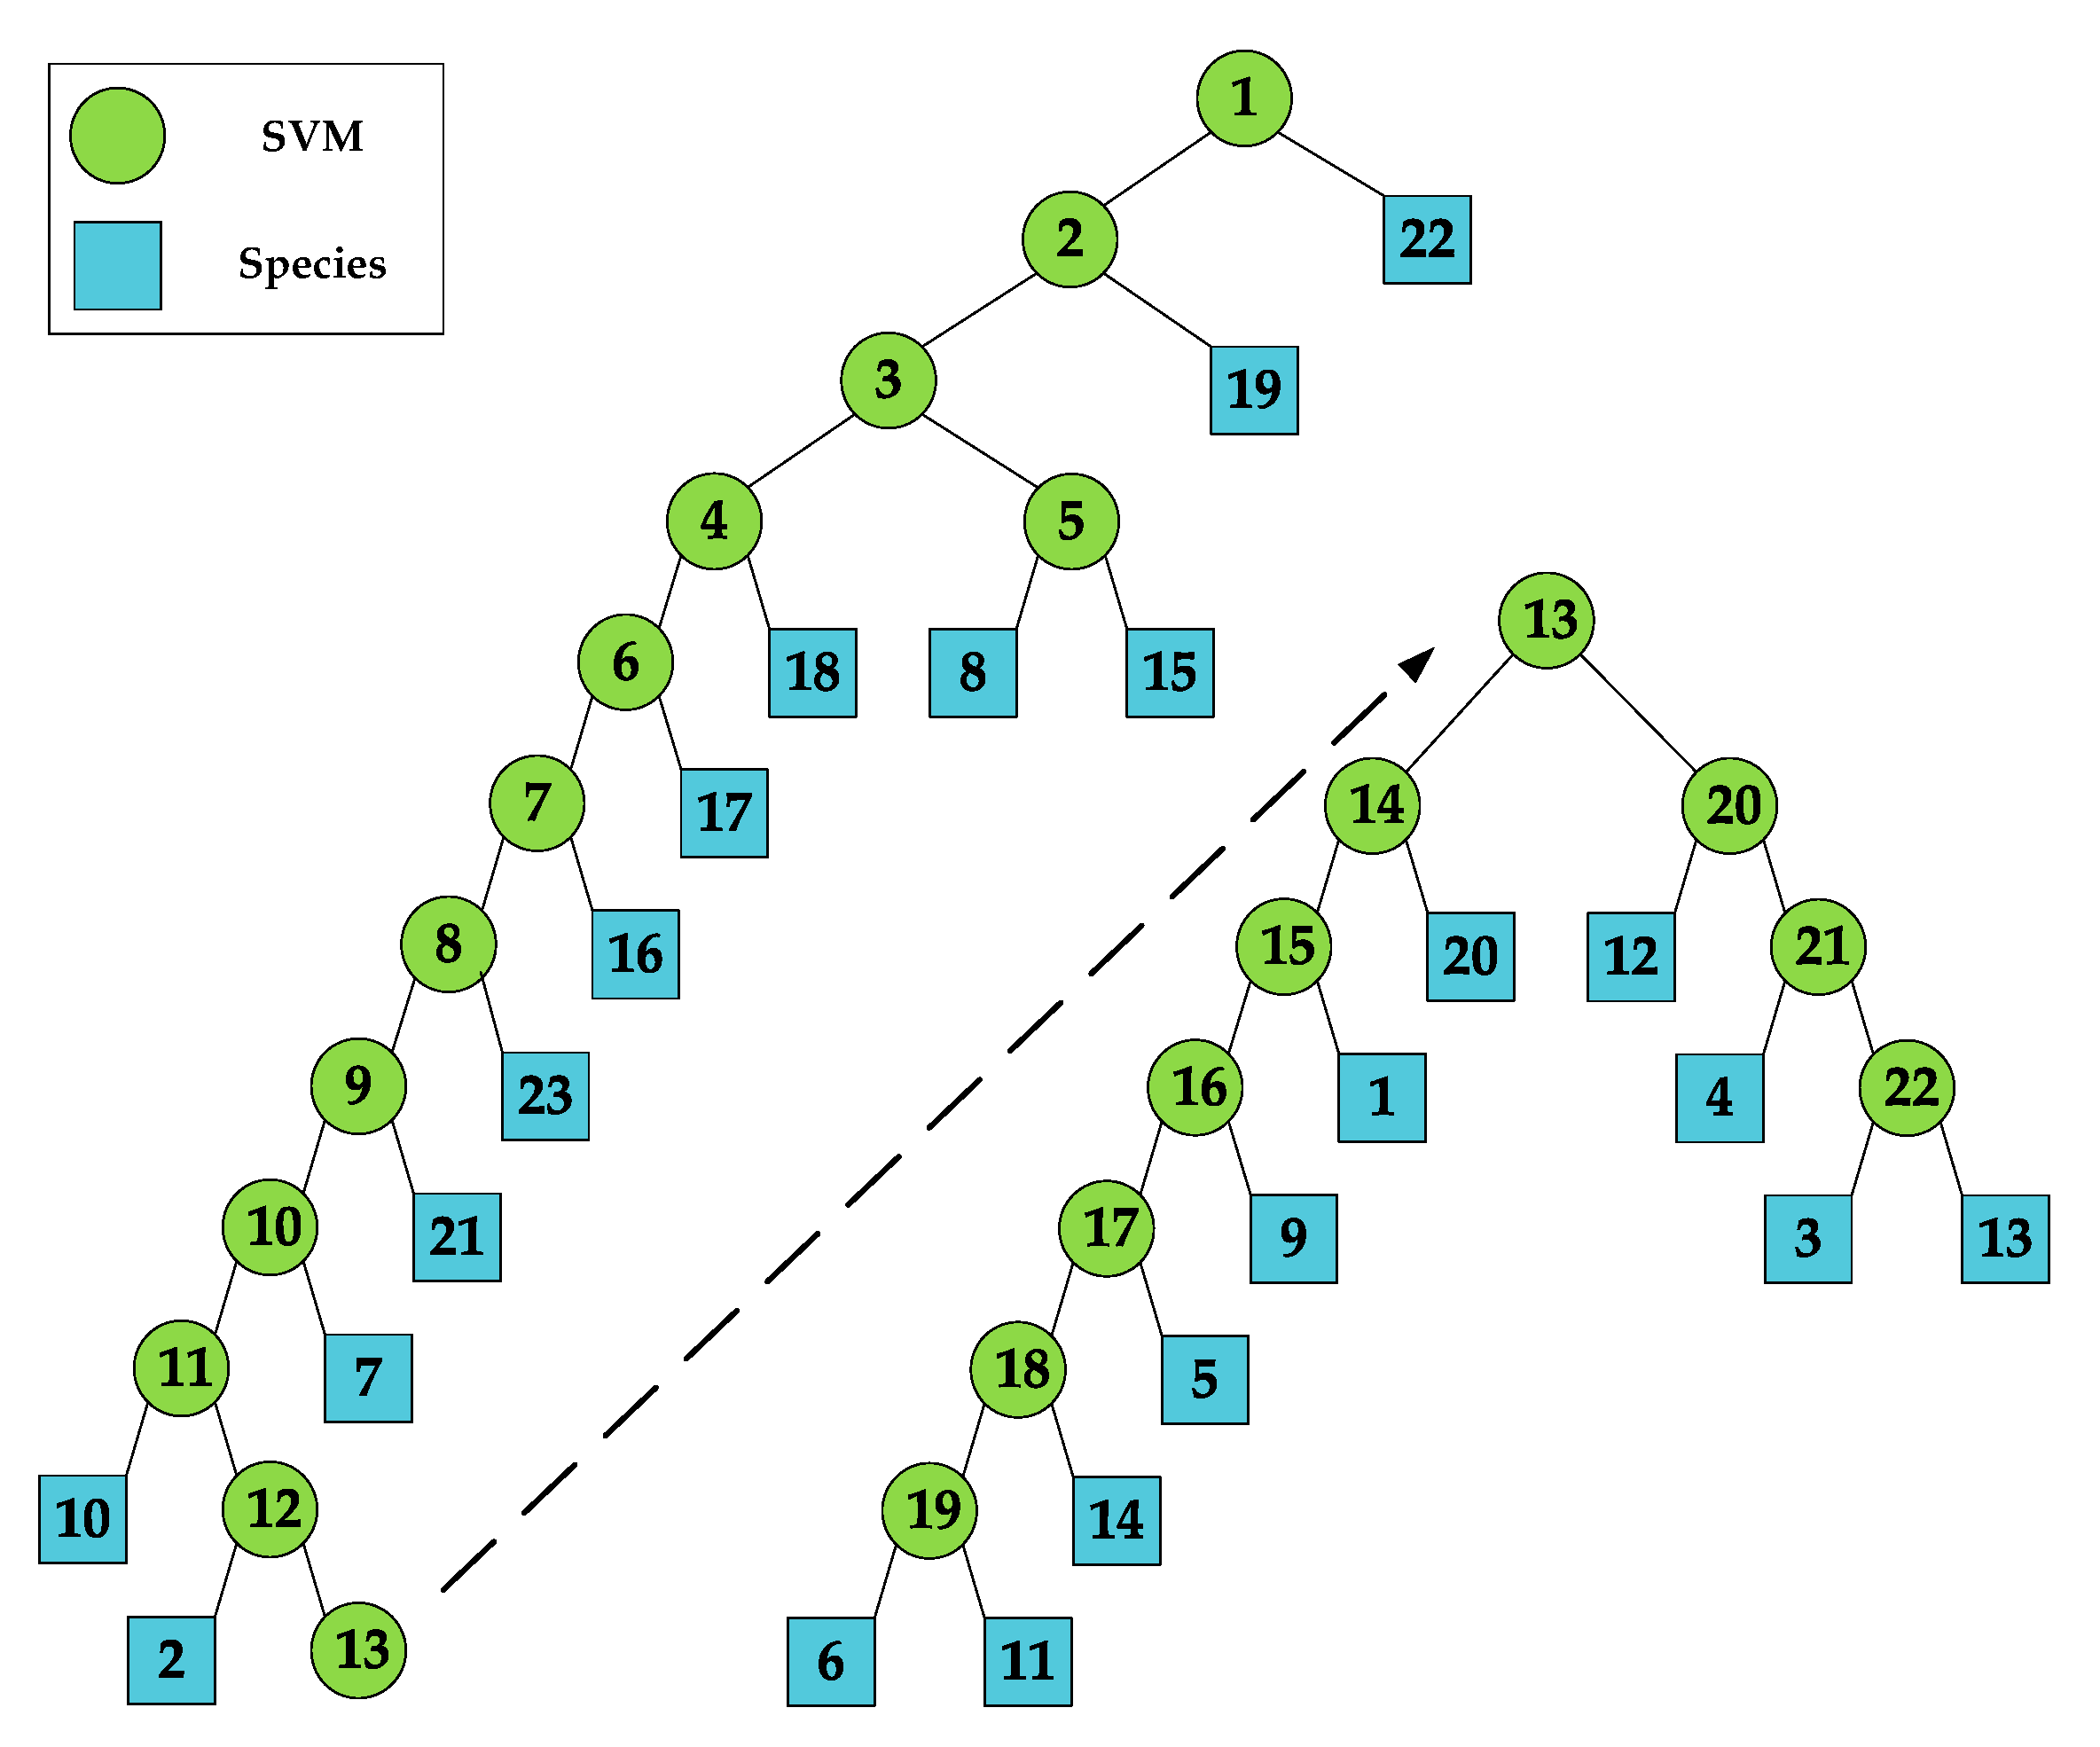
The identification performance of insect species based on the selected insect morphological parameters (i.e., mass, body length, thorax width, aspect ratio and wingbeat frequency) was analyzed in this section. Based on the DTSVM algorithm, the classification scheme was built using the measured morphological features (Figure 10). Twenty-two binary SVM classifiers are needed for the 23 species. In classification, the class that is farthest from the remaining classes is recursively separated until all classes are separated.
Extension samples were randomly attributed to either a training or testing set. The training set was used to train the binary SVM classifiers in the classification scheme (Figure 10). Once all the binary SVM classifiers were trained, the testing database of 57,500 migratory insects was imported to evaluate the classification performance. Then, the identification probability of each insect species was calculated.
The classification results are shown in Figure 11. The correct identification probabilities are higher than 0.5 for all of the 23 species, which means that we have an acceptable recognition ability for all of the species. In addition, the correct identification probabilities are higher than 0.8 for 15 of the 23 species (~65%), indicating that we have a reasonably high recognition ability for about half the species. The average correct identification probability is 0.85.
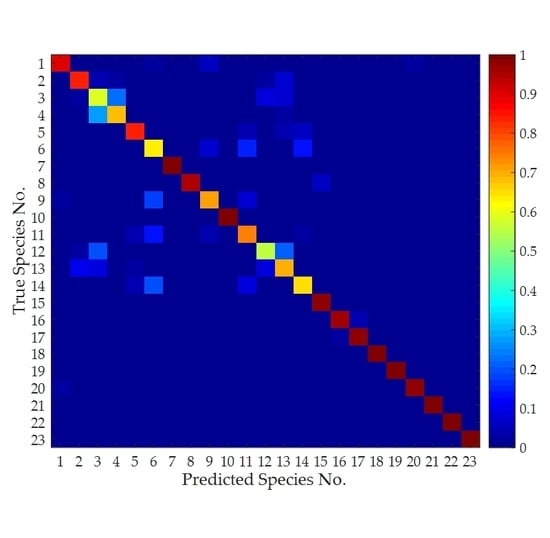
The normalized confusion matrix of the classification results is shown in Figure 12, which describes how many species were correctly classified and how many species were incorrectly classified for each of the categories. The diagonal of the matrix represents the correct classification probability of each species, i.e., it is classified to itself. Each species is more likely to be classified to itself than to other species, which verifies the correctness of the classification method. In addition, some confusion occurred between the species Agrotis tokionis (Butler) (Species No.: 3) and Xestia c-nigrum (Linnaeus) (Species No.: 4). This is because these two species are similar in the body shape and belongs to the same family (i.e., Lepidoptera: Noctuidae).
For comparative analysis, a simulation using the measurement precision of existing methods (insect mass uncertainty 24%, insect body length uncertainty 16% and wingbeat frequency deviation 1Hz) was also conducted, which produced an average correct identification probability of only 0.72. Therefore, the thorax width and aspect ratio are also effective features for insect identification. To summarize, the above statistics show that we can identify migratory insects with the current parameter measurement accuracy.
3.5. Classification Performance Achieved Using Single Features
Using multiple features may result in a good classification performance. Nevertheless, the evaluation of the significance of single features is also important, therefore it is necessary to assess the classification performance based on independent features. The multi-class classification algorithm of the SVM was used here to solve the multi-class classification problems based on single features [40].
The classification results, as listed in Table 3, reveal the degree of relevancy of these features to the given classification problem. Notably, no error was added to the single features during the training and testing phases in this section. In contrast, we ascertained that mass is the most critical feature for insect discrimination, and the identification accuracy based on mass is much higher than that based on the other features because the mass distribution ranges of different insect species vary dramatically. Based only on insect mass, the correct identification probabilities are higher than 0.5 for 18 of the 23 species (~78%). The body length and thorax width are the second and third most important features, respectively. However, the aspect ratio contributed the least to the identification compared with the other morphological features. Body length and thorax width can be approximately assumed to be more intuitive and practical for species identification compared with the aspect ratio. The wingbeat frequency was also proven to be an impactful feature for insect classification.
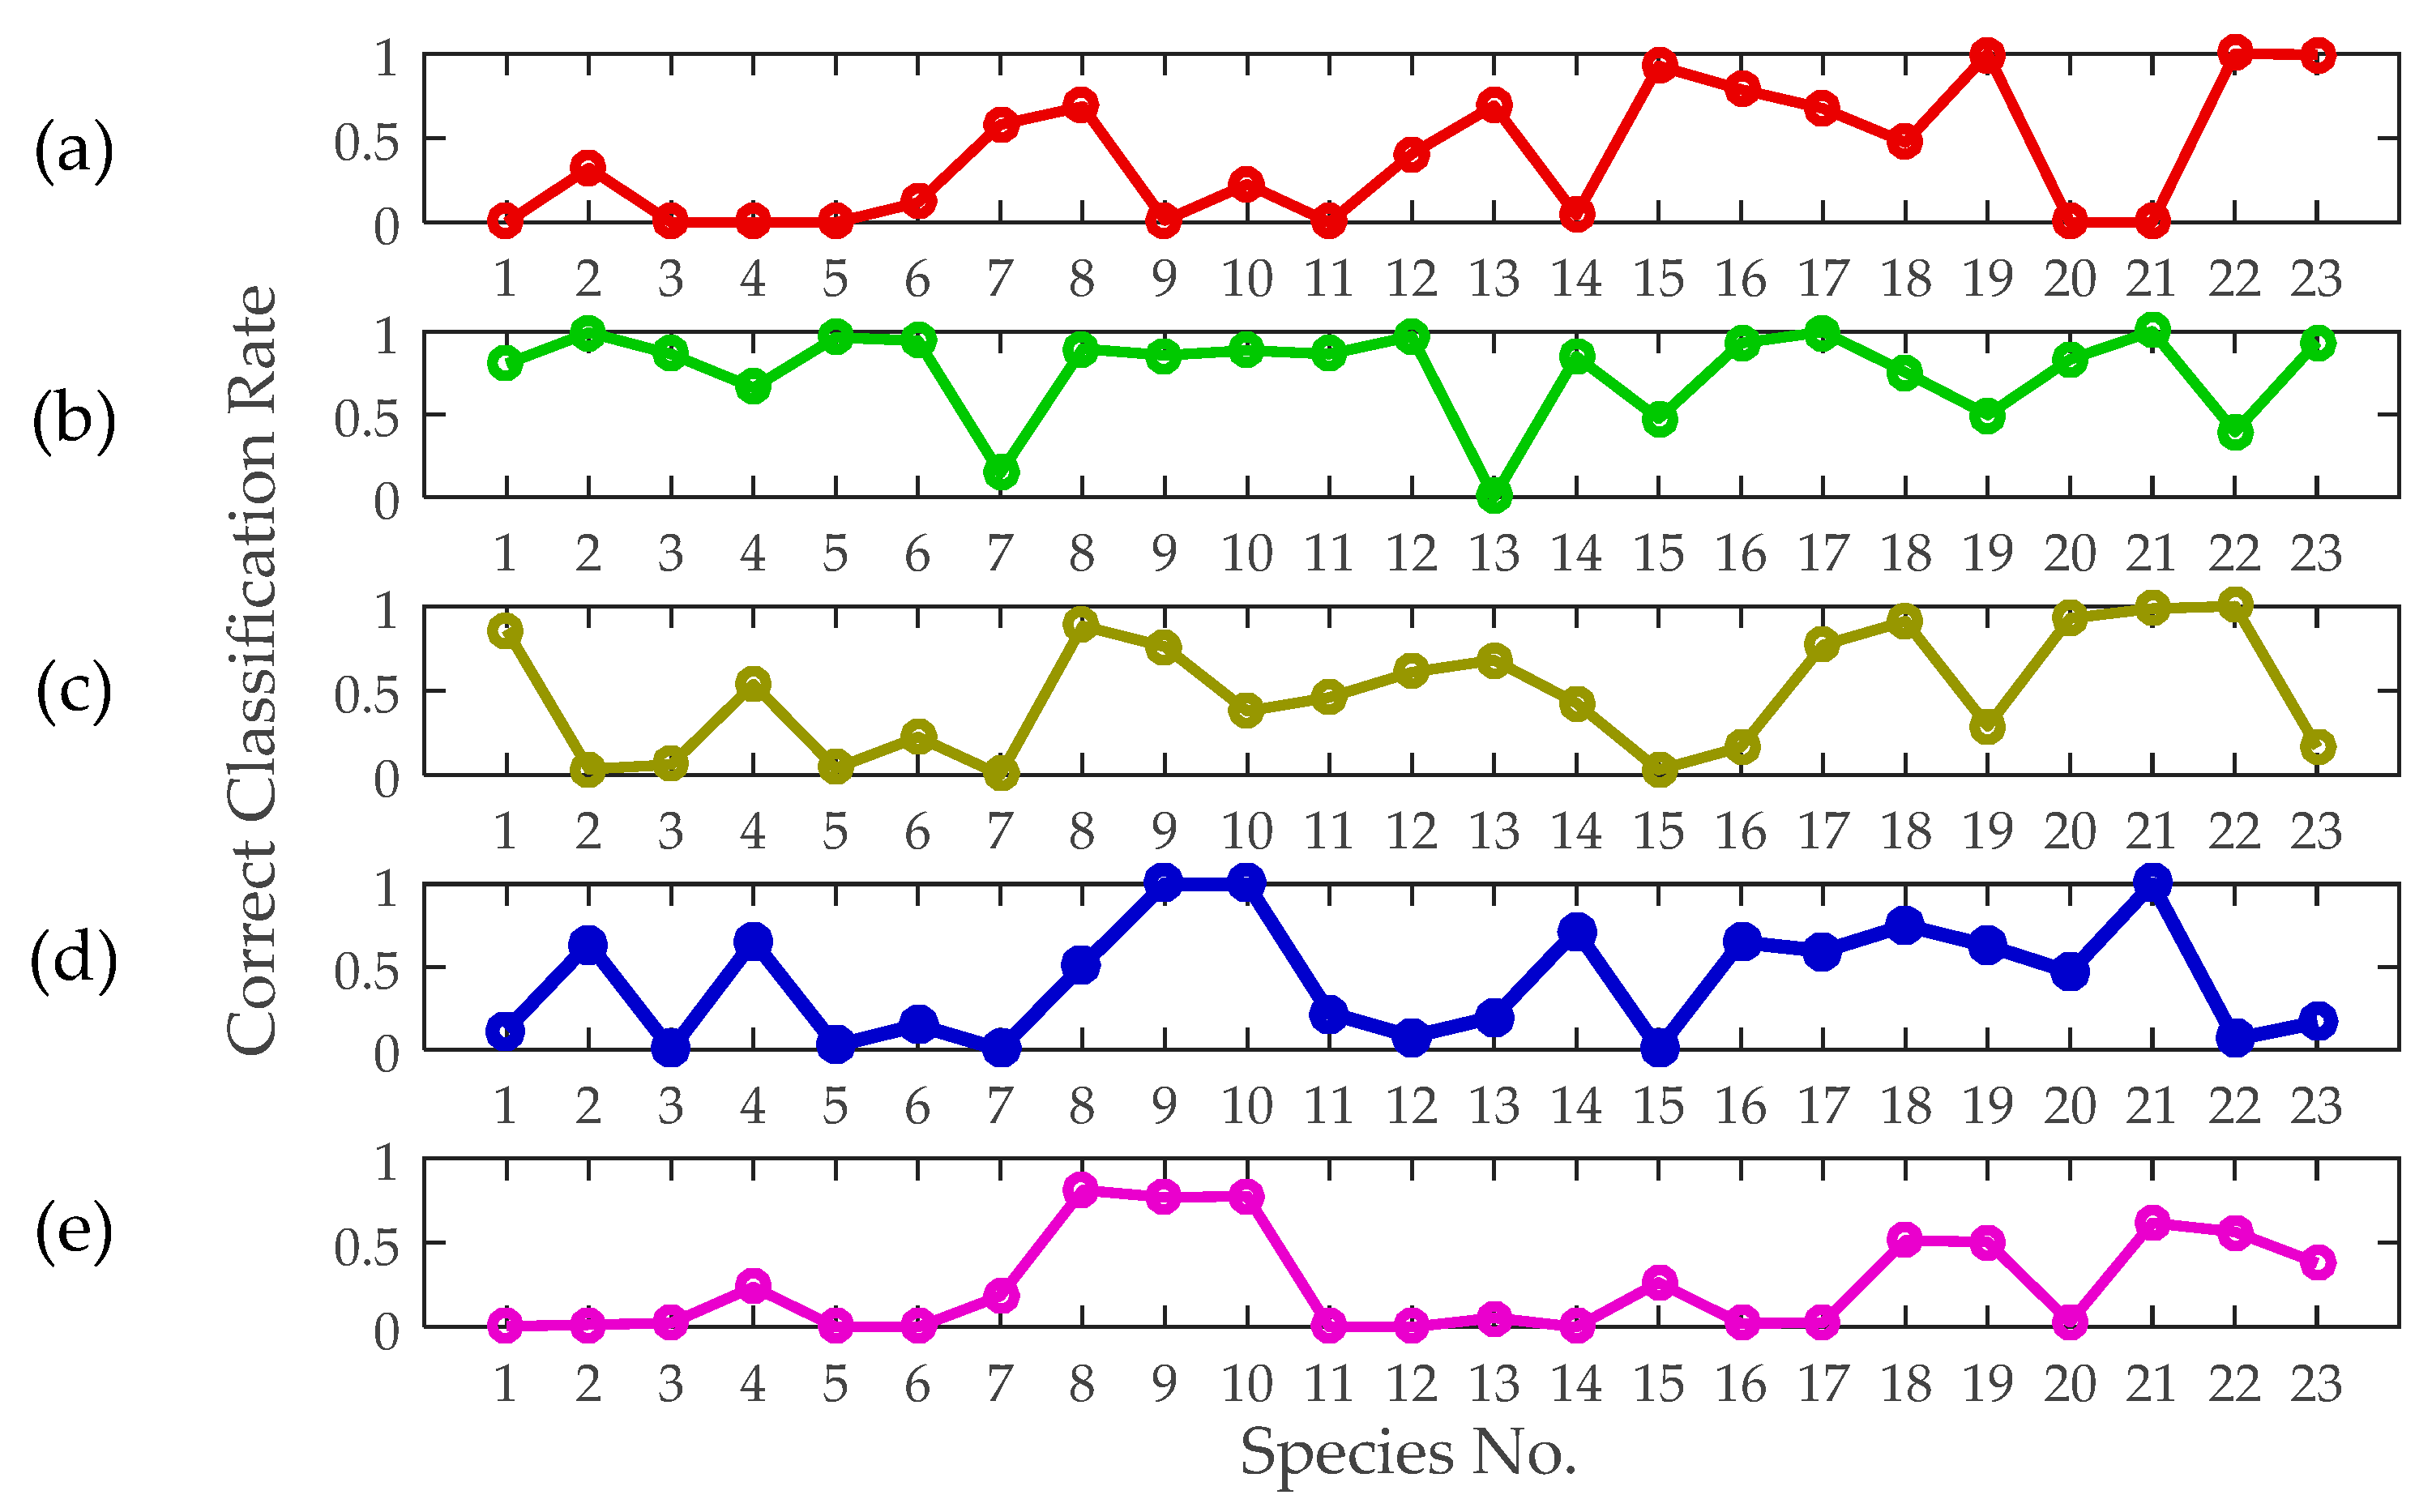
The correct classification rates of different insects based on independent features are also graphically shown in Figure 13. The results rise, fall and differ considerably when different features are used. For a certain species, its correct classification rate can range from 0 to 1 based on different features. Some of the species can be undoubtedly identified only by using certain features. However, if all single feature identification algorithms are just combined, without feature ranking, it may not result in improved identification probabilities.
4. Discussion
The simple and comprehensive relationships between an insect’s morphological parameters and scattering features, to a certain extent, reflect the different scattering mechanisms of insects as dielectric scatterers in the Rayleigh and resonance regions. The experimental results show that the insect’s RCSs has obvious fluctuations with the variation of frequencies even in the Rayleigh region, which might be caused by the insect’s complex body composition. Therefore, the estimation of morphological parameters based on a single frequency may have a negative impact on the accuracy and robustness of the result. In addition, the insects have more complex organism structures and shapes in contrast to the selected digital model, and thus more complex shapes and components should be considered in order to make the model closer to reality.
The reliable identification of radar targets is a prerequisite for using radars as a research instrument. Species identification of airborne insects will help biologists and entomologists conduct research on subclasses or even exact categories and interspecific behavioral characteristics. Additionally, if the species of migrating pests can be known, people can apply more targeted prevention and control measures. Given the lack of identification ability, migratory insects studied with the traditional use of radars are only differentiated between broad categories [48], or even without any classification (only with birds or raindrops) [49], which has seriously affected further analysis of the observed results. Therefore, the species identification of migratory insects requires further analysis.
We proved that the morphological parameters can be used to discriminate different species with high accuracy based on the DTSVM algorithm. Given that the morphological parameters can be extracted from multi-frequency RCSs of insects, we assume that the multi-frequency RCSs can also be used to identify species of migratory insects directly. Therefore, the identification of insect species based on multi-frequency RCSs should be studied in the future, although more data are needed for this. In addition, if entomological radars have the ability to acquire fully polarized data, then other useful parameters can be acquired and estimation accuracy can be improved, which would contribute to a higher species identification accuracy.
5. Conclusions
In this paper, an improved method for the measurement of insect mass and body length using multi-frequency RCSs was proposed, and the lowest estimation errors of the mass and body length were ~17% and ~11%, respectively. The thorax width and aspect ratio can also be extracted from the radar signal with estimation errors of ~14% and ~8%, respectively. Then, the identification performance is evaluated based on these four features and the wingbeat frequency under the achievable estimation precision of the proposed parameter estimation method. The correct identification probabilities are higher than 0.5 for all of the 23 species and are higher than 0.8 for 15 of the 23 species. Finally, we evaluated the classification performance using independent features and found that insect mass is the most effective feature for discriminating different insect species. These findings provide improvements in individual parameter measurement for insect radars and imply the possibility of higher precision species identification, which would promote the biomass quantification of over-flying migratory insects to enable studying the role of insect migration in ecosystems and pest control.
Supplementary Materials
The following are available online at https://www.mdpi.com/2072-4292/11/17/1977/s1: Table S1: X-band RCSs of measured insects (unit dBsm), Table S2: K-band RCSs of measured insects (unit dBsm), Table S3: Physical data of measured species and scattering features extracted from multi-frequency RCSs.
Author Contributions
C.H. and S.K. conceived and designed the methods; S.K. and F.Z. performed the simulation; R.W. supplied technical support for the experimental configuration; S.K., R.W. and C.H. wrote the manuscript based on input from all authors; and all authors provided editorial advice.
Funding
This research was funded by the Special Fund for Research on National Major Research Instruments (Grant No. 31727901).
Conflicts of Interest
The authors declare no conflict of interest.
Appendix A
The Spearman’s rank correlation coefficient (denoted as ), a nonparametric measure of the rank values of two variables, was calculated to evaluate the correlation between the estimated and true values of the morphological parameters [50]. The Spearman’s correlation evaluates the monotonic relationships between two variables, even if their relationship is not linear [50]. The p-value is also calculated to test the null hypothesis of no correlation.
The root mean square percentage error (RMSPE) was used to evaluate the deviations between the true values and the estimates [51]. A smaller value of the RMSPE indicates a higher mean estimation accuracy. The percent relative error (PRE) was used to evaluate the estimation error of each insect. A smaller value of the MRE indicates a higher estimation accuracy.
The Spearman’s rank correlation coefficient is defined as [50]
where is the difference between the two ranks of and .
The RMSPE is defined as [51]
where and are estimates and true values, respectively, and N is the number of specimens.
The PRE is defined as [52]
References
- Chapman, J.W.; Reynolds, D.R.; Smith, A.D. Vertical-Looking Radar: A new tool for monitoring high-altitude insect migration. BioScience 2003, 53, 503–511. [Google Scholar] [CrossRef]
- Hu, G.; Lim, K.S.; Horvitz, N.; Clark, S.J.; Reynolds, D.R.; Sapir, N.; Chapman, J.W. Mass seasonal bioflows of high-flying insect migrants. Science 2016, 354, 1584–1587. [Google Scholar] [CrossRef] [Green Version]
- Nebuloni, R.; Capsoni, C.; Vigorita, V. Quantifying bird migration by a high-resolution weather radar. IEEE Trans. Geosci. Remote Sens. 2008, 46, 1867–1875. [Google Scholar] [CrossRef]
- Bauer, S.; Hoye, B.J. Migratory animals couple biodiversity and ecosystem functioning worldwide. Science 2014, 344, 1242552. [Google Scholar] [CrossRef] [PubMed]
- Holland, R.A.; Wikelski, M.; Wilcove, D.S. How and why do insects migrate. Science 2006, 313, 794–796. [Google Scholar] [CrossRef] [PubMed]
- Hunter, D.; Deveson, T. Forecasting and management of migratory pests in Australia. Insect Sci. 2010, 9, 13–25. [Google Scholar] [CrossRef]
- Reynolds, D.R.; Chapman, J.W.; Harrington, R. The migration of insect vectors of plant and animal viruses. Adv. Virus Res. 2006, 67, 453–517. [Google Scholar] [PubMed]
- Chapman, J.W.; Reynolds, D.R.; Wilson, K. Long-range seasonal migration in insects: Mechanisms, evolutionary drivers and ecological consequences. Ecol. Lett. 2015, 18, 287–302. [Google Scholar] [CrossRef] [PubMed]
- Drake, V.A.; Farrow, R.A. A radar and aerial-trapping study of an early spring migration of moths (Lepidoptera) in inland New South Wales. Austral. J. Ecol. 1985, 10, 223. [Google Scholar] [CrossRef]
- Chapman, J.W.; Reynolds, D.R.; Smith, A.D.; Riley, J.R.; Pedgley, D.E.; Woiwod, I.P. High-altitude migration of the diamondback moth Plutella xylostella to the UK: A study using radar, aerial netting, and ground trapping. Ecol. Entomol. 2002, 27, 641–650. [Google Scholar] [CrossRef]
- Carolyn, M.; Brzustowski, J.M.; Taylor, P.D.; Peckford, M.L.; Dave, W. RadR: An open-source platform for acquiring and analysing data on biological targets observed by surveillance radar. BMC Ecol. 2010, 10, 22. [Google Scholar]
- Schaefer, G.W. An Airborne Radar Technique for the Investigation and Control of Migrating Pest Insects. Philos. Trans. R. Soc. Lond. B Biol. Sci. 1979, 287, 459–465. [Google Scholar] [CrossRef]
- Hobbs, S.E.; Wolf, W.W. An airborne radar technique for studying insect migration. Bull. Entomol. Res. 1989, 79, 693–704. [Google Scholar] [CrossRef]
- Riley, J.R.; Reynolds, D.R.; Smith, A.D.; Edwards, A.S.; Zhai, B.P. Observations of the autumn migration of the rice leaf roller cnaphalocrocis medinalis (Lepidoptera: Pyralidae) and other moths in eastern china. Bull. Entomol. Res. 1995, 85, 397–414. [Google Scholar] [CrossRef]
- Westbrook, J.K.; Eystera, R.S.; Wolf, W.W.; Lingrena, P.D.; Raulstonb, J.R. Migration pathways of corn earworm (Lepidoptera: Noctuidae) indicated by tetroon trajectories. Agric. For. Meteorol. 1995, 73, 67–87. [Google Scholar] [CrossRef]
- Hu, C.; Deng, Y.K.; Wang, R.; Liu, C.J.; Long, T. High accuracy acquisition of 3-d flight trajectory of individual insect based on phase measurement. Sensors 2016, 16, 2166. [Google Scholar] [CrossRef] [PubMed]
- Drake, V.A. Automatically operating radars for monitoring insect pest migrations. Insect Sci. 2002, 9, 27–39. [Google Scholar] [CrossRef]
- Riley, J.R. Riding on the Wind: A Radar Perspective of Insect Flight; Inaugural Lecture Series; University of Greenwich: London, UK, 1999. [Google Scholar]
- Richter, J.H.; Jensen, D.R.; Noonkester, V.R.; Kreasky, J.B.; Stimmann, M.W.; Wolf, W.W. Remote Radar Sensing: Atmospheric Structure and Insects. Science 1973, 180, 1176–1178. [Google Scholar] [CrossRef] [PubMed]
- Riley, J.R. Collective orientation in night-flying insects. Nature 1975, 253, 113–114. [Google Scholar] [CrossRef]
- Reynolds, A.M.; Reynolds, D.R.; Sane, S.P.; Hu, G.; Chapman, J.W. Orientation in high-flying migrant insects in relation to flows: Mechanisms and strategies. Philos. Trans. R. Soc. B Biol. Sci. 2016, 371, 20150932. [Google Scholar] [CrossRef]
- Riley, J.R.; Reynolds, D.R. Radar-based studies of the migratory flight of grasshoppers in the middle Niger area of Mali. Proc. R. Soc. Lond. B Biol. Sci. 1979, 204, 67–82. [Google Scholar] [CrossRef] [PubMed]
- Drake, V.A.; Wang, H.K.; Harman, I.T. Insect monitoring radar: Remote and network operation. Comput. Electron. Agric. 2002, 35, 77–94. [Google Scholar] [CrossRef]
- Chapman, J.W.; Smith, A.D.; Woiwood, I.P.; Reynolds, D.R.; Riley, J.R. Development of vertical-looking radar technology for monitoring insect migration. Comput. Electron. Agric. 2002, 35, 95–110. [Google Scholar] [CrossRef]
- Chapman, J.W.; Drake, V.A.; Reynolds, D.R. Recent insights from radar studies of insect flight. Annu. Rev. Entomol. 2011, 56, 337–356. [Google Scholar] [CrossRef] [PubMed]
- Drake, V.A.; Chapman, J.W.; Lim, K.S.; Reynolds, D.R.; Riley, J.R.; Smith, A.D. Ventral-aspect radar cross sections and polarization patterns of insects at X band and their relation to size and form. Int. J. Remote Sens. 2017, 38, 5022–5044. [Google Scholar] [CrossRef]
- Riley, J.R. Radar cross section of insects. Proc. IEEE 1985, 73, 228–232. [Google Scholar] [CrossRef]
- Wang, R.; Hu, C.; Fu, X.; Long, T.; Zeng, T. Micro-doppler measurement of insect wing-beat frequencies with W-band coherent radar. Sci. Rep. 2017, 7, 1396. [Google Scholar] [CrossRef]
- Wang, R.; Hu, C.; Liu, C.J.; Kong, S.Y.; Lang, T.J. Migratory Insect Multifrequency Radar Cross Sections for Morphological Parameter Estimation. IEEE Trans. Geosci. Remote Sens. 2018, 57, 3450–3461. [Google Scholar] [CrossRef]
- Wolf, W.W.; Vaughn, C.R.; Harris, R.; Loper, G.M. Insect radar cross-sections for aerial density measurements and target classification. Trans. Am. Soc. Agric. Eng. 1993, 36, 949–954. [Google Scholar] [CrossRef]
- Aldhous, A.C. An Investigation of the Polarisation Dependence of Insect Radar Cross Sections at Constant Aspect. Ph.D. Thesis, Cranfield Institute of Technology, Cranfield, UK, 1989. [Google Scholar]
- Hu, C.; Li, W.D.; Wang, R.; Liu, C.J.; Zhang, T.R.; Li, W.Q. Accurate Insect Orientation Extraction Based on Polarization Scattering Matrix Estimation. IEEE Geosci. Remote. Sens. Lett. 2017, 14, 1755–1759. [Google Scholar] [CrossRef]
- Hobbs, S.E.; Aldhous, A.C. Insect ventral radar cross-section polarisation dependence measurements for radar entomology. IEE Proc. Radar Sonar Navig. 2006, 153, 502–508. [Google Scholar] [CrossRef] [Green Version]
- Dean, T.J.; Drake, V.A. Monitoring insect migration with radar: The ventral-aspect polarization pattern and its potential for target identification. Int. J. Remote Sens. 2005, 26, 3957–3974. [Google Scholar] [CrossRef]
- Smith, A.D.; Riley, J.R.; Gregory, R.D. A method for routine monitoring of the aerial migration of insects by using a vertical-looking radar. Philos. Trans. R. Soc. Lond. Ser. B Biol. Sci. 1993, 340, 393–404. [Google Scholar]
- Melnikov, V.M.; Istok, M.J.; Westbrook, J.K. Asymmetric radar echo patterns from insects. J. Atmos. Ocean. Technol. 2015, 32, 659–674. [Google Scholar] [CrossRef]
- Nelson, S.O.; Bartley, P.G.; Lawrence, K.C. RF and microwave dielectric properties of stored-grain insects and their implications for potential insect control. T. ASABE 1998, 41, 685–692. [Google Scholar] [CrossRef]
- Doviak, R.J.; Dusan, S. Doppler Radar and Weather Observations, 2nd ed.; Academic Press: Cambridge, MA, USA, 2006. [Google Scholar]
- Hu, C.; Kong, S.Y.; Wang, R.; Long, T.; Fu, X.W. Identification of Migratory Insects from their Morphological Features using a Decision-Tree Support Vector Machine and its Application to Radar Entomology. Sci. Rep. 2018, 8, 5449. [Google Scholar] [CrossRef]
- Feng, H.-Q.; Wu, K.-M.; Ni, Y.-X.; Cheng, D.-F.; Guo, Y.-Y. Nocturnal migration of dragonflies over the Bohai Sea in northern China. Ecol. Entomol. 2006, 31, 511–520. [Google Scholar] [CrossRef]
- Cortes, C.; Vapnik, V.N. Support-vector networks. Mach. Learn. 1995, 20, 273–297. [Google Scholar] [CrossRef]
- Chang, C.C.; Lin, C.J. Libsvm: A library for support vector machines. ACM Trans. Intell. Syst. Technol. 2011, 2, 27. [Google Scholar] [CrossRef]
- Brereton, R.G.; Lloyd, G.R. Support vector machines for classification and regression. Analyst 2010, 135, 230–267. [Google Scholar] [CrossRef]
- Le-Qing, Z.; Zhen, Z. Automatic insect classification based on local mean colour feature and Supported Vector Machines. Orient. Insects 2012, 46, 260–269. [Google Scholar] [CrossRef]
- Mayo, M.; Watson, A.T. Automatic species identification of live moths. In Proceedings of the International Conference on Innovative Techniques and Applications of Artificial Intelligence, Cambridge, UK, 11–13 December 2006. [Google Scholar]
- Huang, C.; Davis, L.S.; Townshend, J.R.G. An assessment of support vector machines for land cover classification. Int. J. Remote Sens. 2002, 23, 725–749. [Google Scholar] [CrossRef]
- Takahashi, F.; Abe, S. Decision-tree-based multiclass support vector machines. In Proceedings of the 9th International Conference on Neural Information Processing, Singapore, 18–22 November 2002; Volume 3, pp. 1418–1422. [Google Scholar]
- Drake, V.A. Distinguishing target classes in observations from vertically pointing entomological radars. Int. J. Remote. Sens. 2016, 37, 3811–3835. [Google Scholar] [CrossRef]
- Martin, W.J.; Shapiro, A. Discrimination of bird and insect radar echoes in clear air using high-resolution radars. J. Atmos. Ocean. Technol. 2007, 24, 1215–1230. [Google Scholar] [CrossRef]
- Myers, J.L.; Well, A.D. Research Design and Statistical Analysis. In Research Design and Statistical Analysis, 2nd ed.; Lawrence Erlbaum Associates Publishers: Mahwah, NJ, USA, 2003; p. 508. [Google Scholar]
- Yannis, G.; Antoniou, C.; Papadimitriou, E. Autoregressive nonlinear time-series modeling of traffic fatalities in Europe. Eur. Transp. Res. Rev. 2011, 3, 113–127. [Google Scholar] [CrossRef]
- Davier, A.A.; Holland, P.W.; Thayer, D.T. Kernel equating: Continuization and equating. In The Kernel Method of Test Equating; Springer: New York, NY, USA, 2004; p. 66. [Google Scholar]
Figure 1.
versus mass at a frequency of 9.4 GHz. Note: Red squares denote radar cross-section (RCS) data provided in the study of Hobbs et al. [33] and black lines denote approximate fitting. represents the RCS value when the body axis direction is parallel to the polarization direction.
Figure 1.
versus mass at a frequency of 9.4 GHz. Note: Red squares denote radar cross-section (RCS) data provided in the study of Hobbs et al. [33] and black lines denote approximate fitting. represents the RCS value when the body axis direction is parallel to the polarization direction.

Figure 2.
versus mass at different frequencies: (a) X-band; (b) K-band. Note: Discrete points denote measured radar cross-section in our experiment. For better observation, lines of the same colors denote simple polynomial fittings to them. The fit order is 3 for data at X-band and 5 for data at K-band.
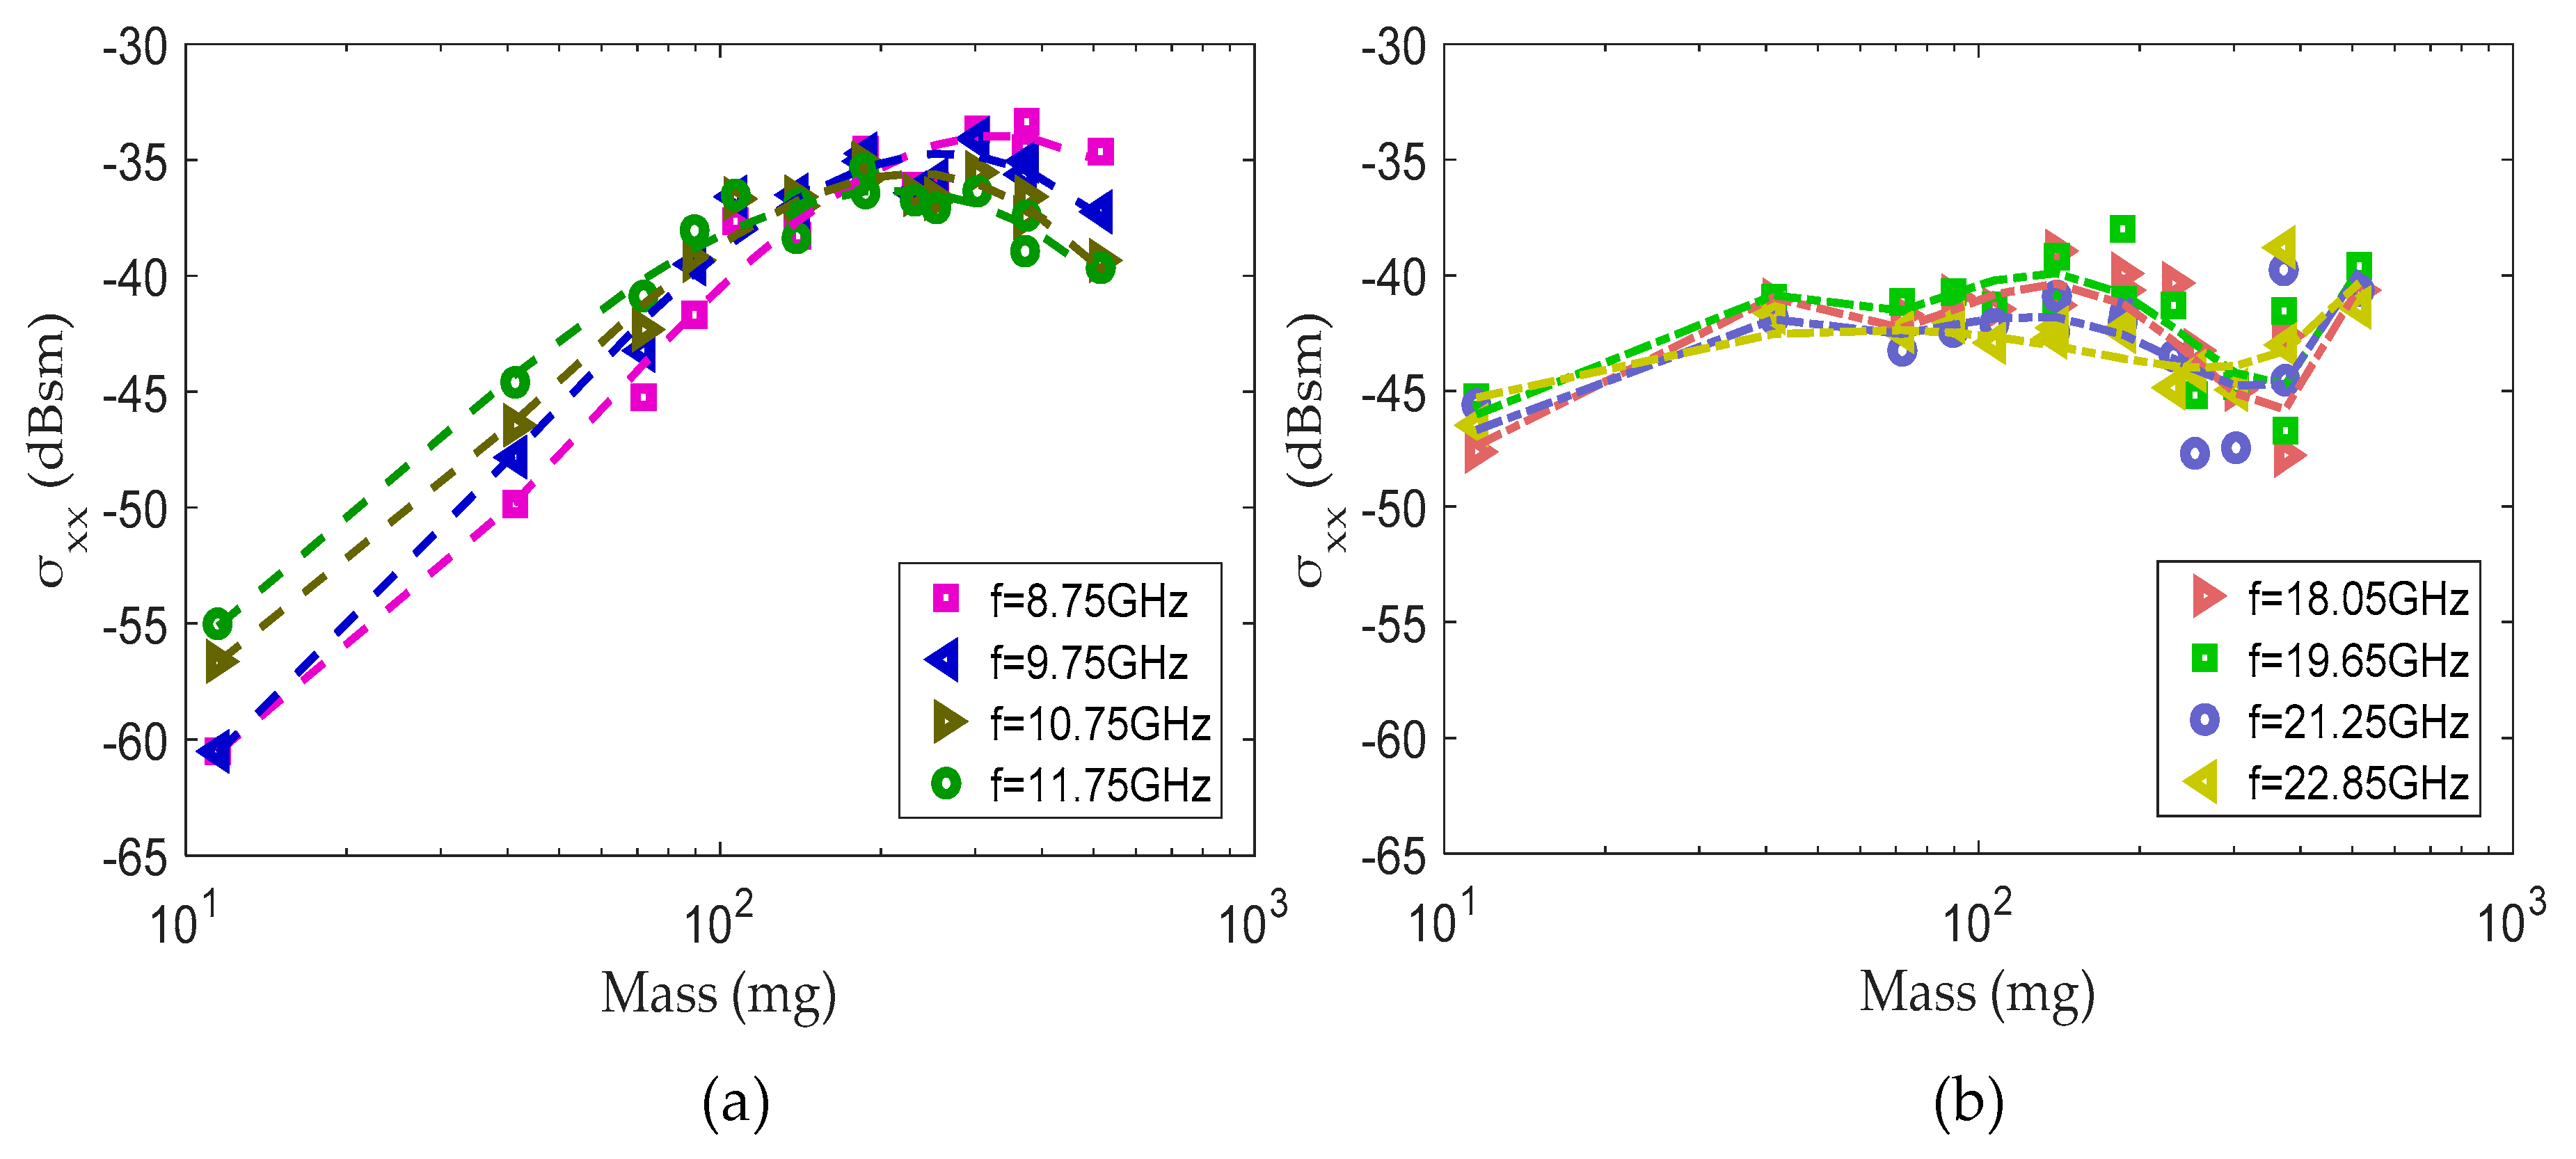
Figure 3.
Simulated RCS–frequency curves for prolate spheroids. Note: Black dots represent the estimated global maxima. The fit order is 4 for 5, 6, 7 and 8 mm spheroids; 6 for 12, 16 and 20 mm spheroids; and 9 for 24 and 28 mm spheroids.
Figure 3.
Simulated RCS–frequency curves for prolate spheroids. Note: Black dots represent the estimated global maxima. The fit order is 4 for 5, 6, 7 and 8 mm spheroids; 6 for 12, 16 and 20 mm spheroids; and 9 for 24 and 28 mm spheroids.
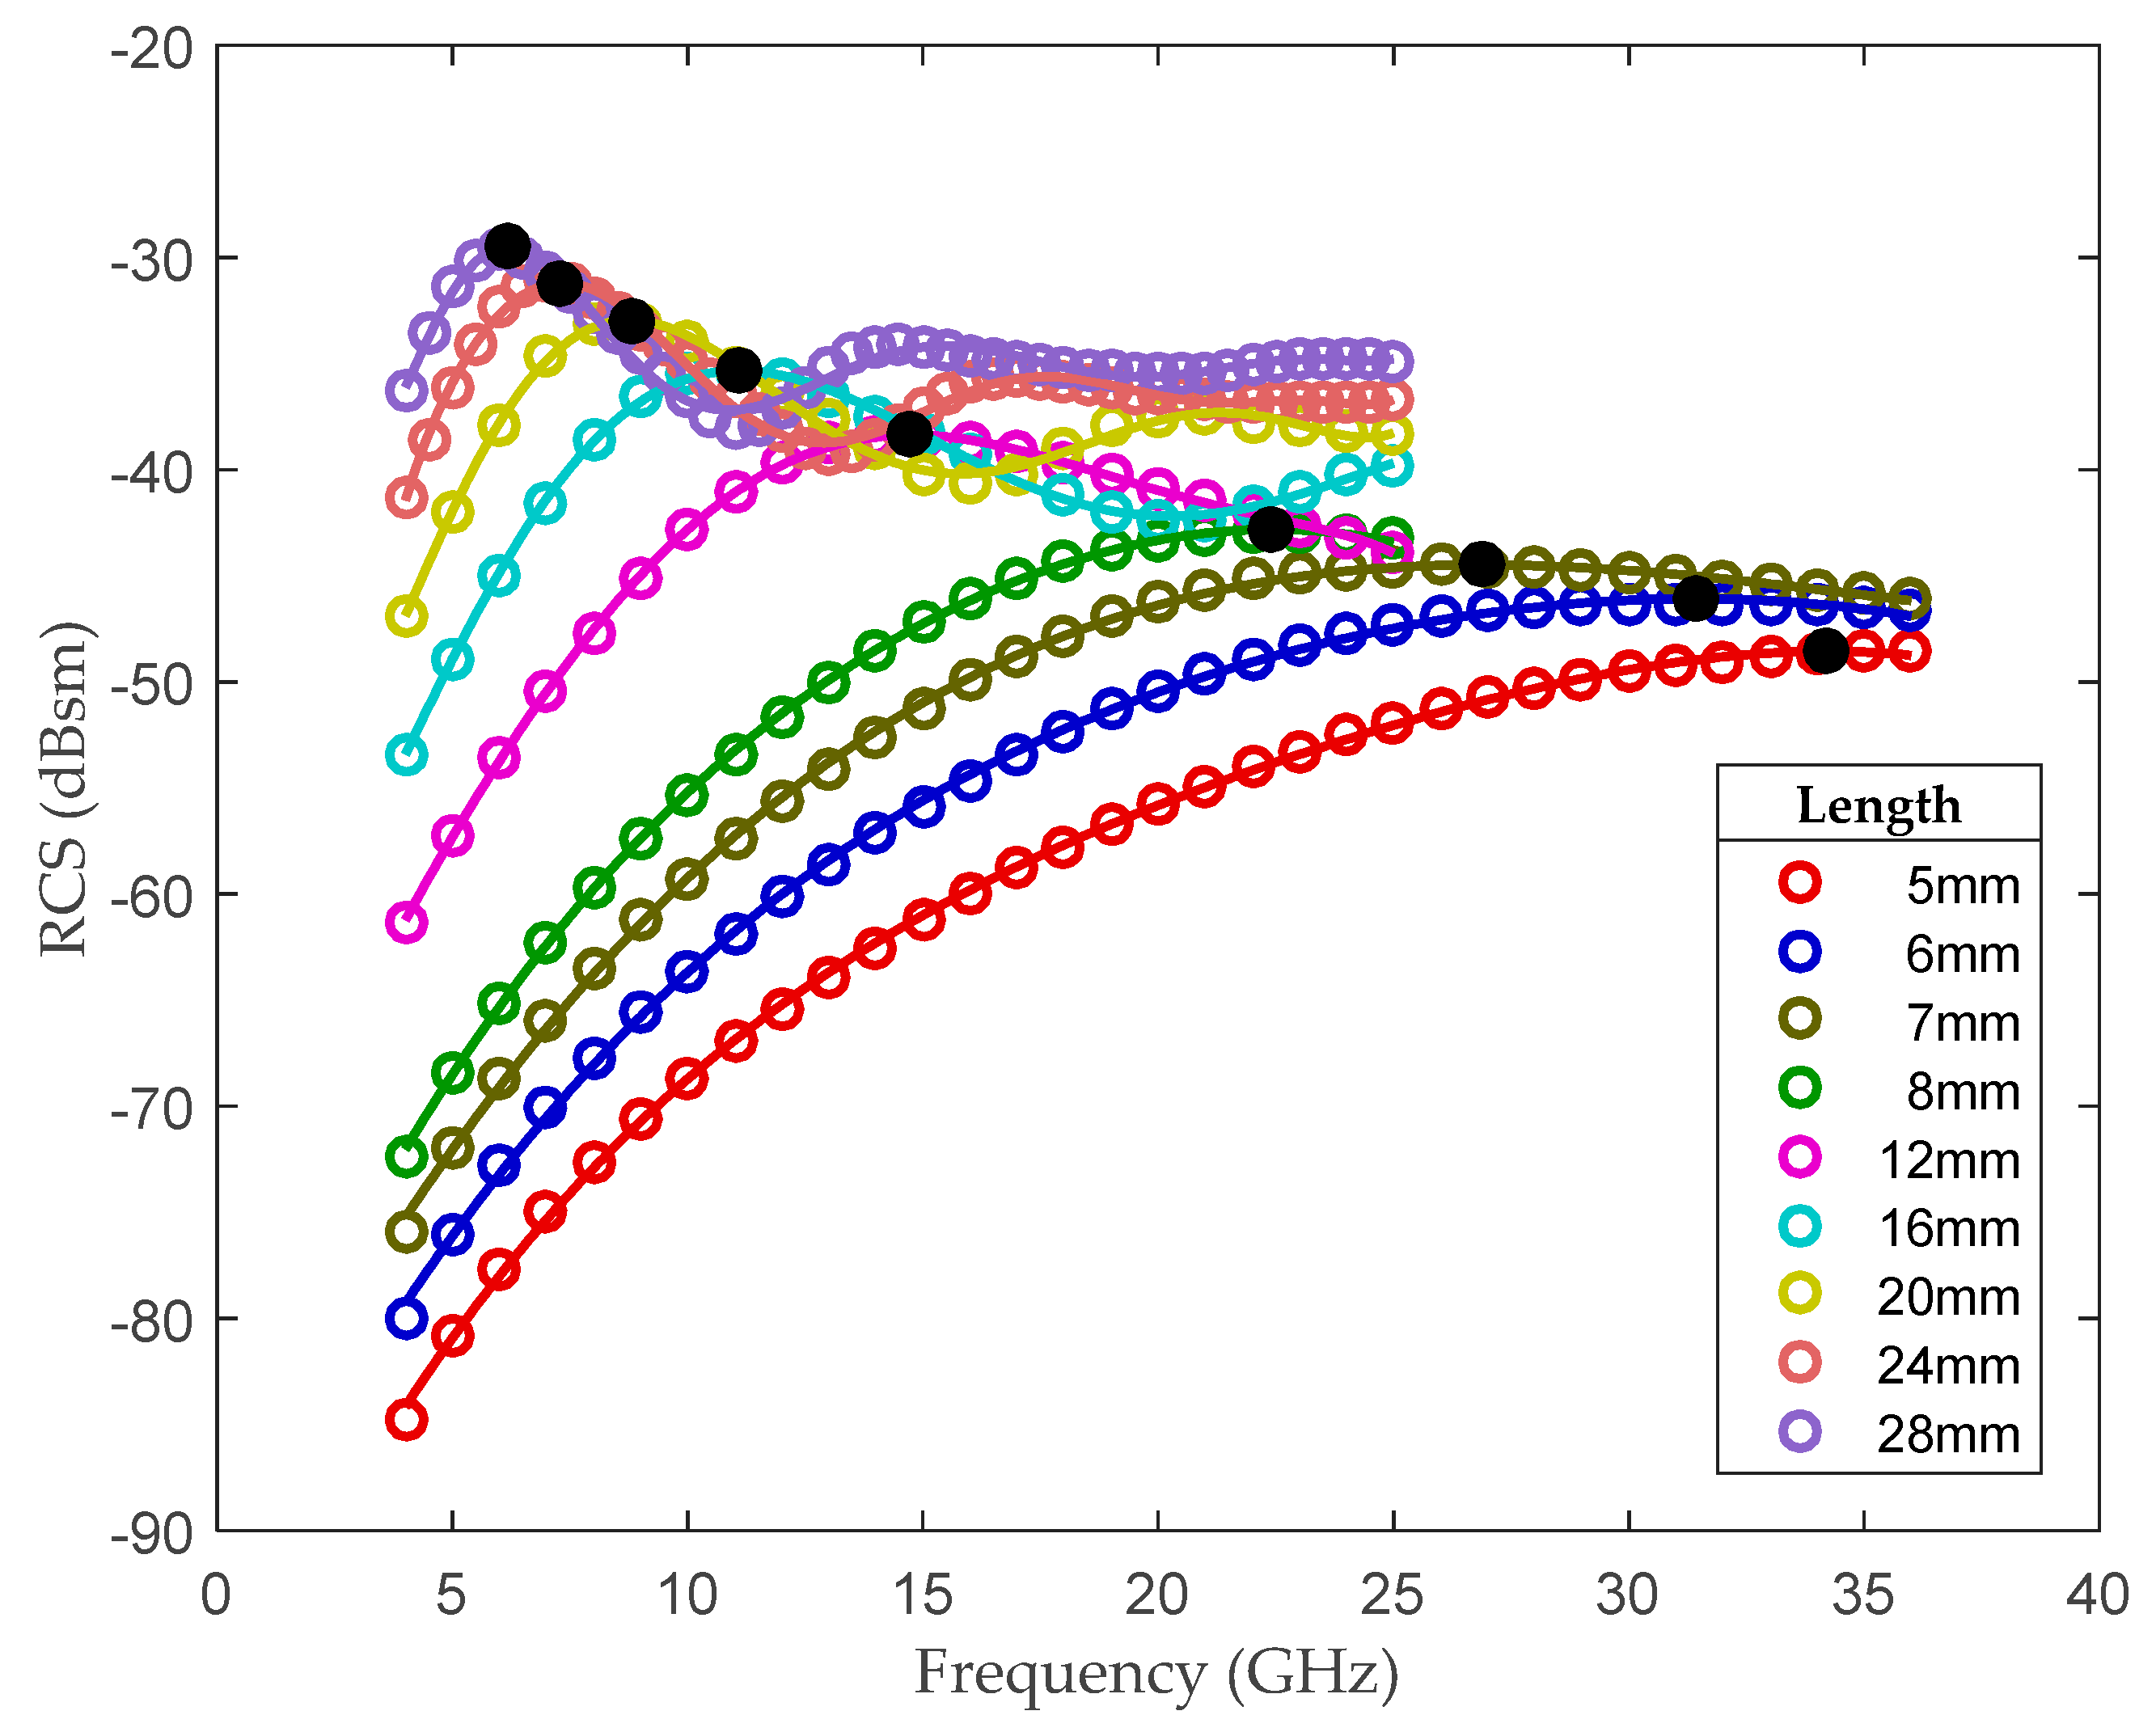
Figure 4.
Experimental and fitting results. (a,c,e) Relations between and morphological parameters. (b,d,f) Relations between and morphological parameters. Note: is the Spearman’s rank correlation coefficient; p means p-value; and RMSPE represents root mean square percentage error (see Appendix A).
Figure 4.
Experimental and fitting results. (a,c,e) Relations between and morphological parameters. (b,d,f) Relations between and morphological parameters. Note: is the Spearman’s rank correlation coefficient; p means p-value; and RMSPE represents root mean square percentage error (see Appendix A).
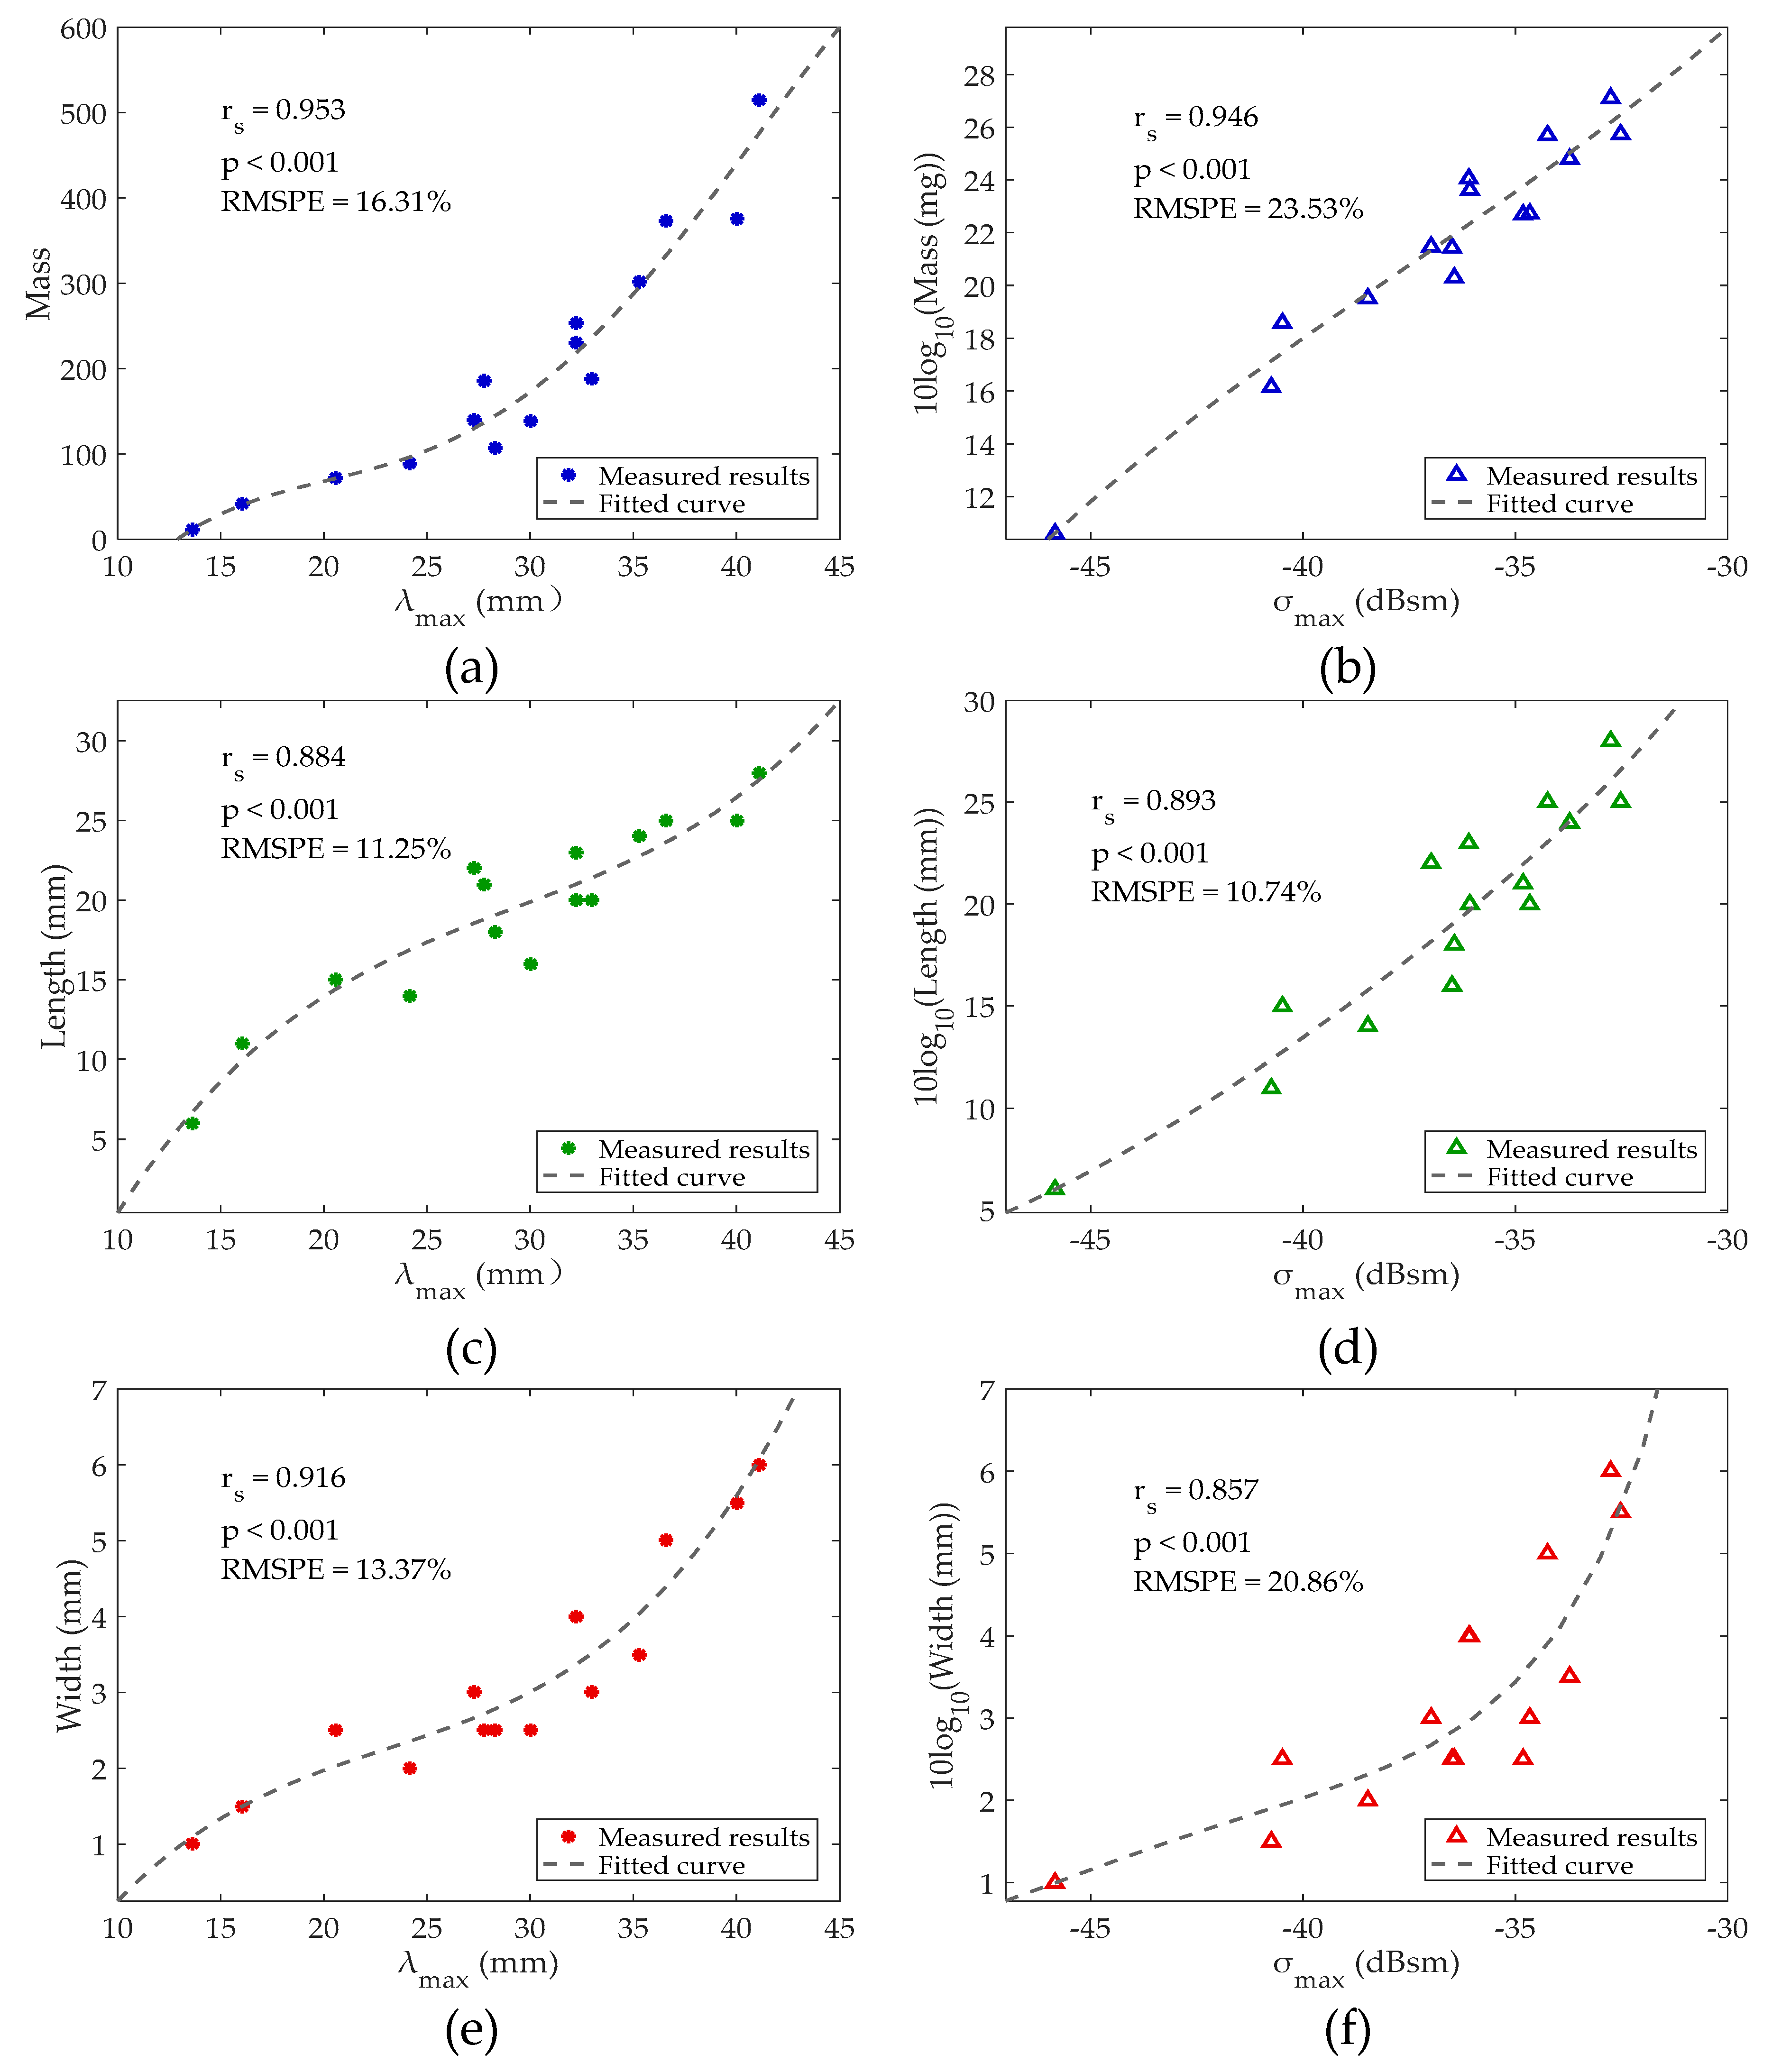
Figure 5.
Relation of the estimated aspect ratio to true aspect ratio. The green dots depict the estimated aspect ratio. The black line depicts the reference line.
Figure 5.
Relation of the estimated aspect ratio to true aspect ratio. The green dots depict the estimated aspect ratio. The black line depicts the reference line.

Figure 6.
Distributions of percent relative errors. (a) Data measured by Aldhous [33], (b) data measured by Wolf et al. [30], and (c) our data. The definition of percent relative error is given in Appendix A.
Figure 6.
Distributions of percent relative errors. (a) Data measured by Aldhous [33], (b) data measured by Wolf et al. [30], and (c) our data. The definition of percent relative error is given in Appendix A.
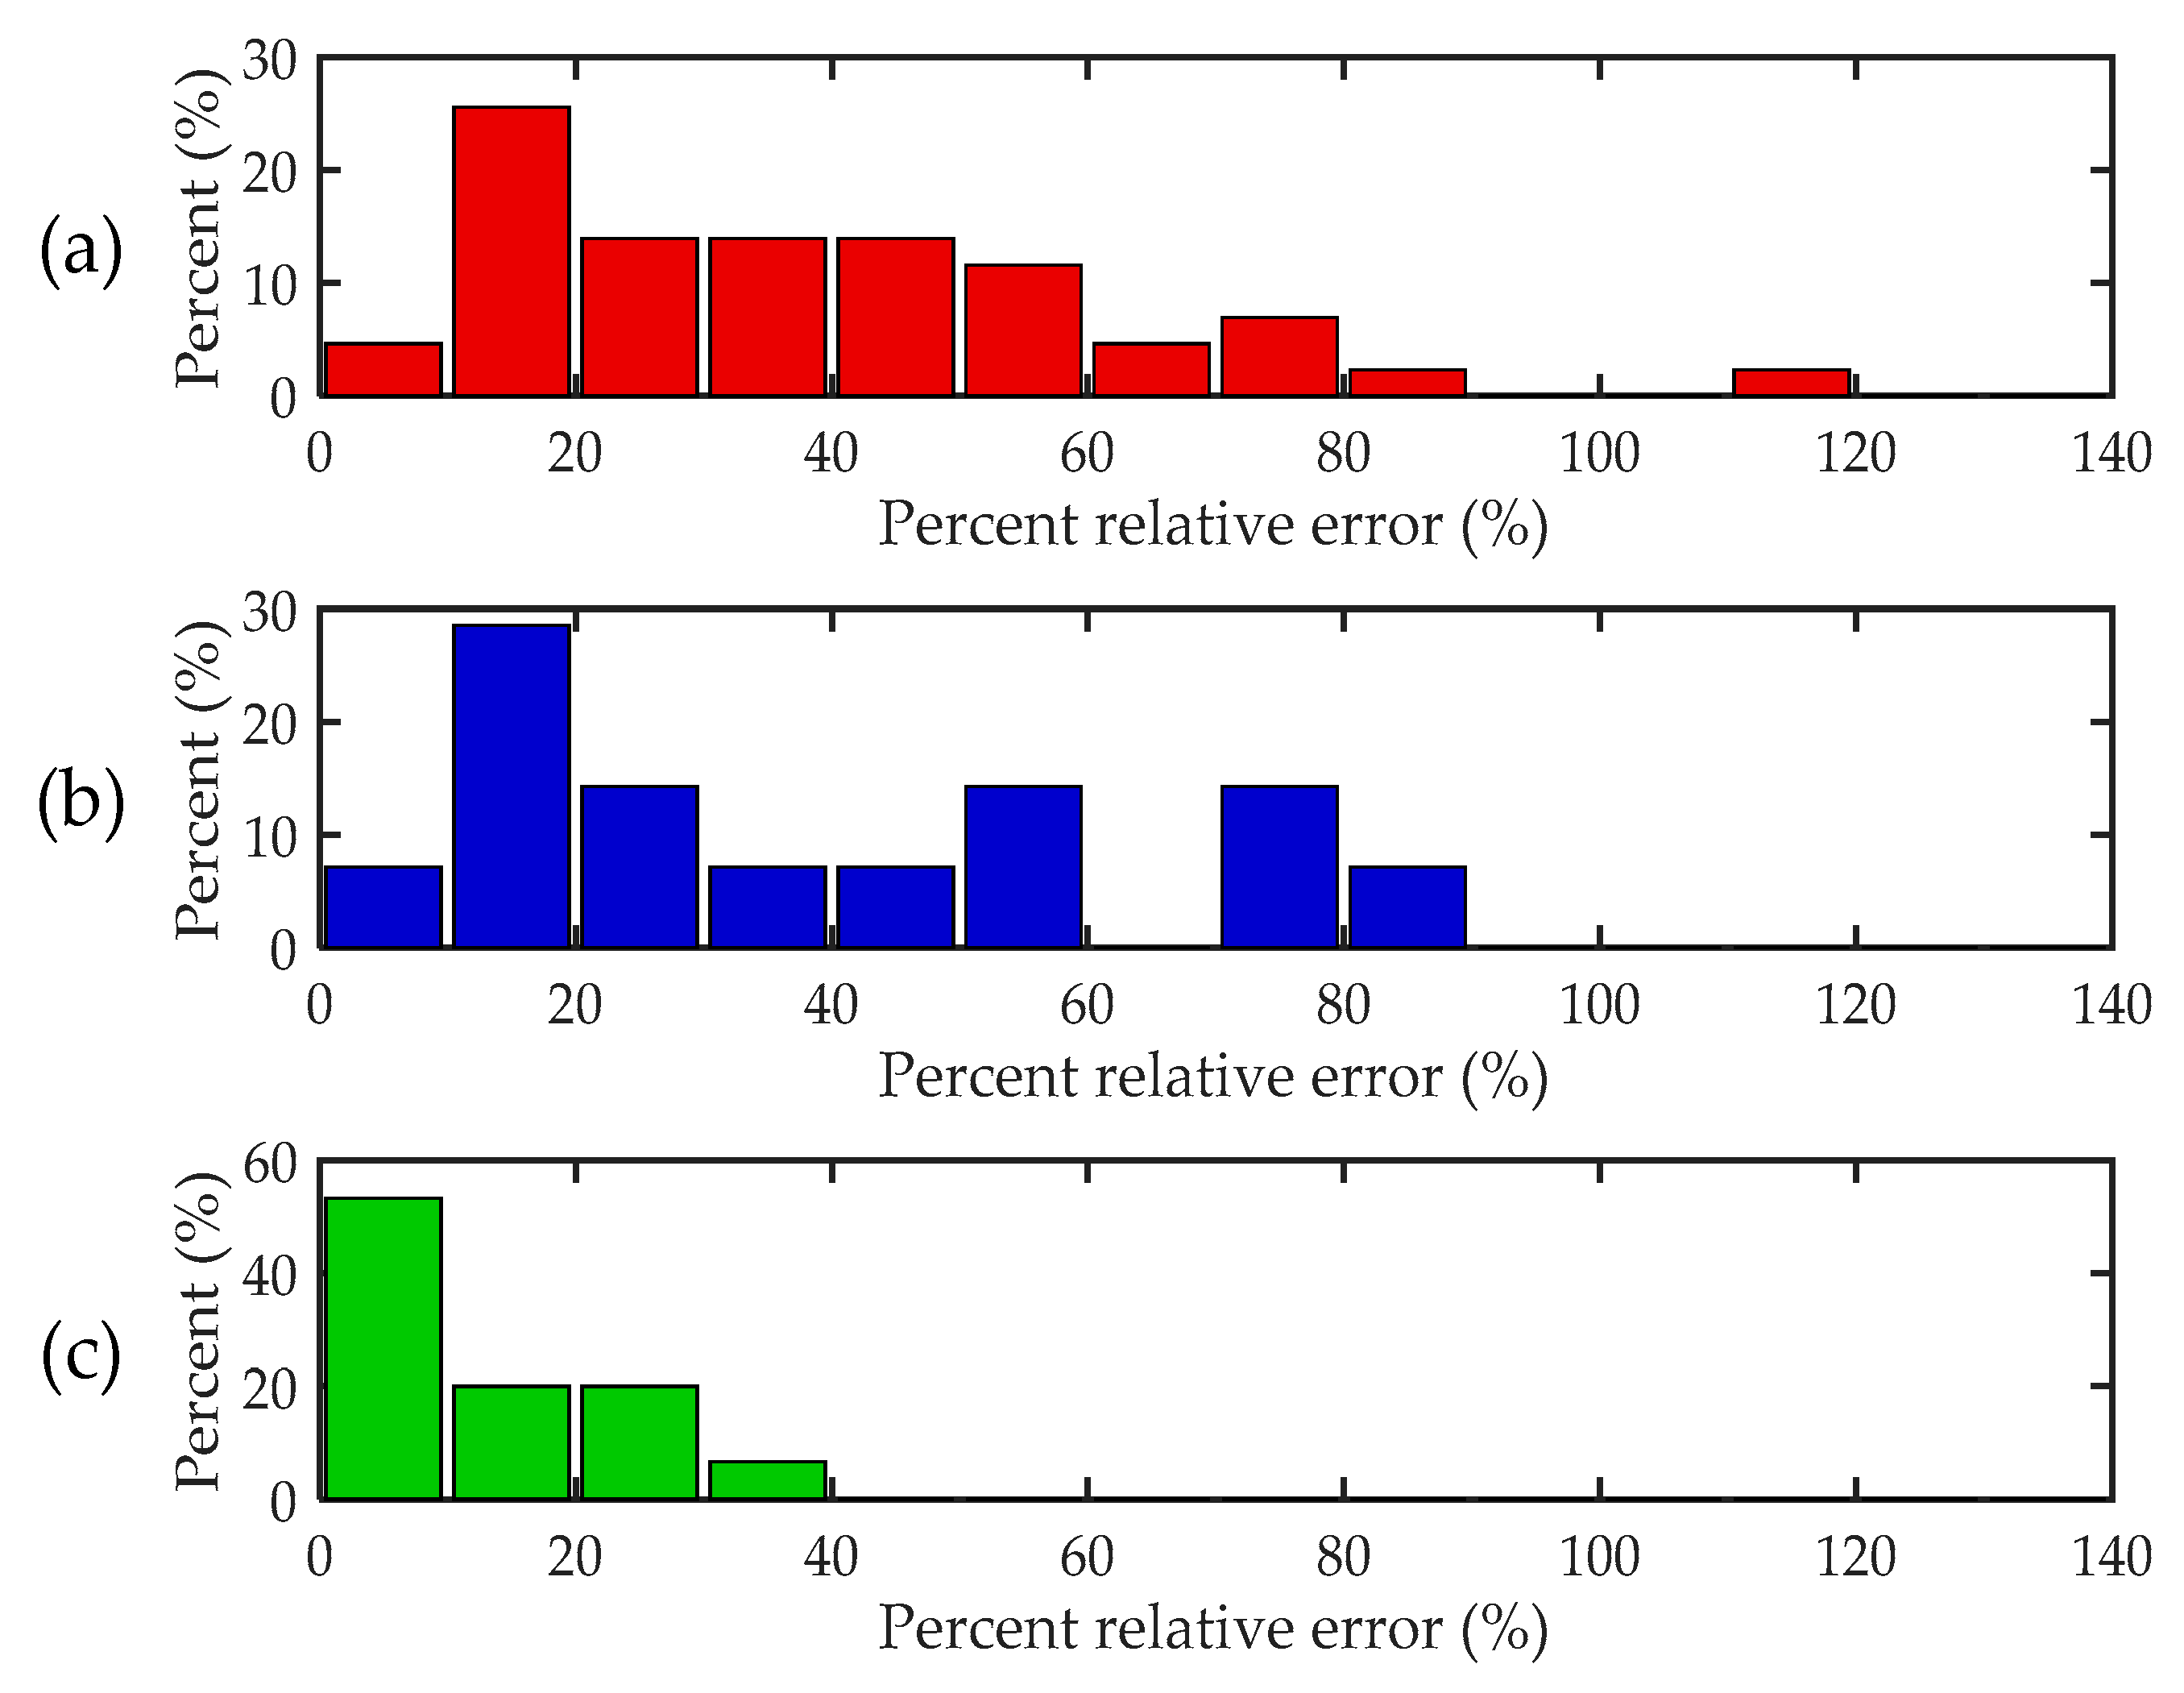
Figure 7.
Decision-tree-based support vector machine (DTSVM) classifier. The capital letters (i.e., A, B, C, D and E) represent different targets. The circles represent binary SVM classifiers.
Figure 7.
Decision-tree-based support vector machine (DTSVM) classifier. The capital letters (i.e., A, B, C, D and E) represent different targets. The circles represent binary SVM classifiers.
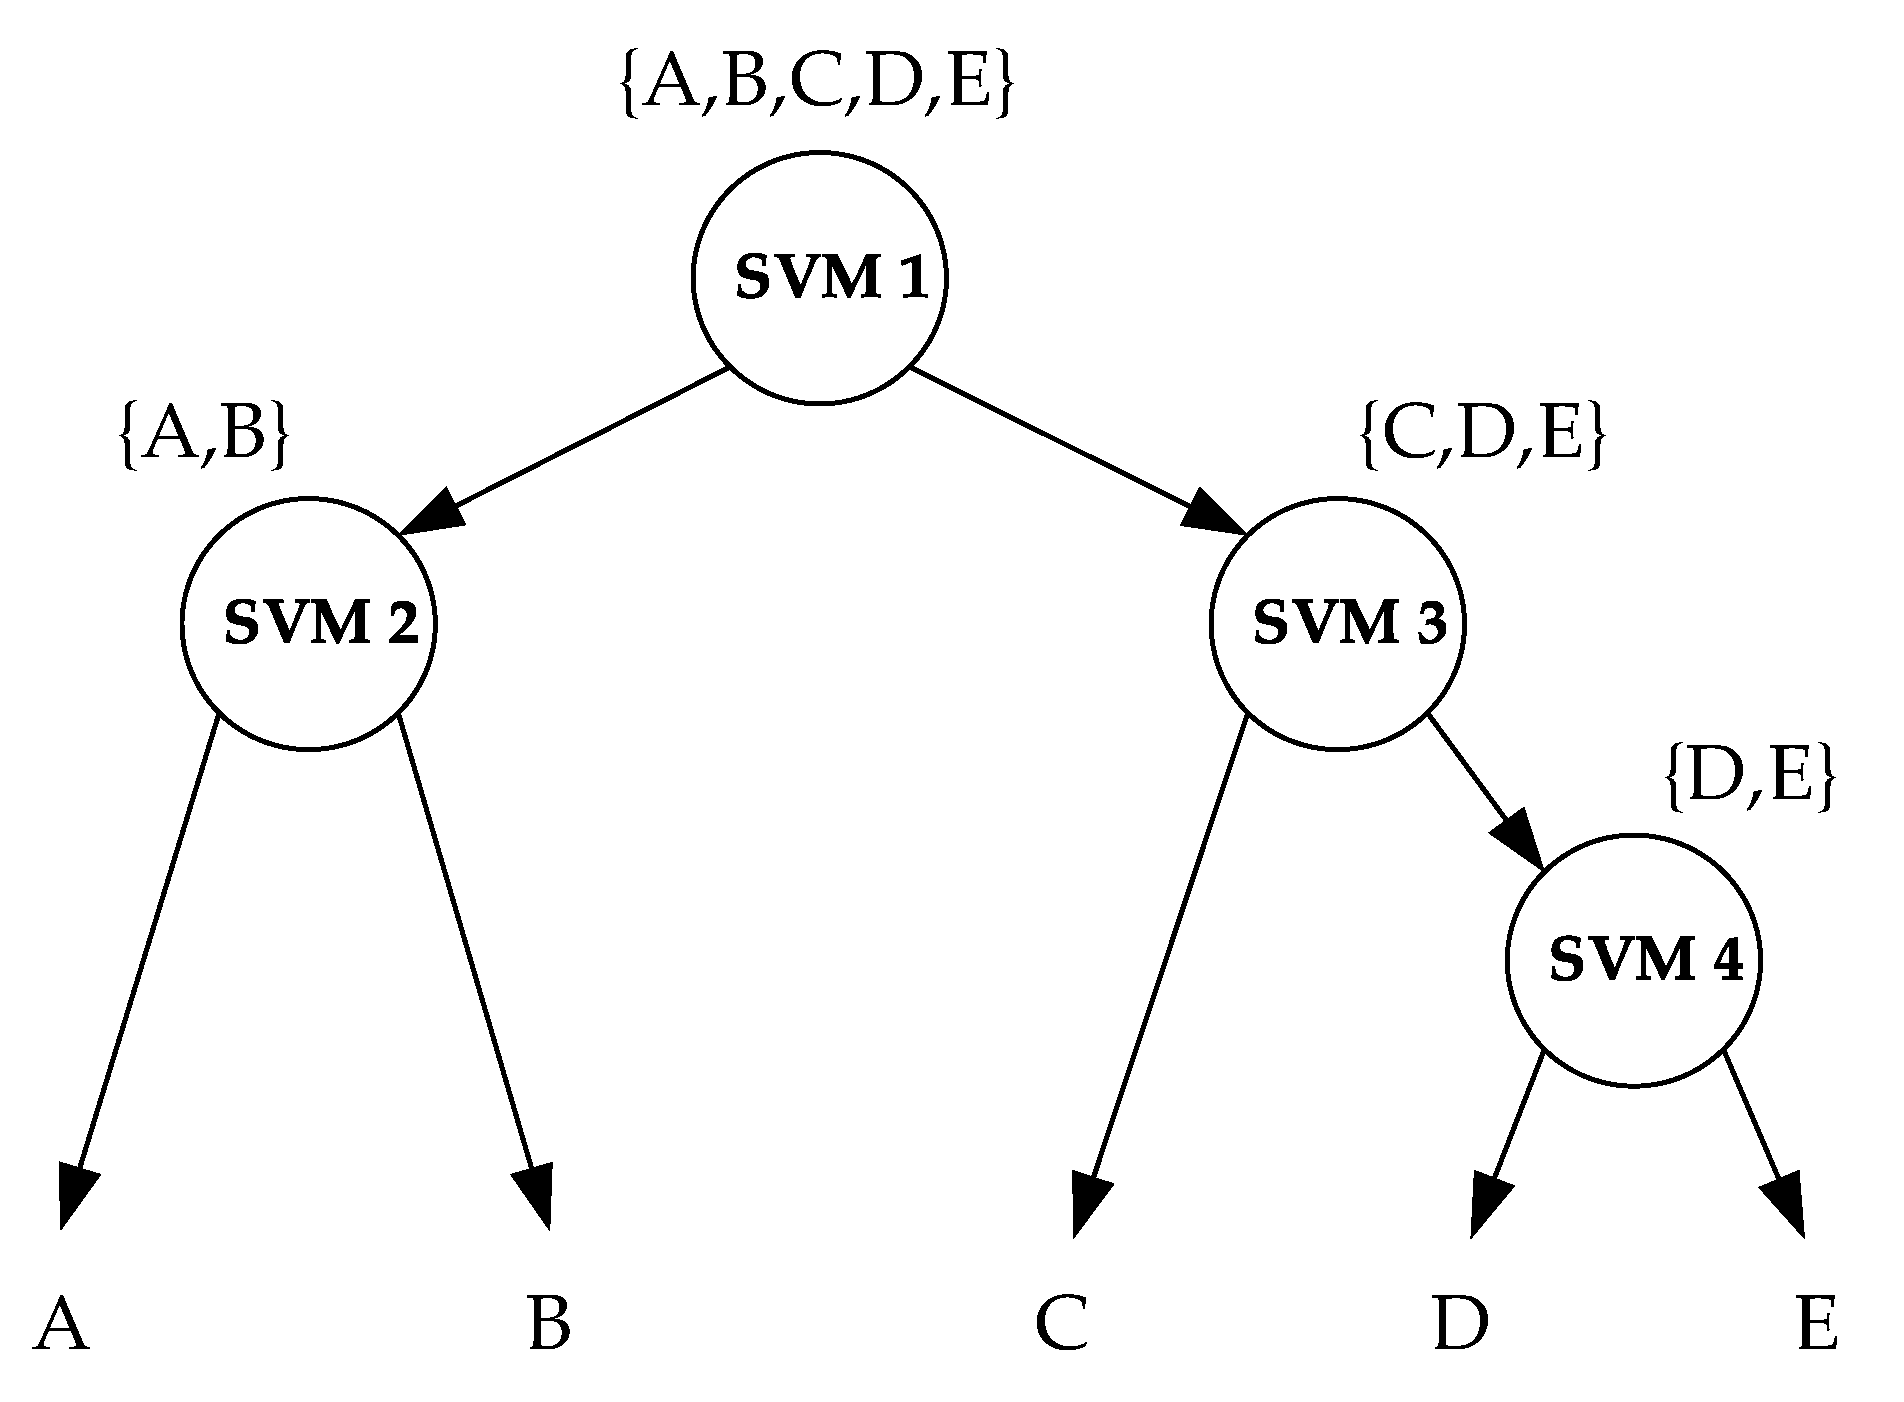
Figure 8.
The distributions of the thorax width of all trapped species. Each line segment represents a species. The numbers from 1 to 23 in the horizontal axis denote species labels. The vertical axis represents the range of the thorax width.
Figure 8.
The distributions of the thorax width of all trapped species. Each line segment represents a species. The numbers from 1 to 23 in the horizontal axis denote species labels. The vertical axis represents the range of the thorax width.

Figure 9.
The probability distribution curves of the thorax width. Note: Different colors correspond to different species.
Figure 9.
The probability distribution curves of the thorax width. Note: Different colors correspond to different species.
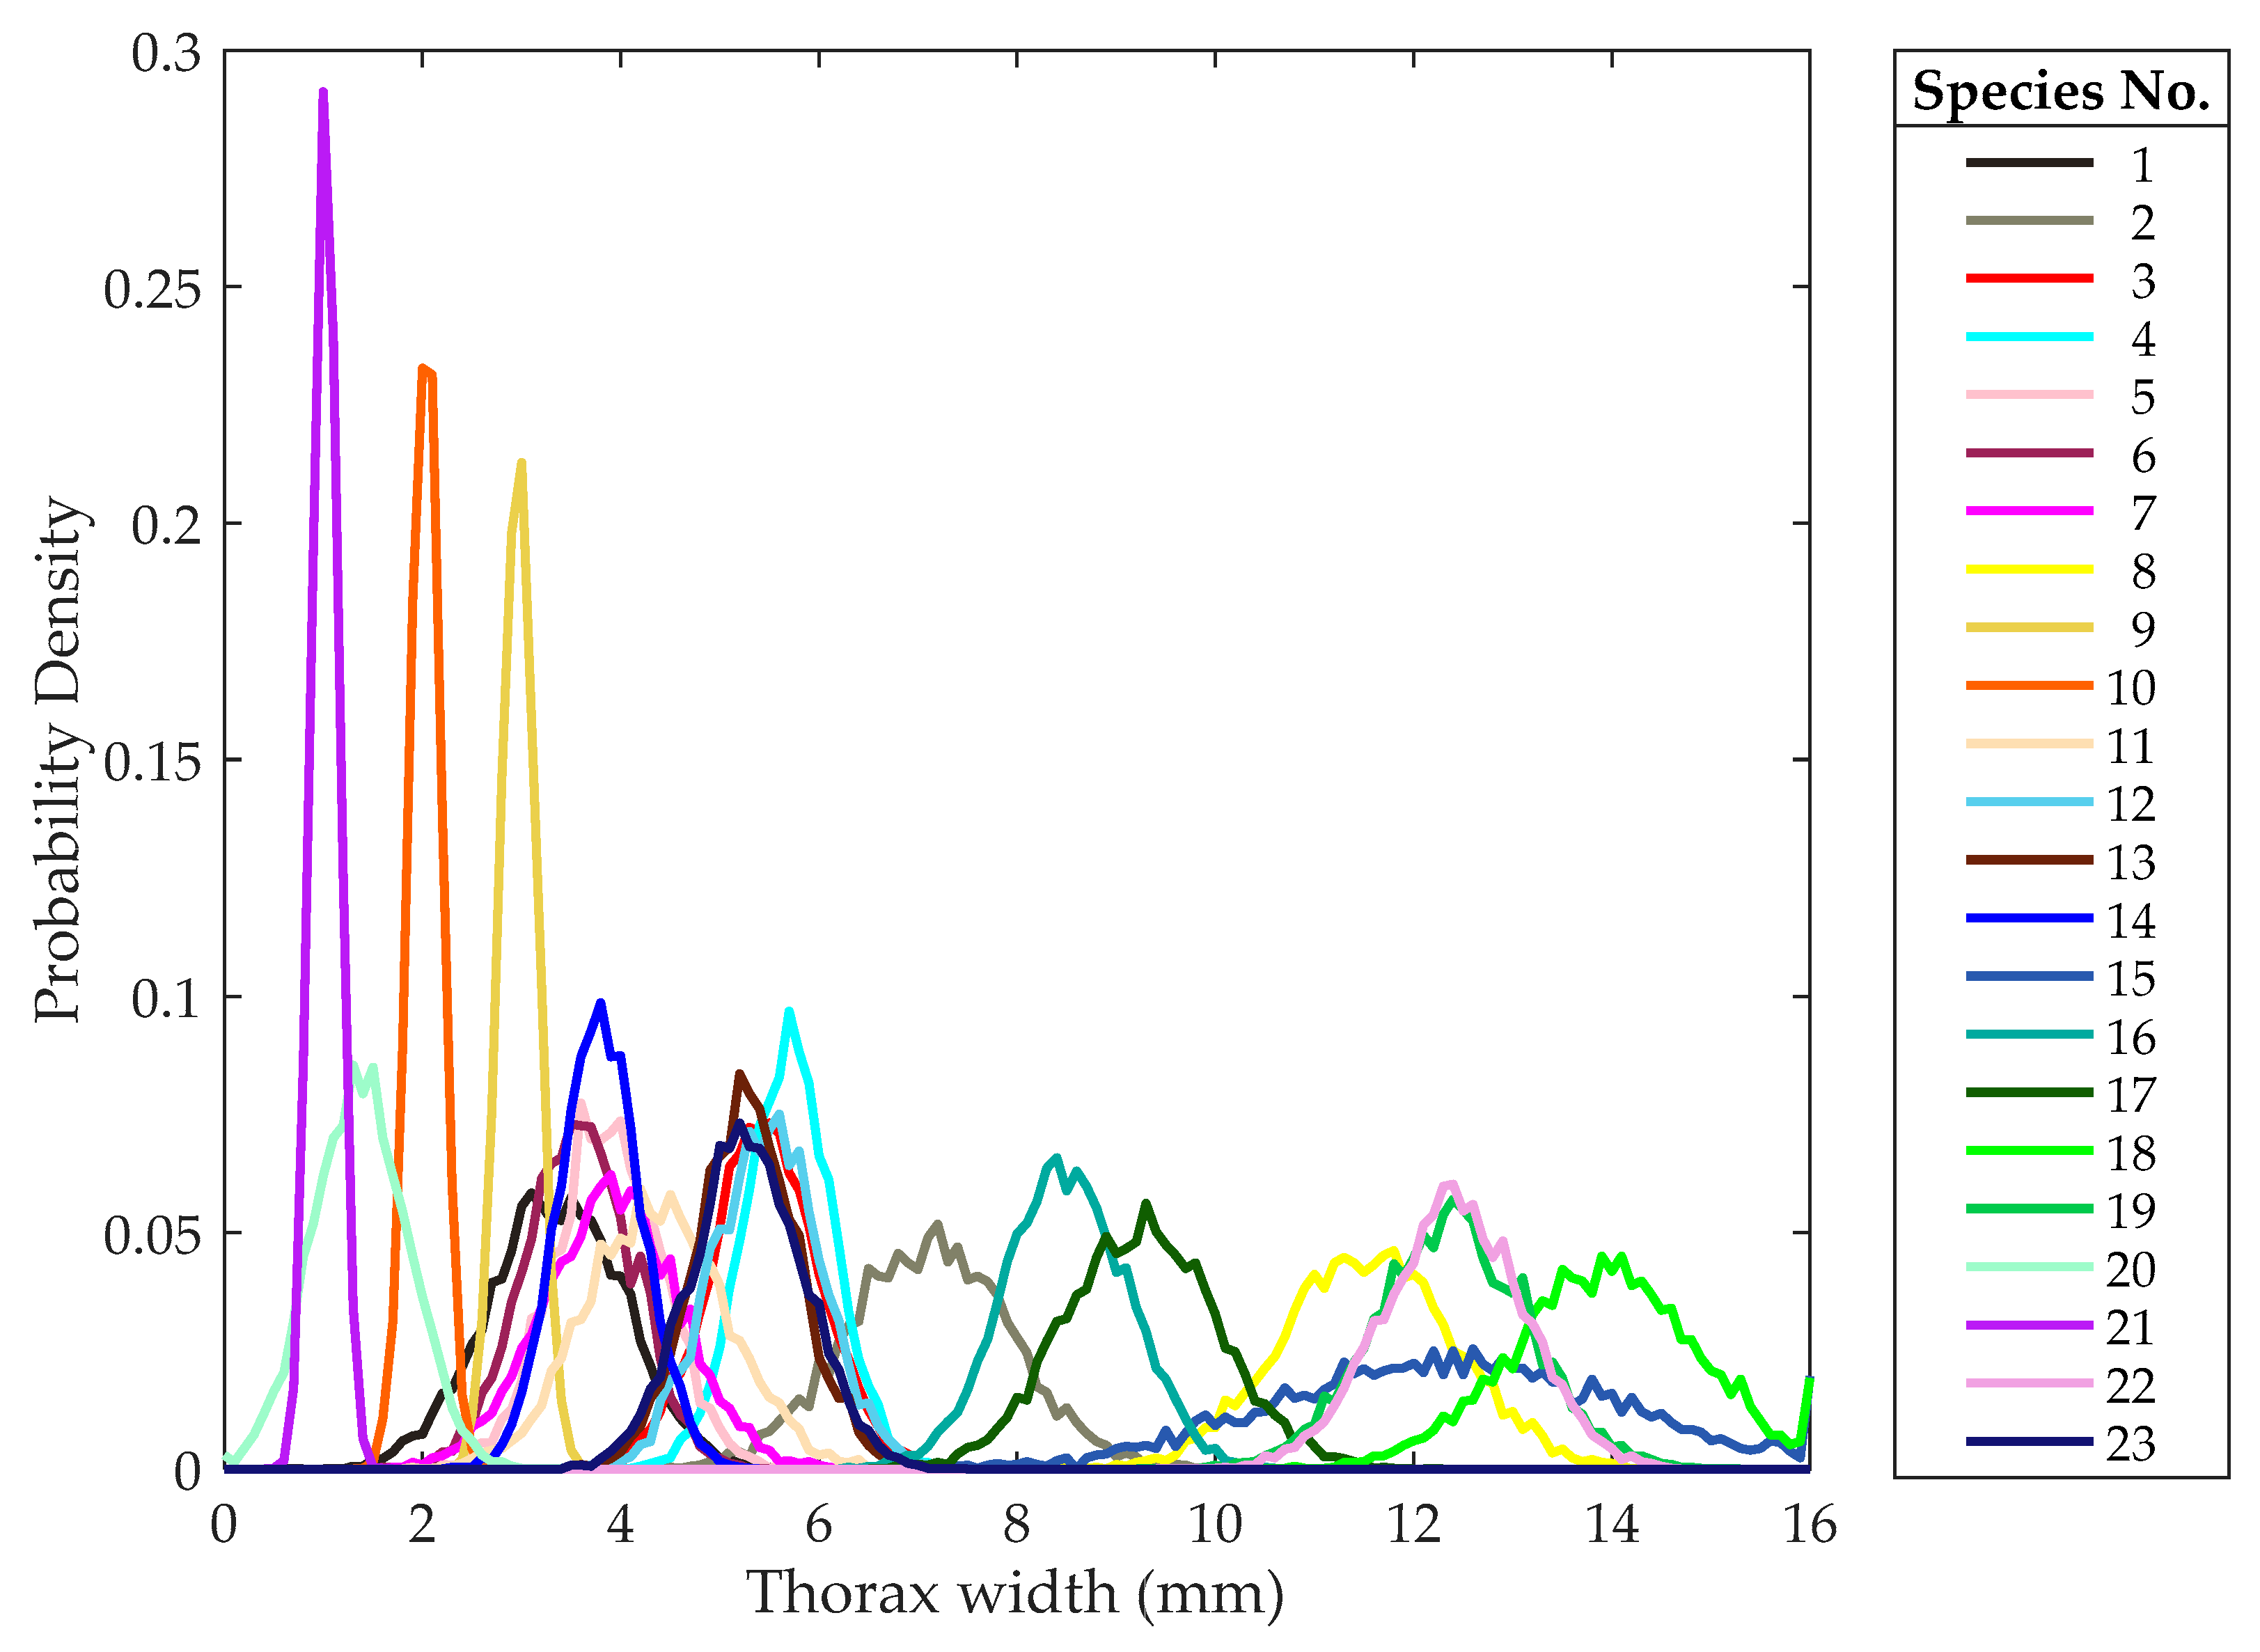
Figure 10.
The classification scheme for the 23 species of migratory insects based on wingbeat frequency, mass, body length, aspect ratio and thorax width. Note: The blue circles correspond to insect species and green circles correspond to binary SVM classifiers.
Figure 10.
The classification scheme for the 23 species of migratory insects based on wingbeat frequency, mass, body length, aspect ratio and thorax width. Note: The blue circles correspond to insect species and green circles correspond to binary SVM classifiers.

Figure 11.
Identification accuracy for each of the 23 species based on wingbeat frequency, mass, body length, aspect ratio and thorax width.
Figure 11.
Identification accuracy for each of the 23 species based on wingbeat frequency, mass, body length, aspect ratio and thorax width.
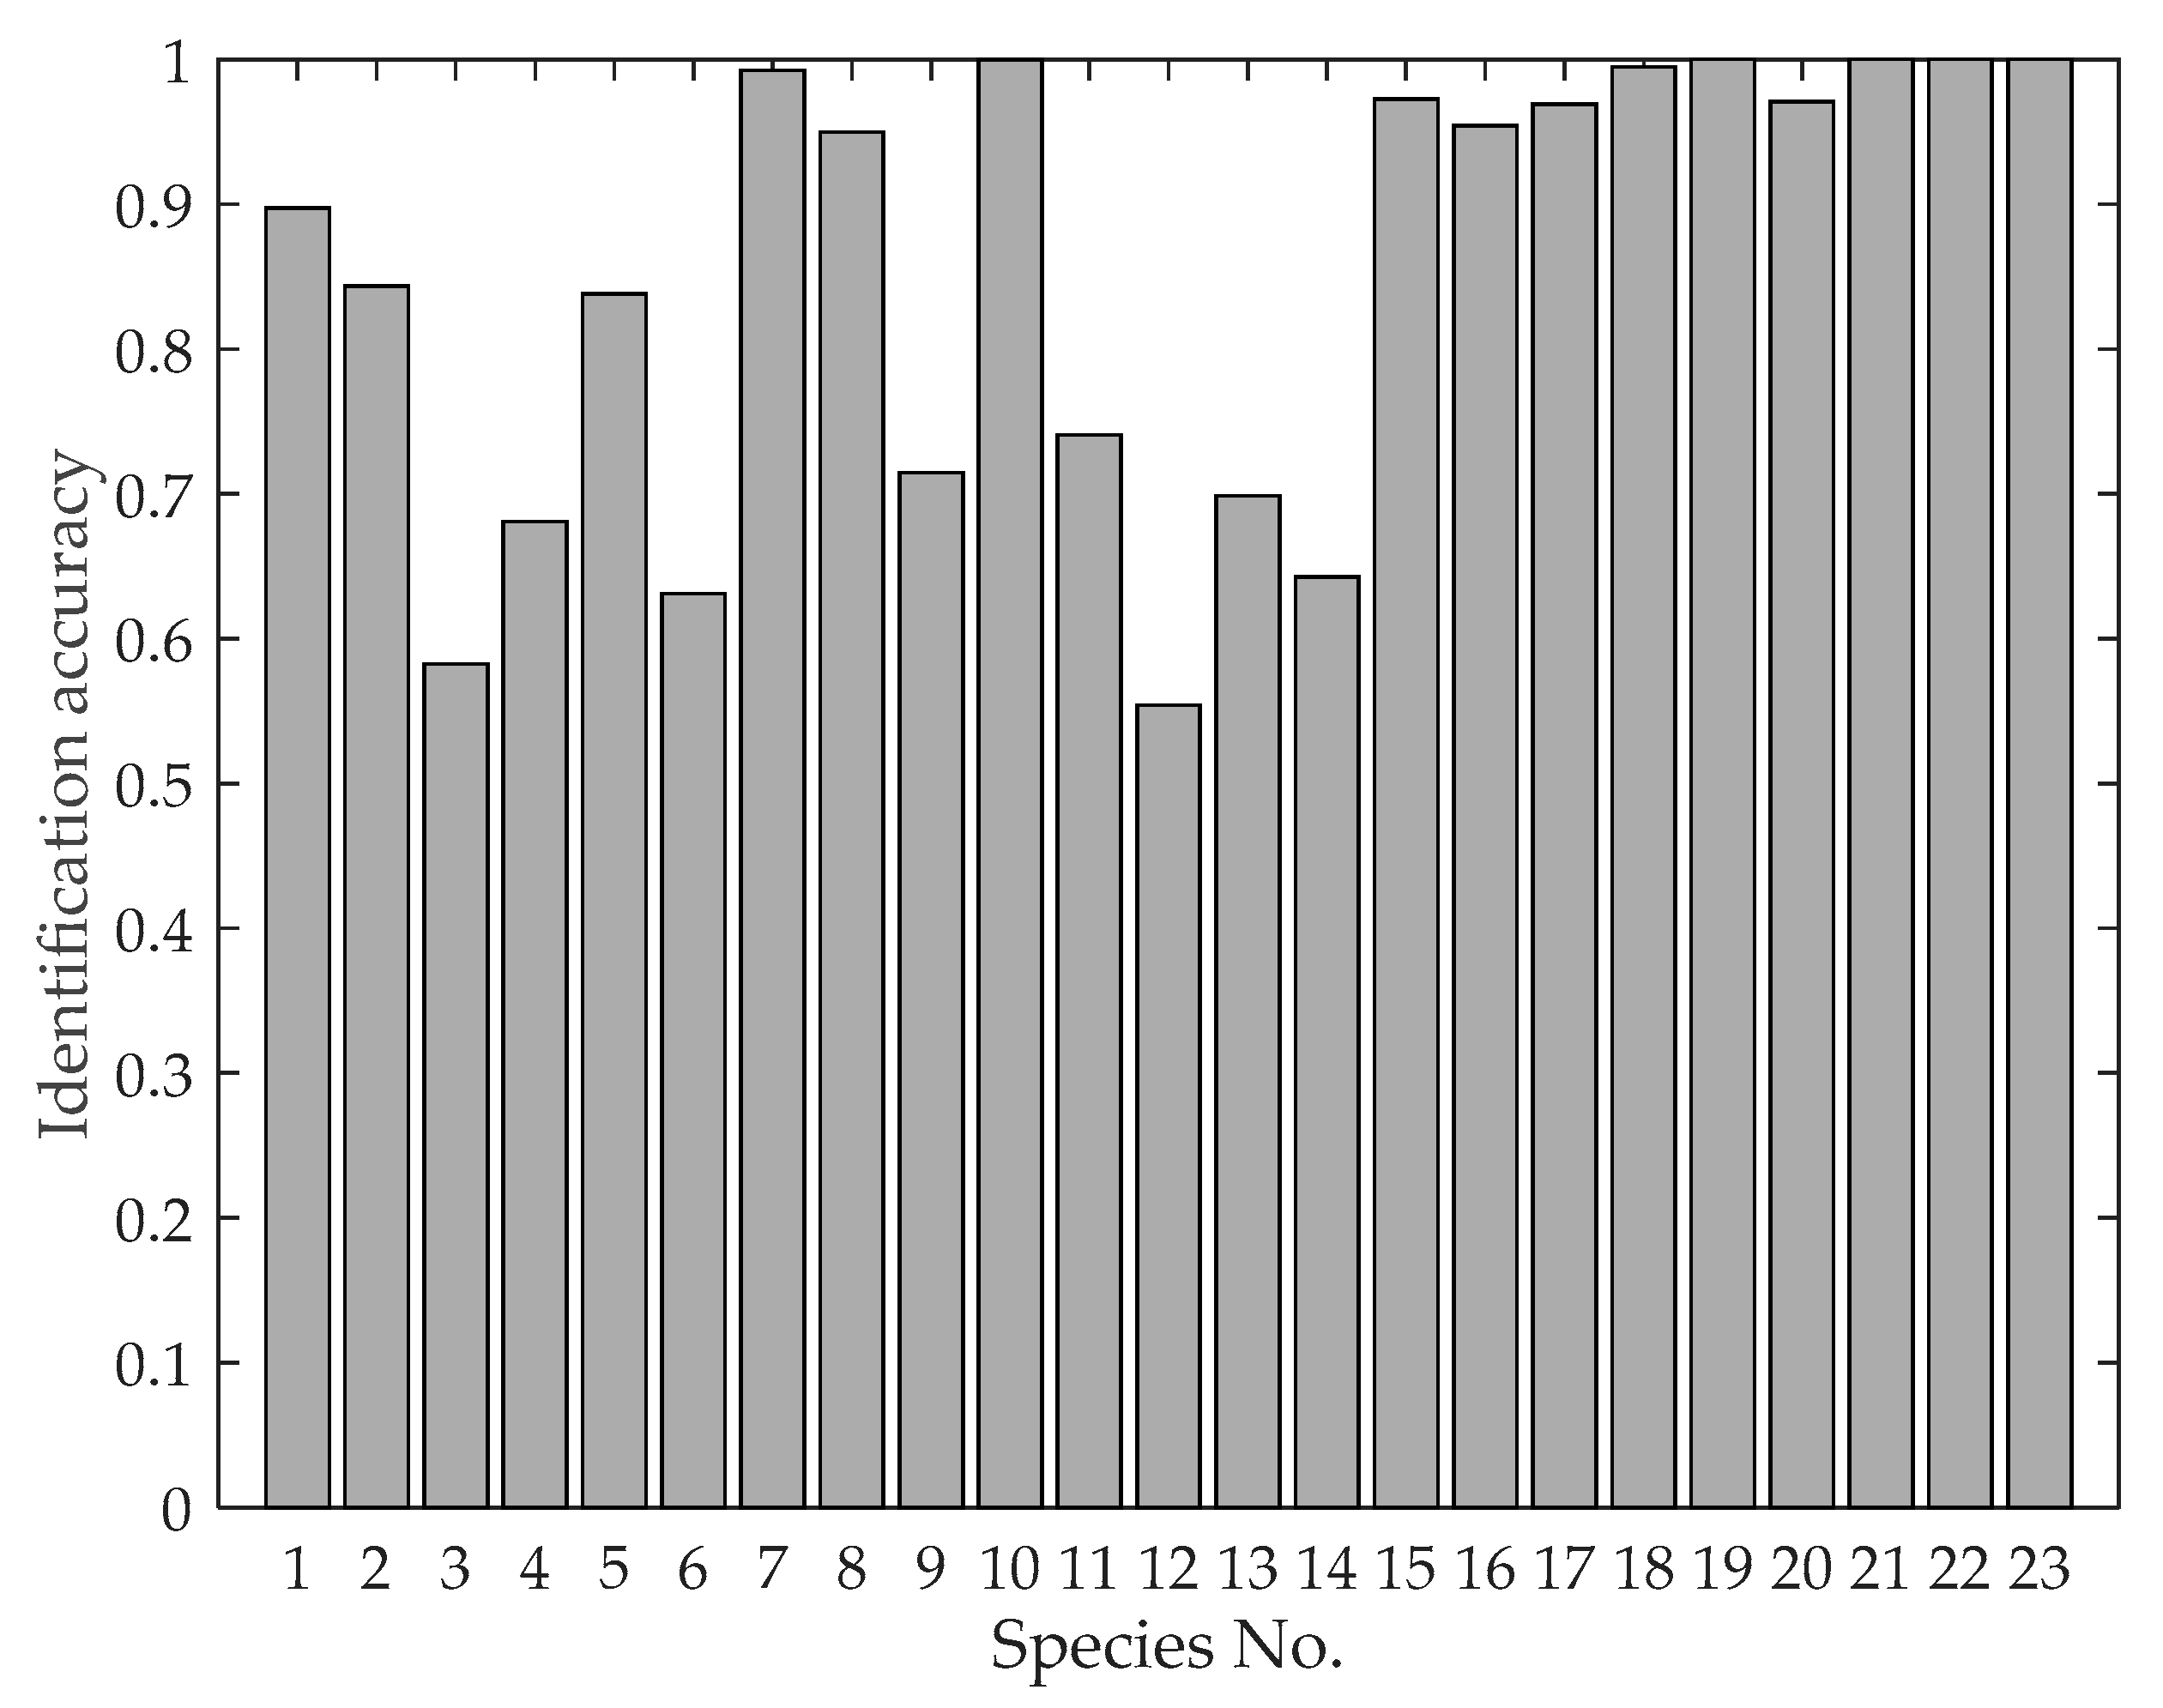
Figure 12.
Normalized 23 × 23 confusion matrix of classification results. The value of the element in the matrix that has a row number of i and a column number of j (i,j = 1,2,…,23) represents the probability that insect i is considered to be insect j after the classification process.
Figure 12.
Normalized 23 × 23 confusion matrix of classification results. The value of the element in the matrix that has a row number of i and a column number of j (i,j = 1,2,…,23) represents the probability that insect i is considered to be insect j after the classification process.

Figure 13.
Correct classification rates based only on a single feature: (a) wingbeat frequency, (b) mass, (c) body length, (d) thorax width, and (e) aspect ratio.
Figure 13.
Correct classification rates based only on a single feature: (a) wingbeat frequency, (b) mass, (c) body length, (d) thorax width, and (e) aspect ratio.

Table 1.
Morphological data of measured species and scattering features extracted from multi-frequency RCSs.
Table 1.
Morphological data of measured species and scattering features extracted from multi-frequency RCSs.
| Method | Mass | Body Length | Thorax Width | |||
|---|---|---|---|---|---|---|
| RMSPE 3 | RMSPE | RMSPE | ||||
| 0.9526 (<0.001) | 16.31% | 0.8836 (<0.001) | 11.25% | 0.916 (<0.001) | 13.37% | |
| 0.9464 (<0.001) | 23.53% | 0.8927 (<0.001) | 10.74% | 0.8575 (<0.001) | 20.86% | |
1 is the Spearman’s rank correlation coefficient; 2 p means p-value; 3 RMSPE represents root mean square percentage error (see Appendix A).
Table 2.
The primary information of the 23 insect species.
| Label | Species | Family | Order | Quantity | Thorax Width (mm) | ||
|---|---|---|---|---|---|---|---|
| Range | Mean | Std. Dev. | |||||
| 1 | Eriopyga grandis | Noctuidae | Lepidoptera | 473 | 2–5 | 3.35 | 0.68 |
| 2 | Agrotis tokionis | Noctuidae | Lepidoptera | 382 | 5–9 | 7.11 | 0.84 |
| 3 | Xestia c-nigrum | Noctuidae | Lepidoptera | 43 | 5–7 | 5.47 | 0.55 |
| 4 | Agrotis praecox | Noctuidae | Lepidoptera | 78 | 5–6 | 5.70 | 0.46 |
| 5 | Spodoptera litura | Noctuidae | Lepidoptera | 129 | 3–5 | 3.86 | 0.54 |
| 6 | Heliothis dipsacea | Noctuidae | Lepidoptera | 84 | 2–5 | 3.58 | 0.54 |
| 7 | Speiredonia retorta | Noctuidae | Lepidoptera | 32 | 3–5 | 3.91 | 0.69 |
| 8 | Dermaleipa juno | Noctuidae | Lepidoptera | 61 | 10–14 | 11.52 | 0.89 |
| 9 | Acronicta rumicis | Noctuidae | Lepidoptera | 58 | 2–3 | 2.97 | 0.18 |
| 10 | Calospilos suspecta | Geometridae | Lepidoptera | 147 | 2–3 | 2.03 | 0.16 |
| 11 | Spilarctia subcarnea | Arctiidae | Lepidoptera | 296 | 2–6 | 4.33 | 0.70 |
| 12 | Spilosoma niveus | Arctiidae | Lepidoptera | 48 | 4–6 | 5.46 | 0.54 |
| 13 | Amsacta lactinea | Arctiidae | Lepidoptera | 27 | 4–6 | 5.26 | 0.53 |
| 14 | Rhyparioides amurensis | Arctiidae | Lepidoptera | 144 | 3–5 | 3.78 | 0.43 |
| 15 | Clanis bilineata | Sphingidae | Lepidoptera | 53 | 8–16 | 12.34 | 1.75 |
| 16 | Psilogramma menephron | Sphingidae | Lepidoptera | 29 | 7–10 | 8.52 | 0.63 |
| 17 | Ampelophaga rubiginosa | Sphingidae | Lepidoptera | 41 | 7–11 | 9.24 | 0.77 |
| 18 | Callambulyx tartarunovii | Sphingidae | Lepidoptera | 35 | 12–15 | 13.91 | 0.95 |
| 19 | Macroglossum stellatarum | Sphingidae | Lepidoptera | 84 | 10–14 | 12.37 | 0.77 |
| 20 | Loxostege sticticalis | Pyralididae | Lepidoptera | 892 | 1–2 | 1.37 | 0.48 |
| 21 | Spoladea recurvalis | Pyralididae | Lepidoptera | 1574 | 1–2 | 1.02 | 0.13 |
| 22 | Pantala flavescens | Libellulidae | Odonata | 768 | 11–14 | 12.39 | 0.72 |
| 23 | Enallagma cyathigerum | Coenagriidae | Odonata | 54 | 4–6 | 5.28 | 0.56 |
Table 3.
Identification accuracy for each of the 23 species based on single features.
| Label | Identification Accuracy | ||||
|---|---|---|---|---|---|
| Wingbeat Frequency | Mass | Body Length | Thorax Width | Aspect Ratio | |
| 1 | 0 | 0.804 | 0.8576 | 0.0052 | 0.1184 |
| 2 | 0.3228 | 0.9928 | 0.0332 | 0.0144 | 0.6388 |
| 3 | 0 | 0.8628 | 0.0616 | 0.0256 | 0 |
| 4 | 0 | 0.6608 | 0.5372 | 0.2388 | 0.6532 |
| 5 | 0 | 0.9648 | 0.0396 | 0 | 0.0228 |
| 6 | 0.118 | 0.9436 | 0.2248 | 0 | 0.1464 |
| 7 | 0.5804 | 0.1428 | 0 | 0.1848 | 0 |
| 8 | 0.6884 | 0.8952 | 0.8832 | 0.8132 | 0.5088 |
| 9 | 0.012 | 0.8564 | 0.7596 | 0.7692 | 1 |
| 10 | 0.226 | 0.8852 | 0.3772 | 0.776 | 1 |
| 11 | 0 | 0.8632 | 0.46 | 0 | 0.2188 |
| 12 | 0.4056 | 0.9724 | 0.608 | 0 | 0.078 |
| 13 | 0.6932 | 0 | 0.68 | 0.0556 | 0.1952 |
| 14 | 0.0432 | 0.8492 | 0.4248 | 0 | 0.7172 |
| 15 | 0.9272 | 0.4732 | 0.0304 | 0.2644 | 0.0052 |
| 16 | 0.7876 | 0.9304 | 0.1628 | 0.0224 | 0.6488 |
| 17 | 0.6764 | 0.9992 | 0.7688 | 0.028 | 0.5936 |
| 18 | 0.474 | 0.7544 | 0.9104 | 0.5156 | 0.75 |
| 19 | 0.9996 | 0.4964 | 0.2896 | 0.5052 | 0.6272 |
| 20 | 0 | 0.8332 | 0.9276 | 0.03 | 0.468 |
| 21 | 0 | 1 | 0.986 | 0.618 | 1 |
| 22 | 1 | 0.3928 | 1 | 0.566 | 0.0636 |
| 23 | 0.996 | 0.9376 | 0.1632 | 0.3812 | 0.1632 |
© 2019 by the authors. Licensee MDPI, Basel, Switzerland. This article is an open access article distributed under the terms and conditions of the Creative Commons Attribution (CC BY) license (http://creativecommons.org/licenses/by/4.0/).
Share and Cite
MDPI and ACS Style
Hu, C.; Kong, S.; Wang, R.; Zhang, F. Radar Measurements of Morphological Parameters and Species Identification Analysis of Migratory Insects. Remote Sens. 2019, 11, 1977. https://doi.org/10.3390/rs11171977
AMA Style
Hu C, Kong S, Wang R, Zhang F. Radar Measurements of Morphological Parameters and Species Identification Analysis of Migratory Insects. Remote Sensing. 2019; 11(17):1977. https://doi.org/10.3390/rs11171977
Chicago/Turabian StyleHu, Cheng, Shaoyang Kong, Rui Wang, and Fan Zhang. 2019. "Radar Measurements of Morphological Parameters and Species Identification Analysis of Migratory Insects" Remote Sensing 11, no. 17: 1977. https://doi.org/10.3390/rs11171977
Note that from the first issue of 2016, this journal uses article numbers instead of page numbers. See further details here.