Anomaly Detection in Hyperspectral Imagery Based on Low-Rank Representation Incorporating a Spatial Constraint


1
Key Laboratory of Geographic Information (Ministry of Education), East China Normal University, Shanghai 200241, China
2
School of Geographic Sciences, East China Normal University, Shanghai 200241, China
3
Key Laboratory for Land Environment and Disaster Monitoring of NASG, China University of Minning and Technology, Xuzhou 221116, China
4
Department of Electrical and Computer Engineering, Mississippi State University, Starkville, MS 39762, USA
*
Author to whom correspondence should be addressed.
†
These authors contributed equally to this work.
Remote Sens. 2019, 11(13), 1578; https://doi.org/10.3390/rs11131578
Submission received: 7 May 2019
/
Revised: 20 June 2019
/
Accepted: 27 June 2019
/
Published: 3 July 2019
(This article belongs to the Special Issue Hyperspectral Imagery Intelligent Processing for Coastal Environmental Studies)
Abstract
:Hyperspectral imagery contains abundant spectral information. Each band contains some specific characteristics closely related to target objects. Therefore, using these characteristics, hyperspectral imagery can be used for anomaly detection. Recently, with the development of compressed sensing, low-rank-representation-based methods have been applied to hyperspectral anomaly detection. In this study, novel low-rank representation methods were developed for anomaly detection from hyperspectral images based on the assumption that hyperspectral pixels can be effectively decomposed into a low-rank component (for background) and a sparse component (for anomalies). In order to improve detection performance, we imposed a spatial constraint on the low-rank representation coefficients, and single or multiple local window strategies was applied to smooth the coefficients. Experiments on both simulated and real hyperspectral datasets demonstrated that the proposed approaches can effectively improve hyperspectral anomaly detection performance.

1. Introduction
Due to the high spectral resolution and abundant spectral information in a large number of spectral bands, hyperspectral image (HSI) data have been widely used to distinguish different targets on the ground. According to the availability of target information, target detection algorithms can be divided into two categories: with or without a priori target knowledge [1]. Since target information is often difficult to obtain in practice [2], anomaly detection does not require any a priori information of targets and is of great importance in real applications [3,4].
Anomaly detection involves modeling the background and using the difference between the pixels and the background to detect anomalous pixels. Many different anomaly detection algorithms have been proposed. The well-known Reed–Xiaoli (RX) algorithm, considered to be a classical detection algorithm [5], is a second-order matched filtering algorithm, for which the similarity between the test pixel and the background is calculated by Mahalanobis distance. When the entire image is considered for background modeling, this is known as the global RX detector (GRXD). If the RX detector estimates the background using local statistics, it is referred to as the local RX detector (LRXD) [6]. However, neither of these two algorithms can exclude the influence of anomalous features on covariance. Until recently, many researchers have made contributions to anomaly detection. Billor et al. proposed the blocked adaptive computationally efficient outlier nominator (BACON) [7] algorithm, which tries to select the growing subset of outlier-free points and obtain robust background statistics to weaken the contamination by anomalies. Imani proposed the median–mean line RX detector (MML-RXD) [8], in which the benefits of the median–mean metric are used to provide more reliable background samples. Yao et al. were inspired by the bilateral filter in digital image processing and proposed the bilateral-filter-based anomaly detector (BFDA) [9], which substitutes the weighted surrounding neighbors for centric pixels to remove anomalous points. Some enhanced RX-based algorithms such as the weighted-RXD (WRXD) [10] and the linear filter-based RXD [10] were also proposed. They aim at increasing the probability of anomaly detection by improving the estimation of background statistics to exclude the influence of anomalous features on covariance.
Generally speaking, in real hyperspectral imagery, the background information is very complicated and cannot be described with just the covariance matrix and mean vector. To avoid obtaining the accurate covariance matrix of the background, some linear-representation-based methods have been successfully applied to hyperspectral anomaly detection. These include the unsupervised nearest regularized subspace (UNRS) [11] detector proposed by Li et al. and the collaborative-representation-based detector (CRD) [12] for anomaly detection, both of which are based on the assumption that the spectrum of the central pixel is similar to that of the surrounding pixel and can be linearly represented by the surrounding pixels. To make full use of the spatial information of neighboring pixels, the two detectors adopt a dual window strategy, which leads to the detection accuracy being affected by the size of the internal and external windows.
Unlike UNRS and CRD, with the development of compressed sensing, sparse-representation-based methods have been extensively researched. By using a small number of similar signals to represent signals, noise and anomalous signal information can be effectively suppressed. Some sparse-representation-based methods have been applied to hyperspectral image anomaly detection. For instance, the sparse representation detector (SRD) was proposed based on the assumption that hyperspectral pixels can be well represented by only a few pixels [13,14]. Sparse representation theory has a good application in the processing and representation of one-dimensional information, but for two-dimensional matrix data, sparsity can only represent the structural information of the dataset.
Due to the redundancy and diversity of the observed data, two-dimensional matrix data are presented with low-rank characteristics. By performing a low-rank constraint on the matrix, the global structure information of the two-dimensional matrix can be better described. Low-rank representation (LRR) can be considered as a special case of sparse representation, extending from one-dimensional sparsity to two-dimensional low rank.
Some low-rank representation models have also been applied to hyperspectral anomaly detection, such as the classical robust principal component analysis (RPCA) [15], which decomposes the matrix into low-rank and sparse matrices. Chen et al. [16] proposed the RPCA-RX anomaly detection method, with the classic RX detector being applied to the sparse matrix. Unlike RPCA, the LRR [1,17] model assumes that the data are drawn from multiple subspaces, which is better suited for hyperspectral images due to the complex background features of real data. Because of the correlation between the representation coefficients, the low-rank constraint of the matrix can effectively describe the global structure of the dataset. Therefore, Xu et al. [18] proposed the low-rank representation sum-to-one (LRRSTO) anomaly detection model. In order to make the representation coefficients robust, a sum-to-one constraint was added.
In recent years, sparse subspace clustering (SCC) theory has attracted considerable attention and become a research hotspot due to its superiority. Zhai et al. first introduced the SSC [19] model to HSIs based on the assumption that pixels belonging to the same land-cover class approximately lie in the same subspace. The SSC algorithm generally calculates the affinity matrix by solving the sparse representation coefficients and uses the spectral clustering algorithm to segment the data into different subspaces.
However, directly applying the SSC algorithm to HSIs fails to take advantage of the rich spectral and spatial information of HSIs. In light of this, the SSC incorporating spatial information (SSC-S) [20] model was proposed. Based on the hypothesis that the background pixels in the neighborhood window have the same background as the central testing pixel, Zhang et al. hypothesized that the representation coefficients of the neighborhood pixels in the local window should also be similar to the central testing pixel. In the SSC-S model, they eliminated the influence of noise and other errors by constraining the space representation coefficient to enhance the clustering effect.
In this study, in order to make full use of spectral similarity in a local spatial neighborhood of HSI, we were inspired by the SSC-S algorithm to introduce a spectral constraint term to the LRRSTO model. We then developed two novel anomaly detection methods based on single or multiple local windows and the low-rank representation sum-to-one model (SLW_LRRSTO/MLW_LRRSTO).
Unlike traditional LRRSTO models, we added a spatial constraint to the LRRSTO model in our SLW_LRRSTO methods. Based on the hypothesis that the background pixels in the neighborhood window share the same background as the central testing pixel, we used a single local window to smooth the LRR coefficients matrix. For the MLW_LRRSTO methods, we adopted multiple local windows to enhance the utilization of spatial information. However, in the LRRSTO model, the overcomplete dictionary composed of data itself contains a large number of redundant dictionary atoms, which greatly slows down the speed of the algorithm. In order to accelerate the operation, in the proposed SLW_LRRSTO/MLW_LRRSTO models, we adopted the random selection method to construct the initial dictionary.
2. Related Work
2.1. LRRSTO Detection Algorithm
LRR can effectively describe the global correlation of the observed HSI. Based on the LRR, the HSI can be decomposed into a background part and a sparse part. The anomaly information can then be detected in the sparse part. Xu et al. [18] applied the sum-to-one constraint to enhance the robustness of the representation coefficient in the LRRSTO method, which is formulated as
where is the 2D HSI data matrix with p bands and MN pixels, is the dictionary matrix, is the LRR coefficient matrix, is the sum-to-one constraint, and is the sparse matrix.
2.2. SSC-S Clustering Algorithm
The SSC model [21] can be expressed as
where is the representation coefficient matrix, is the representation error term, and is the tradeoff parameter. Here, is used to eliminate trivial solutions.
According to Tobler’s first law, neighborhood pixels within a local window usually belong to the same class as the central pixel under test. They also have similar sparse coefficients to the central pixel [22]. If the mean representation coefficient vectors of the neighborhood pixels are different, the central pixel under test may be noise. Zhang et al. [20] proposed a novel SSC model incorporating spatial neighborhood information by utilizing a mean constraint for sparse representation coefficients. In this model, is utilized to regularize , and is the spatial constraint, which limits the difference between the test pixel and the mean of its neighborhood pixels. The representation coefficient matrix can then be obtained by solving the following optimization problem:
where is the spatial constraint, and and are the regularization parameters.
2.3. The Local Summation Anomaly Detection (LSAD) Algorithm
A circular window is utilized to calculate the covariance matrix and the mean vector for the pixels that are between the outer and inner windows in the LRXD [23]. However, if there are anomalous pixels in the frame, the local background distribution is not the best representation for the testing pixel. Du et al. [24] proposed a novel local summation anomaly detection (LSAD) method which exploits a second-order Mahalanobis distance statistical feature and a multiple local window filter to establish a local summation anomaly detection strategy.
3. Proposed Methods
3.1. Single Local Window
In the LRRSTO model, the spatial similarity between adjacent background pixels is not considered; that is, the neighborhood pixels of local windows have the same category as the central pixel under test. In order to make full use of the correlation information between local background pixels, we constrained the representation coefficients of central pixels by using mean filtering. Based on the LRRSTO model, the spatial constraint of the low-rank representation coefficient was used. The local distributions of the single window are obtained by the single local window filter, but it does not include the pixel under test in the detection statistics. Therefore, we proposed a novel single local window anomaly detection method based on the low-rank representation sum-to-one model (SLW_LRRSTO):
where is the sum-to-one constraint, is the spatial constraint in the single local window, is the representation coefficient matrix, is the smoothing filtering result of , and and are the tradeoff parameters.
3.2. Multiple Local Background Statistics
The abovementioned SLW_LRRSTO algorithm only utilizes a single window filter of a specified size. Ideally, the local neighborhood pixels of the single local window do not contain anomalous pixels. However, when the local neighborhood contains anomalous pixels, the detector cannot obtain ideal detection performance. To solve this problem, we proposed using multiple local windows.
In Figure 1, the purple squares represent anomalous pixels, and the white squares represent the same category background pixels. Figure 1a is the ideal distribution of neighboring pixels, where the center pixel is the anomaly and the neighborhood pixels are the background. The mean value of the neighborhood pixels differs from that of the center test pixel value, which can improve the detection accuracy. Figure 1b shows that the center pixel is the anomaly, and the neighborhood contains anomalous pixels. With the mean filter window (red box), the mean value of the neighborhood cannot detect the center pixel as the anomaly. However, with the bottom-right local window filter (green box), the neighborhood pixels do not contain the anomalous pixel, and the center pixel can be detected as an anomaly. Figure 1c shows that the center pixel is a background pixel and the neighborhood pixels include an anomalous pixel in the single local window. For the single mean filter window (red box), the mean value of the neighborhood indicates the center pixel is an anomaly. Using the bottom-right local window mean filter (green box), the neighborhood pixels do not contain the anomaly, which can prevent the center pixel from being identified as an abnormal target.
Based on the SLW_LRRSTO model, the representation coefficient spatial constraint of the single window is extended to the spatial constraint of multiple local windows. As shown in Figure 2, the size of the red single window is (where is odd). We used a small green window, the size of which is to process the data in the red single window from left to right and top to bottom. is the number of multiple local windows.
Figure 2a shows a single window of size which is expanded to nine local windows. The corresponding filter is shown in Figure 2b, where four of nine local windows contain anomalous pixels. This differs from the single local window, in which the neighborhood pixels include two anomalous pixels. On the one hand, the multiple local window strategy can effectively reduce the number of abnormal pixels in the neighborhood. On the other hand, the situation of the local window containing abnormal pixels rarely occurs.
In Formula (4), the spatial constraint of the single local window is extended to , because , where is the number of multiple local windows and is the identity matrix. We defined and . The objective function is then
We used the inexact augmented Lagrange multiplier (IALM) algorithm [1,17,25] to solve the MLW_LRRSTO model and add auxiliary variable . The formula can be written as
where is the auxiliary variable. The augmented Lagrange function is
where are the Lagrange multipliers and is the penalty parameter.
The IALM [1,17,25] is a multiple-variable optimization problem, which can be solved by alternately updating one variable by the minimizing function with the other variables fixed. The problem can be divided into the following subproblems:
Step 1: Fix and update . The objective function can then be written as follows:
Step 2: Update in each local window and use these auxiliary variables to combine :
Step 3: Fix and update . The objective function can then be written as follows:
Step 4: Fix and update . The objective function can then be written as follows:
The procedure of the proposed method is summarized as follows Algorithm 1, in which , and are the singular value thresholding and is the minimization operator.
| Algorithm 1. Inexact ALM algorithm for MLW_LRRSTO |
| Input: data matrix , size of single local window, parameters and |
| Initialize:, , , , , , , |
| While or |
| Continue (1) update variable (2) update , compose (3) update variable (4) update variable (5) update Lagrange multipliers ; ; ; (6) update penalty parameter where |
| End while |
| Output: the optimal solution |
4. Experiments and Analysis
In order to evaluate the effectiveness of the proposed methods, we conducted our experiments on three hyperspectral images. The first experiment was used to analyze the propriety of the proposed methods, and the other two experiments were used to demonstrate its effectiveness. It is worth noting that these three datasets were obtained after preprocessing including atmospheric correction.
4.1. Data Description
4.1.1. Simulated Hyperspectral Image
The hyperspectral data used in the simulated experiment [26,27] were collected by the airborne visible/infrared imaging spectrometer (AVIRIS) over Salinas Valley, CA, USA, which can be downloaded from the GIC website [28]. The original image comprising vegetables, bare soil, and vineyard fields had a spatial size of 512217 pixels and was made up of 224 spectral bands in the wavelength range of 370–2510 nm. In total, 202 bands were used in the experiment after the noise and water absorption bands had been removed. The image scene in pseudocolor is shown in Figure 3a. A region with a size of 120120 was selected to generate the simulated data and is shown in Figure 3b. The 25 specific anomalous pixels were randomly selected from the whole image, with different spectra from the subimages, and are shown in Figure 3c. Figure 3d is the corresponding anomaly location map. The anomalous pixels were simulated by the target implantation method [29]. A simple linear mixture model was adopted for the implanted pixels as
where is the abundance fraction (ranging from 0.04 to 1), is the specific anomaly spectrum, and is the background spectrum.
4.1.2. Parameters Analysis
The initial choices of different parameters were important for the proposed methods, which involve two regularization parameters: and . For this simulated dataset, we adopted the target embedding method to fully control the generating environment of subpixel anomalous targets. Therefore, in order to show the superiority and fully excavate the potential of the proposed methods, we found the optimal parameters by a trial-and-error method. Figure 4 shows how the detection performance changed as the parameters were changed. The range of parameters and was set to 0–2, and the specific data results are shown in Table 1. The data results in Figure 4 and Table 1 show that MLW_LRRSTO was sensitive to . For the simulated dataset, it achieved low area under the curve (AUC) values when was larger than 0.5. In this range, the average AUC value for the AVIRIS_Salinas data was 0.9815. Therefore, we empirically set and for all the datasets in our experiments.
4.1.3. Real Hyperspectral Images
The first real experimental image [1,4,30] was obtainned by the HYDICE sensor over an urban area, which can be downloaded from the website [31]. The image had a spectral resolution of 10 nm and a spatial resolution of 1 m. The whole image had a spatial size of 307 307 pixels. It comprised 210 spectral bands, and 162 bands were used in the experiment after the noise and water absorption bands had been removed. The image scene in pseudocolor is shown in Figure 5a. A region with a size of 80 100 pixels was selected as the test data in the upper-rightmost area of the scene and is shown in Figure 5b. The ground-truth map is shown in Figure 5c. Twenty-one pixels were anomalies, which were cars and roofs, because they had spectra that differed from the background.
The second real dataset [32,33,34] was acquired by the AVIRIS sensor over San Diego, CA, USA. This image had a spatial resolution of 3.5 m and the whole image had a spatial size of 400 400 pixels. It comprised 224 spectral channels, and 186 channels were used in the experiment after the noise and water absorption bands had been removed. The image scene in pseudocolor is shown in Figure 6a. The top-left 100 100 of the scene was chosen as the test image, as shown in Figure 6b. The ground-truth map is shown in Figure 6c. Fifty-eight pixels were anomalies from the subimage. The airplanes were considered as anomalies, the main bodies of which were pure pixels and edges were mixed pixels.
The third real dataset was acquired during the “Viareggio 2013 trial” hyperspectral data collection campaign [35], which can be downloaded from the website [36]. Datasets in this campaign were acquired by a pushbroom hyperspectral “Sistema Iperspettrale Modulare Galileo Avionica” sensor mounted on an ultralight aircraft. In this paper, the subset of D1F12H1 was utilized. The image had a spatial size of 375 450 pixels and comprised 511 spectral bands ranging from 400 to 1000 nm. The spatial resolution and spectral resolution were 0.6 m and the 2.3 nm, respectively. The image scene in true color is shown in Figure 7a. It covers a parking lot, several sports facility buildings, and a football field in a suburban vegetated area in Viareggio, Italy. In the ground-truth map (Figure 7b), there are three vehicles, four panels, and two reference calibration tarps with 135 anomalous pixels to be detected in the scene.
4.2. Detection Performance
The proposed methods (MLW_LRRSTO and SLW_LRRSTO) were compared to the GRXD, LRXD, WRXD, RPCA-RX, and LRRSTO. In different datasets, the window size parameters were set differently for LRXD, and the parameters of other methods remained the same. The regularization parameters for LRXD, RPCA-RX, and LRRSTO were empirical parameters in the experiments. In the LRXD, the covariance matrix size depends on the number of bands, and in order to have an accurate sample covariance matrix, the number of captured pixels should be no less than band number + 1. Therefore, in AVIRIS_Salinas, HYDICE_Urban, AVIRIS_SanDiego, and Viareggio datasets, the inner and outer window parameters (, ) were set to (17, 9), (19, 5), (19, 9), and (25, 7), respectively, after extensive searching. Parameter of RPCA was set to 0.01 and parameter of LRRSTO was set to 0.1. The size of the single local window was set to 3 for MLW_LRRSTO and SLW_LRRSTO, and the tradeoff parameters were set as and for MLW_LRRSTO and SLW_LRRSTO. It is worth noting that the detection results of all the methods in this paper are the average value of 10 repeated experiments. The parameters of each detection method were set as shown in Table 2.
4.2.1. AVIRIS_Salinas Experiment
Figure 8 shows the receiver operating characteristic (ROC) curves [37]. An important observation from Figure 8 is that the performance of RPCA was clearly better than that of GRXD, LRXD, and WRXD. Compared with LRRSTO, the proposed SLW_LRRSTO and MLW_LRRSTO had a higher probability of detection in the condition of a low false alarm rate. MLW_LRRSTO was the best method in terms of the overall detection performance. Furthermore, we also computed the AUC of the ROC [37] to evaluate the performance of these methods. The results are shown in Table 3, where the proposed MLW_LRRSTO achieved the highest score, which was higher than the second-highest score from the SLW_LRRSTO. Table 3 also lists the execution time of the different methods. The GRXD and WRXD had shorter computational time, but the detection rates were lower than RPCA_RX and LRRSTO. The RPCA_RX and LRRSTO took less time than MLW_LRRSTO, while compared with it, the SLW_LRRSTO and MLW_LRRSTO had higher detection rates. The SLW_LRRSTO and MLW_LRRSTO had less computational time than LRXD, in which the inverse function of local background requires heavy computational time.
4.2.2. HYDICE_Urban Experiment
The ROC curves and AUC values are shown in Figure 9 and Table 4, respectively. The proposed MLW_LRRSTO and SLW_LRRSTO generated higher probability of detection when the false alarm rate was low, and they had similar ROC curves. SLW_LRRSTO achieved the highest AUC score among all the detectors, and MLW_LRRSTO obtained the second-highest score. Therefore, it can be concluded that MLW_LRRSTO and SLW_LRRSTO were more effective methods than GRXD, LRXD, WRXD, RPCA, and LRRSTO for the detection of anomalous pixels in the HYDICE_urban dataset. As shown in Table 3, according to the computational time of the different methods, we can see that GRXD, WRXD, and RPCA_RX had relatively fast operation speed and LRXD took longer to calculate. The MLW_LRRSTO took the longest time to calculate, in which the use of multiple local windows requires heavy computational time, but the proposed MLW_LRRSTO and SLW_LRRSTO generated higher detection rates than the others.
4.2.3. AVIRIS_SanDiego Experiment
The ROC curves of all the methods are shown in Figure 10. Compared with LRXD, the proposed MLW_LRRSTO exhibited a slightly lower probability of detection for a low false alarm rate. Compared to SLW_LRRSTO, MLW_LRRSTO exhibited a higher probability of detection in terms of the overall detection performance, and it achieved the highest probability of detection for all the false alarm rate values. The AUC values and computational time of the different methods are shown in Table 5, where the GRXD, WRXD, and RPCA_RX had shorter computational times than the others, and the MLW_LRRSTO took the longest time to calculate. However, the proposed MLW_LRRSTO yielded a score that was higher than that of the others. Compared with LRRSTO, the SLW_LRRSTO had a shorter computational time and higher detection rate, which is a significant improvement.
4.2.4. Viareggio Experiment
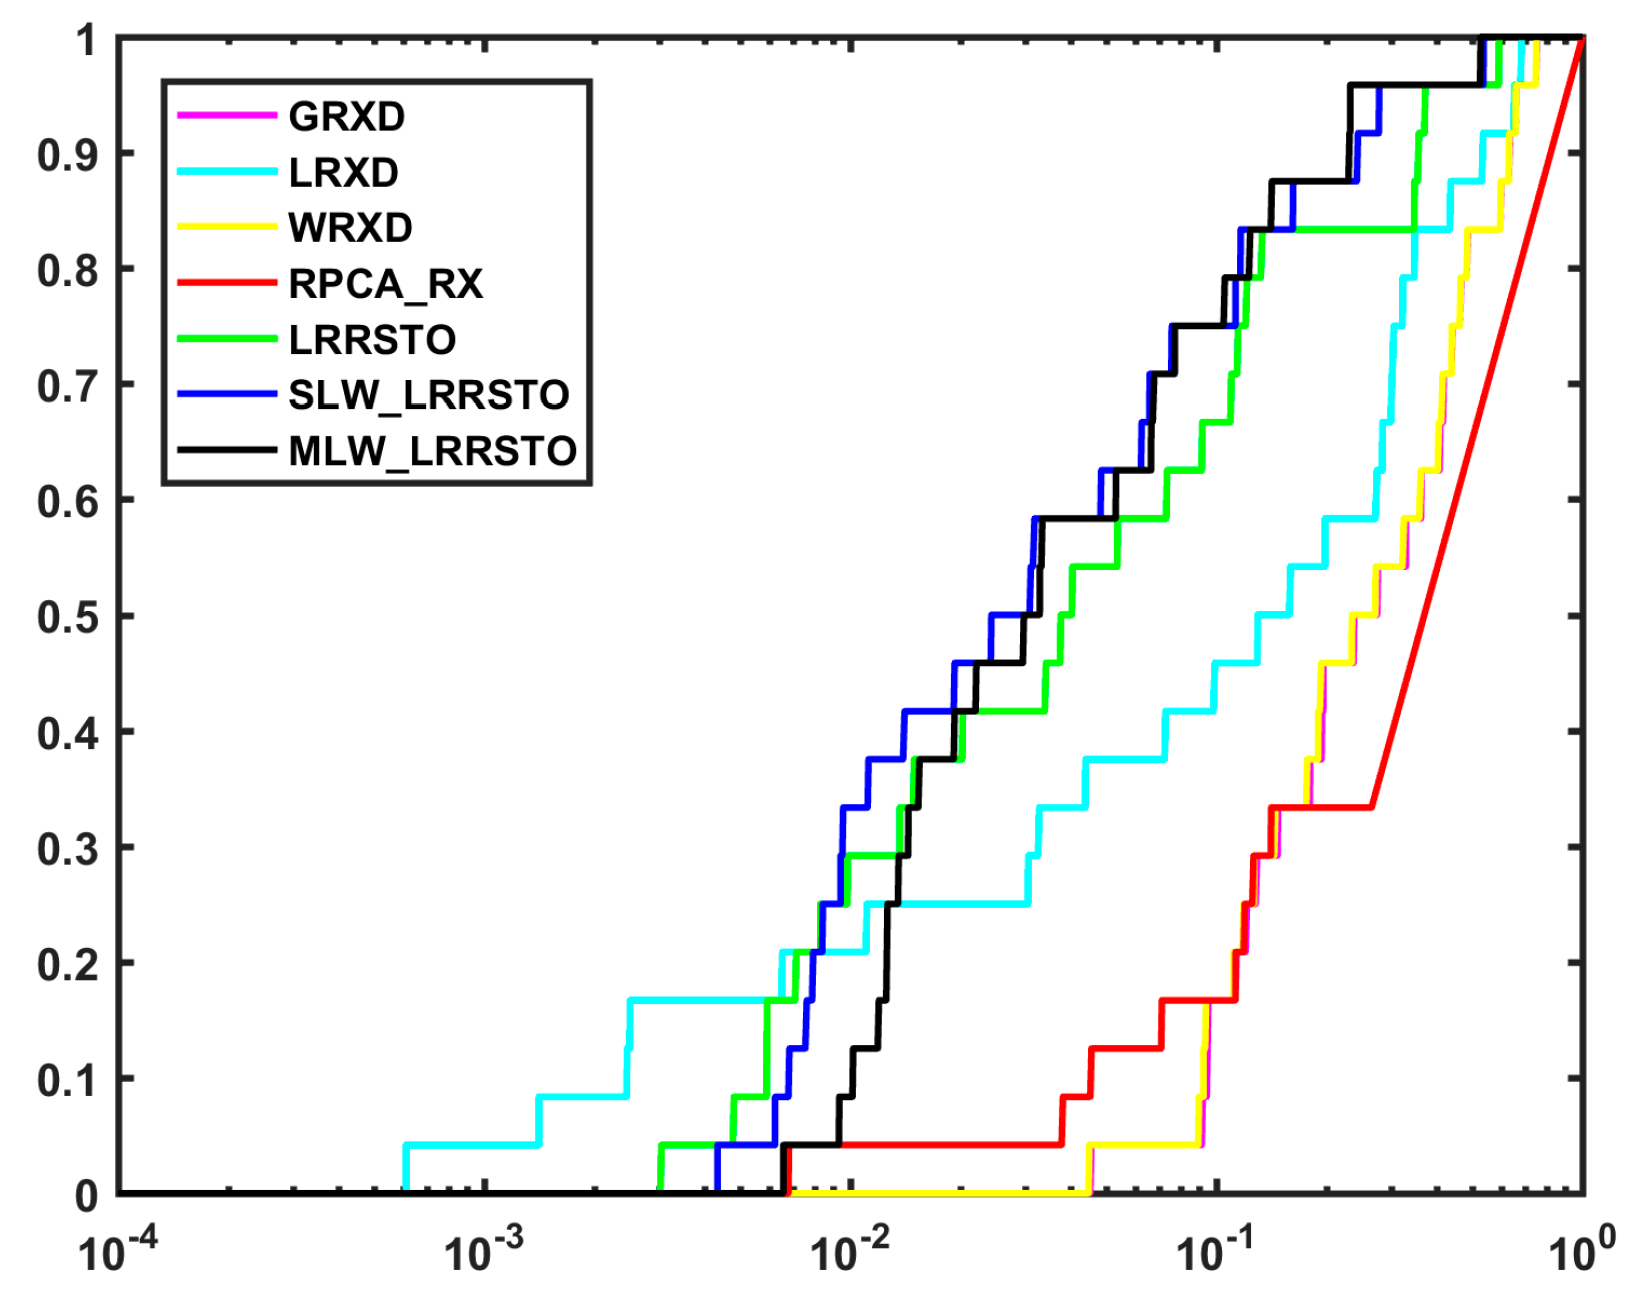
The ROC curves of all the methods are shown in Figure 11. Compared with LRRSTO, the proposed SLW_LRRSTO and MLW_LRRSTO exhibited a slightly lower probability of detection for a low false alarm rate. From the AUC values in Table 6, we can conclude that the GRXD and RPCA_RX had lower detection accuracy. Compared with the others, SLW_LRRSTO and MLW_LRRSTO yielded higher scores, which indicates that the two proposed methods had a significant improvement. From the computational time in Table 6, we can see that the GRXD and WRXD had shorter computational time than the others, and the LRXD had the longest time, which may have been caused by the large window size or the inverse function of local background. The computational time of SLW_LRRSTO and MLW_LRRSTO was relatively longer, but the detection accuracy was improved significantly compared with the other methods.
4.3. Discussion
To verify the effectiveness of the proposed methods, we conducted our experiments on three hyperspectral images which are widely used in the field of anomaly detection and compared the results with five other methods: GRXD, LRXD, WRXD, RPCA-RX, and LRRSTO.
In the proposed SLW_LRRSTO method, in order to achieve better spatial constraints, we smoothed the LRR coefficients of the central testing pixel by using a single local window. However, the spatial constraints of coefficients using a single local window were greatly affected by the anomalous pixels in the neighborhood. Therefore, in order to effectively reduce the impact of the anomalous pixels in the neighborhood, we proposed the MLW_LRRSTO algorithm, which adopts the multiple local window to constrain the spatial coefficients.
For a numerical comparison, we used the ROC curves and AUC values as the main criteria to evaluate these detection results. From the ROC curves shown in Figure 8, Figure 9, Figure 10 and Figure 11, and the specific AUC values shown in Table 3, Table 4, Table 5 and Table 6, it can be seen that the detection accuracy of the proposed two methods was obviously better than that of the other methods. Based on these experimental results, we can conclude that the proposed two methods showed superior detection performance compared with the others.
Although the proposed methods yielded outstanding detection performance, there still exist some shortcomings that can be further improved. The proposed method involves two regularization parameters— and —which have an important influence on the detection results of images. Although the optimal parameters can be found by a trial-and-error method in synthetic data experiments, in practical applications, we can neither obtain the a priori knowledge of anomalous objects in advance nor can we find the optimal parameters by the trial-and-error method. Therefore, only empirical parameters can be used. Moreover, the matrix decomposition is very time consuming, and it is important to speed up the operation of the algorithm.
5. Conclusions
In this paper, two novel anomaly detection methods for HSIs have been proposed. The first approach is the SLW_LRRSTO anomaly detection method, which is based on LRRSTO with the combination of spectral and spatial information. SLW_LRRSTO adds a spatial constraint to the low-rank representation coefficient and smooths the low-rank representation coefficients of the central testing pixel using a single local window. The second approach is the MLW_LRRSTO method, which uses the same model as the SLW_LRRSTO method but employs a multiple local window smoothing filter strategy. To confirm the effectiveness of the proposed methods, experiments were conducted on both simulated and real hyperspectral data in comparison with other detection methods. The experimental results confirmed that SLW_LRRSTO and MLW_LRRSTO can effectively separate anomalous targets from the background, and their detection performance was clearly better than that of other detection methods. In particular, MLW_LRRSTO outperformed SLW_LRRSTO and offered the highest detection accuracy.
However, there still exist some aspects which can be further improved. The focus of the next research should be on how to automatically tune the parameters of the proposed SLW_LRRSTO and MLW_LRRSTO methods and to further improve the speed of the algorithms.
Author Contributions
K.T. and Z.H. conceived and designed the experiments; Z.H. performed the experiments; K.T., D.M., Y.C., and Q.D. analyzed the data; K.T., Z.H., D.M., Y.C., and Q.D. wrote the paper.
Funding
This research was supported in part by Natural Science Foundation of China (Nos. 41871337 and 41471356) and Shan’xi Key Research and Development Program (2018ZDXM-GY-023).
Conflicts of Interest
The authors declare no conflict of interests.
References
- Niu, Y.; Wang, B. Hyperspectral anomaly detection based on low-rank representation and learned dictionary. Remote Sens. 2016, 8, 289. [Google Scholar] [CrossRef]
- Li, W.; Wu, G.; Du, Q. Transferred deep learning for anomaly detection in hyperspectral imagery. IEEE Geosci. Remote Sens. Lett. 2017, 14, 597–601. [Google Scholar] [CrossRef]
- Nasrabadi, N.M. Hyperspectral target detection: An overview of current and future challenges. IEEE Signal Process. Mag. 2013, 31, 34–44. [Google Scholar] [CrossRef]
- Xu, Y.; Wu, Z.; Li, J.; Plaza, A.; Wei, Z. Anomaly detection in hyperspectral images based on low-rank and sparse representation. IEEE Trans. Geosci. Remote Sens. 2015, 54, 1990–2000. [Google Scholar] [CrossRef]
- Reed, I.S.; Yu, X. Adaptive multiple-band CFAR detection of an optical pattern with unknown spectral distribution. IEEE Trans. Acoust. Speech Signal Process. 1990, 38, 1760–1770. [Google Scholar] [CrossRef]
- Matteoli, S.; Diani, M.; Corsini, G. Improved estimation of local background covariance matrix for anomaly detection in hyperspectral images. Opt. Eng. 2010, 49, 046201. [Google Scholar] [CrossRef]
- Billor, N.; Hadi, A.S.; Velleman, P.F. BACON: Blocked adaptive computationally efficient outlier nominators. Comput. Stat. Data Anal. 2000, 34, 279–298. [Google Scholar] [CrossRef]
- Imani, M. RX Anomaly detector with rectified background. IEEE Geosci. Remote Sens. Lett. 2017, 14, 1313–1317. [Google Scholar] [CrossRef]
- Yao, X.; Zhao, C. Hyperspectral anomaly detection based on the bilateral filter. Infrared Phys. Technol. 2018, 92, 144–153. [Google Scholar] [CrossRef]
- Guo, Q.; Zhang, B.; Ran, Q.; Gao, L.; Li, J.; Plaza, A. Weighted-RXD and linear filter-based RXD: Improving background statistics estimation for anomaly detection in hyperspectral imagery. IEEE J. Sel. Top. Appl. Earth Obs. Remote Sens. 2014, 7, 2351–2366. [Google Scholar] [CrossRef]
- Li, W.; Du, Q. Unsupervised nearest regularized subspace for anomaly detection in hyperspectral imagery. In Proceedings of the 2013 IEEE International Geoscience and Remote Sensing Symposium—IGARSS, Melbourne, VIC, Australia, 21–26 July 2013; pp. 1055–1058. [Google Scholar]
- Li, W.; Du, Q. Collaborative representation for hyperspectral anomaly detection. IEEE Trans. Geosci. Remote Sens. 2015, 53, 1463–1474. [Google Scholar] [CrossRef]
- Philpott, S.; Hankins, C. Simultaneous joint sparsity model for target detection in hyperspectral imagery. IEEE Geosci. Remote Sens. Lett. 2011, 8, 676–680. [Google Scholar]
- Chen, Y.; Nasrabadi, N.M.; Tran, T.D. Hyperspectral image classification via kernel sparse representation. In Proceedings of the IEEE International Conference on Image Processing, Brussels, Belgium, 11–14 September 2011; pp. 1233–1236. [Google Scholar]
- Wright, J.; Ganesh, A.; Rao, S.; Peng, Y.; Ma, Y. Robust principal component analysis: Exact recovery of corrupted low-rank matrices via convex optimization. In Proceedings of the Advances in Neural Information Processing Systems, Vancouver, BC, Canada, 7–10 December 2009; pp. 2080–2088. [Google Scholar]
- Chen, S.Y.; Yang, S.; Kalpakis, K.; Chang, C.I. Low-rank decomposition-based anomaly detection. In Algorithms and Technologies for Multispectral, Hyperspectral, and Ultraspectral Imagery XIX; SPIE Press: Baltimore, MD, USA, 2013; p. 87430N. [Google Scholar]
- Liu, G.; Lin, Z.; Yan, S.; Sun, J.; Yu, Y.; Ma, Y. Robust recovery of subspace structures by low-rank representation. IEEE Trans. Pattern Anal. Mach. Intell. 2013, 35, 171–184. [Google Scholar] [CrossRef] [PubMed]
- Xu, Y.; Wu, Z.; Wei, Z.; Liu, H.; Xu, X. A novel hyperspectral image anomaly detection method based on low rank representation. In Proceedings of the 2015 IEEE International Geoscience and Remote Sensing Symposium (IGARSS), Milan, Italy, 26–31 July 2015; pp. 4444–4447. [Google Scholar]
- Zhai, H.; Zhang, H.; Zhang, L.; Li, P.; Plaza, A. A new sparse subspace clustering algorithm for hyperspectral remote sensing imagery. IEEE Geosci. Remote Sens. Lett. 2017, 14, 43–47. [Google Scholar] [CrossRef]
- Zhang, H.; Zhai, H.; Zhang, L.; Li, P. Spectral–spatial sparse subspace clustering for hyperspectral remote sensing images. IEEE Trans. Geosci. Remote Sens. 2016, 54, 3672–3684. [Google Scholar] [CrossRef]
- Elhamifar, E.; Vidal, R. Sparse subspace clustering: Algorithm, theory, and applications. IEEE Trans. Pattern Anal. Mach. Intell. 2013, 35, 2765–2781. [Google Scholar] [CrossRef]
- Fauvel, M.; Benediktsson, J.A.; Chanussot, J.; Sveinsson, J.R. Spectral and spatial classification of hyperspectral data using SVMs and morphological profiles. IEEE Trans. Geosci. Remote Sens. 2008, 46, 3804–3814. [Google Scholar] [CrossRef]
- Borghys, D.; Kåsen, I.; Achard, V. Comparative evaluation of hyperspectral anomaly detectors in different types of background. In Algorithms and Technologies for Multispectral, Hyperspectral, and Ultraspectral Imagery XVIII; The International Society for Optical Engineering: Baltimore, MD, USA, 2012; p. 83902J. [Google Scholar]
- Du, B.; Zhao, R.; Zhang, L.; Zhang, L. A spectral-spatial based local summation anomaly detection method for hyperspectral images. Signal Process. 2016, 124, 115–131. [Google Scholar] [CrossRef]
- Lin, Z.; Chen, M.; Ma, Y. The augmented lagrange multiplier method for exact recovery of corrupted low-rank matrices. arXiv 2010, arXiv:1009.5055. [Google Scholar]
- Yuan, Y.; Wang, Q.; Zhu, G. Fast hyperspectral anomaly detection via high-order 2-D crossing filter. IEEE Trans. Geosci. Remote Sens. 2014, 53, 620–630. [Google Scholar] [CrossRef]
- Ma, D.; Yuan, Y.; Wang, Q. A sparse dictionary learning method for hyperspectral anomaly Detection with capped norm. In Proceedings of the 2017 IEEE International Geoscience and Remote Sensing Symposium (IGARSS), Fort Worth, TX, USA, 23–28 July 2017; pp. 648–651. [Google Scholar]
- The Synthetic AVIRIS Salinas Hyperspectral Dataset. Available online: http://www.ehu.eus/ccwintco/index.php?title=Hyperspectral_Remote_Sensing_Scenes (accessed on 13 June 2019).
- Stefanou, M.S.; Kerekes, J.P. A method for assessing spectral image utility. IEEE Trans. Geosci. Remote Sens. 2009, 47, 1698–1706. [Google Scholar] [CrossRef]
- Li, J.; Zhang, H.; Zhang, L.; Ma, L. Hyperspectral anomaly detection by the use of background joint sparse representation. IEEE J. Sel. Top. Appl. Earth Obs. Remote Sens. 2015, 8, 2523–2533. [Google Scholar] [CrossRef]
- The Real HYDICE Urban Hyperspectral Dataset. Available online: http://lesun.weebly.com/hyperspectral-data-set.html (accessed on 13 June 2019).
- Zhu, L.; Wen, G. Hyperspectral anomaly detection via background estimation and adaptive weighted sparse representation. Remote Sens. 2018, 10, 272. [Google Scholar]
- Zhao, R.; Du, B.; Zhang, L. Hyperspectral anomaly detection via a sparsity score estimation framework. IEEE Trans. Geosci. Remote Sens. 2017, 55, 3208–3222. [Google Scholar] [CrossRef]
- Zhang, L.; Zhao, C. Hyperspectral anomaly detection based on spectral–spatial background joint sparse representation. Eur. J. Remote Sens. 2017, 50, 362–376. [Google Scholar] [CrossRef]
- Acito, N.; Matteoli, S.; Rossi, A.; Diani, M.; Corsini, G. Hyperspectral airborne “Viareggio 2013 Trial” data collection for detection algorithm assessment. IEEE J. Sel. Top. Appl. Earth Obs. Remote Sens. 2016, 9, 2365–2376. [Google Scholar] [CrossRef]
- The “Viareggio 2013 trial” Hyperspectral Dataset. Available online: http://rsipg.dii.unipi.it/ (accessed on 13 June 2019).
- Hanley, J.A.; Mcneil, B.J. The meaning and use of the area under a receiver operating characteristic (ROC) curve. Radiology 1982, 143, 29. [Google Scholar] [CrossRef]
Figure 1.
Analysis between the center test pixel and neighboring pixels in a single local window. The purple squares represent anomalous pixels, and the white squares represent the same category background pixels: (a) ideal distribution of neighboring pixels; (b) the neighborhood contains anomalous pixels; (c) the center pixel is a background pixel.
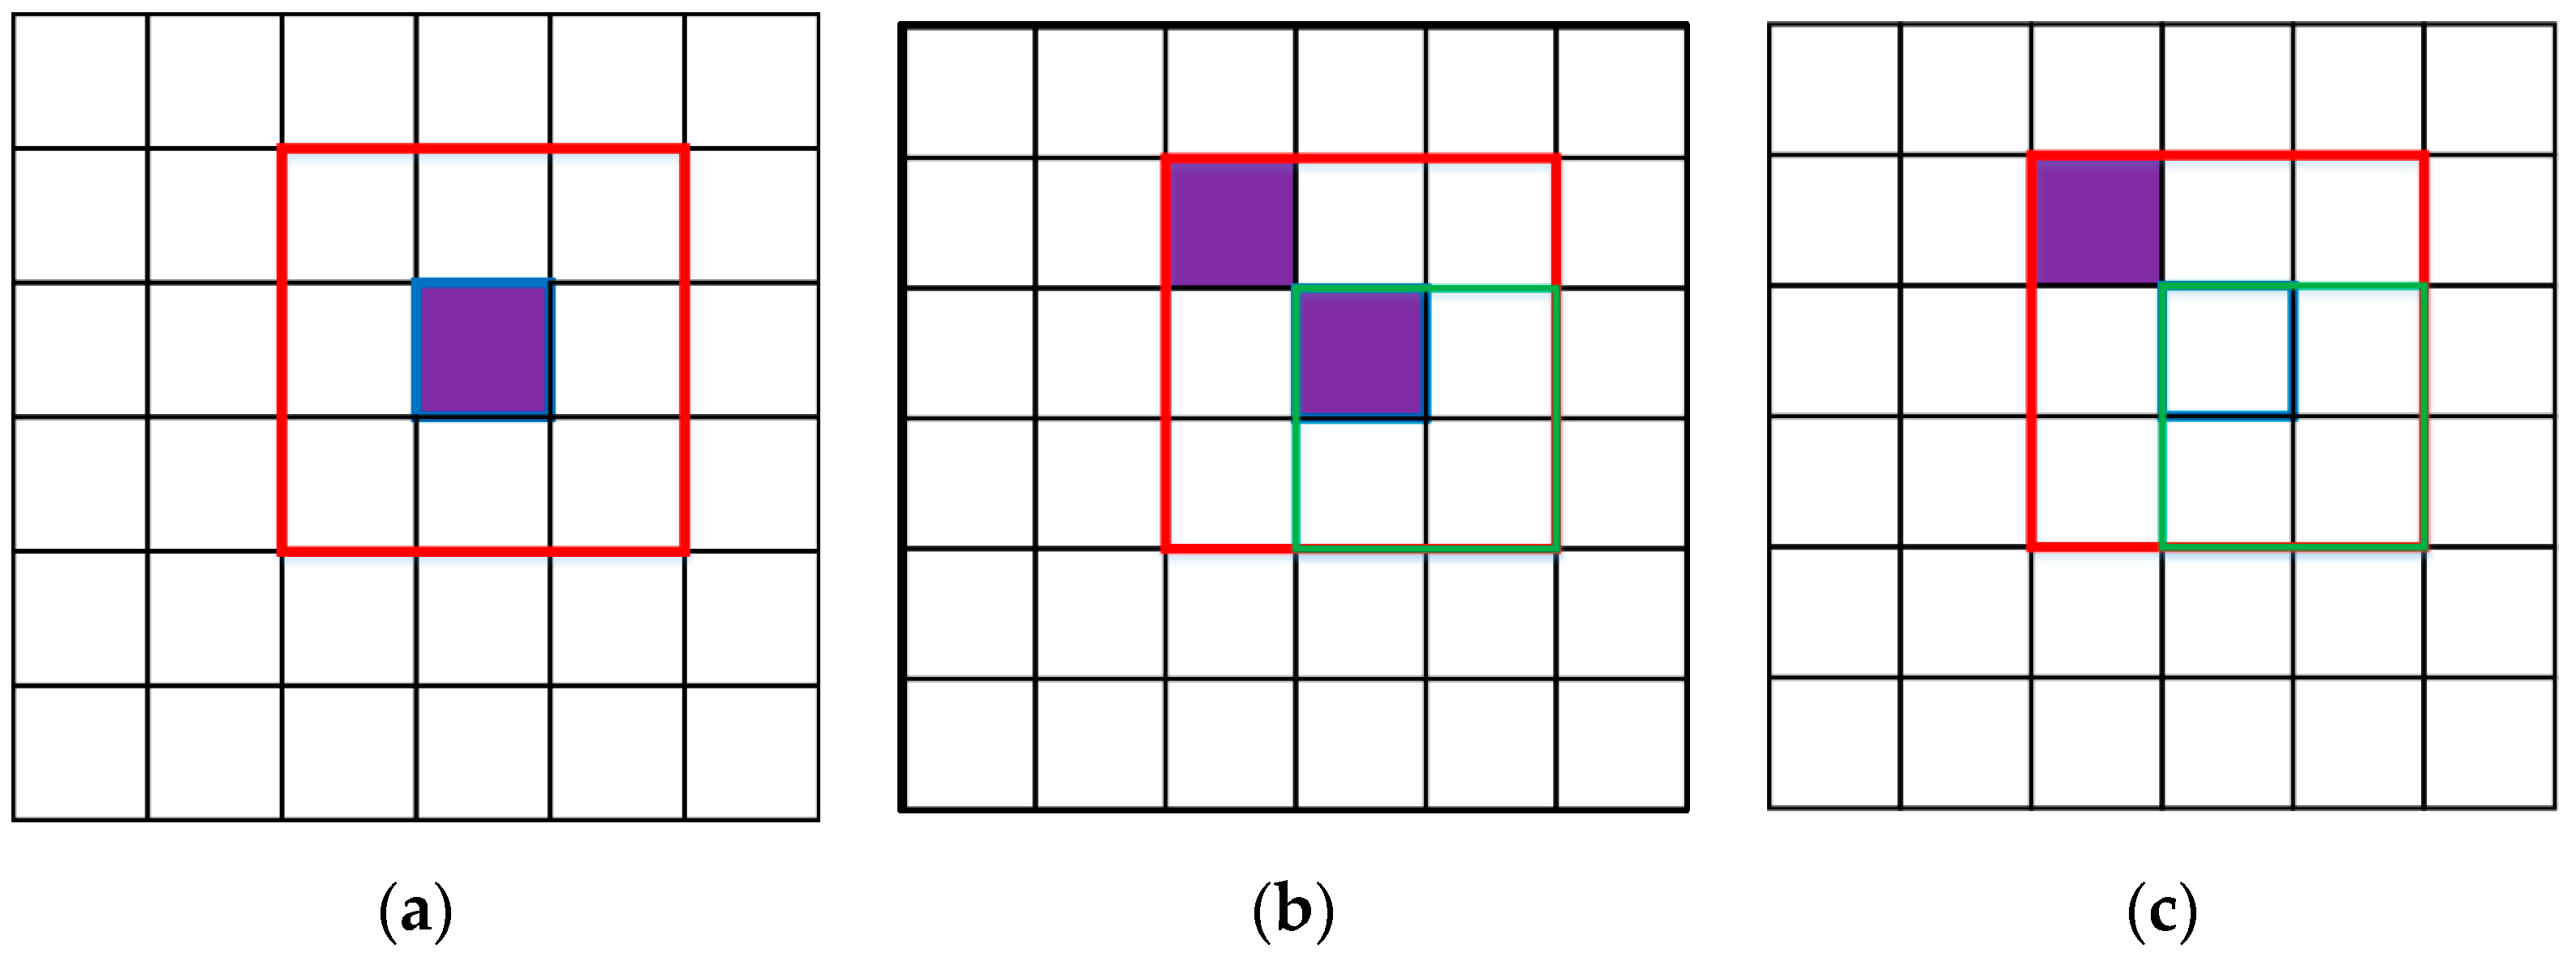
Figure 2.
Schematic diagram of a single local window and multiple local windows and the corresponding filters (N = 5): (a) single local window; (b) multiple local windows.
Figure 2.
Schematic diagram of a single local window and multiple local windows and the corresponding filters (N = 5): (a) single local window; (b) multiple local windows.
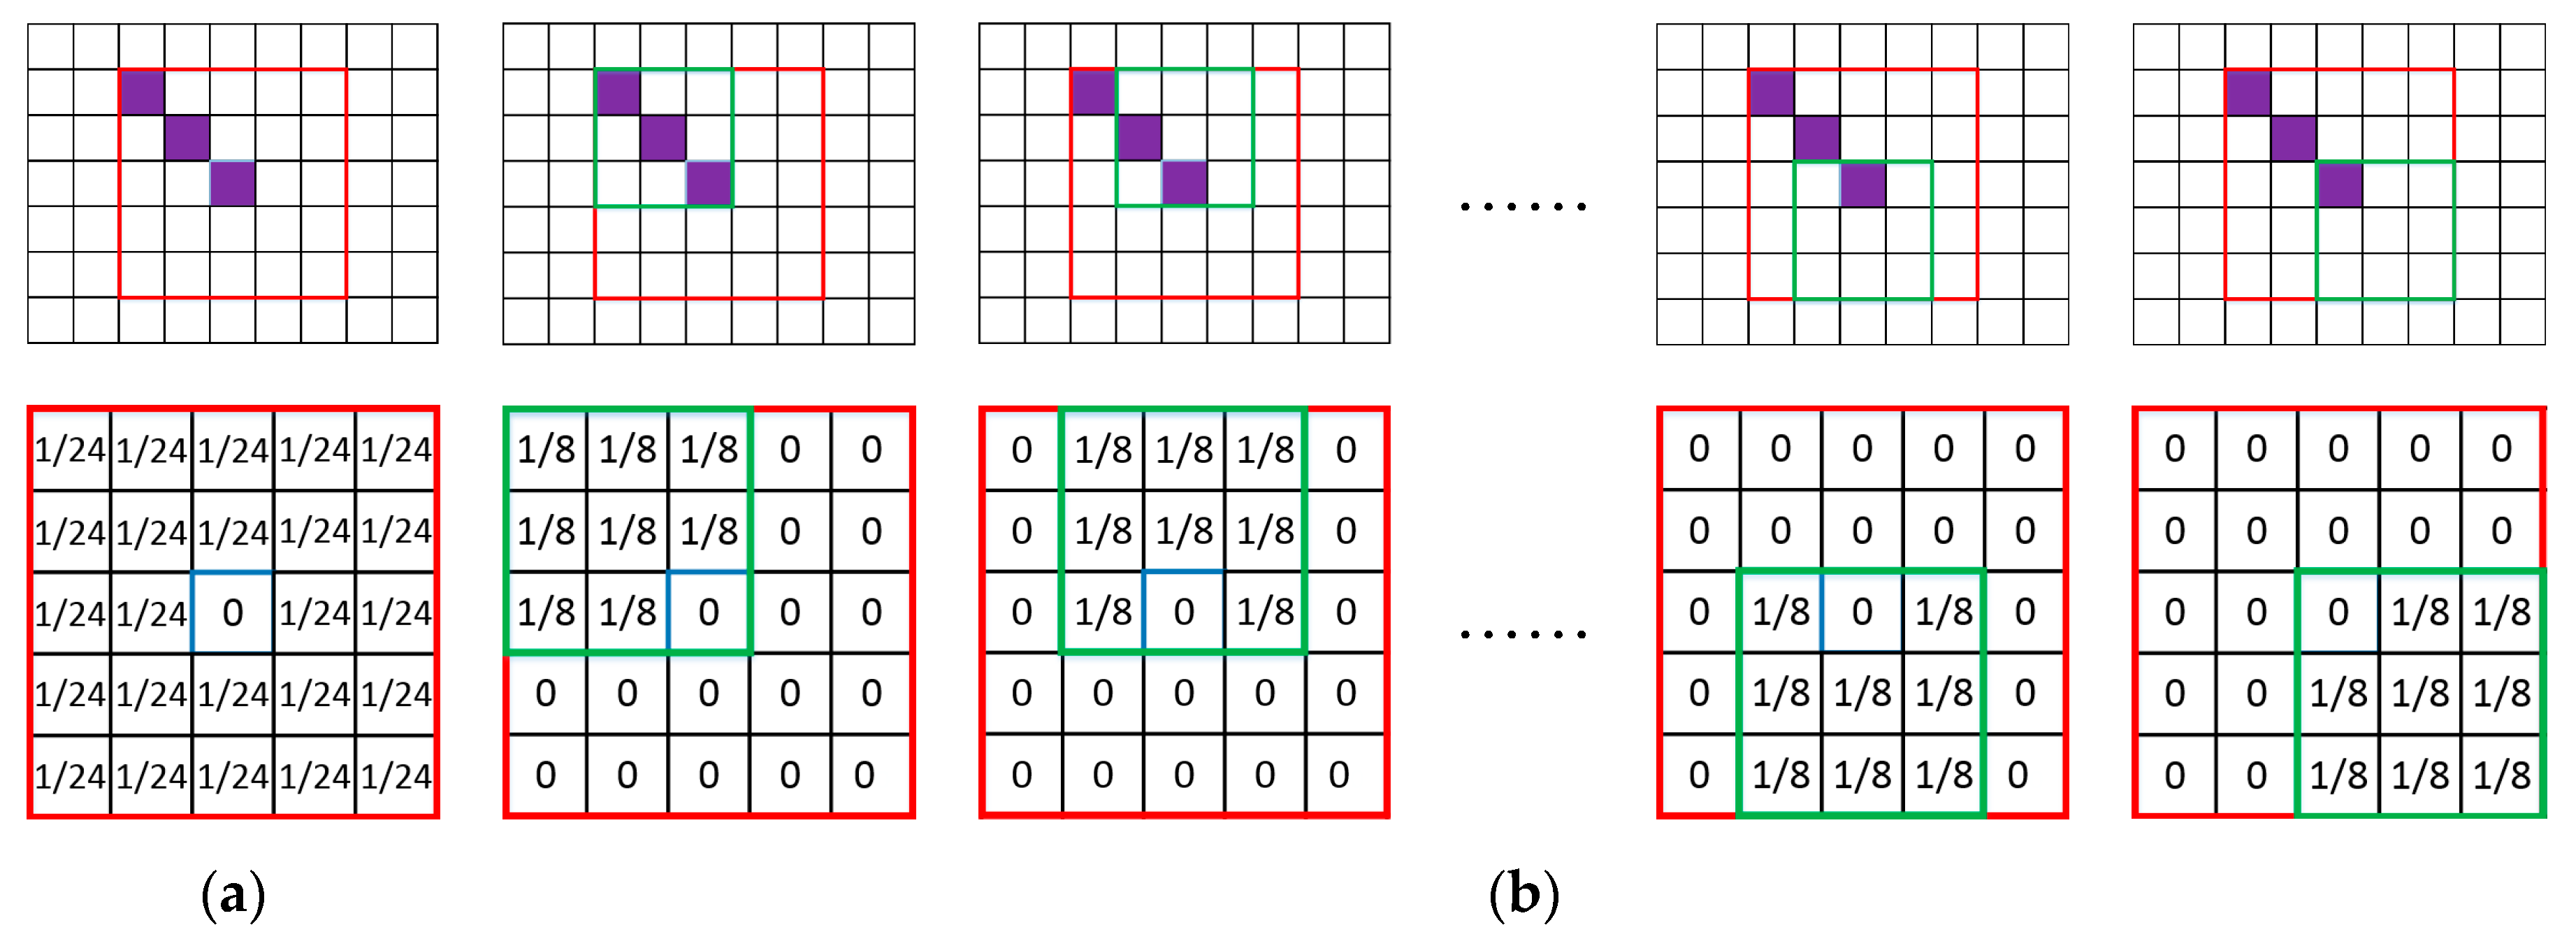
Figure 3.
AVIRSI_Salinas dataset: (a) false-color image of the whole scene (R:65, G:33, B:21); (b) false-color image of the subarea; (c) false-color image of the synthetic; (d) the anomaly location map.
Figure 3.
AVIRSI_Salinas dataset: (a) false-color image of the whole scene (R:65, G:33, B:21); (b) false-color image of the subarea; (c) false-color image of the synthetic; (d) the anomaly location map.
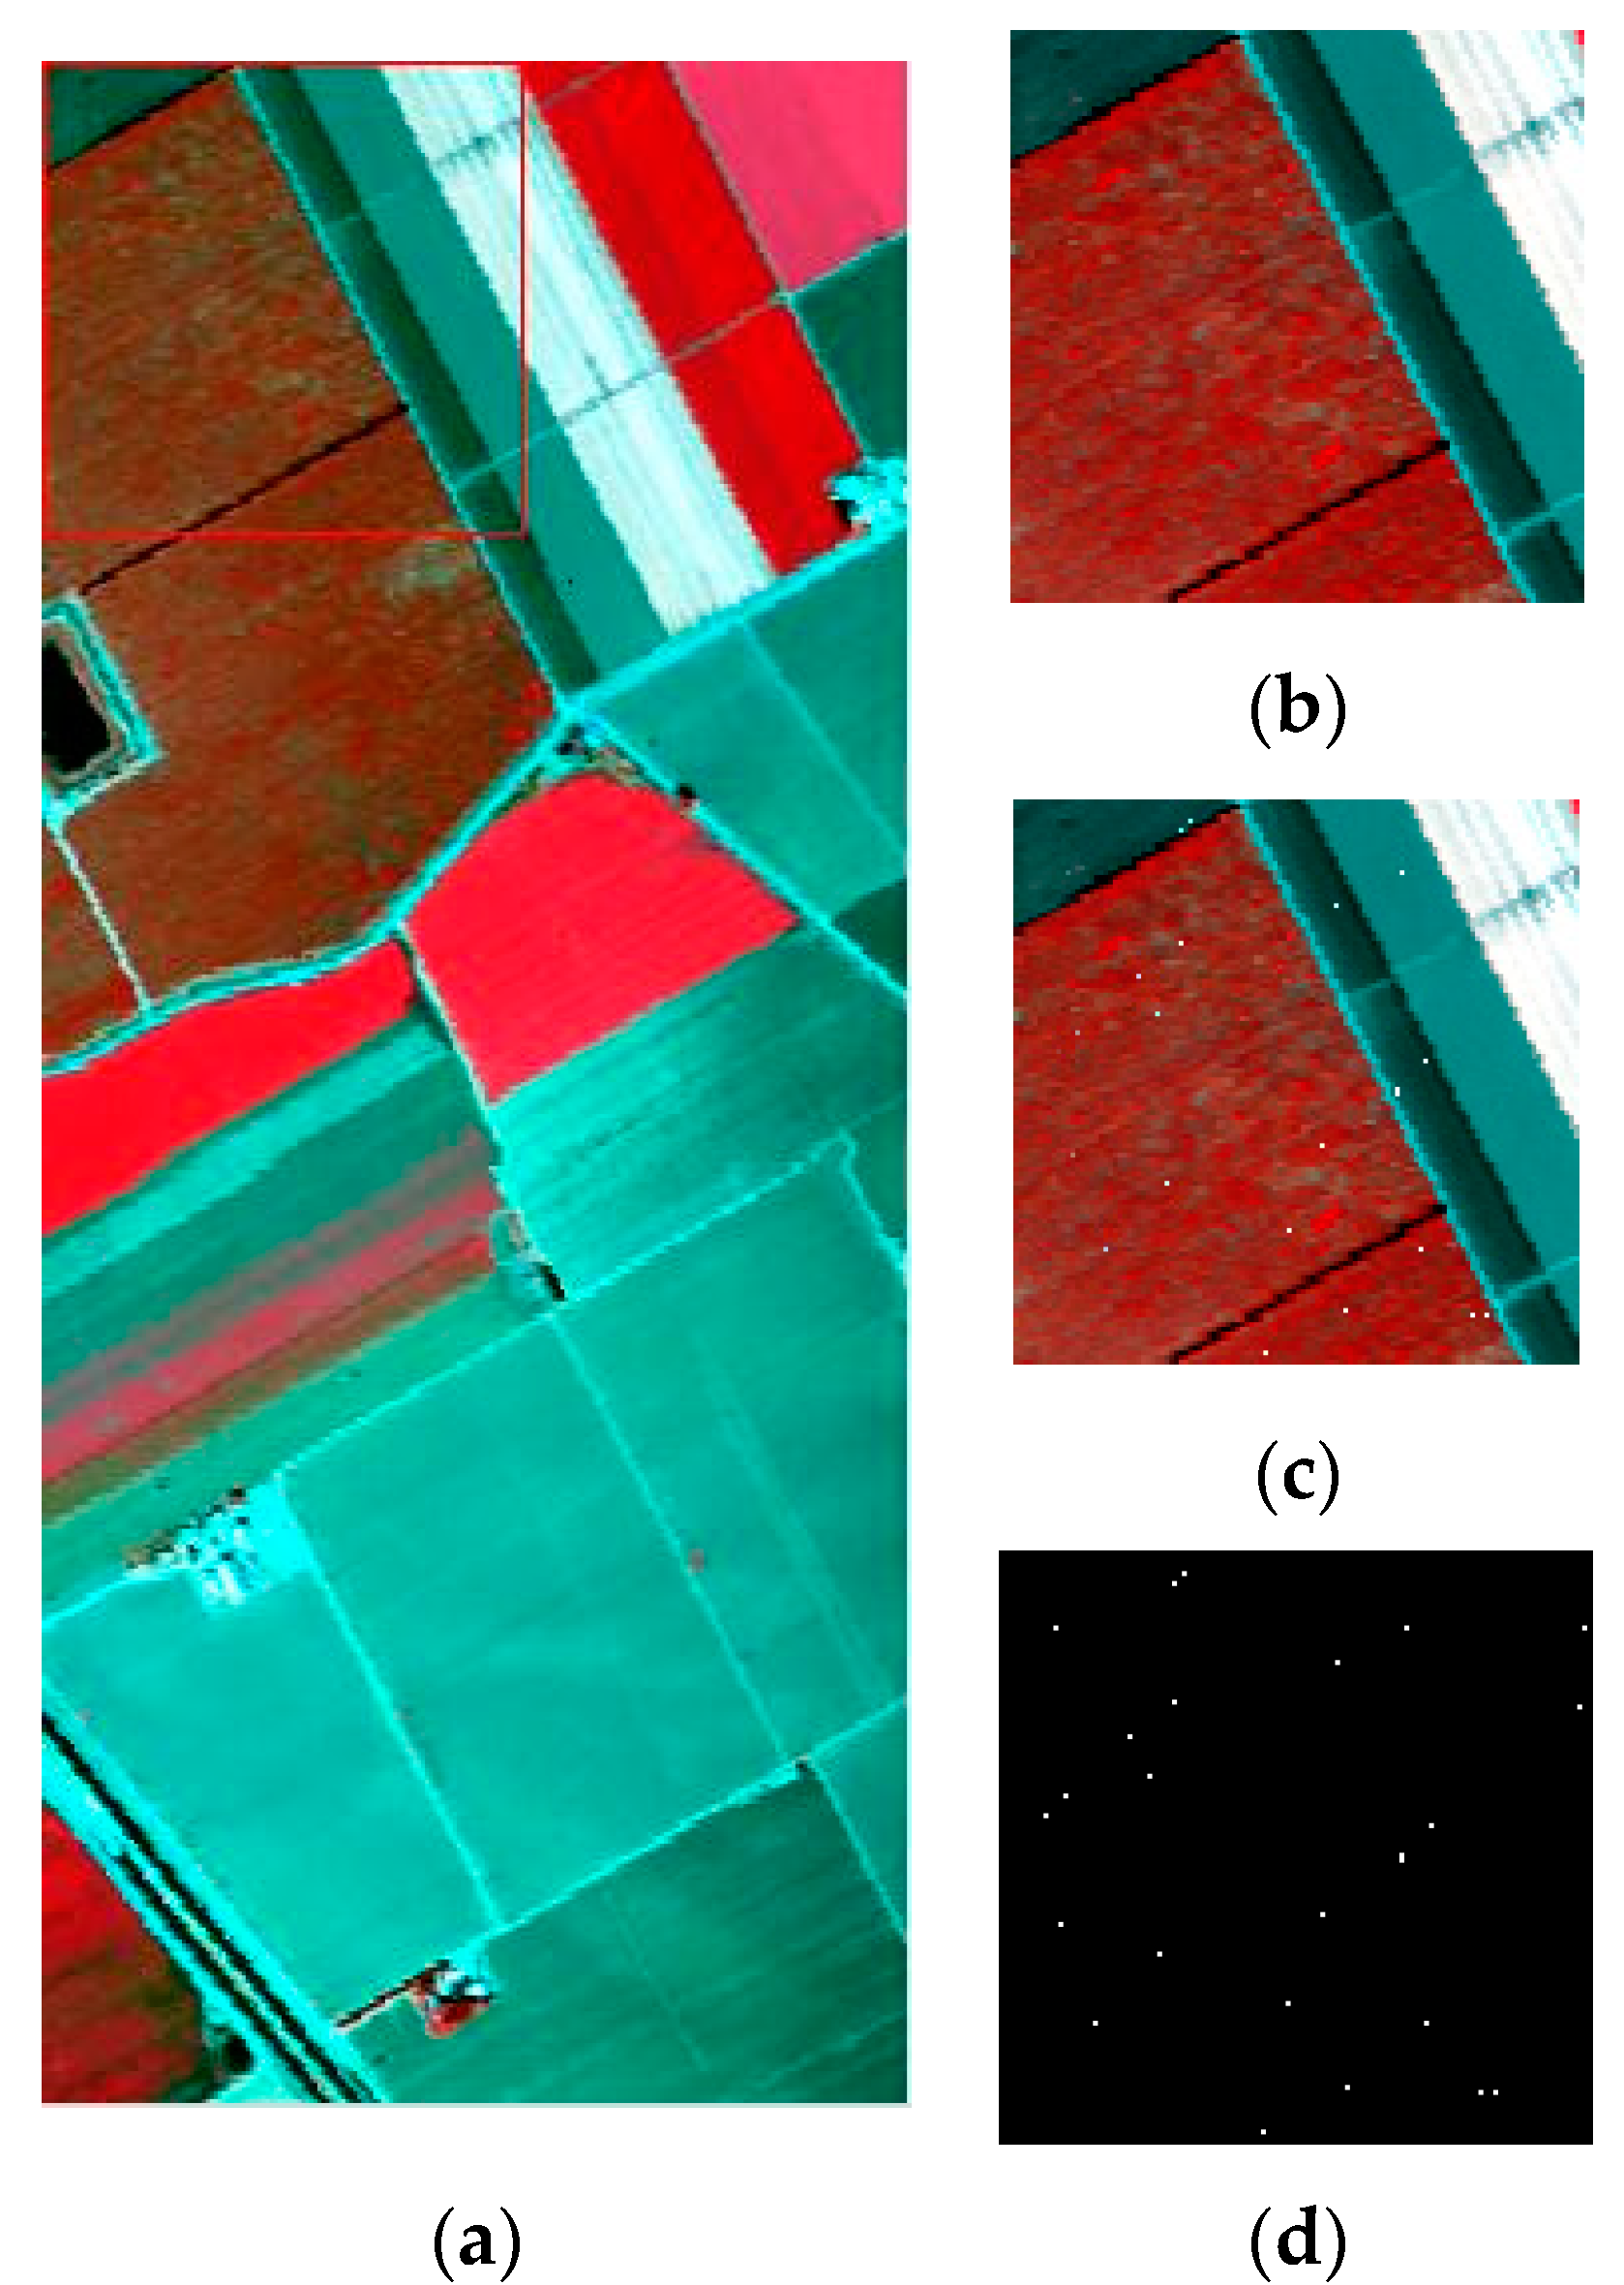
Figure 4.
Results with different parameters for AVIRIS_Salinas dataset.
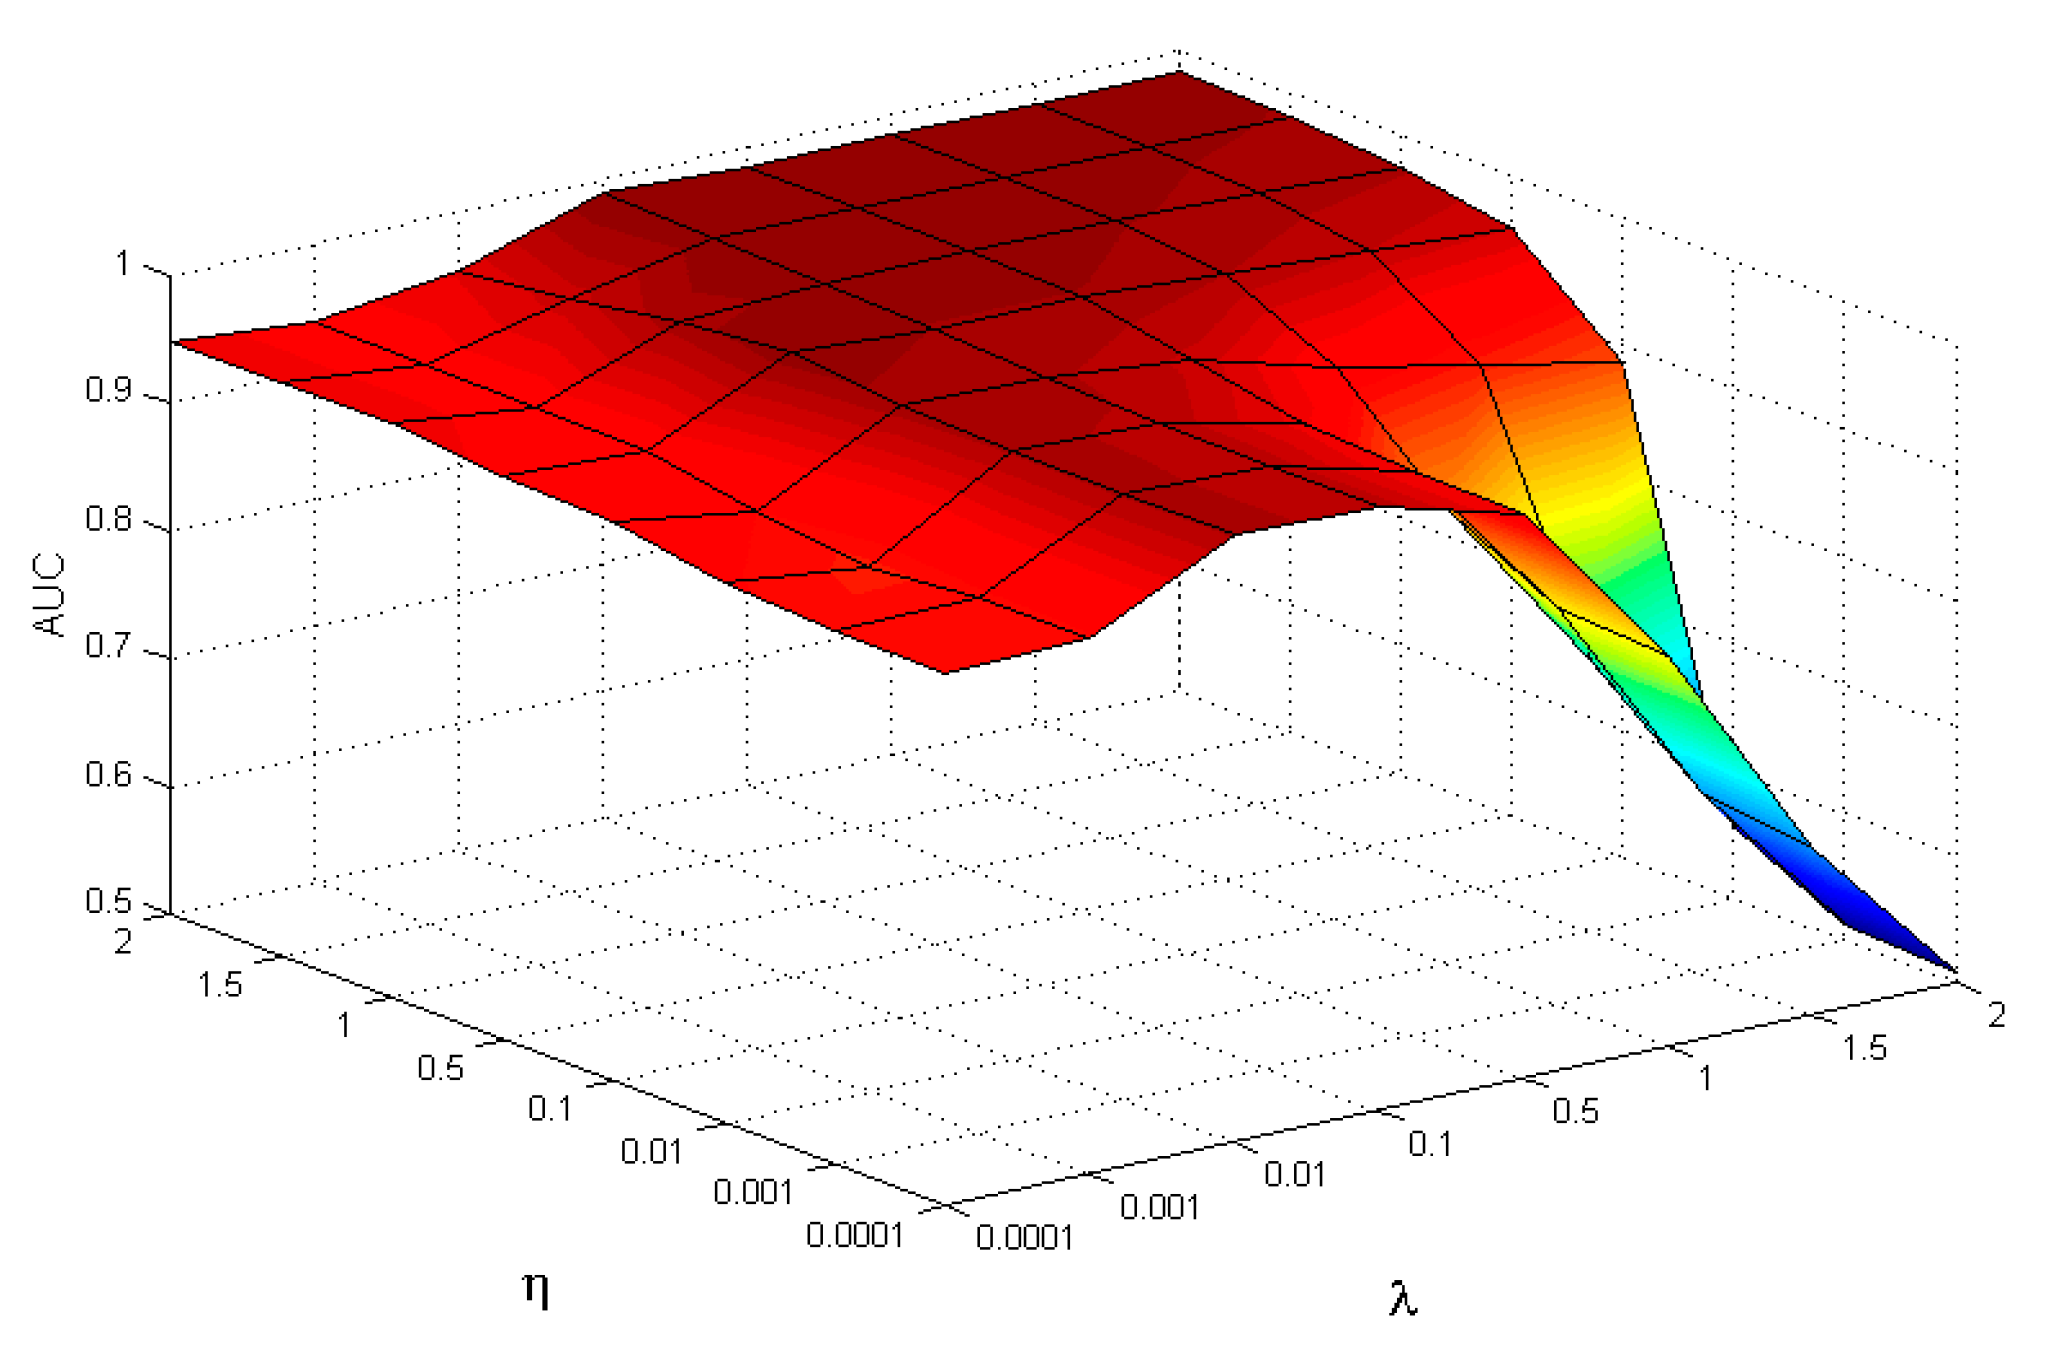
Figure 5.
HYDICE_Urban dataset: (a) false-color image of the whole scene; (b) false-color image of the detection area; (c) the ground-truth map.
Figure 5.
HYDICE_Urban dataset: (a) false-color image of the whole scene; (b) false-color image of the detection area; (c) the ground-truth map.
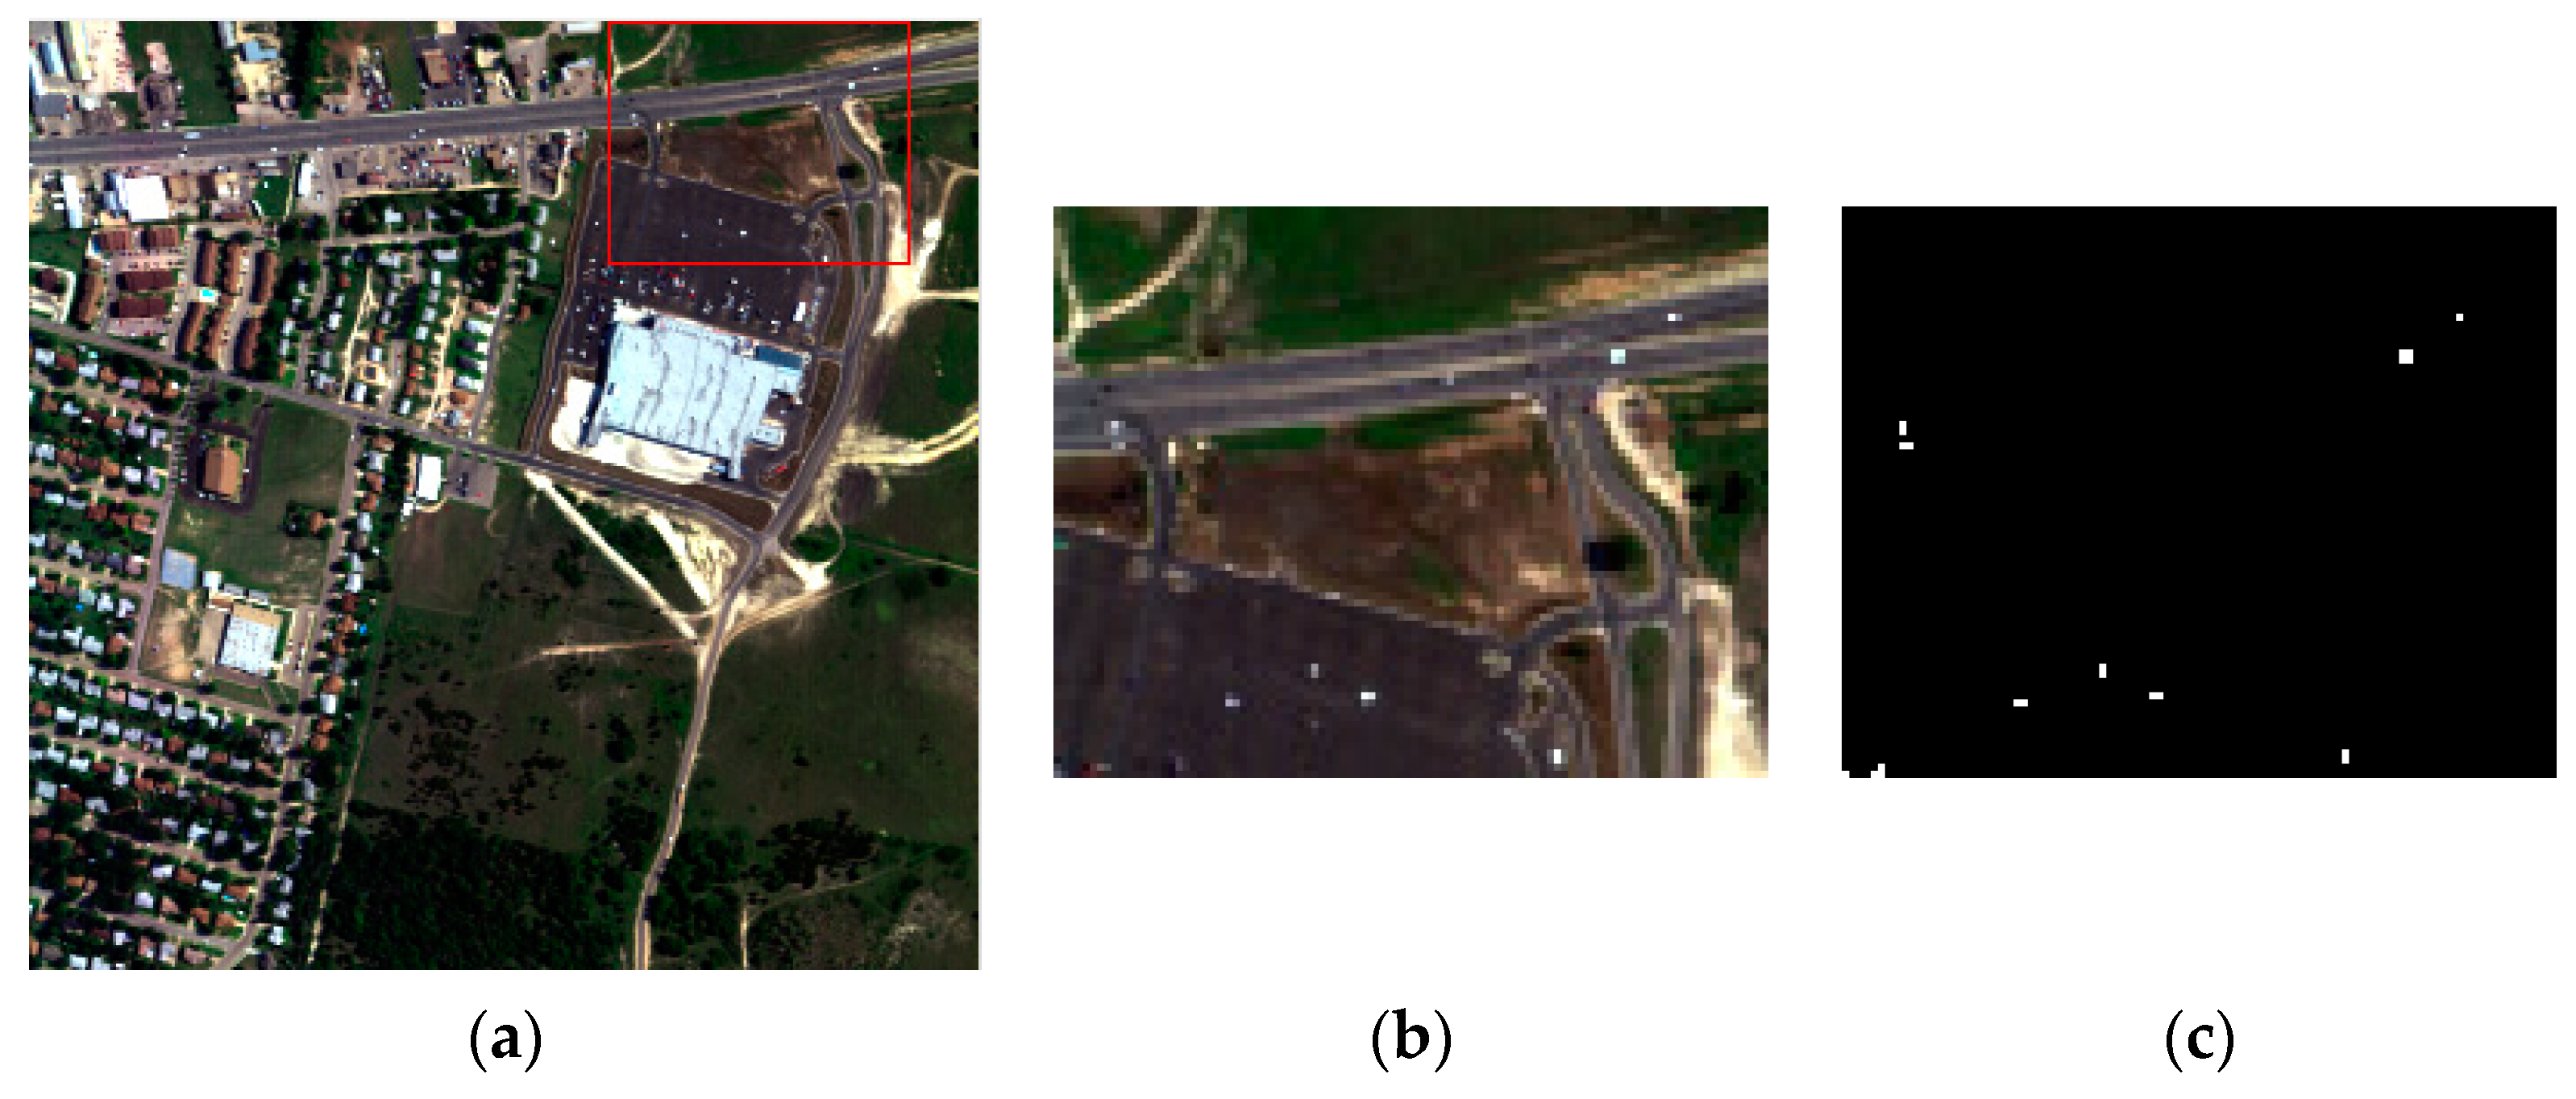
Figure 6.
AVIRIS_SanDiego dataset: (a) false-color image of the whole scene; (b) false-color image of the detection area; (c) the ground-truth map.
Figure 6.
AVIRIS_SanDiego dataset: (a) false-color image of the whole scene; (b) false-color image of the detection area; (c) the ground-truth map.
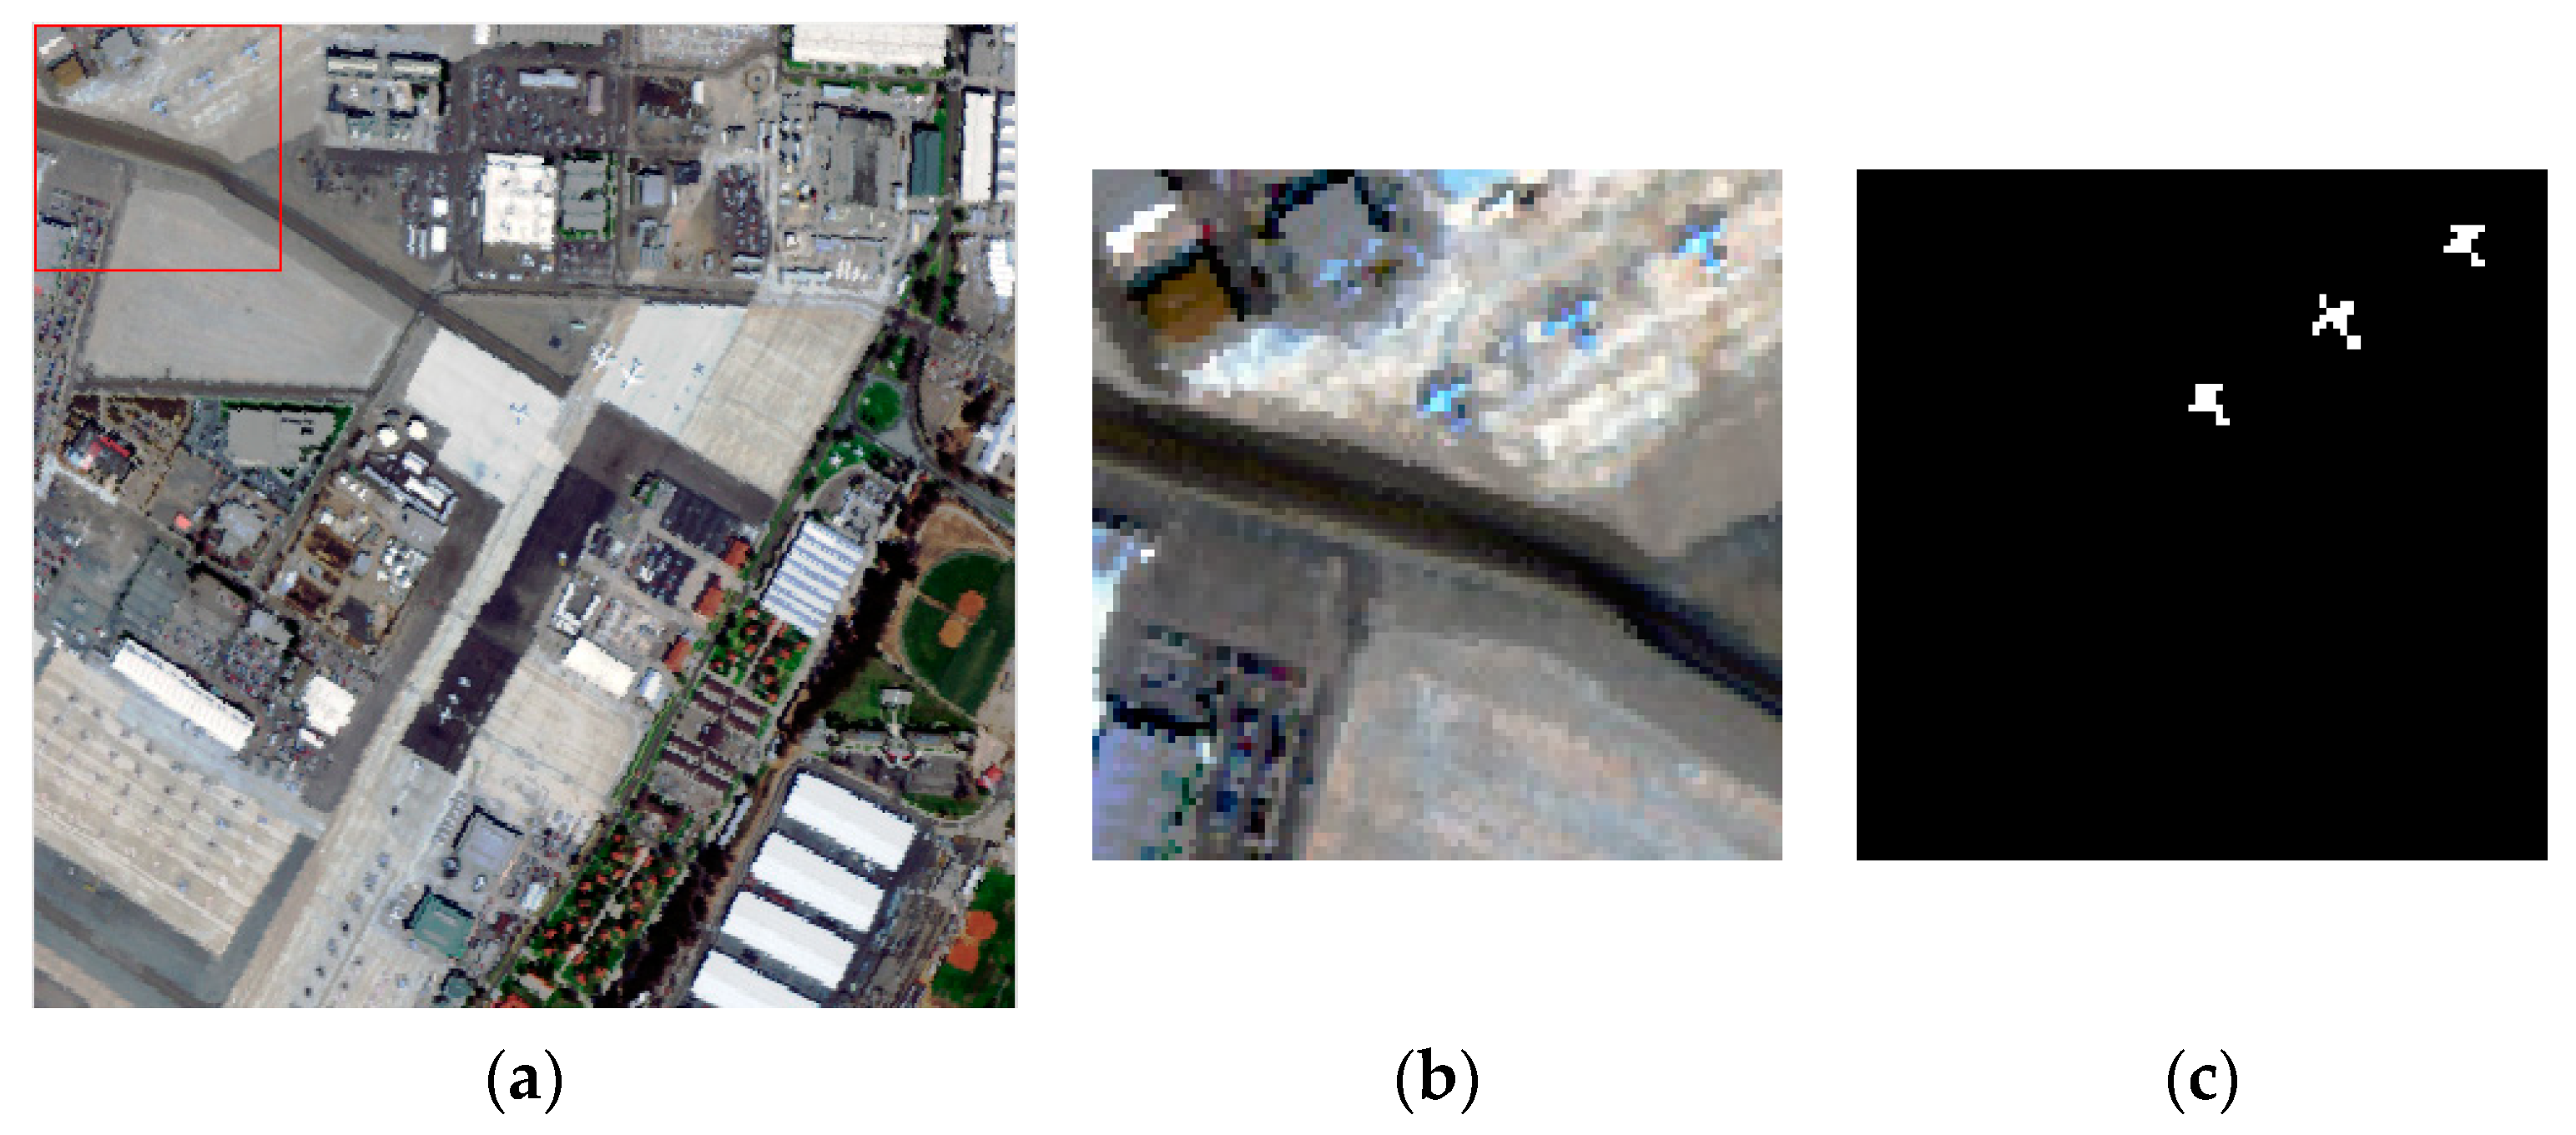
Figure 7.
Viareggio dataset: (a) RGB image of the scene (R:219, G:144, B:66); (b) the ground-truth map.
Figure 7.
Viareggio dataset: (a) RGB image of the scene (R:219, G:144, B:66); (b) the ground-truth map.

Figure 8.
Receiver operating characteristic (ROC) evaluation of the different methods for the AVIRIS_Salinas data.
Figure 8.
Receiver operating characteristic (ROC) evaluation of the different methods for the AVIRIS_Salinas data.
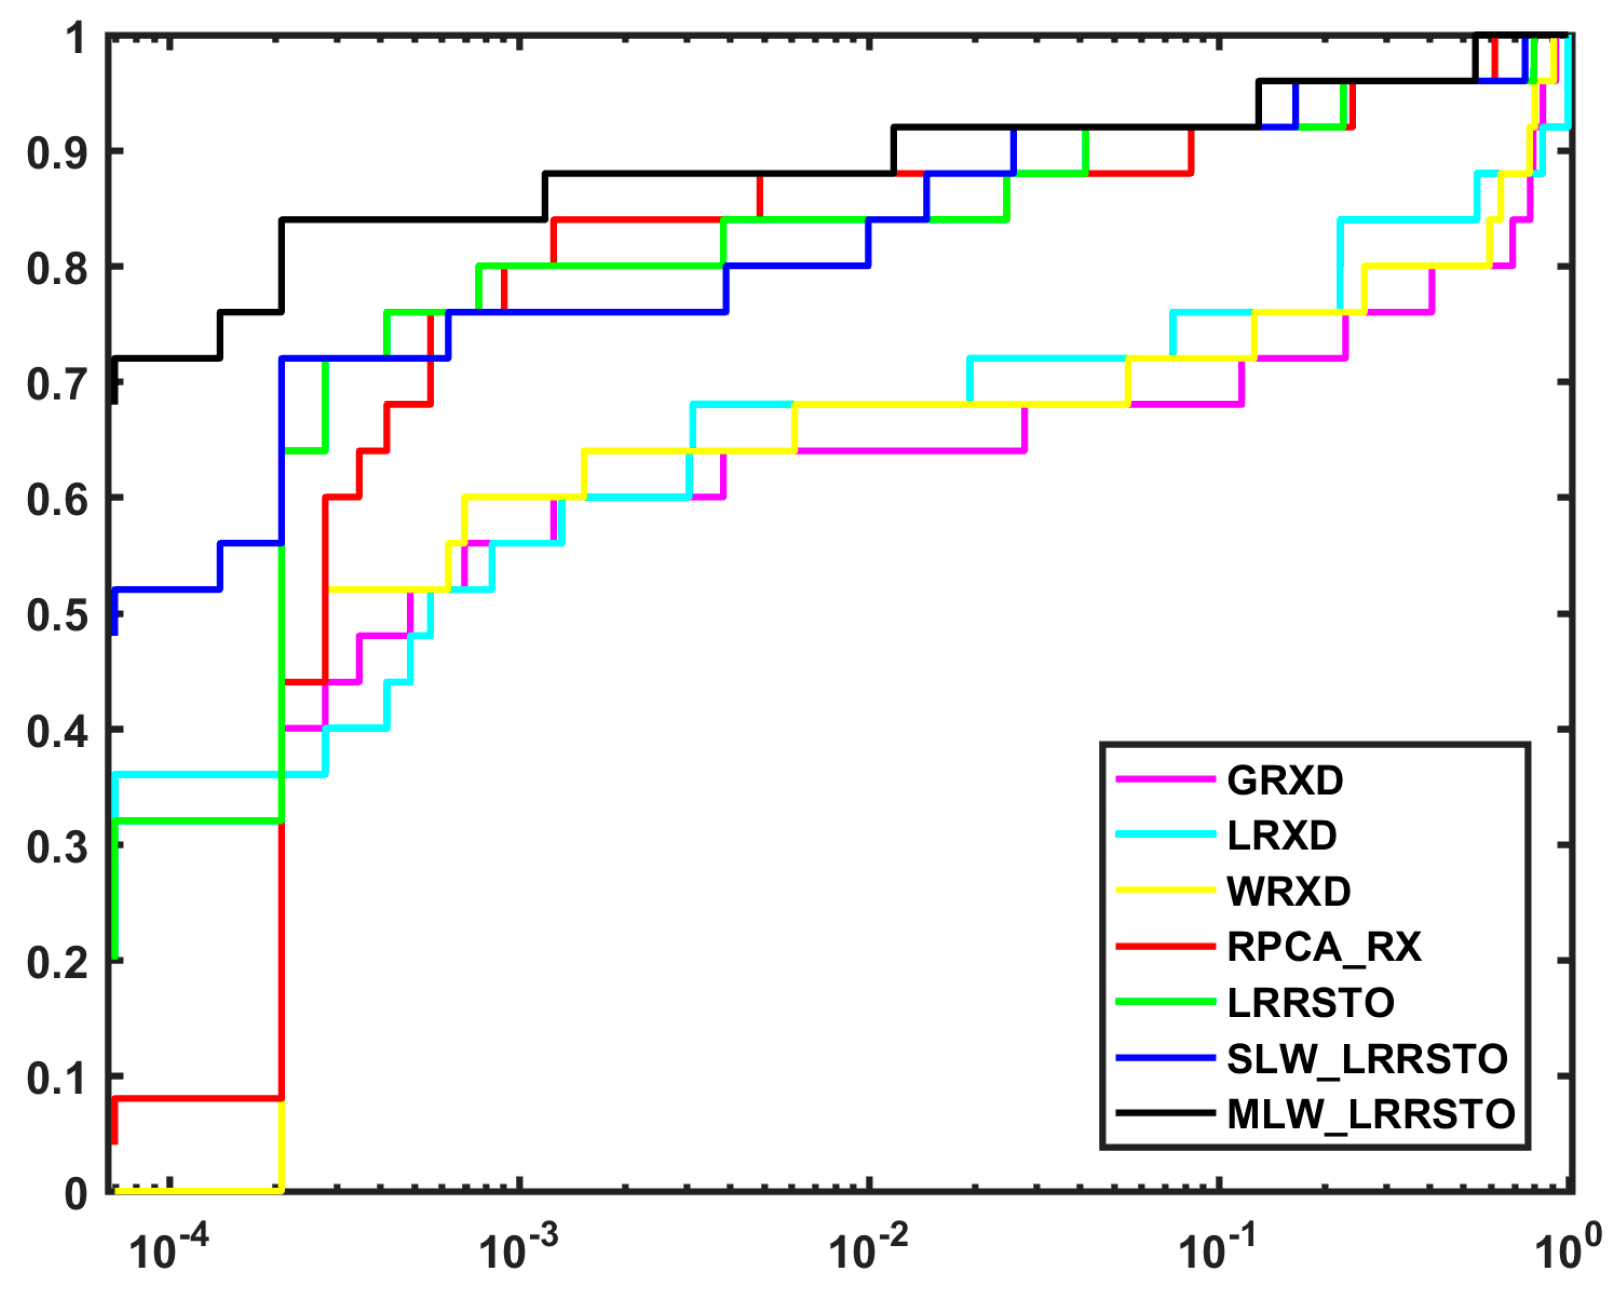
Figure 9.
ROC evaluation of the different methods for the HYDICE_urban dataset.
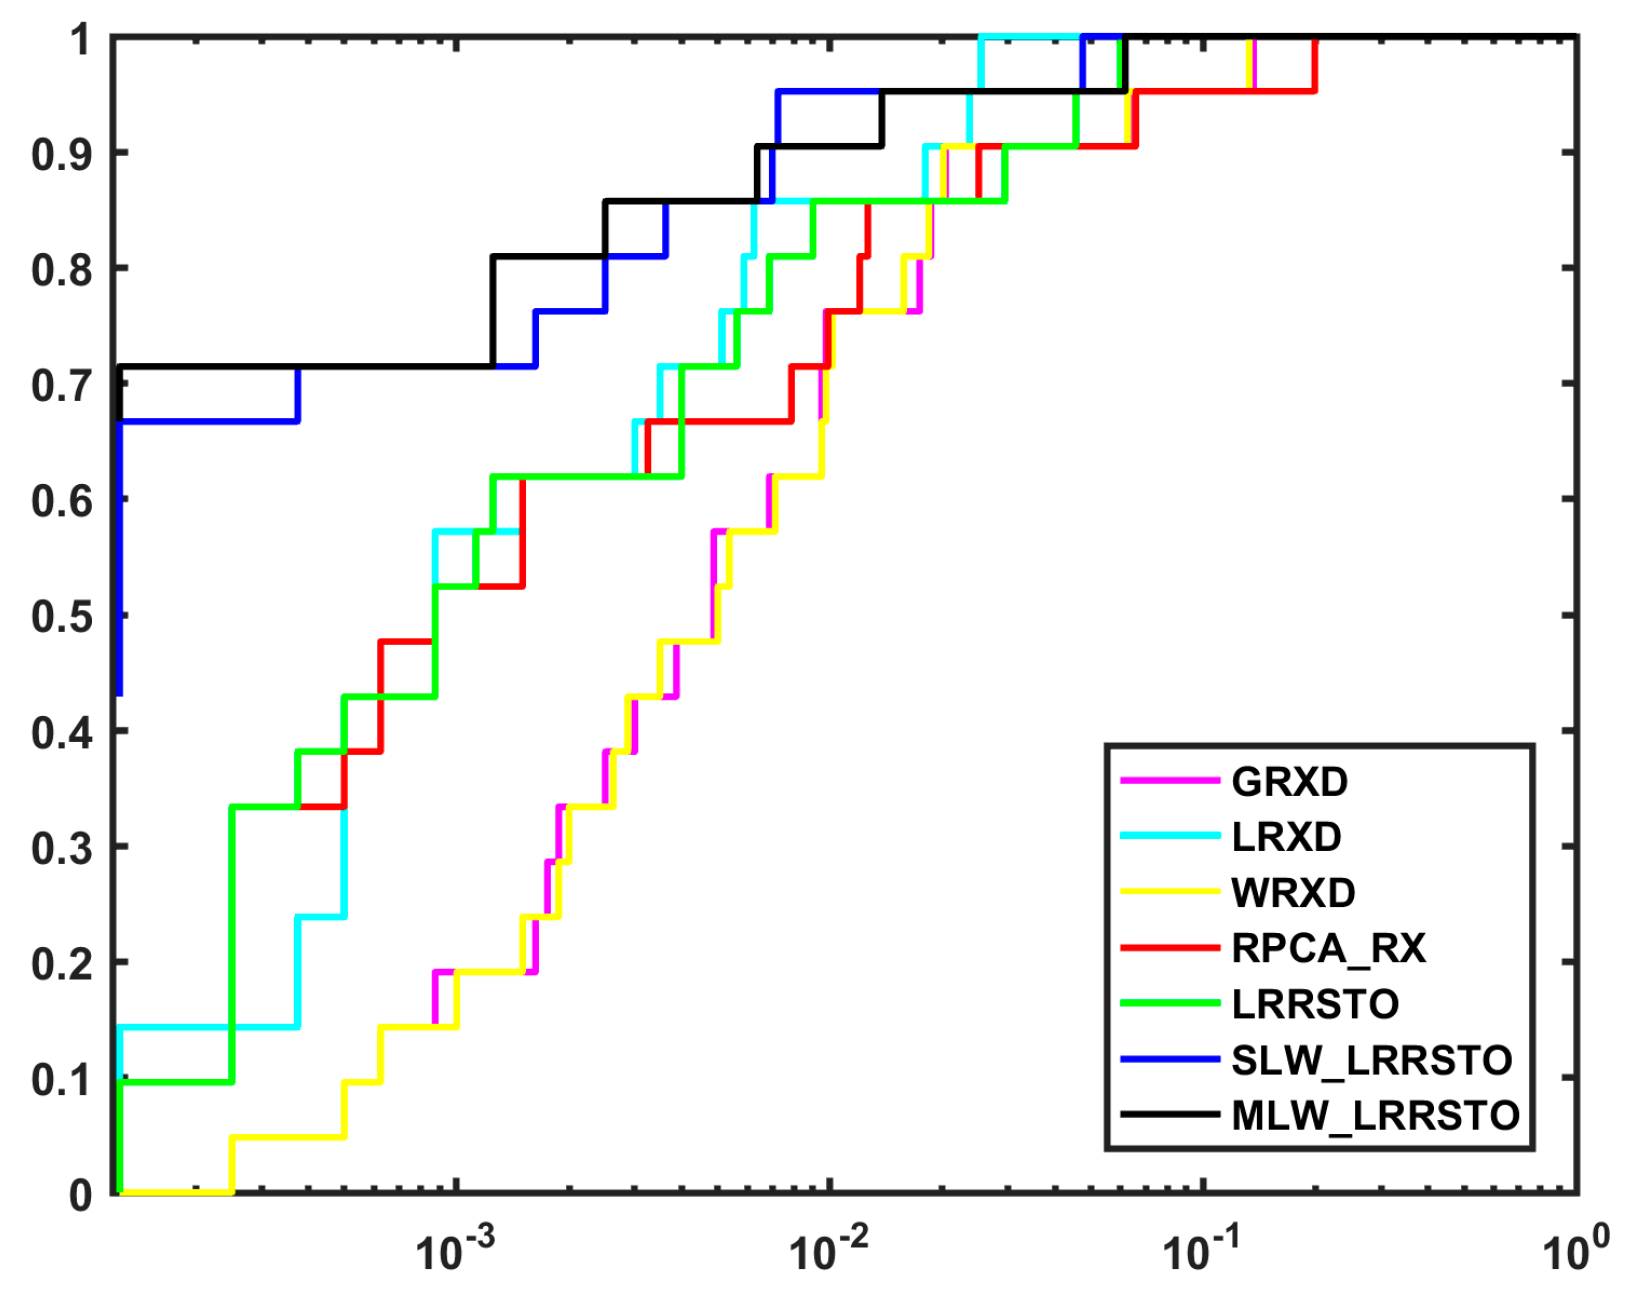
Figure 10.
ROC evaluation of the different methods for the AVIRIS_SanDiego dataset.
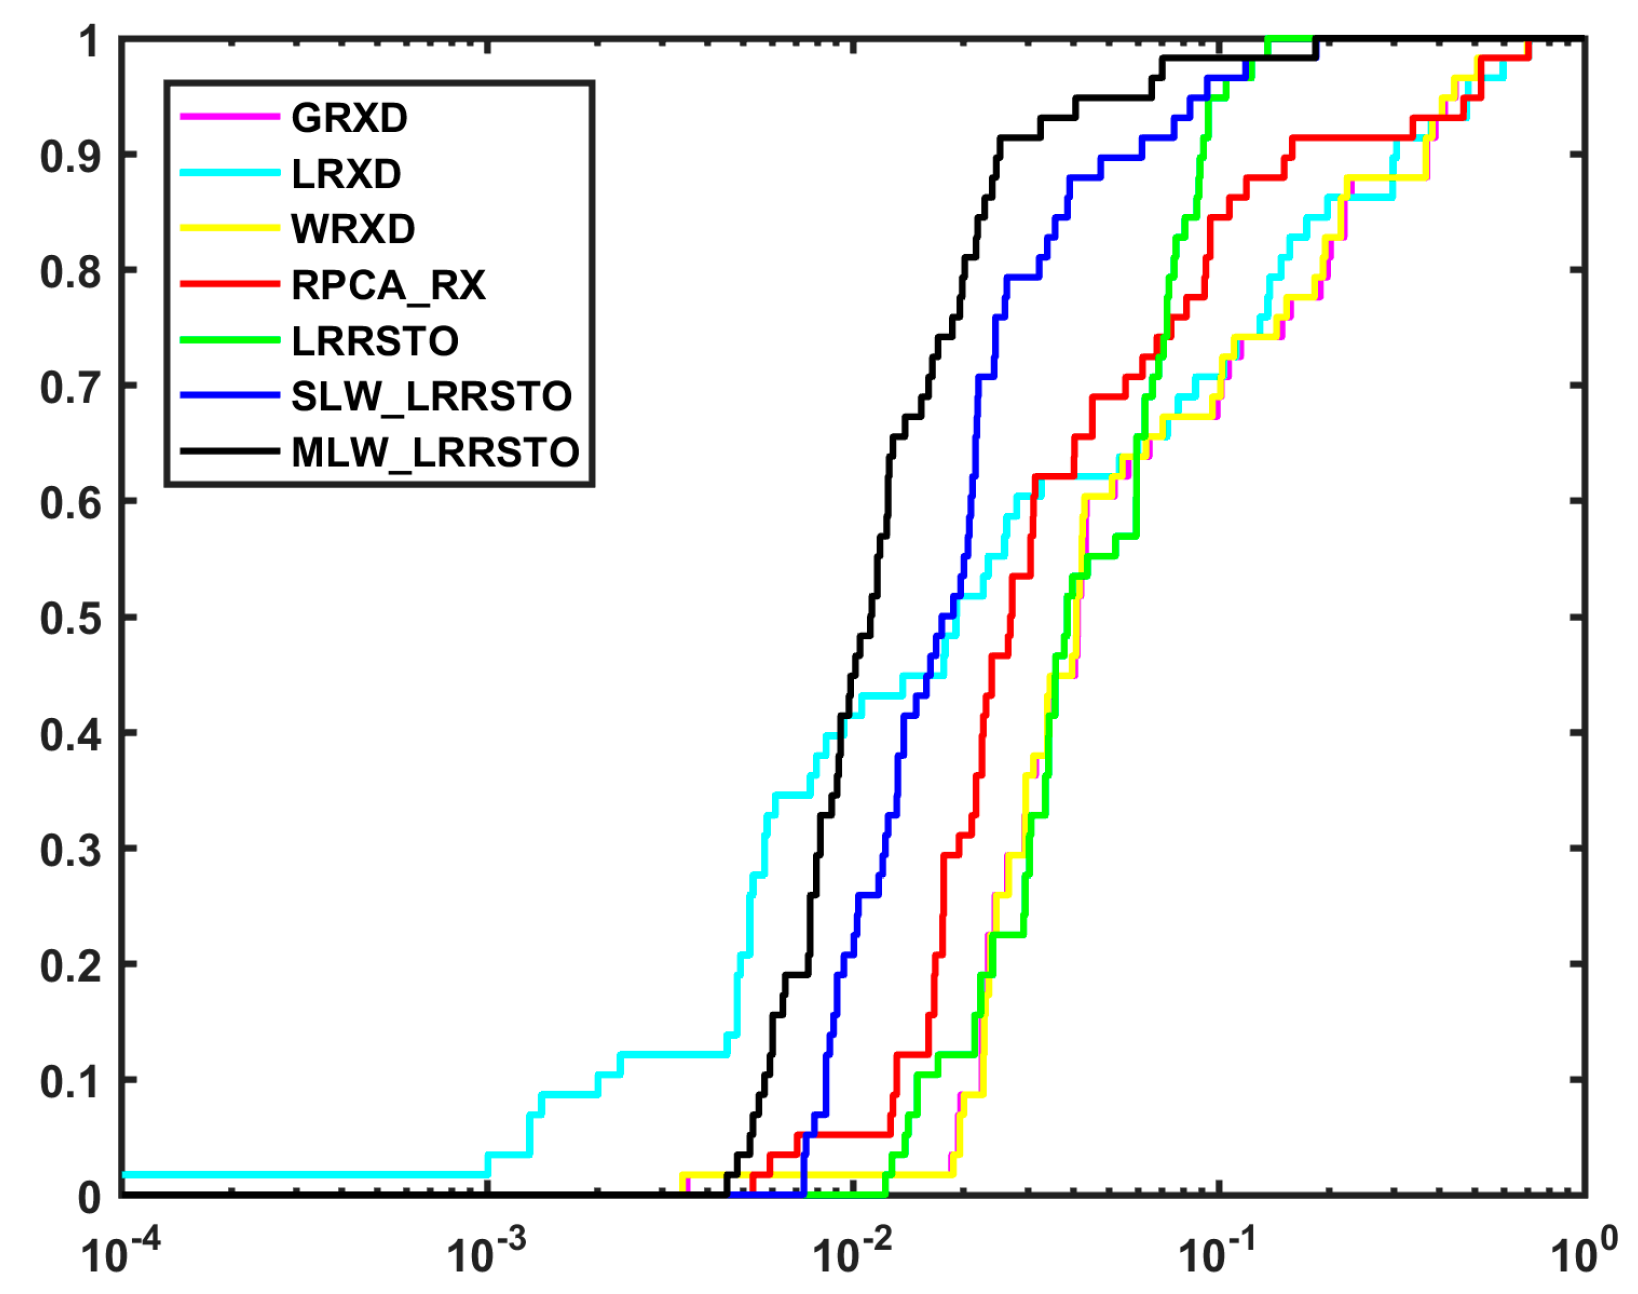
Figure 11.
ROC evaluation of the different methods for the Viareggio dataset.

Table 1.
Results with different parameters for the AVIRIS_Salinas data.
| λ | 0.0001 | 0.001 | 0.01 | 0.1 | 0.5 | 1 | 1.5 | 2 | |
| η | |||||||||
| 0.0001 | 0.9693 | 0.9606 | 0.9516 | 0.9623 | 0.9623 | 0.9622 | 0.9620 | 0.9617 | |
| 0.001 | 0.9694 | 0.9612 | 0.9517 | 0.9623 | 0.9623 | 0.9622 | 0.9620 | 0.9617 | |
| 0.01 | 0.9698 | 0.9666 | 0.9530 | 0.9625 | 0.9623 | 0.9623 | 0.9620 | 0.9618 | |
| 0.1 | 0.9476 | 0.9633 | 0.9640 | 0.9685 | 0.9635 | 0.9627 | 0.9623 | 0.9620 | |
| 0.5 | 0.9482 | 0.9482 | 0.9804 | 0.9774 | 0.9693 | 0.9661 | 0.9645 | 0.9636 | |
| 1 | 0.9486 | 0.9469 | 0.9783 | 0.9794 | 0.9737 | 0.9694 | 0.9673 | 0.9659 | |
| 1.5 | 0.9487 | 0.9463 | 0.9670 | 0.9801 | 0.9760 | 0.9718 | 0.9693 | 0.9677 | |
| 2 | 0.9487 | 0.9460 | 0.9624 | 0.9813 | 0.9777 | 0.9737 | 0.9710 | 0.9692 | |
Table 2.
Parameters of the different detection methods.
| Method | Parameters |
|---|---|
| GRXD | — |
| LRXD | (, ) |
| WRXD | — |
| RPCA_RX | |
| LRRSTO | |
| SLW_LRRSTO | |
| MLW_LRRSTO |
Table 3.
Area under the curve (AUC) values for the different detectors with the AVIRIS_Salinas dataset.
Table 3.
Area under the curve (AUC) values for the different detectors with the AVIRIS_Salinas dataset.
| Method | GRXD | LRXD | WRXD | RPCA_RX | LRRSTO | SLW_LRRSTO | MLW_LRRSTO |
|---|---|---|---|---|---|---|---|
| AUC | 0.8073 | 0.8306 | 0.8332 | 0.9619 | 0.9750 | 0.9840 | 0.9854 |
| Time/s | 0.12 | 77.81 | 0.45 | 10.03 | 45.38 | 37.67 | 72.74 |
Table 4.
AUC values for the different detectors with the HYDICE_urban dataset.
| Method | GRXD | LRXD | WRXD | RPCA_RX | LRRSTO | SLW_LRRSTO | MLW_LRRSTO |
|---|---|---|---|---|---|---|---|
| AUC | 0.9848 | 0.9953 | 0.9851 | 0.9837 | 0.9881 | 0.9964 | 0.9957 |
| Time/s | 0.06 | 25.48 | 0.21 | 2.34 | 18.43 | 17.72 | 36.78 |
Table 5.
AUC values for the different detectors with the AVIRIS_SanDiego dataset.
| Method | GRXD | LRXD | WRXD | RPCA_RX | LRRSTO | SLW_LRRSTO | MLW_LRRSTO |
|---|---|---|---|---|---|---|---|
| AUC | 0.8885 | 0.9041 | 0.8901 | 0.9190 | 0.9300 | 0.9621 | 0.9780 |
| Time/s | 0.08 | 42.95 | 0.27 | 3.75 | 25.68 | 24.83 | 50.37 |
Table 6.
AUC values for the different detectors with the Viareggio dataset.
| Method | GRXD | LRXD | WRXD | RPCA_RX | LRRSTO | SLW_LRRSTO | MLW_LRRSTO |
|---|---|---|---|---|---|---|---|
| AUC | 0.6884 | 0.7945 | 0.6908 | 0.5509 | 0.8825 | 0.9139 | 0.9172 |
| Time/s | 4.05 | 7153.51 | 13.43 | 863.73 | 1250.67 | 1936.92 | 3589.58 |
© 2019 by the authors. Licensee MDPI, Basel, Switzerland. This article is an open access article distributed under the terms and conditions of the Creative Commons Attribution (CC BY) license (http://creativecommons.org/licenses/by/4.0/).
Share and Cite
MDPI and ACS Style
Tan, K.; Hou, Z.; Ma, D.; Chen, Y.; Du, Q. Anomaly Detection in Hyperspectral Imagery Based on Low-Rank Representation Incorporating a Spatial Constraint. Remote Sens. 2019, 11, 1578. https://doi.org/10.3390/rs11131578
AMA Style
Tan K, Hou Z, Ma D, Chen Y, Du Q. Anomaly Detection in Hyperspectral Imagery Based on Low-Rank Representation Incorporating a Spatial Constraint. Remote Sensing. 2019; 11(13):1578. https://doi.org/10.3390/rs11131578
Chicago/Turabian StyleTan, Kun, Zengfu Hou, Donglei Ma, Yu Chen, and Qian Du. 2019. "Anomaly Detection in Hyperspectral Imagery Based on Low-Rank Representation Incorporating a Spatial Constraint" Remote Sensing 11, no. 13: 1578. https://doi.org/10.3390/rs11131578
Note that from the first issue of 2016, this journal uses article numbers instead of page numbers. See further details here.