1. Introduction
Soil properties play a key role in various processes related to continental surface hydrology, describing the distribution of rainwater or irrigation between runoff, seepage, and evapotranspiration [
1,
2,
3]. In this context, although ground measurements have long been used to estimate the water status or soil texture, they are time-consuming and costly procedures, and are generally considered to be inadequate, since they do not allow spatio-temporal variations in soil moisture to be correctly monitored. The scientific community has thus devoted considerable effort to the development of remote sensing products, in an effort to improve the accuracy and spatio-temporal coverage of these observations when they are interpreted for hydrological applications and water resource management [
4,
5,
6,
7,
8].
In recent years, remote sensing has been used to retrieve soil properties such as soil moisture, roughness, soil texture. Among these approaches, promising techniques such as spectroscopy in the visible (VIS) and near-infrared (NIR) spectroscopy have been used as proximal sensing techniques and enable the measurement of texture. Indeed, soil components are sensitive to these portions of the electromagnetic spectrum, which allow the assessment of soil textural composition [
9]. Curcio et al. [
10] have predicted soil texture (sand, clay, and silt) using VNIR-SWIR band reflectance spectroscopy. High resulting accuracies were found for both of clay, sand silt fraction, using the partial least-squares regression (PLSR) methods with coefficients of determination of 0.87, 0.8 and 0.6, respectively. Tümsavaş et al. [
11] used the VIS-NIR spectroscopy to predict and map sand and clay fraction over agricultural fields with a regression coefficient of 0.9 and 0.91, respectively.
Since 2014, Sentinel-1 radar data has been available over Europe and other regions of the globe, with a 6-day repeat cycle and both high and fine spatial resolution (ranging between 5 and 40 m, depending on the acquisition mode and the product type). Various algorithms have been developed for the generation of operational soil moisture products, in particular for agricultural areas. The present authors have computed soil moisture products over agricultural fields with a vegetation cover, using a synergetic combination of optical and radar data, through the use of neural networks, a change detection and the simple inversion of a backscattering model [
12,
13,
14,
15].
Soil texture is a key parameter in the development of PedoTransfer Functions (PTFs), which are based on soil properties (physical, chemical and biological), and are often used to estimate difficult-to-measure hydraulic soil properties. In particular, clay content has a strong influence on the hydraulic properties of soils, and can be interpreted in terms of the soil’s water-holding capacity. Several studies have been proposed for the estimation of soil texture components, using remotely sensed optical images. These techniques rely mainly on optical data and the interpretation of ground reflectance to determine soil color [
16,
17,
18].
More recently, several techniques have been developed for the interpretation of various types of optical satellite observation (Landsat, SPOT, Sentinel-2, etc.) [
19,
20,
21,
22,
23,
24,
25]. These are restricted mainly to the analysis of bare soils, since the observation of fields with a vegetation cover can be affected by the noise produced by canopies. For instance, Shabou et al. [
26] proposed a method for clay content estimations, based on the mid-infrared index (MID) derived from the TM 5 and TM 7 bands of Landsat data, recorded over central Tunisia. Vaudour et al. [
27] recently predicted several topsoil properties (clay, SOC, iron, pH, etc.) from a chemometric model, using Sentinel-2 spectral band observations. Their clay content predictions are correlated with in situ measurements, with a coefficient of determination (R
2) equal to 0.39 and 0.42 for the Versailles Plain and the La Peyne Valley (France), respectively. Gomez et al. [
21] investigated the clay content sensitivity associated with various different spectral configurations, for the Sentinel-2, ASTER, Landsat-8 OLI and Landsat-7 ETM+ satellites, and used PLSR models with this multi-sensor data. Radar remote sensing, which is generally used to estimate soil moisture and soil roughness, has also been evaluated for its ability to perform texture measurements. Zribi et al. [
28] proposed the estimation of soil moisture from TerraSAR-X radar data following a rain event, and were able to relate the drying speed of the surface moisture to the clay content, which was determined with an accuracy of 12%. Gorrab et al. [
29] used a linear regression relationship between soil moisture products (derived from TerraSAR-X radar data), and clay content, which was estimated with a Root Mean Square Error (RMSE) of 108 g/kg.
In this context, the aim of the present study is to make use of multi-sensor data derived from the Sentinel-1 and Sentinel-2 satellites, to evaluate different optical and radar indicators for soil clay content estimations. This analysis is based on field and satellite measurements acquired over the Kairouan Plain, in central Tunisia. We analyze the sensitivity of several indicators to soil texture, and make use of the RF and SVM algorithms to determine clay content classifications.
This paper has four main sections.
Section 2 describes the study site, the database, and the methodologies used for clay content mapping, based on two classification algorithms (support vector machine and random forest). The results and discussion are presented in
Section 3 and
Section 4, and the conclusions in
Section 5.
2. Materials and Methods
2.1. Study Site
The study site is located on the Kairouan Plain which covers a surface area in the eastern portion of the Tunisian Atlas (centered on 9°53′57″E and 35°4′51″N). This area has a semi-arid climate and mean annual precipitation of 300 mm [
30]. The landscape is mainly flat. The principal land cover categories are agricultural fields, urban areas, salt flats, water bodies and some low-lying mountains located in the West. The economy of the Kairouan Plain is based on the agricultural sector, in which the dominant crops are mainly olive groves and winter crops [
12]. Due to severely limited water resources in the region (annual rainfall of 300 mm and a high rate of evaporation), the management of these resources is essential.
The soils found on the study site are formed mainly by alluvial deposits, with clay and coarse sand formations, and are characterized by a high spatial variability of their texture. The main soil units are poor soils, complex soils (several soil units), calcimagnetic soils and isohumic soils [
26]. In this context, the extreme floods of 1969 led to strong spatial heterogeneities in terms of soil texture, as they deposited sandy to sand loamy materials in the upstream and downstream sectors. They also carried large quantities of alluvia which, together with the natural deposit mechanism, changed the spatial distribution of these deposits [
31]. Indeed, the thrust of the deposit along the major bed of the wadi, when it overflows, leads to a distribution with the coarsest components remaining upstream whereas the finest alluvia are carried downstream.
On the other hand, the introduction of crop systems and fields has led to cyclical evolutions of the surface conditions and land use over the time. Tillage and farming operations can thus modify the physical characteristics of the soil, resulting in changes in its surface texture.
2.2. Ground Texture Measurements
During the autumn of 2017, a texture measurement campaign was carried out over 33 bare soil fields, characterized by a large range of soil textures. For each reference field, 5 to 10 ground sample were collected inside a 30 m diameter circle from the upper soil layer (a depth of 5 cm) based on visual assessment of topsoil textural changes. To reduce the risk of bias and to ensure a uniform distribution of the samples, they were selected randomly for each reference field.
Sieve analyses were used to classify the particles smaller than 2 mm in samples as being clay, silt, or sand. The laboratory technique was based on the international “Robinson” pipette method. Firstly, the experiment relies on the destruction of organic matter by hydrogen peroxide. A dispersing solution of sodium hexametaphosphate is then added to neutralize the flocculating action. After stirring, the fine fractions, silt and clay, are separated by sedimentation. The removal of the latter is based on the relationship, linking the sedimentation time to the particle diameter, given by the Stocks’ law which describes the settling velocity of particles in a suspension as function of the sedimentation rate. A small volume of the suspension is taken with a Robinson pipette, from which the solid residue will be weighed after evaporation of the liquid. Coarse fractions and coarse and fine sands are separated by sieving.
Soil texture is defined as the distribution of the soil’s constituent mineral particles, classified by size. According to the USDA (United States Department of Agriculture) classification, particles smaller than 2 µm in diameter are classed as clay, particles with a diameter between 2 and 50 µm are classed as silt, and particles with a diameter between 0.05 and 2 mm are classed as sand.
From the samples taken during the ground campaign, the measured clay content ranked between 12.7% and 58%, and the sand content between 2% and 73%. The results from the fields analyzed during this campaign are plotted on the soil texture triangle shown in
Figure 1. Three dominant soil classes can be distinguished: clay soil, clay loamy soil as a continuous distribution between sandy loam, and sandy clay loam soil. The samples were ranked according to three main classes, depending on their soil clay fraction. The first class corresponds to soils with low clay content (between 13 and 30%), the second class corresponds to clay content values between 30% and 45%, and the third class is used to identify soils with high values of clay content (between 45% and 60%).
2.3. Satellite Data
2.3.1. Sentinel-1 Data
The Sentinel-1A (S-1A) and Sentinel-1B (S-1B) satellites were launched in April 2014 and April 2016, as part of the “Copernicus“ program, for the observation and monitoring of Earth’s surface, and the development of operational applications for environmental monitoring. The Synthetic Aperture Radars (SARs) carried by these satellites are indifferent to weather conditions and allow data acquisition day and night, in the form of single and dual polarization images (VV, VH, HH, and HV). C-band data (wavelength ~ 6 cm) in the form of Interferometric Wide (IW) swath images, acquired by the Sentinel-1 (S-1) constellation between September and early December 2017, was used for this study in the VV polarization. Fourteen S-1A and S-1B images were thus downloaded from the Copernicus web site (
https://scihub.copernicus.eu/dhus/#/home) in the form of Level-1 Ground Range Detected (GRD) products, with a spatial resolution of 10 m and a six-day periodicity (
Table 1). In the case of the S-1 images, the study site was imaged at an incidence angle (θ) of approximately 39°. To extract the backscattering coefficient, several processing steps were performed on each image comprising thermal noise removal, radiometric calibration, geometric correction and speckle filtering [
32].
2.3.2. Sentinel-2 Data
Sentinel-2A (S-2A) is a spaceborne spectral imager, which was launched by the European Space Agency (ESA) in June 2015 as part of the “Copernicus” program. It is accompanied by Sentinel-2B (S-2B), launched in March 2017, which allows a repeat cycle of 5 days to be achieved using both satellites. This constellation takes images in 13 spectral bands, at visible and mid-infrared wavelengths and at various spatial resolutions (10, 20, 60 m), as shown in
Table 2.
Eight cloud-free S-2 images acquired between July and August 2017, were used for the present study. These optical images were obtained from the THEIA website at the French Land Data Center (
https://www.theia-land.fr/), which provides data in the level-2A format, including radiometric and atmospheric corrections, based on the method developed by Hagolle et al. [
33].
In this study, bands 4 (B4), 8 (B8), 9 (B9), 11 (B11) and 12 (B12) are used to generate the soil and vegetation indices presented in
Section 3.1.
To retrieve bare soil areas and produce soil moisture maps, normalized difference vegetation index (NDVI) maps were derived from the optical images, using B4 and B8. The NDVI pixel values within each reference field were averaged, to characterize the vegetation conditions of that field. Consequently, an NDVI threshold value of 0.25 was used to retain only bare soils. The use of NDVI highlights the difference between crop and soil.
2.3.3. Derived Soil Moisture Products
Soil moisture maps were produced at a high spatial resolution, by combining SAR and optical images derived from the S-1 and S-2 constellations, respectively. Backscattering models have been used to retrieve soil moisture over different period. Combined models were used to invert the radar signals for soil moisture estimation: The Water Cloud Model (WCM) [
34] and Integral Equation Model (IEM) [
35], using a Neural Network technique. The WCM has been used for area covered by the vegetation, while the IEM for bare soils. Both coupled models have considered soil moisture and roughness as soil parameters and vegetation indicator (e.g., vegetation height, biomass, LAI, etc.) derived from optical images. In this study, the NDVI was used to describe the vegetation cover, derived from the red (R) and near infrared (NIR) bands of S-2 images.
These models have been calibrated and validated in previous studies [
8,
12,
32,
36], over different study sites. The backscattering coefficient is modeled as the sum of the soil and vegetation contributions. It is then inverted to estimate soil moisture over the study site. Bousbih et al. [
12] and El Hajj et al. [
14] have shown that the soil moisture can be estimated with an accuracy of 6% vol. over agricultural fields. The 14 images were thus used to produce soil moisture maps, which were averaged over the period of acquisition.
Figure 2 shows an example of soil moisture map from 14 of September 2017 with the masked area, presented in white color and corresponding to urban areas, water bodies, and some reliefs. Both maps, presented in the upper right corner of the figure, display two different case of soil moisture. The first one (with green colors) correspond to a wet date (01/12/2017) and the second one (with red colors) to a dry date (20/09/2017).
2.4. Classifier Algorithms
Several classification methods have already been applied to texture mapping over agricultural fields [
37,
38,
39]. With these methods, in addition to the selected feature vector, a set of data samples is associated with different class labels. This set is called the training dataset, and is used to estimate the parameters associated with each classifier. The point-based classification used with the SVM is adopted.
SVMs were selected because a simple feature vector can be used as input for the discrimination task. In parallel, the random forest (RF) classifier was trained to compare the soil texture classifications obtained using these two techniques, which are presented in more details in the following sub-sections.
2.4.1. Support Vector Machine
The support vector machine (SVM, also known as a support vector network) has been widely used in the context of remote sensing classification applications. The classifier tries to determine a hyperplane (a decision boundary) that can provide optimal separation between two sets of data, while maximizing the margin between these two sets. The margin is then defined by the minimum distance between a training sample and the decision boundary (the distance between the two samples, which are closest to the hyperplane).
Under these conditions, an SVM is a binary classifier, as it is generally used to separate data points into one or the other of two distinct classes. As the data may not always be linearly separable, the training data can in some cases contain more than two classes. To extend the SVM to a multiclass classification algorithm, by breaking it down into a predefined series of binary problems [
40,
41], two main strategies have been developed which are: One-against-one [
42] and One-against-all [
43].
In cases where the data are not linearly separable, a non-linear transformation is applied to the input data, using a kernel function. Various kernel functions have been proposed, of which the most commonly used are the Gaussian and radial basis function (RBF) kernels. The regularization parameter C for the kernel functions must be tuned. In the present study, a Gaussian radial basis function (SVM-RBF) was chosen.
The major strength of SVMs is their kernel function: through the selection of an appropriate kernel function, any complex problem can be solved. The main disadvantage of the SVM classification technique is that it has a high cost in terms of computing time compared to other classification algorithms such as RF classifier [
44,
45]. It is also difficult to set the critical parameters, for which cross-validation optimization can be needed [
36].
2.4.2. Random Forests
A RF classification algorithm is based on the construction of several decision trees, by (randomly) selecting just one subset among all available samples (the Forest). Each tree votes for a class, and the majority vote determines the final class. This means that RF is an improved version of the Decision Tree classification. This technique has also been widely used in the context of remote sensing classifications, where it has been applied to multispectral data, multitemporal images, and SAR and optical data.
The method adopted in the present study was proposed by Breiman [
46]. In its most classical form, it uses a randomly built multiple decision tree, with training on different subsets of data. Specifically, each tree of the RF is trained on a random subset of data (called features). The RF algorithm is known to be one of the most efficient classifiers, and has been widely reported in remote sensing literature in recent decades. This algorithm has been used for various applications, including the analysis and classification of soil texture and land use in the agricultural sector.
The development of a RF classifier involves the construction of Classification And Regression Trees (CART) from the samples. A subset of input features (also called attributes) is randomly selected to form a set of predictor variables. Each tree is built by performing an individual learning algorithm that splits the set of input variables into subsets, based on an attribute value test. For the classification, each tree gives a unit of vote for the most popular class in each instance. A majority vote of all the trees determines the final label.
The RF classifier has three important parameters affecting its performance: the number of trees (K) (typically, the greater the number of trees, the better the accuracy), the maximum depth of the tree (a tree cannot have a depth exceeding 25), and the minimum number of samples in each node.
The computational complexity of a RF is reduced by limiting the number of features it has. The split RF process is repeated on each derived subset, until the score contains very similar samples, or the splitting no longer adds value to the predictions. For implementation purposes, it is indeed unlikely that the RF reaches this maximum depth. During the decision phase, each tree classifies the input feature data. Then, the RF outputs the class label that has received the majority vote. In the case of a RF, the parameters have a very weak influence on the results of the classifications. In the present study, the parameters were set as shown in
Table 3.
One of the great strengths of a RF is its ability to determine the information that is useful in each of the features. RFs are also extremely flexible and highly accurate. The RF classifier has the highest efficiency in terms of the accuracy it can achieve with a large volume of data, for a given computer processing time. In practice, RF runtimes are quite fast, when compared to SVM classifiers. The main weakness of RFs is their complexity. They require a large number of features and training samples, and data over-fitting can easily occur [
44,
45].
2.4.3. Evaluation
The aim of this section is to compare two approaches, using two different classifiers (RF and SVM) with their parameterization.
The classifier test should be valid, and should demonstrate the classifier’s performance under conditions as close as possible to the production environment. The results obtained are averaged over three random, uniformly distributed trials, from the training and validation samples. This approach ensures that the results are not influenced by any specific split between the training and validation samples. Optimization of the two classifiers is performed using three-fold cross-validation. The basic idea of this validation is to divide the training dataset into 3 subsets of equal size, with the ratios 2/3 and 1/3 being used for the training and validation sets, respectively. For each two subsets, the classifier is trained, and the remaining subset is used for validation.
As shown in
Figure 3, the database is split into separate 3 sets. The classifier is trained and validated 3 times. Finally, the results are collected from each cross-validation run, for statistical analysis, and the predictions are compared. The training and the validation steps are then applied on the whole database. As with any supervised classification, validation is an essential step when evaluating the quality of the classification results, and is performed by comparing the classified data with the reference data (ground-truth measurements). This comparison is often expressed by means of a confusion matrix, which facilitates the understanding of the results, and provides detailed information concerning the effects of incorrect predictions.
The confusion matrix is represented by a square array, whose columns correspond to the predicted values, according to the classification, and whose rows represent the reference data. The correctly classified pixels’ numbers in each class are represented in the matrix diagonal, whereas the elements lying outside the diagonal correspond to confusions. Two main indices are then computed from the matrix, to evaluate its classification:
- -
The overall accuracy, which is the ratio of the well-ranked pixels to the total number of validation pixels. This index varies between 0 (no pixel correctly classified) and 1 (100% of pixels are well classified)
- -
The Kappa coefficient (Kc) is a measure of the accuracy, which takes into account positive results that occur at random. The quality of the classification is assessed according to the value of this coefficient, which can vary over the range between -1 (very poor) and 1 (excellent).
To evaluate the influence of the class label, using RF and SVM, the OA and Kc are computed from each confusion matrix, over a set of different simulations.
3. Results
3.1. Satellite Data Sensitivity to Soil Texture
3.1.1. Sentinel-2 Sensitivity Analysis
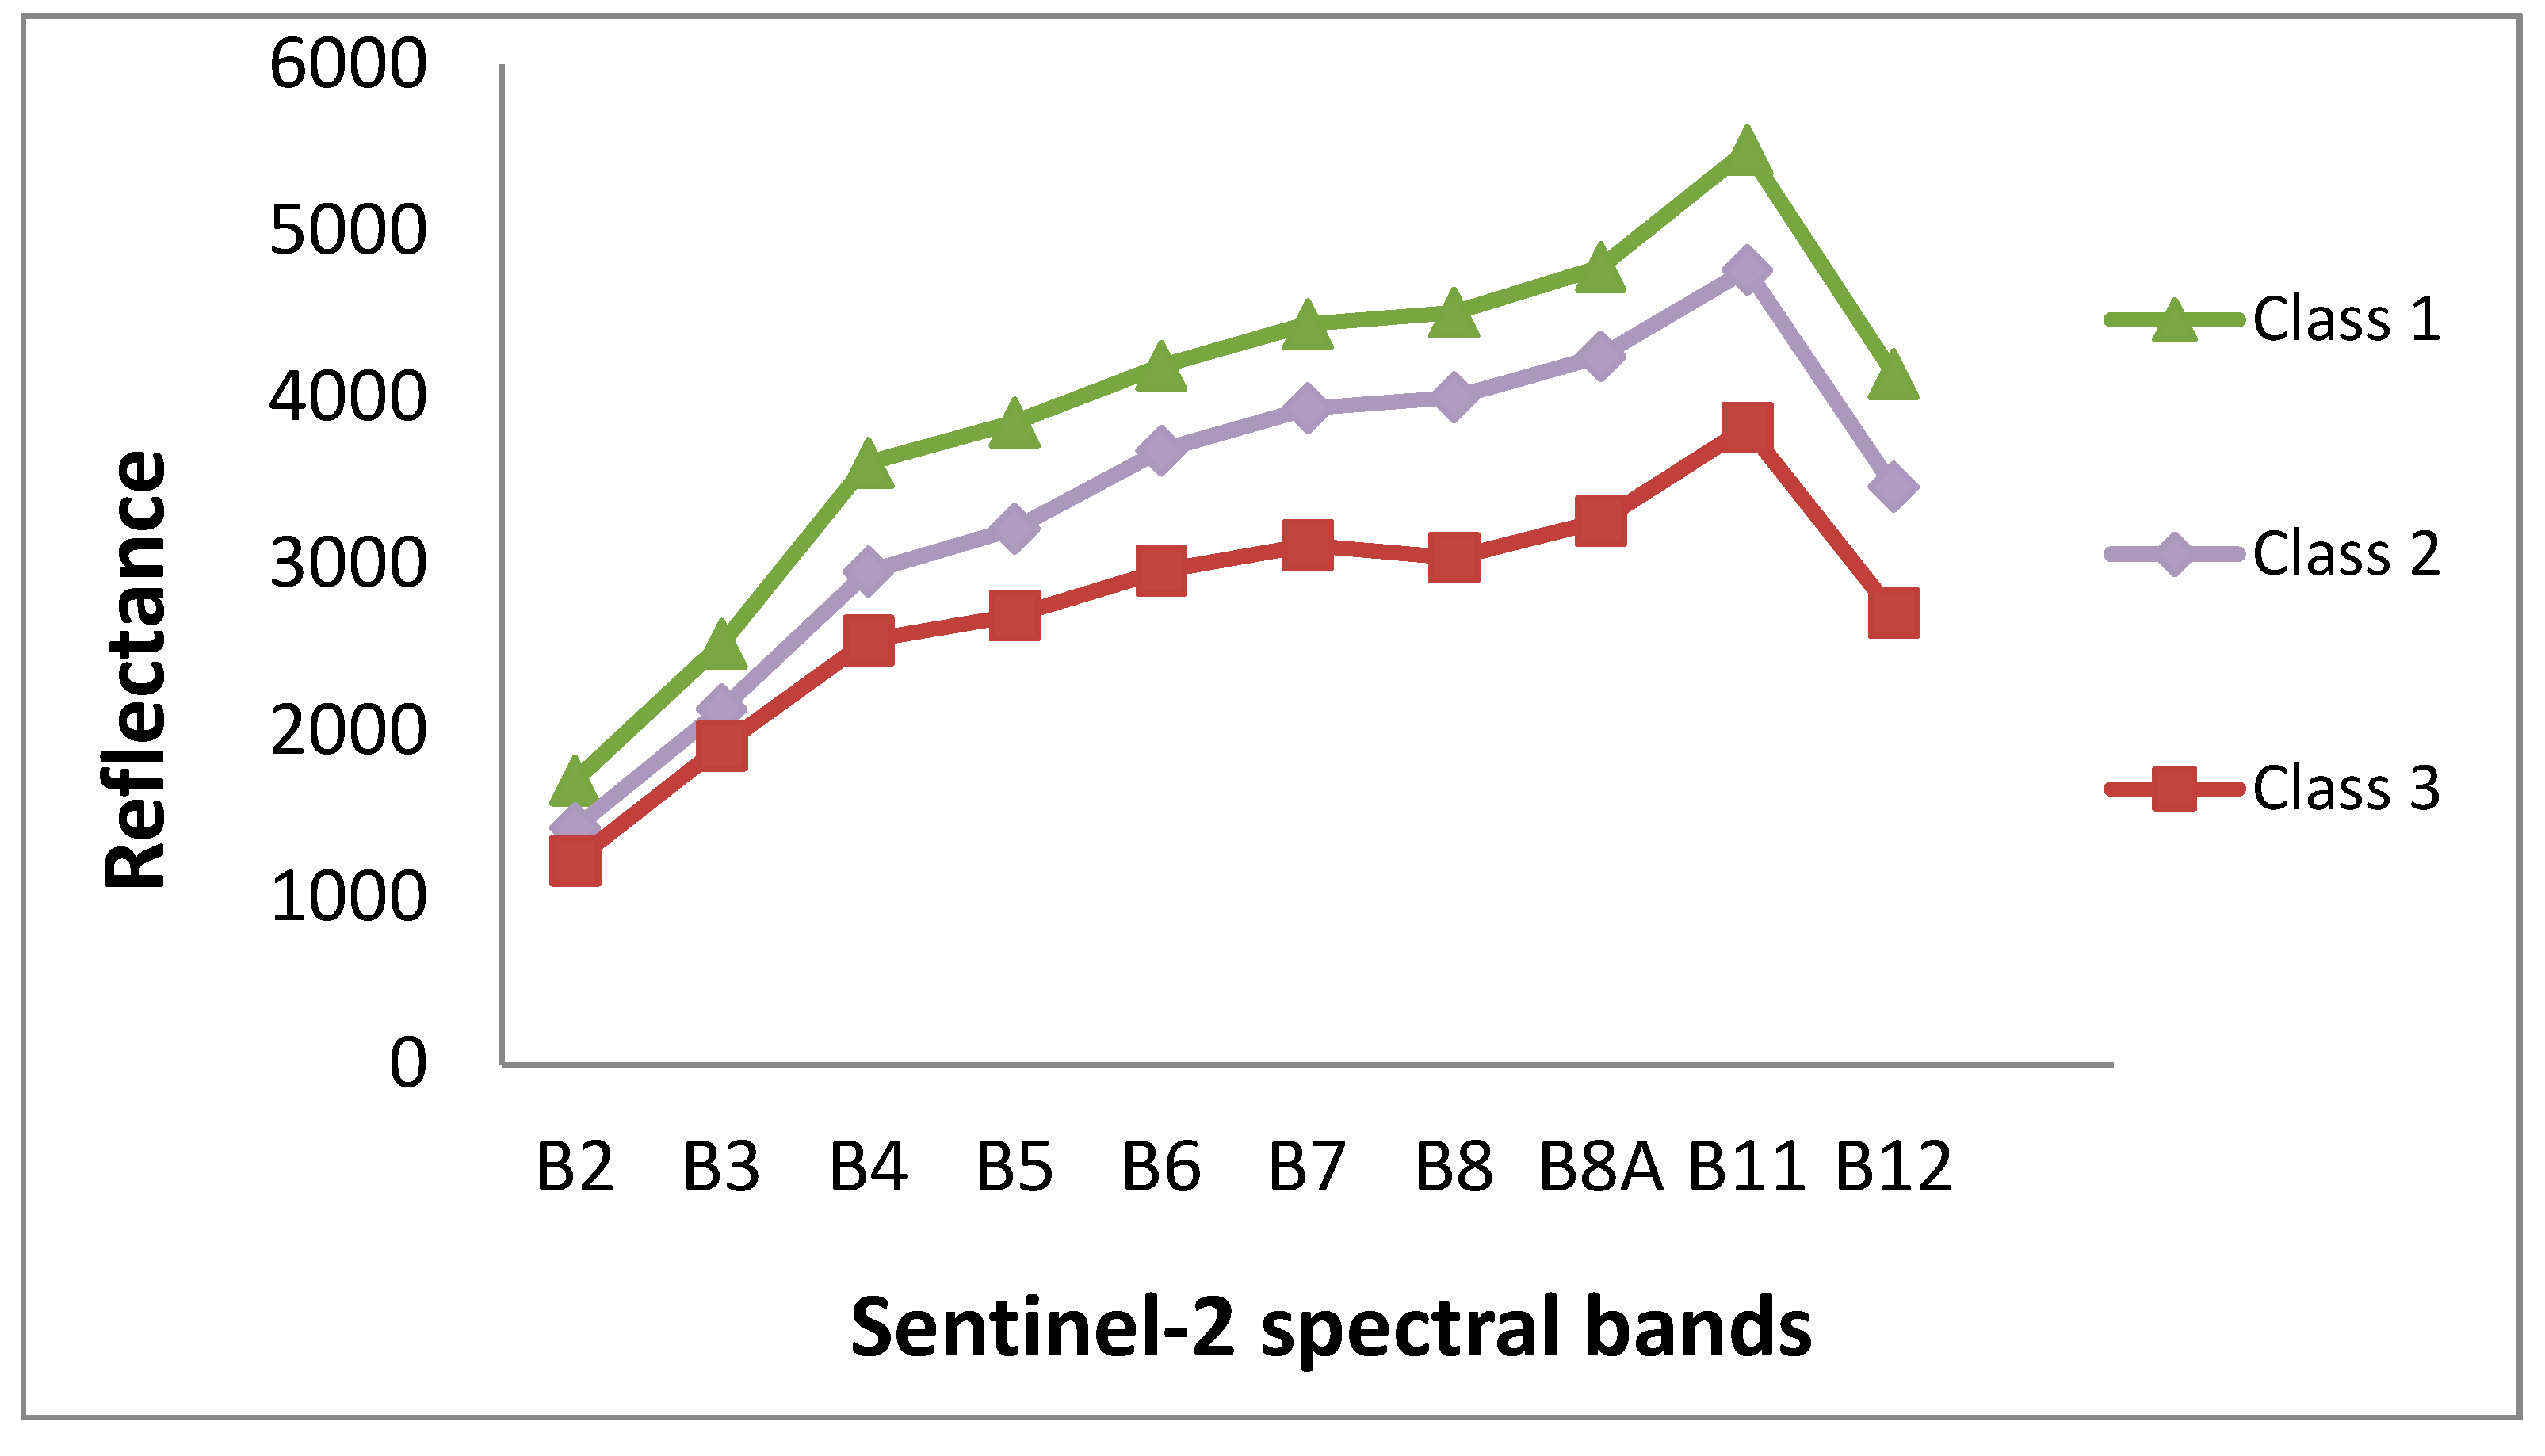
Clay minerals and carbonates have characteristic absorption bands in the SWIR [
47], which correspond to bands 11 and 12 of the S-2 satellite.
Figure 4 plots the reflectance of the S-2 bands over three classes of soil observed in the study area from ground soil measurements (with soil clay contents lying in one of the following 3 ranges: Class 1 for 15% to 30%; Class 2 for 30% to 45% and Class 3 for 45% to 60%). For each class, we compute the mean value of the measurements recorded over the reference fields.
The optical data selected for sensitivity analysis was recorded in the summer (July–August 2017) over bare soils only. The summer period was considered to be the best suited to these observations, as it is well separated from the end of the winter cereal production season, with no vegetation, during the autumn period. For many fields, this period can be extended from July to October. For this reason, only those crops with an NDVI lower than 0.25 were selected. As this takes place more than four weeks after wheat harvesting, there are no crop residues remaining on the surface of the fields, we are rather in a context of low presence of straw, indeed this effect could appear in early July. Moreover, surface spectral data are also generally affected by the confounding effects of soil moisture and soil roughness. For instance, some colored soils, revealed by optical data, could be explained by high roughness dating from later summer plowing.
The summer period, which is the driest in the year, also has the advantage of minimizing reflectance noise that can be produced by changes in soil moisture, following rainfall events.
The soil reflectances derived for the spectral bands observed by Sentinel-2 are compared, as shown in
Figure 4, in order to determine those, which are the most sensitive to soil texture: the B11 and B12 bands can be seen to have the highest sensitivity to variations in clay content. The reduced reflectance at 2190 nm (B12) may be caused by a loss of crystallinity in clayey minerals.
This analysis was repeated on eight different dates, between July and August. Bands B11 and B12 are found to have similar linear regressions, and nearly identical values of R2, and the reflectance in these two bands can be seen to decrease when the clay content increases.
Table 4 lists the coefficients of determination computed between clay content and reflectance in these two bands, for each date of observation, showing that the observations with the highest coefficients of determination (close to 0.4) were made on 4 August 2017 (
Figure 5), and the lowest
P-value which shows a statistically significant correlation. The lowest correlation was observed for the month of July with the lowed coefficient of determination (under 0.35) and almost highest
P-value. The observations made on this date were thus selected, for the computation of all soil indices, as described in the following sections.
3.1.2. Optical Indices and Sensitivity Analysis
For the purposes of soil texture analysis, two soil-related indices were also tested, using the data recorded in certain S-2 bands, in an attempt to distinguish between different textural classes. These indices are described as follows:
Simple ratio Clay Index (SRCI)
The SRCI is defined as the reflectance ratio of two SWIR bands, namely B11 (SWIR 1) and B12 (SWIR 2), derived from S-2 images [
48,
49]. It is expressed as:
The SRCI was computed for the images recorded on 04/08/2017 (the driest day, and the date on which bands B11 and B12 had their highest sensitive to clay content). Although the overall trend is for the SRCI to decrease with increasing clay content, these variables are not strongly correlated, with R
2 equal to just 0.19 (
Figure 6).
Brightness Index (BI)
The BI [
50] combines information from the Red and Near-Infrared bands, represented by bands B4 and B9, respectively, in the case of S-2 data. This index provides an indication of changes in the average level of reflectance. The BI is used to assess whether an observed surface is bright or dark, and is often used for the mapping of soil characteristics, such as roughness, texture, salinity, and moisture [
51,
52,
53,
54].
Dry soils with low clay content tend to be strongly reflective, whereas dark soils have low radiometric values in both bands, due to their high clay content. The BI is expressed as
where
R and
NIR are the red and near infrared bands, respectively
Although the BI is used to distinguish between bright and dark zones, which in principle correspond to sandy and clayey soils, respectively,
Figure 7 shows that in the case of the present study, this index does not provide a clear separation between these classes of soil. The low value of R
2 shown in this figure is partly due to confusion between plowed and clay soils.
3.1.3. Analysis of the Sensitivity of Soil Moisture to Clay and Sand Content
Soil texture is a function of its constituent clay, silt, and sand fractions, and can be strongly affected by water retention and infiltration. Conversely, soil moisture is strongly influenced by the texture of the soil—sandy soils have a porous texture that acts as a filter, allowing water to percolate. Although this soil type is common towards the North-East of the Kairouan Plain, the loamy clay soils dominating the study area retain rain and irrigation water more readily, thanks to their compact texture. This type of soil thus dries more slowly than sandy soil, and can remain wet for several days.
The method applied for this analysis involves the monitoring of dynamic changes in the soil moisture profile (directly related to rainfall events), and relies on the observation of a relationship between the soil’s mean level of moisture and its texture (clay and sand contents). For this analysis, 14 soil moisture maps were derived from radar and optical data.
As soil moisture levels are generally higher for clay soils (slow drying) than for sandy soils (fast drying), we analyzed data recorded during the autumn, between September and December, since this corresponds to a period characterized by relatively strong precipitation events on the Kairouan Plain. The period following the month of December is less suitable for this analysis, as it corresponds to the beginning of the agricultural season for most crops, and is generally accompanied by irrigation, which could affect the soil’s natural drying regime. The
Figure 8a,b represent soil moisture mean values derived from the soil moisture maps retrieved the neural networks algorithm based on the inversion of the backscattering models (WCM and IEM, as function of the clay content from the ground measurements. As shown in the figures, the relationship between soil moisture and clay or sand content is linear in both cases: the mean moisture content clearly increases with increasing clay fraction (R
2 = 0.54), and decreases with increasing sand content (R
2 = 0.43).
3.2. Classification Scheme
Four indicators were used to estimate the soil clay content: S-2 images in two different SWIR bands (B11 and B12), the temporal average of soil moisture, and a combination of SWIR data and soil moisture. From the sensitivity analysis, the reflectance indicators derived from optical band data (B11 and B12) are found to be more sensitive to soil clay content than the optical indices (SRCI and BI) computed from the S-2 images. As shown in
Section 3.1.1, B11 and B12 provide the best sensitivity, with an R
2 equal to approximately 0.4. For this reason, only the optical SWIR bands were selected for the classification process. The classification workflow used to determine the clay content distribution over the study site is shown in
Figure 9.
3.3. Validation and Clay Fraction Mapping
A three-fold cross-validation procedure is used to obtain predictions from the different classifiers (SVM and RF) and the different indicators.
Table 5 lists the results obtained from the confusion matrices with these simulations. Low accuracies are obtained with optical data in the B11 and B12 bands, with an OA of 0.41 and an Kc of 0.15. On the other hand, the soil moisture indicator produces good results, with an OA as high as 0.65 obtained with the RF algorithm. The results obtained with optical data (bands B11 and B12) are clearly enhanced when they are combined with the soil moisture indicator, and the RF is found to be a more robust classifier than the SVM, for all of the simulations carried out during this study.
The clay maps generated by both algorithms are shown in
Figure 10. All non-agricultural areas (urban areas, reliefs, water bodies) have been masked in these maps, using a GIS (Geographic Information Systems) shape file. Three classes of clay content are presented according to the following partition: Class 1: clay content between 15% and 30%, Class 2: clay content between 30% and 45%, and Class 3: clay content between 45% and 60%. These two maps are very similar in appearance, showing the same distribution of soil texture across the region. The third class, representing the highest value of clay content, can be seen to dominate the entire area, and to be strongly present at the center of this site, where irrigated and winter/summer vegetables are cultivated. Sandy soils are present mainly in the south-western portion of the site, where olive orchards are widely cultivated.
Table 6 and
Table 7 present the confusion matrices for each clay map. These matrices compare the classes predicted by the models with the reference classes. As shown in
Table 5, the random forest algorithm performs better than the SVM, with an OA equal to 0.63 for the SVM classification, and 0.65 for the RF classification.
4. Discussion
Information on the variability of soil properties leads to an increased ability for agronomic management implications. In particular, soil texture is a key agro-ecosystem variable, for a full knowledge of fertility and water-holding capacity of the soils. For instance, the knowledge of soil texture variability is central for the implementation of farming management strategies that allow for a more efficient use of resources, such as water and fertilizers; therefore, reducing costs and environmental impact.
Due to a difficulty of estimation soil fraction, the results of this study illustrate the potential advantages of using combined optical and radar data for soil texture monitoring. These results are within expected ranges of variability compared to those obtained using optical data.
In the context of our study site, the use of optical data only (corresponding to the texture analysis technique generally reported in the literature) leads to a lower accuracy in the estimation of clay content. This outcome could be related initially to weather conditions reducing the performance of optical data. Local tillage conditions, with frequent residues occurring after the cereal harvest, precisely during early summer season (June–July), is also affecting reflectance. For instance, Vaudour et al. [
27] have found similarly modest correlations between observed and predicted clay content, using PLSR model, with an R
2 between 0.39 and 0.5. In Castaldi et al. [
55], clay spectral indices entail a decrease of accuracy according to soil moisture classes (a coefficient of correlation less than 0.65). The investigation on the wavelengths most correlated with clay content at different moisture levels, showed that the most suitable spectral features are strongly affected by soil moisture. This showed that the knowledge of soil moisture is essential for a better estimation of clay content. In the same investigation, others studies showed that multispectral data provide modest performances of clay estimations, controlled by others soil’s parameters (soil roughness and crop residues) and due to atmospheric effects [
21,
56,
57].
Radar data thus appears to contribute an improvement in overall accuracy, although scientific studies are very limited in this area. In practice, soil moisture conditions can be derived from radar data independently of local weather conditions, and even in the presence of a vegetation cover. Therefore, soil moisture estimation could hamper the estimation of soil component such as clay content from remote sensing data, reducing the strength of the relevant spectral absorption features. This capability broadens the potential for characterizing soil texture in areas where optical satellite sensors are unable to observe the ground, due to the presence of a vegetation cover. As in the case of optical observations, the proposed radar technique would clearly be disturbed by irrigation, which affects the relationship between the average seasonal values of soil moisture and soil clay content.
The RF algorithm is found to have the most accurate results, using different indicators. Nevertheless, similar results are obtained for both the RF and SVM techniques. In the present study, a relatively small number of features are used as inputs for the classification algorithm. It would be interesting to use a greater number of samples for the validation process. The computing time needed for the learning process is also an important criterion, when comparing different classification algorithms. The parametric configuration of the SVM often requires an optimization phase, which may take longer than in the case of the RF. Conversely, the RF is less sensitive to its parametric configuration, thus reducing the required training time.
Furthermore, recent advance techniques have been proposed to increase the predictive power of models. Tziolas et al. [
58] have proposed an accurate estimation of soil texture components (clay, silt, and sand). They showed that with a combination of geographical proximity ad spectral similarity in regression analysis will increase the predictive power of a novel memory based on learning algorithm. They predicted clay content with an R
2 of 0.84 and an RMSE of 6.32%.
Moreover, Demattê et al. [
59] have designed a Geospatial Soil Sensing System (GEOS3) based on Landsat TM5 products to retrieve soil spectral reflectance from several years with creating a Temporal Synthetic Spectral Reflectance (TESS), which is a synthetic spectral fingerprint of the soil surface. The functionality of GEOS3 is evident, as it could be used to support soil surveys, digital soil mapping (e.g., mapping of clay contents), precision agriculture, soil sampling allocation, soil management zones, soil conservation, and for improvements to existing soil maps. They also proposed the use of Normalized Burn Ratio 2 (NBR2), as an auxiliary index to decrease the similarities found on the multispectral patterns between sandy soils and straw cover.
5. Conclusions
The aim of this study is to develop an approach for topsoil clay content estimations, based on the interpretation of multi-sensor satellite data. Our results show that remote sensing is an efficient tool, which can be used to generate soil texture maps at the field scale. This study was carried out over the Kairouan Plain, in central Tunisia. Satellite acquisitions were accompanied by field measurements, from which each soil sample was assigned to a predefined class, according to its measured clay content. Three main classes are defined, with clay content values ranging between 15% and 60%.
The classical RF and SVM classifiers are used with different indicators, derived from the Sentinel constellations (S-1 and S-2). Simulations were carried out with several datasets, thus allowing three-fold cross-validation to be applied. Several studies have shown that optical data have considerable potential for the retrieval of soil texture. We thus tested several indices and SWIR bands for their ability to estimate clay content. As the results were relatively poor, with an OA below 0.4, a second simulation was performed by testing various soil moisture products, which have a significant correlation with clay content, as input data for the classification process. This indicator improves the classification performance. The original aspect of this study lies in the fact that soil moisture products derived from the WCM could be used to estimate clay content, even in areas covered by vegetation, since this approach has been validated on several sites under different climatic conditions.
The behaviors of the SVM and RF have been analyzed, showing that both algorithms can be used as robust classifiers for clay content estimations, even when relatively small volumes of training data are used. The RF is more accurate than the SVM. A small drawback of this algorithm is that it is difficult to parameterize.
Future studies should focus on collecting a larger number (at least 100) of soil samples, to improve the results, and allow a much finer classification to be achieved. These techniques could also be tested over other areas, characterized by different climatic conditions, and could also be used to produce texture maps of sand content. It is important to mention the critical impact of irrigation on soil color: meaningful optical observations can be made only at certain times of the year, to avoid the influence of irrigation on soil moisture. Another limitation of the use of optical data arises from the prevailing atmospheric conditions, which can restrict the number of useful images taken over a given area of interest. The fact that the quality and performance of optical data can be perturbed by several different factors highlights the importance of SAR product use.

 ,
, 


