Rangeland Productivity Partitioned to Sub-Pixel Plant Functional Types
by
 , ,
, ,
Nathaniel P. Robinson
1,2,* ,
,
Matthew O. Jones
1,2, 
Alvaro Moreno
2,3,
Tyler A. Erickson
4,
David E. Naugle
1 and
Brady W. Allred
1,2 1
W.A. Franke College of Forestry and Conservation, University of Montana, Missoula, MT 59812, USA
2
Numerical Terradynamic Simulation Group, University of Montana, Missoula, MT 59812, USA
3
Image Processing Laboratory, Universitat de València, 46980 Paterna, Spain
4
Google, Inc., Mountain View, CA 94043, USA
*
Author to whom correspondence should be addressed.
Remote Sens. 2019, 11(12), 1427; https://doi.org/10.3390/rs11121427
Submission received: 16 May 2019
/
Revised: 4 June 2019
/
Accepted: 13 June 2019
/
Published: 15 June 2019
(This article belongs to the Special Issue Applications of Remote Sensing in Rangelands Research)
Abstract
:Understanding and monitoring the dynamics of rangeland heterogeneity through time and across space is critical for the effective management and conservation of rangeland systems and the sustained supply of the ecosystem goods and services they provide. Conventional approaches (both field-based and remote sensing) to monitoring rangeland productivity fail to effectively capture important aspects of this heterogeneity. While field methods can effectively capture high levels of detail at fine spatial and temporal resolutions, they are limited in their applicability and scalability to larger spatial extents and longer time periods. Alternatively, remote sensing based approaches that scale broad spatiotemporal extents simplify important heterogeneity occurring at fine scales. We address these limitations to monitoring rangeland productivity by combining a continuous plant functional type (PFT) fractional cover dataset with a Landsat derived gross primary production (GPP) and net primary production (NPP) model. Integrating the annual PFT dataset with a 16-day Landsat normalized difference vegetation (NDVI) composite dataset enabled us to disaggregate the pixel level NDVI values to the sub-pixel PFTs. These values were incorporated into the productivity algorithm, enabling refined estimations of 16-day GPP and annual NPP for the PFTs that composed each pixel. We demonstrated the results of these methods on a set of representative rangeland sites across the western United States. Partitioning rangeland productivity to sub-pixel PFTs revealed new dynamics and insights to aid the sustainable management of rangelands.

1. Introduction
Rangelands—uncultivated land dominated by grasses, forbs, and shrubs—cover approximately 25% of the earth’s land area [1], provide crucial ecosystem goods and services to over two billion people [2], and support over half of the global livestock populations [3]. In addition to direct economic and cultural values, rangelands support rich biodiversity [4] and are important carbon sinks, storing approximately 10–30% of the world’s terrestrial carbon [5,6]. Net primary production (NPP) is one of the supporting ecosystem services that are foundational to provisioning and regulating cultural services [7]. Net primary productivity quantifies the amount of carbon assimilated into plant biomass through photosynthesis over a given time [8] and represents the amount of energy available for species across trophic levels. Although rangelands generally have lower NPP than other ecosystems (e.g., forests), it is often heterogeneous, providing forage at multiple scales and support more herbivores than any other terrestrial biome [9,10]. The effective management and conservation of rangeland systems for the sustained supply of their goods and services requires accounting for the heterogeneity of rangeland productivity across multiple spatiotemporal scale—a non-trivial task [11]. Conventional rangeland monitoring procedures most often utilize direct measurements of vegetation on small-scale plots or transects, and, though effective, only capture dynamics at small, localized scales and represent snapshots in time and space with limited applicability at broader scales [12,13]. Alternatively, satellite remote sensing-based approaches utilize spatially and temporally continuous satellite imagery to assess vegetation dynamics. Higher level models integrate remote sensing data with meteorological and land cover data to produce estimates of gross primary production (GPP) and NPP. These can be directly related to the amount of solar radiation absorbed by the plant canopy and the light use efficiency (LUE) of plant functional types [14]. The MOD17 model and product [15] utilizes remote sensing data from moderate resolution imaging spectroradiometer (MODIS) sensors to estimate global GPP and NPP, with a spatial resolution of 500 m, from the year 2000 to the present. Although valuable for broad-scale analyses, the product is limited in its application within rangelands as key vegetation groups and heterogeneity are simplified.
A finer Landsat-derived 30 m resolution GPP and NPP product, based on the MOD17 model, improved the spatial resolution and increased the temporal extent (1984–present) of the original product, and is more applicable for monitoring rangelands at appropriate scales [16]. Despite these improvements, significant challenges for effective rangeland monitoring remain. Regardless of spatial resolution, pixel estimates are aggregations of sub-pixel dynamics [17]. At medium to fine resolutions, substantial heterogeneity of rangeland productivity can occur at sub-pixel scales (Figure 1). Similarly, the MOD17 model utilizes a categorical land cover classification to apply biome specific parameters to productivity estimates. Sub-pixel land cover dynamics or land cover changes are not accounted for [18]. To address these limitations, we incorporated a new continuous rangeland plant functional type (PFT) percent cover dataset, developed for western United States rangelands [19], into the MOD17 framework. This dataset provided annual estimates of the percent fractional cover of six rangeland PFTs: annual forbs and grasses (AFG), perennial forbs and grasses (PFG), shrubs (SHR), trees (TREE), bare ground (BG), and litter (LTR). Here we present the methodology for integrating the annual PFT dataset into the MOD17 workflow to produce 16-day estimates of GPP and annual estimates of NPP for each rangeland PFT at 30 m spatial resolution. In so doing, we refined the overall estimates of GPP and NPP and provided valuable insight into the spatiotemporal distribution of rangeland productivity across the western United States.
2. Materials and Methods
2.1. NDVI Disaggregation
The MOD17 model incorporates two remote sensing-based variables of plant canopy dynamics [15]: the fraction of photosynthetically active radiation (FPAR), and leaf area index (LAI). The Landsat derived 30 m GPP/NPP product [16] calculated both FPAR and LAI from the normalized difference vegetation index (NDVI) using established empirical relationships. While the NDVI has certain limitations (e.g., saturation in densely vegetated areas and variable responses to soil characteristics) it is the most widely utilized and validated remote sensing-based vegetation index. The NDVI values utilized were derived from a Landsat NDVI compositing methodology [20], whereby spatially contiguous NDVI composites were produced every 16 days for each 30 m × 30 m pixel. These single pixel level values generalized the variability of the land surface occurring at sub-30 m scales. The NDVI constitutes both the relative area and the unique phenological characteristics of each representative PFT within a single pixel, which varies substantially among PFTs and through time (Figure 2). In order to disaggregate pixel NDVI to sub-pixel components, we used linear mixing theory, where the NDVI of a mixed pixel was calculated as the mean NDVI of the individual PFTs within the pixel weighted by their fractional cover [21]. This is expressed for each pixel (i) by (Equation (1)):
where NDVI(i, t) is the pixel NDVI at time t, fc(i, c) is the fractional cover of each PFT c, k is the number of PFTs in the pixel, NDVIi(c,t) is the mean NDVI of PFT c at time t, and ε is the error. While this approach is predominantly used with actual reflectance values, the assumptions hold using NDVI [21,22].
Using the ordinary least squares technique, it was possible to estimate the mean NDVI for each PFT through space [23,24,25]. By knowing the fractional cover of each PFT within a pixel, along with the NDVI value, a set of overdetermined linear equations was developed (Equation (2)):
Solving this system of equations resulted in a single estimate of mean NDVI for each PFT across the spatial extent of sampled pixels. Estimating the NDVI value of each PFT within a specific pixel, however, was problematic given the spatial heterogeneity of rangelands. To address these issues, techniques have been developed to iteratively solve these equations for each pixel while weighting the input pixels by distance and spectral similarity [21,26,27].
Here we build on these methods, integrating the rangeland PFT dataset [19] and the 16-day Landsat NDVI composites to disaggregate pixel level NDVI to key PFTs across western rangelands of the conterminous United States. Due to the spatial and temporal scale of analysis, we implemented these methods in Google Earth Engine [28] and developed a refined sampling scheme of pixels to account for the variability of NDVI within PFTs. We used the EPA Level IV ecoregions to define relatively homogenous areas based on ecological and climatic characteristics [29] in which the phenological characteristics within each PFT were assumed to be similar. Within each ecoregion the pixel level NDVI, percent cover of each PFT, and pixel coordinates were extracted for 600 points, selected through a stratified random sample. Each ecoregion was stratified by areas of high relative PFT fractional cover, defined as pixels with a fractional cover greater than the 90th percentile of fractional cover for the respective PFT across the ecoregion. For each PFT 100 random points were sampled within the areas containing the purest available pixels, enabling a more robust estimation of the mean phenology of each PFT. Then, for every pixel within the ecoregion, the distance to each sample point was calculated allowing us to weight the sample points by distance. As valid NDVI values can only range between −1 and 1 we used ridge regression [30] to solve the equations while effectively constraining the coefficients within reasonable ranges. Ridge regression adds a parameter imposing a penalty on the size of the coefficients. The resulting coefficients are estimates of the mean NDVI for each PFT across the sampled region for each pixel. While weighting by distance accounts for some phenological variability across an ecoregion, finer scale heterogeneity is still missed. Slight shifts in elevation, aspect, or soil hydrology can result in departures from the mean phenology. For example, the mean NDVI of a PFT across a dryland ecoregion does not represent specific dynamics of that PFT occurring in small mesic patches within the ecoregion. To account for this variation within PFTs, we adjusted the estimated NDVI of each PFT for each pixel so that the estimated pixel NDVI matched the actual pixel NDVI. To do so, we assumed the NDVI contribution of each PFT to the estimated NDVI was proportional to the contribution to the adjustment (the difference between the pixel NDVI and estimated NDVI).
2.2. GPP/NPP Partitioning
The disaggregated NDVI values by PFT were incorporated into the MOD17 model adapted for Landsat as per the methods in [16]. For each pixel in every 16-day composite, however, rather than a single NDVI value, the disaggregated NDVI values for each PFT represented within the pixel were used. GPP and NPP were then calculated individually for each PFT using the set of biome specific parameters for the given PFT. This results are given in rate of GPP (g C m-2 16-day-1) for each 16-day period and NPP (g C m-2 year-1) annually, for each PFT of each pixel. To calculate actual production per PFT per pixel, the rates of GPP and NPP were combined with the fractional cover estimates (Figure 3).
3. Results and Discussion
Integrating the annual PFT dataset with the 16-day annual NDVI composites enabled us to disaggregate pixel level NDVI values to the sub-pixel PFTs that compose the pixel. The process capitalized on established methodologies, whereby disaggregated NDVI values were estimated through weighted ridge regression [30]. By knowing the variation of fractional cover estimates along with pixel NDVI values, an overdetermined set of linear equations was built to solve for the NDVI value for each PFT across ecologically homogenous regions. The resulting NDVI values for every PFT within each pixel represented an estimation of the pure pixel NDVI for the given PFT. These values captured the unique phenological characteristics of each PFT within a given pixel through time and enabled refined estimations of GPP and NPP for the PFTs that composed each pixel.
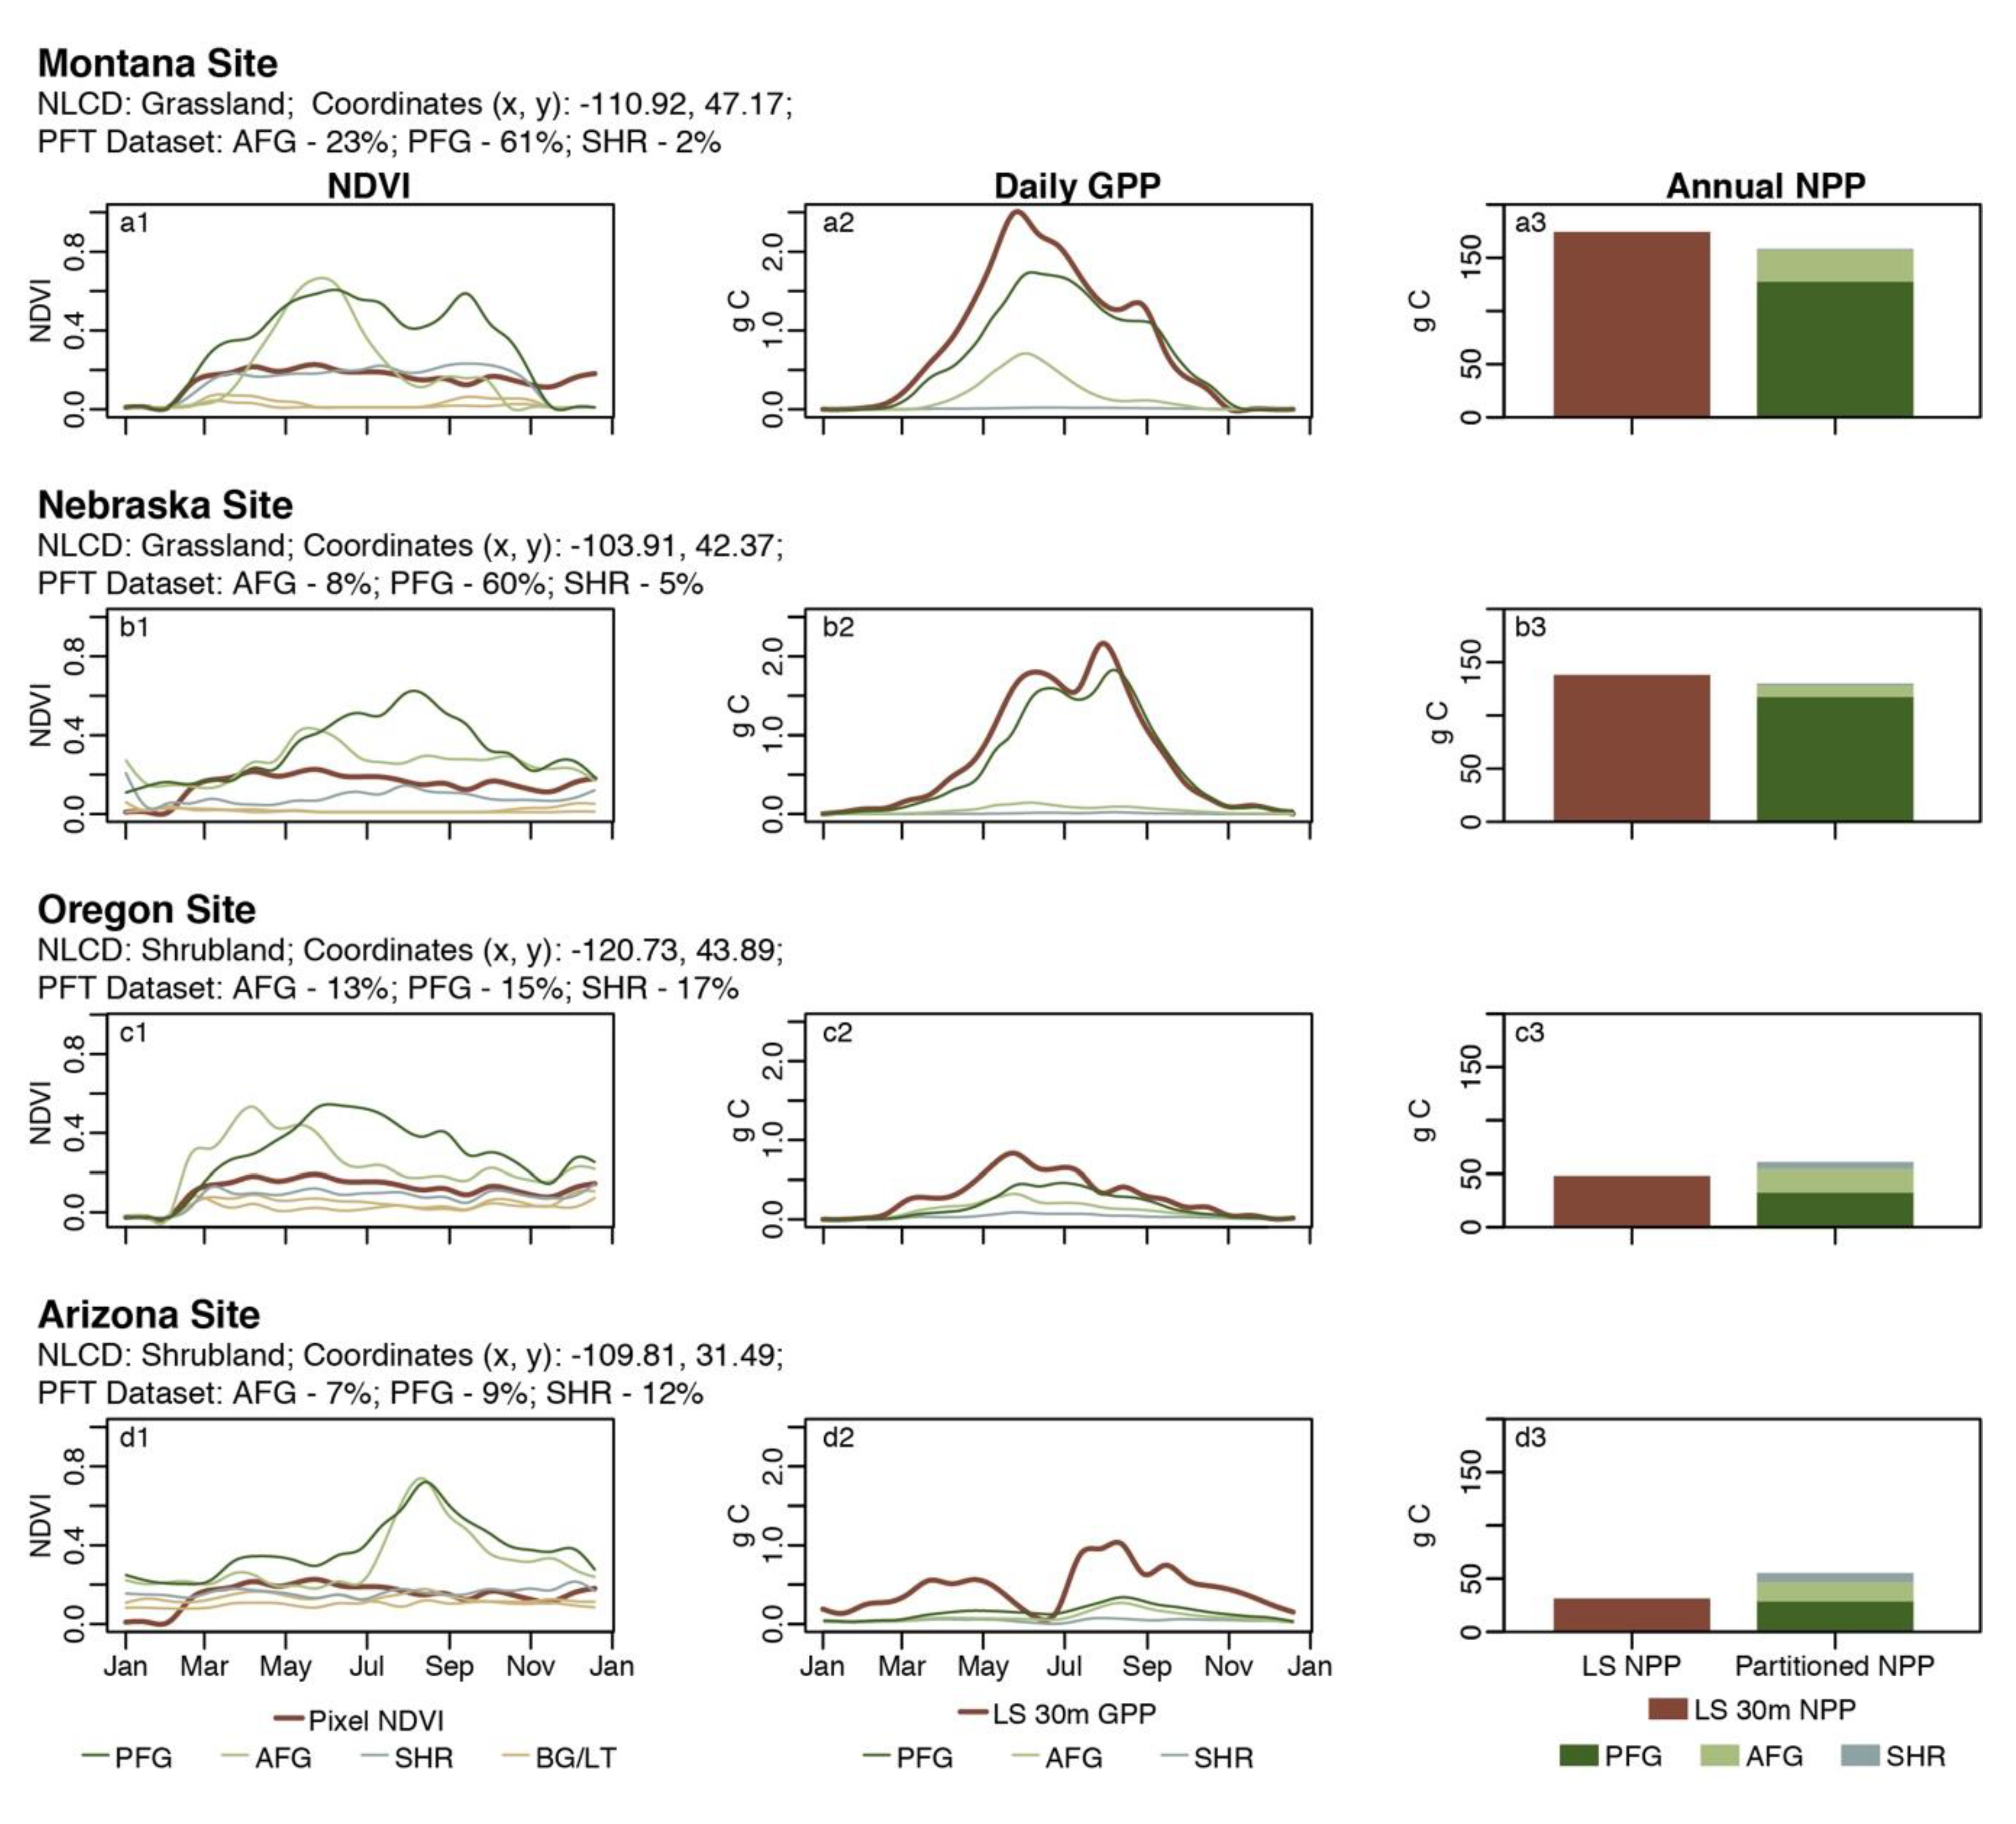
We evaluated this large-scale approach by examining four randomly selected points across the western United States representing unique phenological dynamics. We compared the partitioned results to the original 30 m Landsat GPP/NPP estimates. The productivity of the example sites was driven by a variety of climatic conditions found across western US rangelands. In central Montana (Figure 4a), a site characteristic of northern semi-arid prairies, rangeland productivity was largely driven by winter and spring precipitation. The National Land Cover Dataset (NLCD) classifies this site as grassland, and the subsequent pixel NDVI through time (Figure 4a1) reflects the expected phenological characteristics of a grassland site for this region. Although dominated by grasses, the site is composed of a mix of AFG (23%), PFG (61%), SHR (2%), and BG/LTR (14%) according to the annual PFT dataset. Disaggregating the NDVI for each of these components (Figure 4a1) revealed the individual and unique phenological profiles. AFG NDVI both increased and decreased rapidly early in the growing season, while PFG NDVI increased rapidly during the growing season but decreased more slowly as the growing season progressed. Similar dynamics were seen in a second grassland dominated site in western Nebraska (Figure 4b), characteristic of the central Great Plains where rangeland productivity is more constant through the spring and summer. While classified as a grassland by the NLCD, this site is also a mix of AFG (8%), PFG (60%), SHR (5%), and BG/LTR (17%), each contributing uniquely to the overall NDVI through time (Figure 4b1). The contribution to the overall productivity of both sites (Figure 4a2,a3,b2,b3) from the AFG and SHR components, however, was minimal due to the combination of low fractional covers, short growing period for AFGs and the low NDVI of the shrub components. As these sites are heavily dominated by grasslands, the cumulative values of GPP and NPP for the PFTs did not depart substantially from the original 30 m Landsat GPP/NPP product (Figure 4a3,b3).
Two example sites in arid regions, classified as shrublands by the NLCD, clearly demonstrate the added value of the partitioning methods for estimating GPP and NPP. A site from Oregon (Figure 4c) is characteristic of the Great Basin where productivity is driven by winter and spring precipitation. This site, while classified as a shrubland dominated system by the NLCD, is a relatively even mix of SHR (17%), PFG (15%), and AFG (13%), and dominated by more than 50% BG/LTR. The disaggregated NDVI (Figure 4c1) again revealed unique phenological characteristics of each PFT. Additionally, GPP and NPP are shown to be driven by the productivity of PFGs and AFGs rather than SHRs (Figure 4c1,c2). Similar dynamics were demonstrated for a site in southern Arizona (Figure 4d), where productivity is largely driven by precipitation in the late summer. Although classified as a shrubland by the NLCD, this area is largely dominated by BG/LTR (>50%), with relatively even SHR (12%), PFG (9%), and AFG (7%) components, with the PFG and AFG components contributing disproportionately to the overall GPP and NPP estimates (Figure 4d2,d3). In both of these examples, GPP and NPP were underestimated as important temporal contributions of forbs and grasses went unaccounted for in the overall productivity of the system.
4. Conclusions
Remote sensing provides a means of monitoring rangeland ecosystems continuously across broad spatiotemporal scales, efficient targeting and resource allocation for management and conservation decisions, as well as the ability to monitor outcomes. Due to the fundamental challenge of mixed pixels, whereby at any spatial resolution pixel level estimates are aggregations of the sub-pixel dynamics occurring on the ground [17], available datasets and products are often too coarse to effectively account for rangeland heterogeneity. Understanding this heterogeneity across space and through time is critical for rangeland conservation and management actions, for example creating grazing plans and strategies, understanding results of herbicide treatments for invasive annuals, or predicting fuel conditions for an upcoming fire year. The methods presented in this paper provide a means of understanding the finer scale phenological and productivity dynamics of rangelands that are missed when using single, pixel level estimates. Key areas of future research are to translate these partitioned values of NDVI, GPP and NPP into metrics (e.g., above ground biomass, pounds of forage, animal unit months, and fuel load) that are more practical and meaningful for rangeland managers. Such dynamics can provide critical insight into the sustainable management and conservation of rangelands.
Author Contributions
Conceptualization, N.R., B.A. and M.J.; methodology, N.R., B.A., A.M.; formal analysis, N.R., B.A. and A.M.; investigation, N.R., B.A. and A.M.; writing—original draft preparation, N.R., B.A. and A.M.; writing—review and editing, N.R., B.A., M.J., T.E., A.M. and D.N.; visualization, N.R. and A.M.; supervision, B.A.; project administration, B.A.; funding acquisition, B.A. and D.N.
Funding
This work was made possible by the Natural Resources Conservation Service (NRCS) Working Lands for Wildlife in support of sage-grouse and prairie chicken conservation, the NRCS Conservation Effects Assessment Project, the Bureau of Land Management (BLM), and the Intermountain West Joint Venture. The contributions of Alvaro Moreno were supported by the NASA Earth Observing System MODIS project (grant NNX08AG87A).
Acknowledgments
We thank the Google Earth Engine developers for their support and technical advice.
Conflicts of Interest
The authors declare no conflict of interest.
References
- Alkemade, R.; Reid, R.S.; van den Berg, M.; de Leeuw, J.; Jeuken, M. Assessing the impacts of livestock production on biodiversity in rangeland ecosystems. Proc. Natl. Acad. Sci. USA 2013, 110, 20900–20905. [Google Scholar] [CrossRef] [PubMed]
- Sala, O.E.; Yahdjian, L.; Havstad, K.; Aguiar, M.R. Rangeland ecosystem services: Nature’s supply and humans’ demand. In Rangeland Systems: Processes, Management and Challenges; Briske, D.D., Ed.; Springer: Cham, Switzerland, 2017; pp. 467–489. [Google Scholar]
- Havstad, K.; Peters, D.; Allen-Diaz, B.; Bestelmeyer, B.; Briske, D.; Brown, J.; Brunson, M.; Herrick, J.; Johnson, P.; Joyce, L.; et al. The western United States rangelands: A major resource. In Grassland, Quietness and Strength for a New American Agriculture; Wedin, W., Fales, S., Eds.; American Society of Agronomy, Crop Science Society of America, and Soil Science Society of America: Madison, WI, USA, 2009; pp. 75–93. [Google Scholar]
- Veldman, J.W.; Overbeck, G.E.; Negreiros, D.; Mahy, G.; Le Stradic, S.; Fernandes, G.W.; Durigan, G.; Buisson, E.; Putz, F.E.; Bond, W.J. Where tree planting and forest expansion are bad for biodiversity and ecosystem Services. Bioscience 2015, 65, 1011–1018. [Google Scholar] [CrossRef]
- Derner, J.D.; Boutton, T.W.; Briske, D.D. Grazing and ecosystem carbon storage in the North American Great Plains. Plant Soil 2006, 280, 77–90. [Google Scholar] [CrossRef]
- Booker, K.; Huntsinger, L.; Bartolome, J.W.; Sayre, N.F.; Stewart, W. What can ecological science tell us about opportunities for carbon sequestration on arid rangelands in the United States? Glob. Environ. Chang. 2013, 23, 240–251. [Google Scholar] [CrossRef] [Green Version]
- Alcamo, J.; Ash, N.J.; Butler, C.D.; Callicott, J.B.; Capistrano, D.; Carpenter, S.R.; Castilla, J.C.; Chambers, R.; Chopra, K.; Cropper, A.; et al. Millennium Ecosystem Assessment. Ecosystems and Human Well-Being: A Framework for Assessment; World Resources Institute, Island Press: Washington, DC, USA, 2003. [Google Scholar]
- Roy, J.; Mooney, H.A.; Saugier, B. Terrestrial Global Productivity; Academic Press: San Diego, CA, USA, 2001. [Google Scholar]
- Briske, D.D.; Fuhlendorf, S.D.; Smeins, F.E. Vegetation dynamics on rangelands: A critique of the current paradigms. J. Appl. Ecol. 2003, 40, 601–614. [Google Scholar] [CrossRef]
- Frank, D.A.; McNaughton, S.J.; Tracy, B.F. The Ecology of the earth’s grazing ecosystems: Profound functional similarities exist between the Serengeti and Yellowstone. Bioscience 1998, 48, 513–521. [Google Scholar] [CrossRef]
- Fuhlendorf, S.D.; Davis, C.A.; Elmore, R.D.; Goodman, L.E.; Hamilton, R.G. Perspectives on grassland conservation efforts: Should we rewild to the past or conserve for the future? Philos. Trans. R. Soc. Lond. B Biol. Sci. 2018, 373. [Google Scholar] [CrossRef] [PubMed]
- Washington-Allen, R.A.; West, N.E.; Ramsey, R.D.; Efroymson, R.A. A protocol for retrospective remote sensing–based ecological monitoring of rangelands. Rangel. Ecol. Manag. 2006, 59, 19–29. [Google Scholar] [CrossRef]
- West, N.E. History of rangeland monitoring in the USA. Arid Land Res. Manag. 2003, 17, 495–545. [Google Scholar] [CrossRef]
- Monteith, J.L. Solar radiation and productivity in tropical ecosystems. J. Appl. Ecol. 1972, 9, 747–766. [Google Scholar] [CrossRef]
- Running, S.W.; Nemani, R.R.; Heinsch, F.A.; Zhao, M.; Reeves, M.; Hashimoto, H. A continuous satellite-derived measure of global terrestrial primary production. Bioscience 2004, 54, 547–560. [Google Scholar] [CrossRef]
- Robinson, N.P.; Allred, B.W.; Smith, W.K.; Jones, M.O.; Moreno, A.; Erickson, T.A.; Naugle, D.E.; Running, S.W. Terrestrial primary production for the conterminous United States derived from Landsat 30 m and MODIS 250 m. Remote Sens. Ecol. Conserv. 2018, 4, 264–280. [Google Scholar] [CrossRef]
- Lillesand, T.; Kiefer, R.W.; Chipman, J. Remote Sensing and Image Interpretation; John Wiley & Sons: Hoboken, NJ, USA, 2014. [Google Scholar]
- Jay, S.; Potter, C.; Crabtree, R.; Genovese, V.; Weiss, D.J.; Kraft, M. Evaluation of modelled net primary production using MODIS and Landsat satellite data fusion. Carbon Balance Manag. 2016, 11, 8. [Google Scholar] [CrossRef] [PubMed]
- Jones, M.O.; Allred, B.W.; Naugle, D.E.; Maestas, J.D.; Donnelly, P.; Metz, L.J.; Karl, J.; Smith, R.; Bestelmeyer, B.; Boyd, C.; et al. Innovation in rangeland monitoring: Annual, 30 m, plant functional type percent cover maps for U.S. rangelands, 1984–2017. Ecosphere 2018, 9, e02430. [Google Scholar] [CrossRef]
- Robinson, N.P.; Allred, B.W.; Jones, M.O.; Moreno, A.; Kimball, J.S.; Naugle, D.E.; Erickson, T.A.; Richardson, A.D. A dynamic Landsat derived normalized difference vegetation index (NDVI) product for the conterminous United States. Remote Sens. 2017, 9, 863. [Google Scholar] [CrossRef]
- Busetto, L.; Meroni, M.; Colombo, R. Combining medium and coarse spatial resolution satellite data to improve the estimation of sub-pixel NDVI time series. Remote Sens. Environ. 2008, 112, 118–131. [Google Scholar] [CrossRef]
- Kerdiles, H.; Grondona, M.O. NOAA-AVHRR NDVI decomposition and subpixel classification using linear mixing in the Argentinean Pampa. Int. J. Remote Sens. 1995, 16, 1303–1325. [Google Scholar] [CrossRef]
- Oleson, K.W.; Sarlin, S.; Garrison, J.; Smith, S.; Privette, J.L.; Emery, W.J. Unmixing multiple land-cover type reflectances from coarse spatial resolution satellite data. Remote Sens. Environ. 1995, 54, 98–112. [Google Scholar] [CrossRef]
- Cherchali, S.; Amram, O.; Flouzat, G. Retrieval of temporal profiles of reflectances from simulated and real NOAA-AVHRR data over heterogeneous landscapes. Int. J. Remote Sens. 2000, 21, 753–775. [Google Scholar] [CrossRef]
- Fortin, J.-P.; Bernier, M.; Lapointe, S.; Gauthier, Y.; De Sève, D.; Beaudoin, S. Estimation of Surface Variables at the Sub-Pixel Level for Use as Input to Climate and Hydrological Models—Final report to Centre National d’Études Spatiales (France); INRS-Eau: Sainte-Foy, QC, Canada, 1998. [Google Scholar]
- Maselli, F. Definition of spatially variable spectral endmembers by locally calibrated multivariate regression analyses. Remote Sens. Environ. 2001, 75, 29–38. [Google Scholar] [CrossRef]
- Zhukov, B.; Oertel, D.; Lanzl, F.; Reinhackel, G. Unmixing-based multisensor multiresolution image fusion. IEEE Trans. Geosci. Remote Sens. 1999, 37, 1212–1226. [Google Scholar] [CrossRef]
- Gorelick, N.; Hancher, M.; Dixon, M.; Ilyushchenko, S.; Thau, D.; Moore, R. Google Earth Engine: Planetary-scale geospatial analysis for everyone. Remote Sens. Environ. 2016, 202, 18–27. [Google Scholar] [CrossRef]
- Omernik, J.M.; Griffith, G.E. Ecoregions of the conterminous United States: Evolution of a hierarchical spatial framework. Environ. Manag. 2014, 54, 1249–1266. [Google Scholar] [CrossRef] [PubMed]
- Hastie, T.; Tibshirani, R.; Friedman, J. The Elements of Statistical Learning; Springer: New York, NY, USA, 2009. [Google Scholar]
Figure 1.
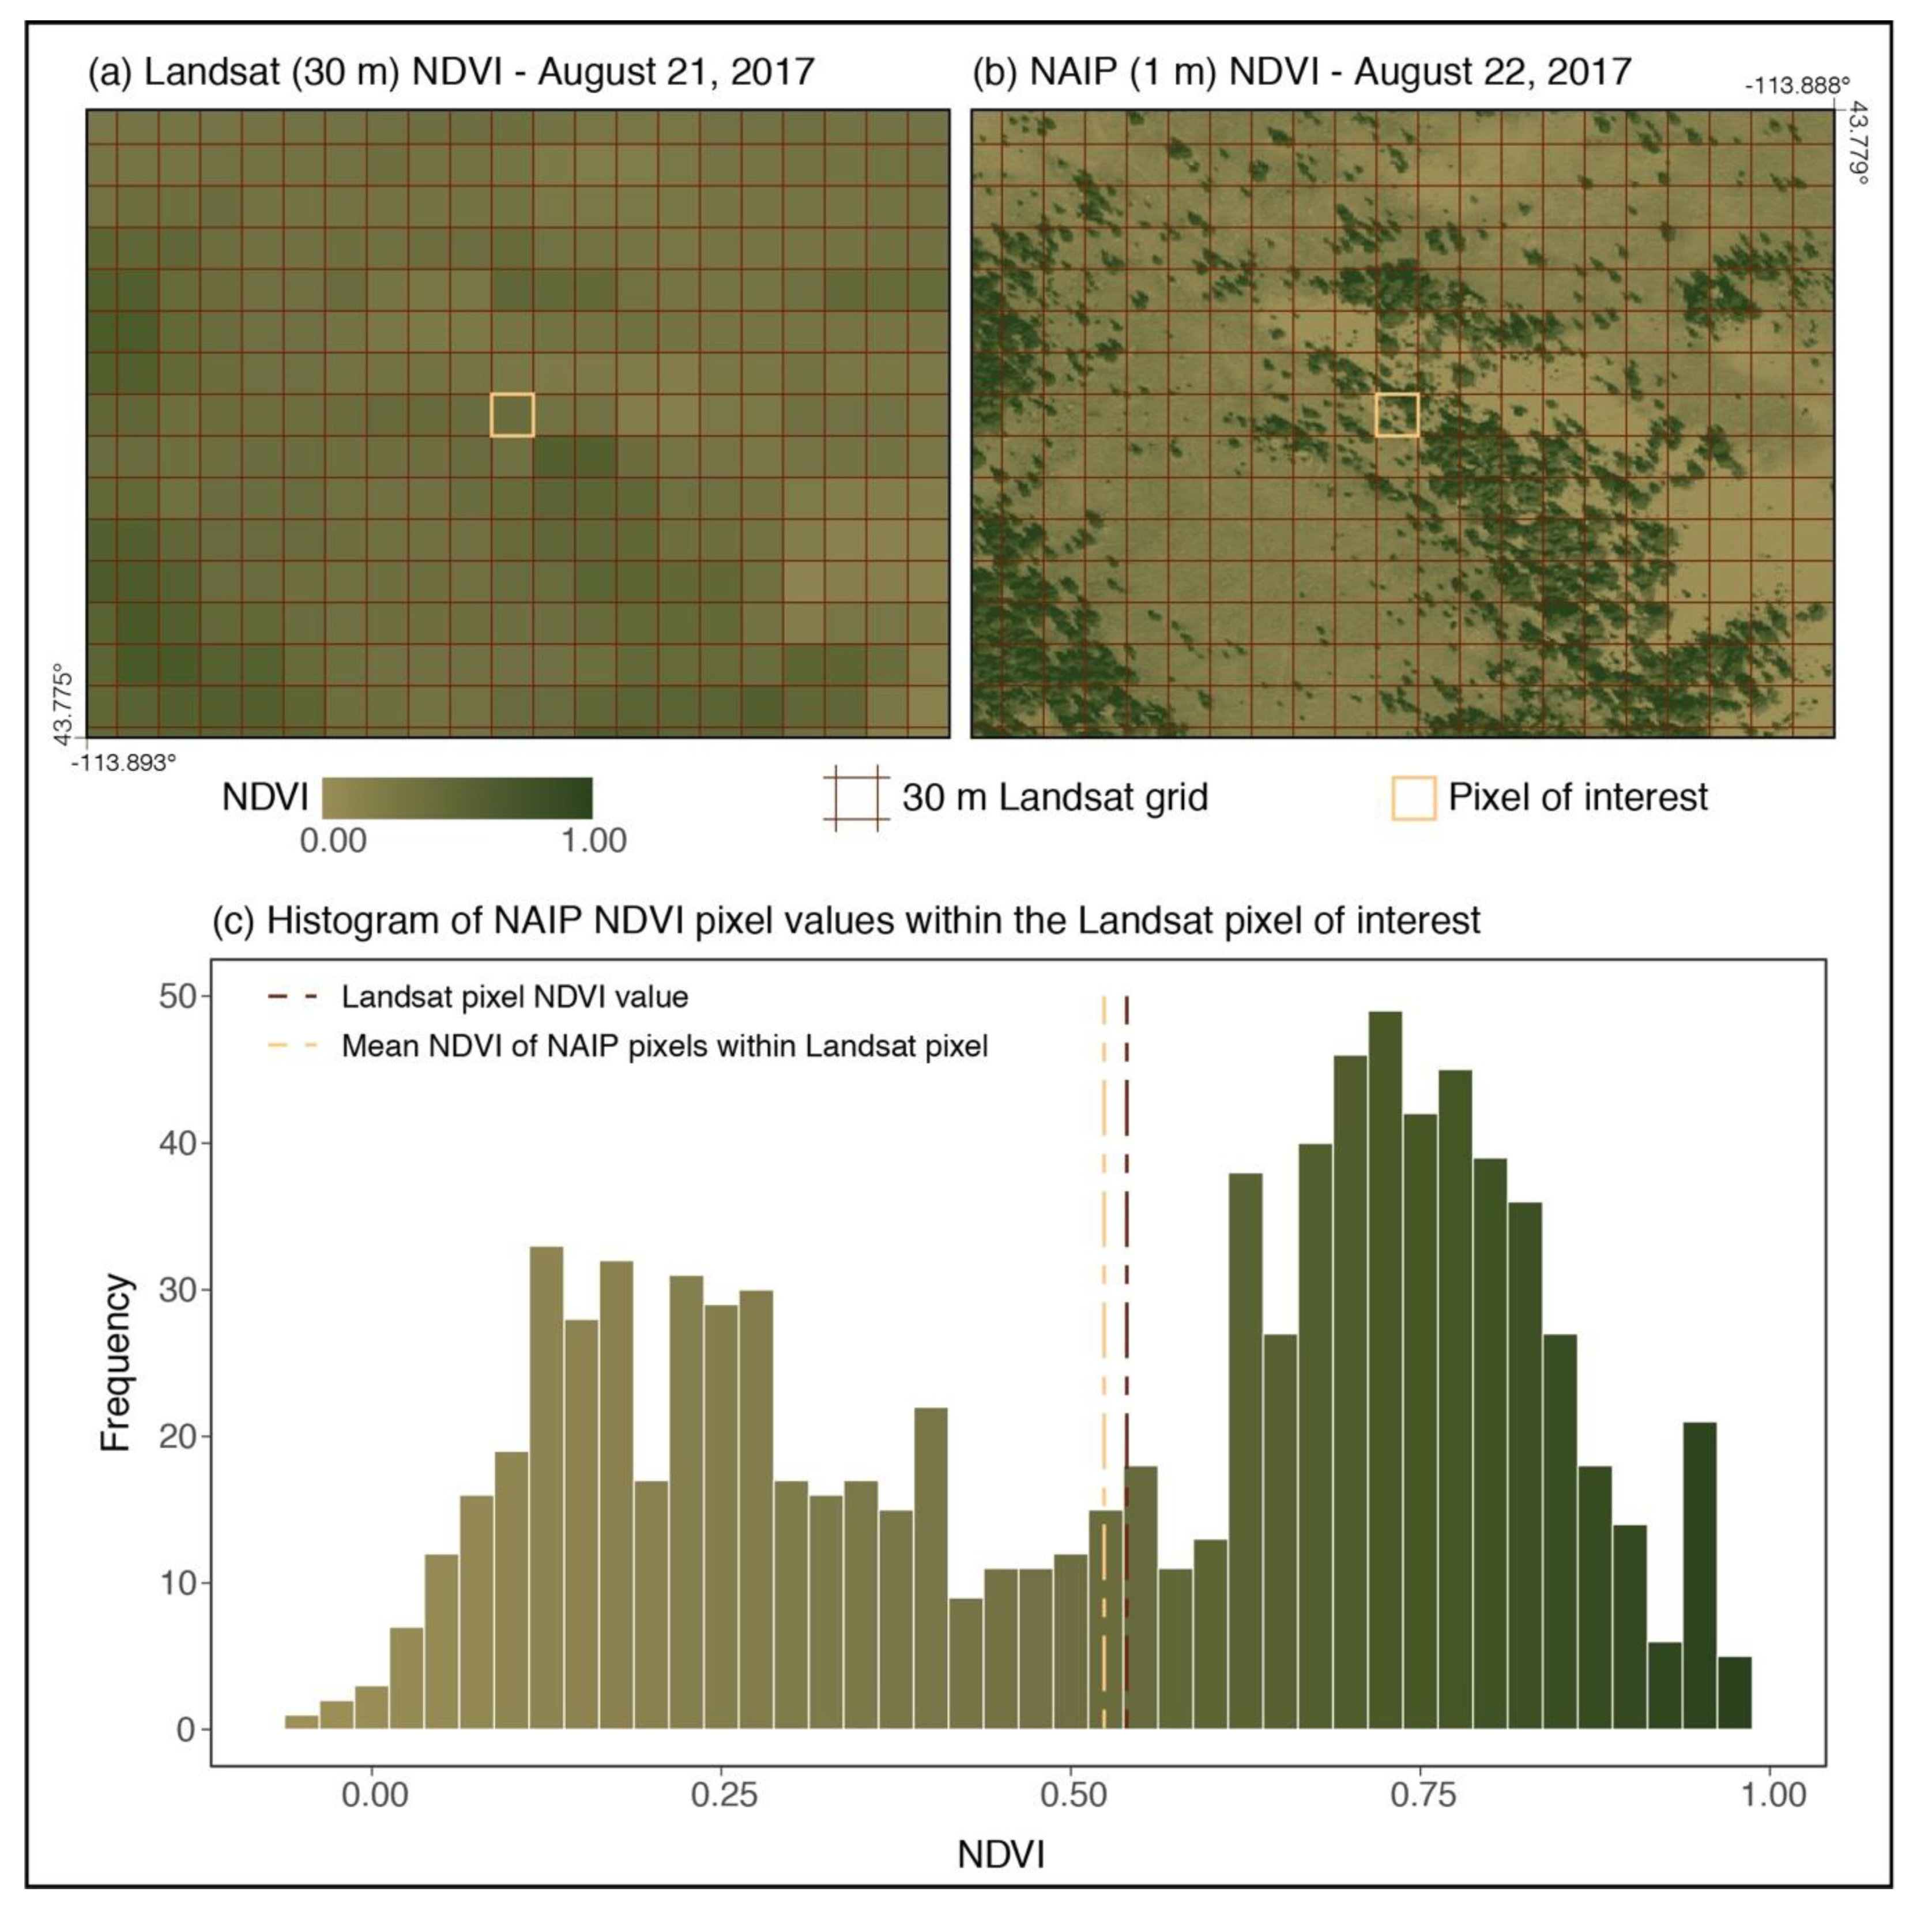
Example demonstrating sub-pixel variability of 30 m normalized difference vegetation index (NDVI) derived from Landsat (a) and 1 m National Agriculture Imagery Program (NAIP) NDVI (b); the distribution of NAIP NDVI values within the Landsat pixel of interest (c).
Figure 1.
Example demonstrating sub-pixel variability of 30 m normalized difference vegetation index (NDVI) derived from Landsat (a) and 1 m National Agriculture Imagery Program (NAIP) NDVI (b); the distribution of NAIP NDVI values within the Landsat pixel of interest (c).

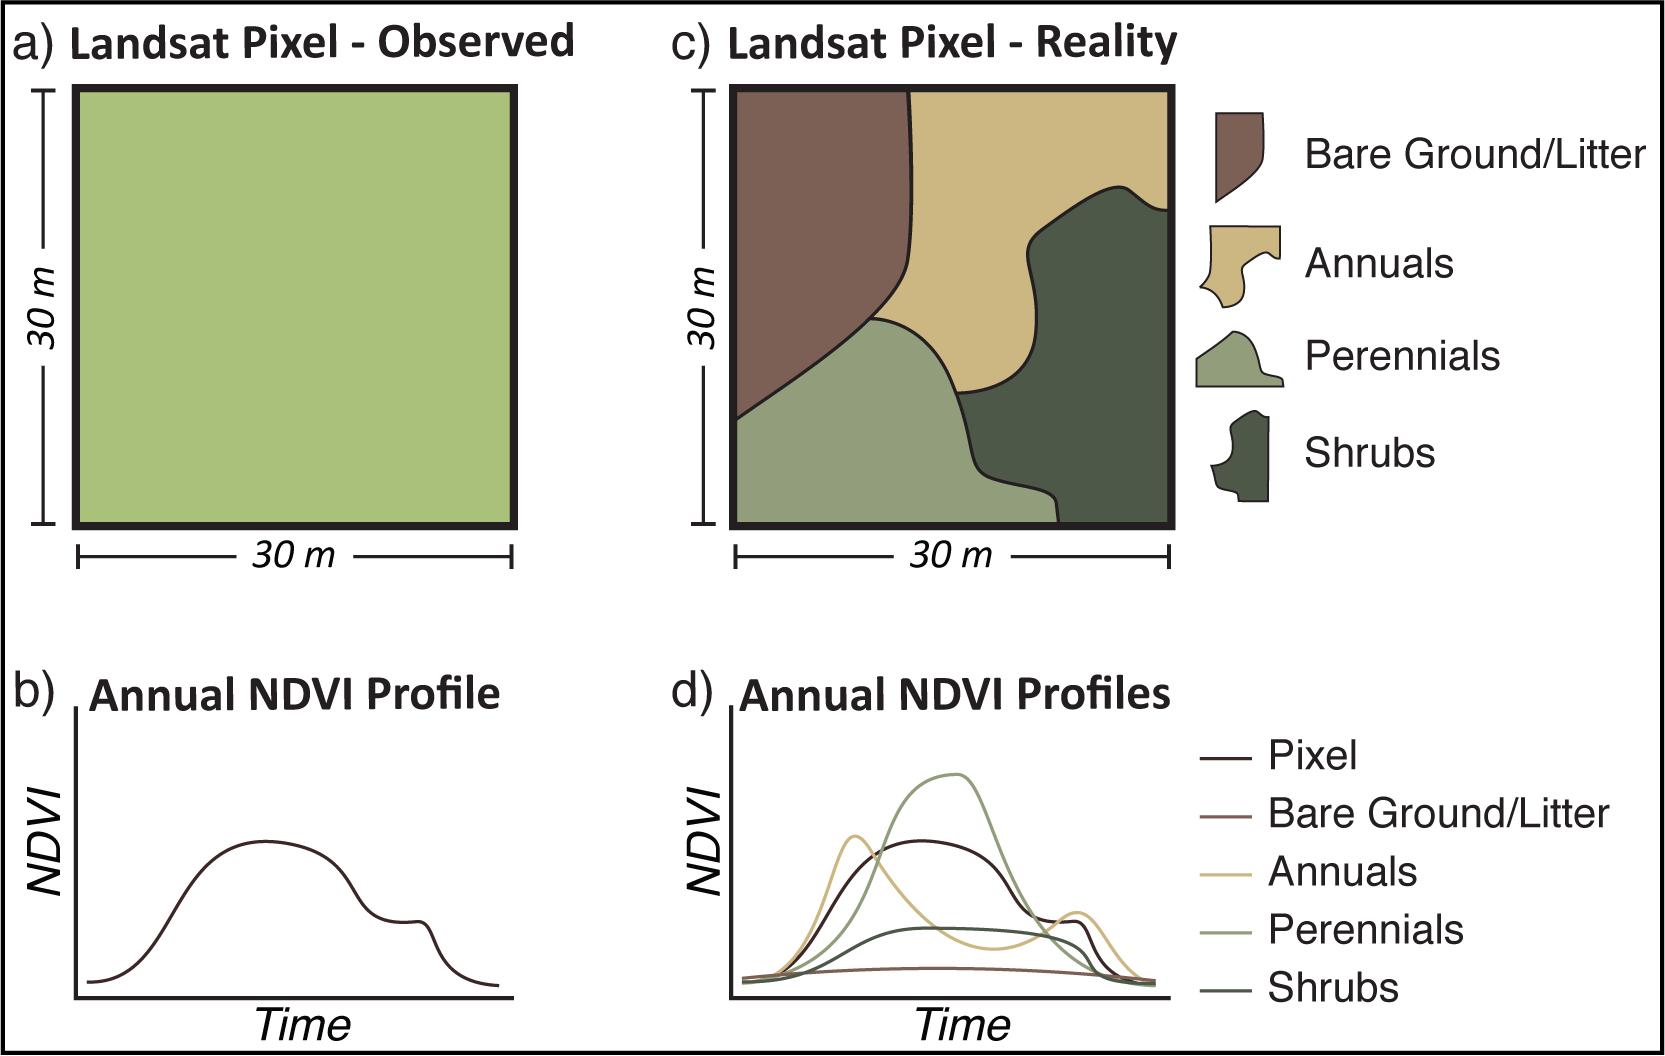
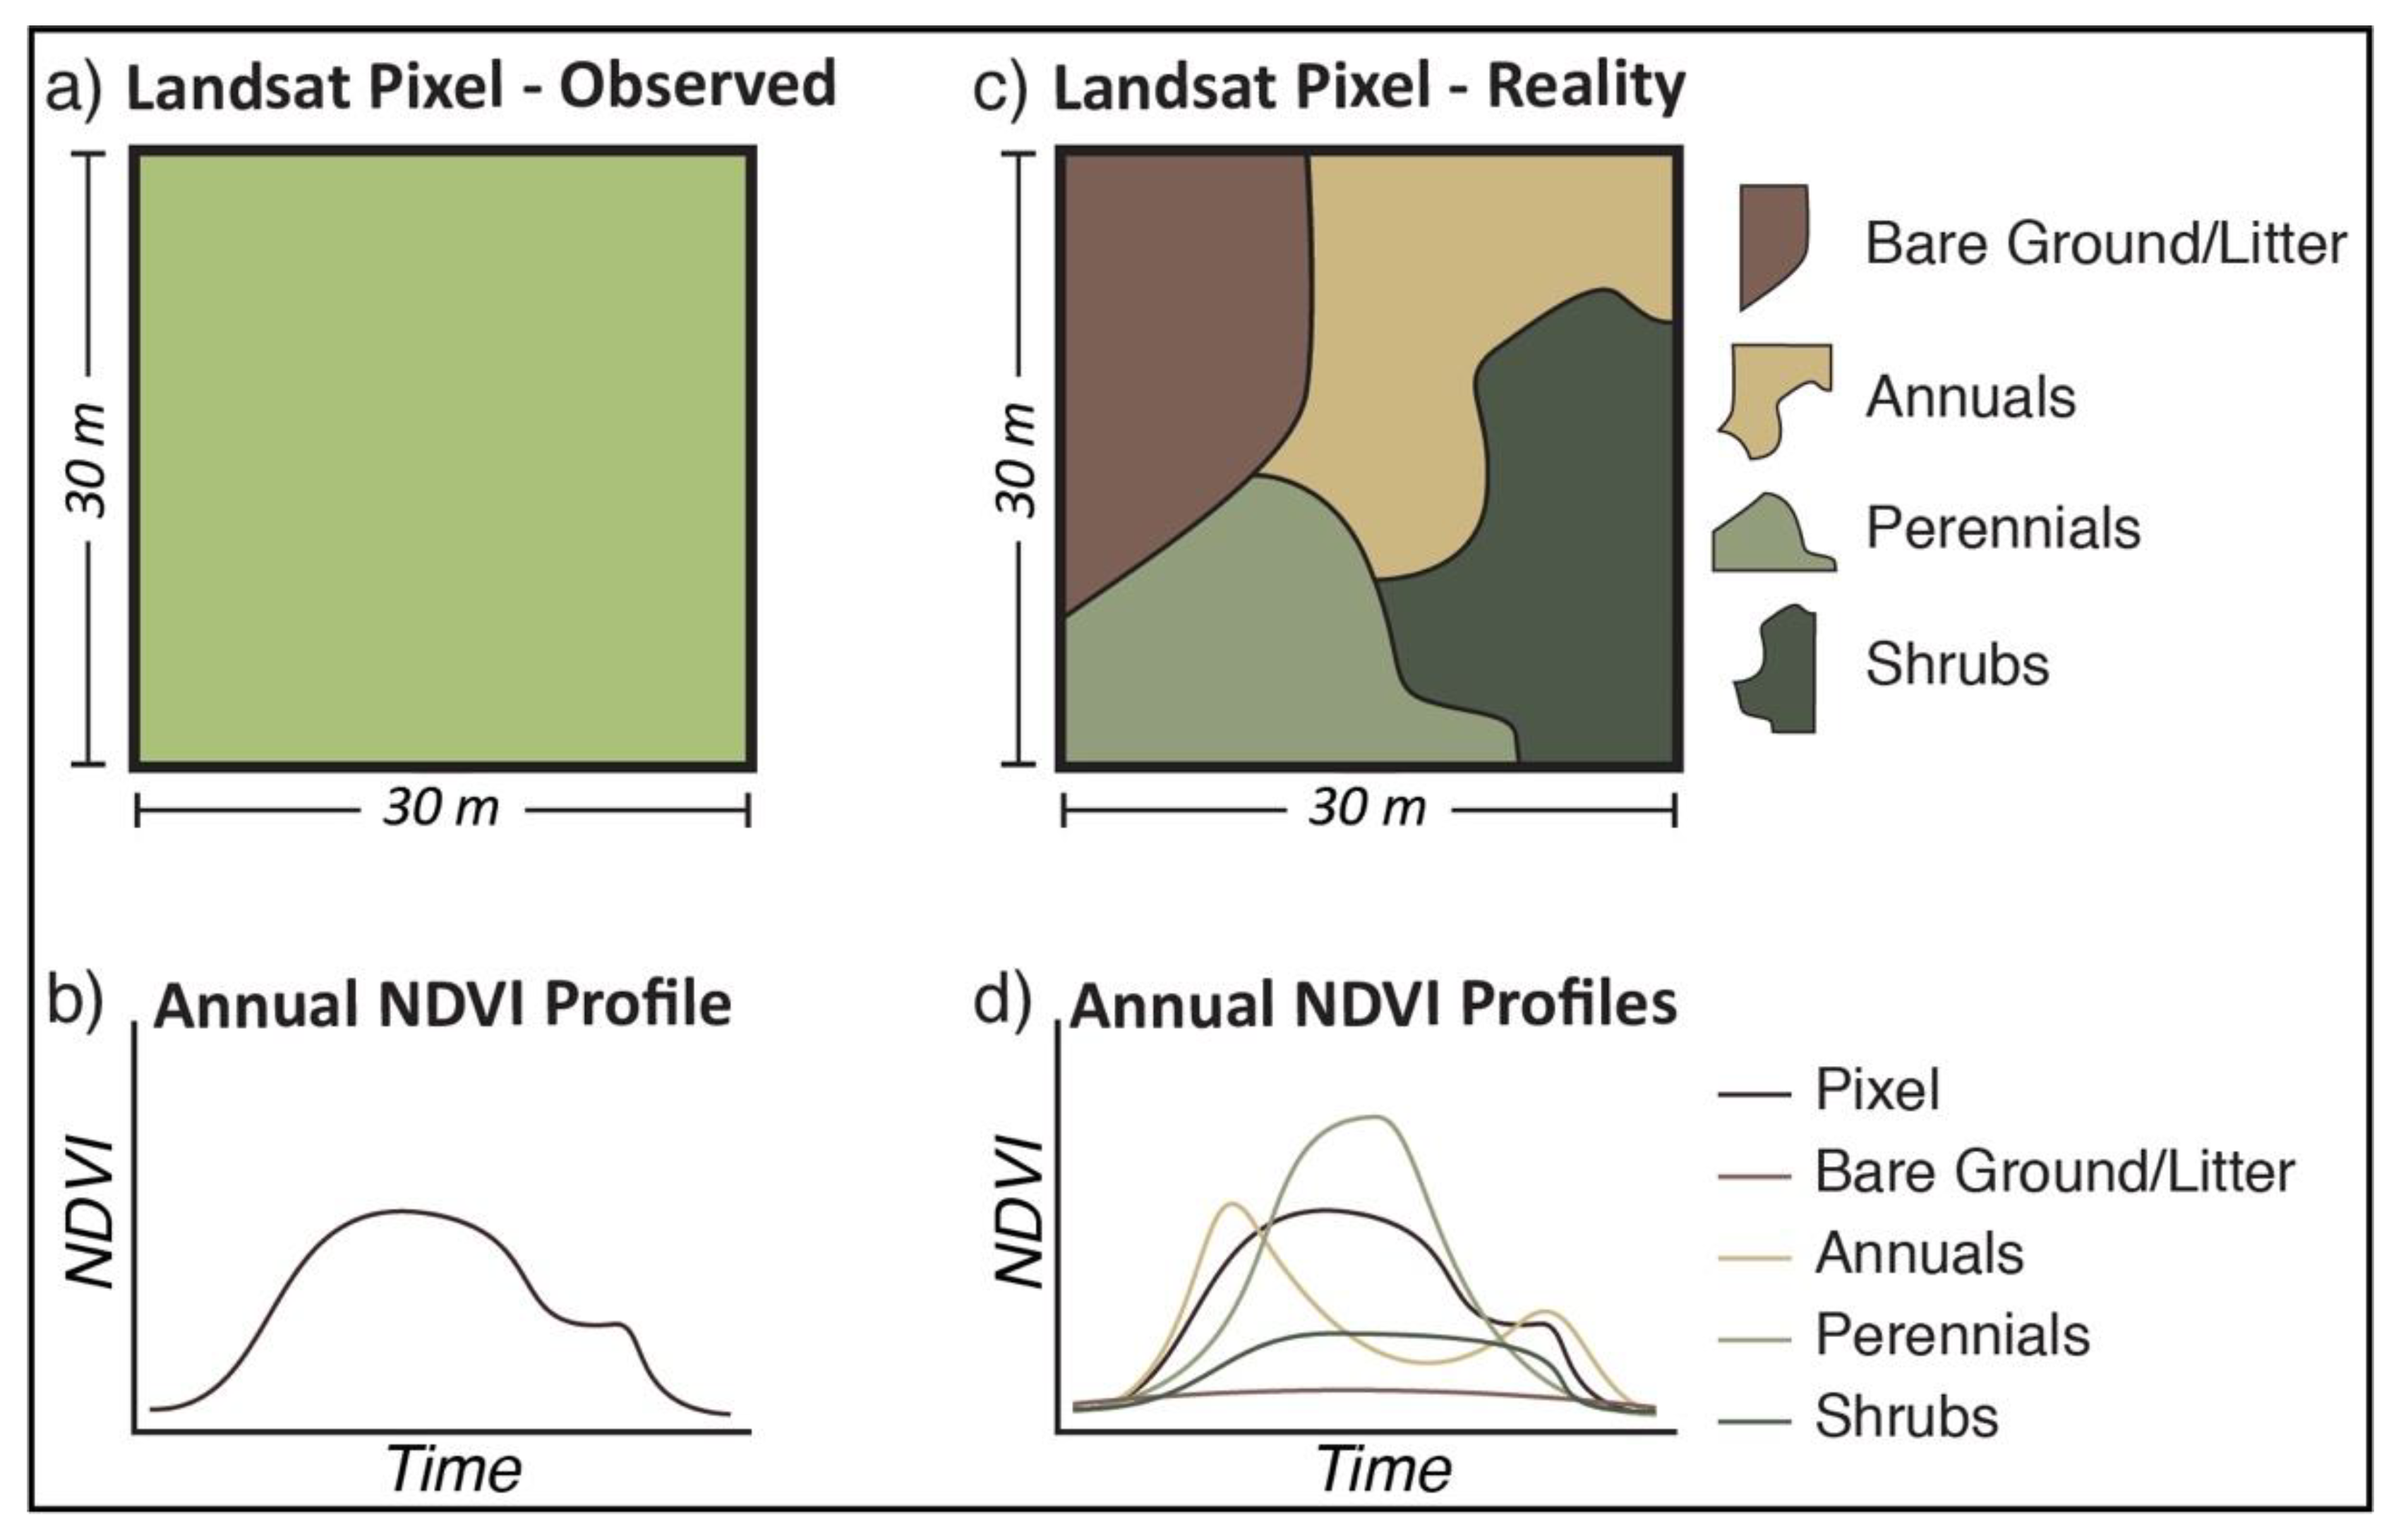
Figure 2.
Conceptual differences between observed Landsat NDVI for a single pixel (a) and the subsequent phenological profile throughout a year (b), and a disaggregated pixel (c) with unique phenological profiles for each PFT (d). The pixel level NDVI for any point in time is a function of both the fractional area of the representative PFTs and their phenological state.

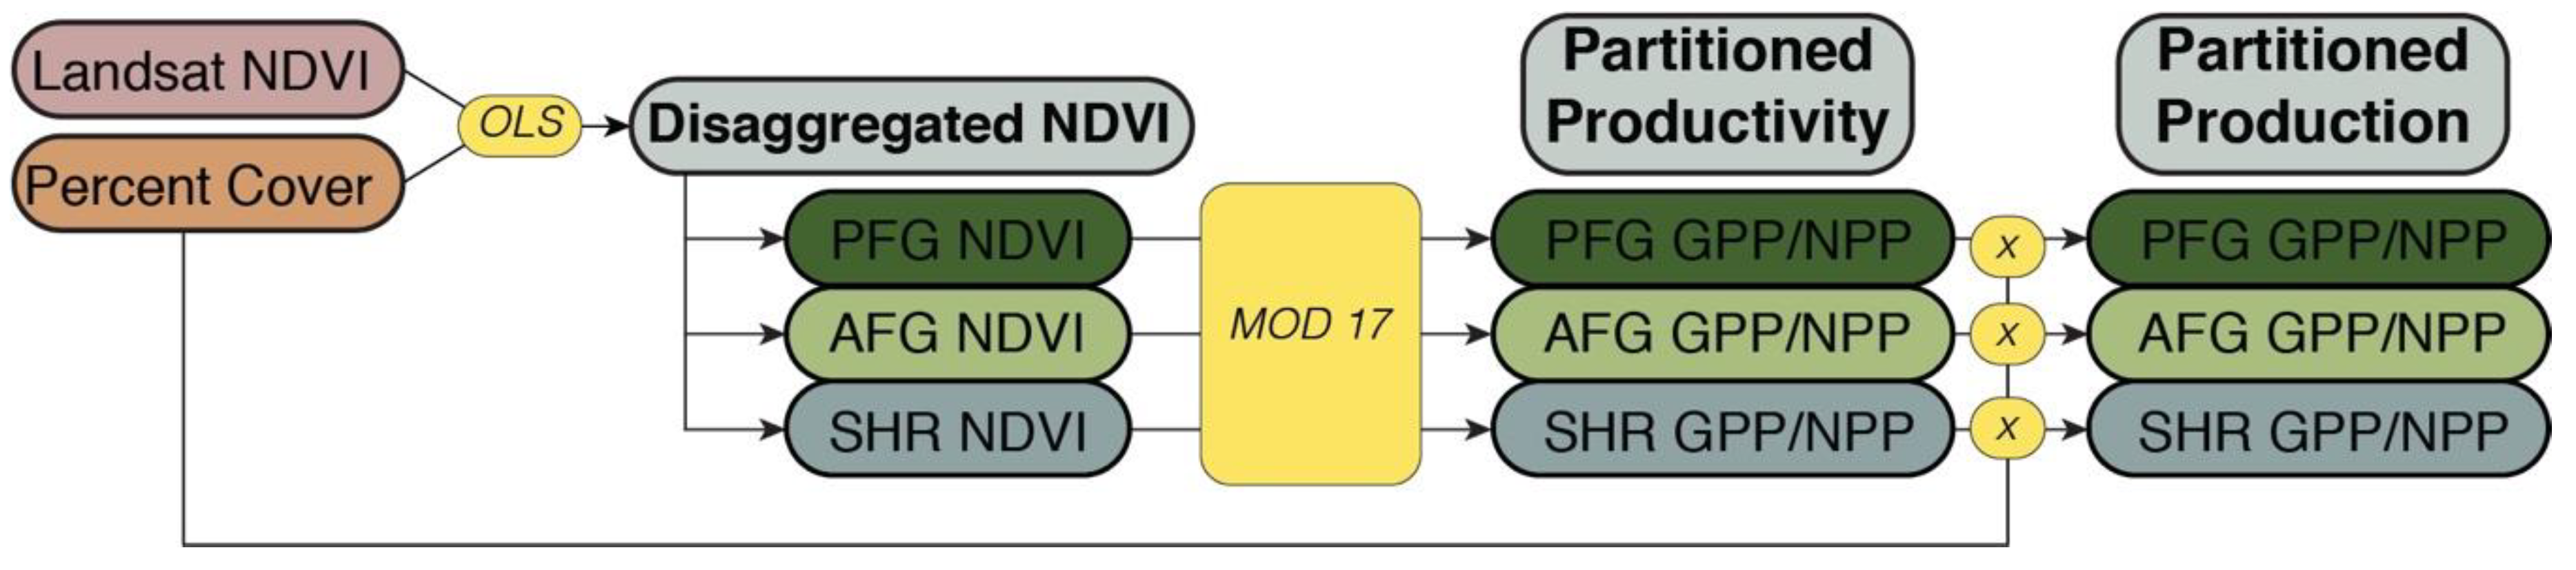
Figure 3.
Flow chart of the methodological steps to calculate partitioned gross primary production (GPP) and net primary production (NPP) by integrating the Landsat NDVI composite product and the annual plant functional type (PFT) percent cover dataset for perennial forbs and grasses (PFG), annual forbs and grasses (AFG) and shrubs.

Figure 4.
Results of the NDVI disaggregation (a1,b1,c1,d1), GPP partitioning (a2,b2,c2,d2), and NPP partitioning (a3,b3,c3,d3) from four example sites across western US rangelands. The red line/bar represent the pixel results before NDVI disaggregation and GPP/NPP partitioning. For each example site, results are for a single pixel for the year 2017. The NLCD classification, pixel coordinates and the PFT breakdown are shown.

© 2019 by the authors. Licensee MDPI, Basel, Switzerland. This article is an open access article distributed under the terms and conditions of the Creative Commons Attribution (CC BY) license (http://creativecommons.org/licenses/by/4.0/).
Share and Cite
MDPI and ACS Style
Robinson, N.P.; Jones, M.O.; Moreno, A.; Erickson, T.A.; Naugle, D.E.; Allred, B.W. Rangeland Productivity Partitioned to Sub-Pixel Plant Functional Types. Remote Sens. 2019, 11, 1427. https://doi.org/10.3390/rs11121427
AMA Style
Robinson NP, Jones MO, Moreno A, Erickson TA, Naugle DE, Allred BW. Rangeland Productivity Partitioned to Sub-Pixel Plant Functional Types. Remote Sensing. 2019; 11(12):1427. https://doi.org/10.3390/rs11121427
Chicago/Turabian StyleRobinson, Nathaniel P., Matthew O. Jones, Alvaro Moreno, Tyler A. Erickson, David E. Naugle, and Brady W. Allred. 2019. "Rangeland Productivity Partitioned to Sub-Pixel Plant Functional Types" Remote Sensing 11, no. 12: 1427. https://doi.org/10.3390/rs11121427
Note that from the first issue of 2016, this journal uses article numbers instead of page numbers. See further details here.