Article

Accuracy Evaluation and Consistency Analysis of Four Global Land Cover Products in the Arctic Region

1
State Key Lab of Resources and Environmental Information System, Institute of Geographic Sciences and Natural Resources Research, Chinese Academy of Sciences, Beijing 100101, China
2
University of Chinese Academy of Sciences, Beijing 100049, China
*
Author to whom correspondence should be addressed.
Remote Sens. 2019, 11(12), 1396; https://doi.org/10.3390/rs11121396
Submission received: 6 May 2019 / Revised: 2 June 2019 / Accepted: 4 June 2019 / Published: 12 June 2019
(This article belongs to the Section Environmental Remote Sensing)

Abstract

:
Land cover is a fundamental component of crucial importance in the earth sciences. To date, many excellent international teams have created a variety of land cover products covering the entire globe. To provide a reference for researchers studying the Arctic, this paper evaluates four commonly used land cover products. First, we compare and analyze the four land cover products from the perspectives of land cover type, distribution and spatial heterogeneity. Second, we evaluate the accuracy of such products by using two sets of sample points collected from the Arctic region. Finally, we obtain the spatial consistency distribution of the products by means of superposition analysis. The results show the following: (a) among the four land cover products, Climate Change Initiative Land Cover (CCI-LC) has the highest overall accuracy (63.5%) in the Arctic region, GlobeLand30 has an overall accuracy of 62.2% and the overall accuracy of the Global Land Cover by the National Mapping Organization (GLCNMO) is only 48.8%. When applied in the Arctic region, the overall accuracy of the Moderate Resolution Imaging Spectroradiometer (MODIS) is only 29.5% due to significant variances. Therefore, MODIS and GLCNMO are not recommended in Arctic-related research as their use may lead to major errors. (b) An evaluation of the consistency of the four products indicates that the classification of the large-scale homogeneous regions in the Arctic yields satisfactory results, whereas the classification results in the forest–tundra ecotone are unsatisfactory. The results serve as a reference for future research. (c) Among the four products, GlobeLand30 is the best choice for analyzing finely divided and unevenly distributed surface features such as waters, urban areas and cropland. Climate Change Initiative Land Cover (CCI-LC) has the highest overall accuracy, and its classification accuracy is relatively higher for forests, shrubs, sparse vegetation, snow/ice and water. GlobeLand30 and CCI-LC do not vary much from each other in terms of overall accuracy. They differ the most in the classification accuracy of shrub-covered land; CCI-LC performed better than GlobeLand30 in the classification of shrub-covered land, whereas the latter obtained higher accuracy than that of the former in the classification of urban areas and cropland.

1. Introduction

Land cover refers to surface coverings such as natural and artificial vegetation and buildings that can be observed directly or by remote sensing; it is the key component for studying Earth system processes [1].
The Arctic is one of the most critical regions of the global system, with a land area of approximately 8 million square kilometers, comprising 1/18 of Earth’s land area. Rich in species diversity, this region contains approximately one-fourth of Earth’s surface vegetation [2], one-third of Earth’s carbon pools and a large variety of species [3]. The vast tundra, widespread wetlands and boundless glaciers in the Arctic Circle play an important role in the global carbon and water cycles. Accompanying the continuous warming of Earth’s climate, Arctic temperatures have increased approximately 2 °C in the past 30 years; this increase is twice as much as that in other regions [4]. Dramatic climate change, coupled with the Arctic’s fragile ecological environment [5], has caused and will continue to cause diverse changes in this key region, such as the northward movement of the tree-line [6,7,8,9], shrub expansion [10,11,12,13] and changes to inland waters [14,15,16,17]. It is evident that some foreseeable changes in Arctic land cover will occur. The relationship between land cover and climate change has never been unidirectional, and changes in Arctic land cover are certain to produce global climate change feedback [18,19,20]. Therefore, an accurate and deep understanding of Arctic land cover is important for evaluating the carbon cycle, assessing climate change impacts, effectively protecting the Arctic’s ecological environment and utilizing the region’s resources.
The circum-Arctic vegetation map (CAVM), the first land cover dataset created specifically for the Arctic, was produced and published by Walker et al. [21,22]. CAVM is based on advanced very high-resolution radiometer (AVHRR) data and some auxiliary land surface information. CAVM classifies Arctic landcover into 20 categories according to the vegetation community characteristics, providing information that has proven very helpful in many studies [23]. However, AVHRR only covers the area north of the tree-line, and the spatial resolution is only 1 km, making it difficult to capture the heterogeneity of the Arctic land cover [24]. In addition to the CAVM, there are regional studies on land cover in the Arctic, including the Alaskan North Slope [25], Scandinavia and the Lena Delta [26]. These studies have achieved their goals within the respective regions, but they fail to identify problems for the entire Arctic region.
As remote sensing and geographical information system (GIS) technologies further develop, researchers worldwide have produced a number of global-scale land cover products using remote sensing images as data sources. As of 2018, there were more than 20 sets of freely available land cover data products at the global and regional scale (Table 1 including nine commonly used products). These global land cover products all include the Arctic region, presenting the overall land cover characteristics of the Arctic region to a certain extent. However, due to the different data, classification systems and classification methods used in various datasets, some inevitable differences exist. Confronted with numerous land cover datasets and the differences between them, users and researchers must select the right dataset for their own purposes. The suitability is reflected not only in the overall accuracy but also in the classification system and other characteristics of the dataset.
In most cases, the overall accuracy is considered for various global land cover datasets and is 66.9% for the International Geosphere-Biosphere Program (IGBP) DISCover [27], 68.6% for Global Land Cover (GLC) 2000 [28], 78.3% for MCD12Q1 2010 [1], 77.9% for GLC by the National Mapping Organization (GLCNMO) 2008 [29], 73.2% for Climate Change Initiative Land Cover (CCI-LC) [30], 64.9% for Fine Resolution Observation and Monitoring of GLC (FROM-GLC) [31] and 80.3% for GlobeLand30 [32]. To some extent, the overall accuracy does reflect the overall quality of the dataset. However, users should also note the following two problems when considering the overall accuracy. First, as different evaluation systems and methods are used for different datasets during the accuracy evaluation, it is meaningless to directly compare the overall accuracy of the datasets. Second, overall accuracy represents the global scale. Due to regional differences, when evaluating a specific study area, confidence in the overall accuracy may be further reduced. Therefore, when users use these global land cover products to solve problems in a specific region, it is necessary to conduct specific analysis and an evaluation of each dataset.
Some international studies involve the comparative evaluation of global land cover products [33,34,35], such as adopting the indirect method of obtaining consistency between datasets by comparing various land cover datasets and reference datasets. Armel Thibaut [36] compared four datasets—GLC2000, GlobCover, Moderate Resolution Imaging Spectroradiometer (MODIS) and ECOCLIMAP—of the African continent. Kuenzer [37] also compared four datasets—UMD, GLC2000, GlobCover and MODIS land cover—in the Mekong River Basin. Bai [38] used the 2005 Geodata Land Cover Dataset (GLCD-2005) as the reference data to evaluate the consistency of these four datasets in Chinese regions. Moreover, some researchers collected verification points to directly evaluate dataset accuracy. For example, Yang [39] evaluated the accuracy of nine global land cover datasets in China. However, to date, studies that include the evaluation and comparison of land cover products for the Arctic are limited, and only a small number of studies have involved portions of the Arctic region. For example, Krankina et al. [40] evaluated the northern section of the Eurasian continent, including the Arctic region. A recent review of the progress of land cover studies in northern high latitudes also compared several regional- or global-scale land cover products that included the Arctic, but the comparison only involved basic data such as resolution, classification methods and land cover types [41].
In order to gain a comprehensive and accurate understanding of those land cover products’ consistency and accuracy in the Arctic, the following research objectives are proposed: (1) For each land cover type, compare the similarities and differences of the area and spatial distribution among land cover products, and analyze their inherent relation with classification methods and data resources; (2) obtain the spatial distribution of consistency and discrepancies of land cover products, and try to catch the feature of Arctic land cover classification; (3) directly evaluate land cover datasets encompassing the entire Arctic Circle via verification points to obtain a more objective and accurate understanding of the overall accuracy of a variety of products and the various land cover types they assess. The results will serve as a reference for future studies in the Arctic region and lay the foundation for more precise and accurate land cover mapping in the Arctic.

2. Materials and Methods

2.1. Data Set Selection

The detailed parameters of each dataset are presented in Table 1. Among the several commonly used global land cover data sources, the UMD [42], IGBP DIScover [43] and GLC2000 [44] land cover products were developed many years ago with a resolution of 1 km. They use unsupervised classification and their overall accuracy is relatively low. As a result, the three land cover datasets are not involved in the comparative analysis. CCI-LC [45] and GlobCover [46] are homologous products produced by the European Space Agency (ESA) for two different projects, each created with MEdium Resolution Imaging Spectrometer (MERIS) images, identically processed and classified in their early stages of development. Therefore, the more developed CCI-LC product is selected for use in this study. FROM-GLC [31] and GlobeLand30 [32] were both designed to establish a global land cover classification map with 30-m resolution. However, the FROM-GLC map is not based on the interpretation of Landsat images from a single year but the 20-year LANDSAT (1981–2011) dataset, making it extremely difficult to properly compare FROM-GLC and other products created using images of a specific year. Moreover, FROM-GLC applies the classic support vector machine method to supervise and classify images; however, the accuracy of the results (only 64.9%) is unsatisfactory. Furthermore, FROM-GLC only has one product, which also limits the function of FROM-GLC in practical applications. GlobeLand30 uses a more advanced pixel-object-knowledge-based (POK-based) approach with an overall accuracy of 80.3% and includes plans for continued updates. In summary, in our comparison and evaluation of the Arctic land cover, we selected the following four data systems: GLNMO 2008, MCD12Q1 2010, CCI-LC 2010 and GlobeLand30 2010. The GLNMO series data products were developed by the International Steering Committee for Global Mapping (ISCGM) Secretariat in collaboration with the Geospatial Information Authority of Japan (GSI), Chiba University and the National Geospatial Information Authorities (NGIAs) in different countries and regions. The dataset contains three years of land cover data produced on the basis of MODIS images captured in 2003, 2008 and 2013. This study used the data from 2008 for comparison. The MCD12Q1 series datasets were produced by scientists at Boston University for the MODIS land science team of the National Aeronautics and Space Administration’s (NASA’s) Earth Observing System (EOS), including the annual global land cover data from 2001 until the latest update completed in 2013. This study compared data from 2010 and selected products based on the IGBP classification system.

2.2. Method

At present, two methods are used to evaluate the classification accuracy of land cover products: (1) comparing land cover products with other recognized land products with higher confidence and overall accuracy; and (2) using geostatistics methods to evaluate land cover products. Both methods have their own advantages, thus, we used a mutual verification method to study the land cover in the Arctic during the comparative evaluation.

2.2.1. Reconciling the Map Legends

The land cover classification system is a fundamental and critical tool. It affects both the expression of classification results and the application fields of classification data. Through land cover classification, one can not only understand the basic attributes of various types of land cover but also the regional structure and distribution characteristics of land use/land cover, laying the foundation for further analysis of regional differences as land cover changes.
The classification systems of the four land cover datasets used in the study are not identical. CCI-LC and GLCNMO, based on the Land Cover Classification System (LCCS) method, classify land cover into 22 and 20 types, respectively; Moderate Resolution Imaging Spectroradiometer Land Cover (MODIS-LC), based on the IGBP system, classifies land cover into 16 types; and GlobeLand30 classifies land cover into 10 types, based on the spectral and textural characteristics of surface features. Therefore, a critical step—the integration and transformation of the classification system—is required to compare these datasets. Because this process directly affects the accuracy and reference values of our follow-up work, the following two principles must be followed: the first is to ensure the accuracy of the integration and transformation process, during which the land cover types with similar definitions are integrated and transformed according to the original definitions of various land cover types in each classification system; the second is to ensure that the integrated classification system is highly compatible and practicable, thus providing a straightforward reference for subsequent study.
The LCCS has obtained more and more applications in the fields of global land cover classification due to its openness and flexibility, meanwhile, both CCI-LC and GLCNMO products are classified using the LCCS method, and the integration and transformation of the classification systems by the LCCS method can ensure the accuracy of the integration. Therefore, the LCCS level used integrated and transformed the classification system into nine classes: forests, shrubs, herbaceous cover, wetlands, croplands, sparse vegetation, artificial surfaces, waters and permanent snow/ice(original type is assigned to the target legend according to Table 2.). It is worth noting that during the integration process of the classification system, due to the inclusion of GlobeLand30, we limited the number of classified types of the other three products, resulting in the loss of some existing information. However, considering the overall characteristics of the land cover in the Arctic, these losses are entirely acceptable. First, “forest”, being the most intensely integrated class, is not further classified according to tree leaf type and whether trees are deciduous. Since the Arctic is located in a frigid zone, forest types are determined to be monotonous, and forest types other than coniferous are unlikely to appear during natural evolution. Based on the proportion of forests in the various land cover products, the proportion of broad-leaved forests is only approximately 1%. Therefore, simplification of this new forest classification type is scientifically feasible. In addition, the new classification also omits bare ground cover. Due to the relatively small number of human activities in the Arctic and the abundant surface water, the area of bare ground is very small in the Arctic. Although both the GLCNMO and GlobeLand30 classification systems contain barren land cover, its proportion is as low as approximately 0.4%. Therefore, it is also well-founded to integrate barren land into sparse vegetation. The new classification system agrees with the Intergovernmental Panel on Climate Change’s (IPCC’s) proposed land classification system and can be applied to climate change and carbon storage studies provided its strong expansibility. The LCCS’s classification system is also used as a standard in future visual interpretation.

2.2.2. Data Processing

To facilitate comparison and observation, projection conversion and resolution resetting were performed to convert the data into a universal polar stereographic (UPS) Arctic projection. In unifying the spatial resolutions of the four datasets, improper conversion of resolution may result in reduced accuracy or even errors in subsequent data comparisons, therefore, caution is taken. The projection of the four datasets is provided by the World Geodetic System 1984 (WGS84) reference system, therefore, conversion is not required. The spatial resolution of both the MODIS and GLCNMO series in the four datasets is 15 arcseconds, and that of the CCI-LC series is 10 arcseconds. These three low-resolution products divide grid cells into arcseconds, therefore, taking one arcsecond as the unit is the most reasonable and accurate method. After the grid unit is determined, data should be compared using the same grid unit size. Considering accuracy, it is necessary to maintain the arrangement between the original grids as much as possible. It is most reasonable to select a grid size that will divide the original grid into equal cells. Therefore, 5 arcseconds is determined to be the optimum size of the new grid cell, thus dividing the grid unit of GLCNMO and MODIS series data into nine parts and that of CCI-LC into four parts; this outcome is considered to be very suitable. For the GlobeLand30 data with the highest spatial resolution of 30 m, special rules are introduced during resampling to ensure that the grid type with the highest proportion in the resampling process becomes the value of the final grid cell, thus ensuring accuracy in the sampling. In the selection of spatial resolution, not only was accuracy considered, but also rationality. First, the four datasets could not be unified to a maximum spatial resolution of 30 m, which would better reflect the difference between the GlobeLand30 series and the other three datasets, thus making the results more accurate to some extent. However, this grid size almost forces the resampled data to completely discard the original characteristics or even deviate from the classification criteria of the original products, and thus it is obviously unreasonable. By the same token, the grid size could not be unified to 30 arcseconds either. Therefore, a compromise was made, and the characteristics and classification criteria of the four different datasets were considered while also ensuring accuracy.

2.2.3. Collection of Validation Sample Units

Coupled with the harsh climate and limited number of human inhabitants, field sampling verification throughout the Arctic is an extremely difficult task. Therefore, two sets of sampling points were obtained by combining the results of Google Earth high-definition (HD) images, field visits in some areas and geographic samples shared by Geo-Wiki. Among them, 916/994 sampling points were obtained from the visual interpretation of Google Earth HD images, constituting the majority of all sampling points. The 24 sampling points obtained from field visits were distributed in Iceland and near Tromso and Longyearbyen, Norway. A total of 1017 and 940 sampling points for 30-m and 300-m resolution were obtained, respectively. Although not as accurate as the data obtained from field visits, the information obtained from sampling points using Google Earth HD images possesses the following advantages: (1) Google Earth HD images with high accuracy are highly accessible. Google HD images are a type of reliable data with a spatial error of only 15 ± 5 m [47], which, when used for visual interpretation, can greatly reduce workloads while obtaining reliable sampling points. (2) Sample points may be obtained for the same year as the land cover product. During field sampling, the sample points obtained are the land cover situation of the current year, whereas the land cover products were only obtained for 2010, the time difference of which may result in errors. The timeline of the Google Earth HD images may help minimize this issue by using images captured in approximately 2010 to visually explain the land cover situation of that particular year. (3) Panoramic photos in Google Earth can provide useful auxiliary information. The photos of various locations stored in Google Earth make visual interpretations more accurate; they are even similar to the field sampling results to some extent. The process of sampling and visually interpreting points from Google Earth HD images requires great care because the quality of the sampling points directly affects subsequent evaluations of the accuracy of several products. First, the size of the sampling unit must be considered. The spatial resolutions of the four land cover products are 500 m (MODIS-LC and GLCNMO), 300 m (CCI-LC) and 30 m (GlobeLand30). The same unit size could not be used to verify the spatial resolutions of 500 m and 30 m. Therefore, two sets of units are needed to verify the products with large gaps. Furthermore, the process of obtaining sampling points from HD images and then using these sampling points to evaluate the accuracy of the product is a process of connecting images with the product. When undergoing this process, the existence of inherent spatial errors between the two sets of units must be considered. The sampling unit of Yang et al. was twice the resolution of the land cover product when using Google HD images to verify the land cover in China. This method works well in widely homogeneous areas but it is not applicable in areas where some features are complex and intermixed, such as urban areas, small inland waters and sporadic shrubs in the Arctic. As these features do not appear at some scales, it is easy to ignore or homogenize such features when using this method. This method also has inherent errors and thus it is not suitable for the Arctic region. Unavoidable spatial errors in mapping should also be included as part of the overall errors of the product. Therefore, when determining the sampling unit of the 500-m resolution product, the same grid is used as the product unit for sampling. For the 30-m resolution product, one point is used to illustrate the results of the visual interpretation. Moreover, considering that there is a large deformation of high-latitude areas in the map projection, the area covered by the pixel unit could not be accurately located during the visual interpretation. Thus, a grid corresponding to the pixel unit of the land cover product was created, covering it using Google Earth to determine the exact location of the interpreted unit, to maximize the accuracy.
The specific steps for sampling are as follows: (1) Determine the locations of the sample units using Google Earth, preferably the locations with panoramic photos. Randomly sample in the area without photos, attempting to ensure that the number of sampling points for each land cover type is consistent with the proportion of each type in the source land cover product. (2) Make 500 × 500 m grids that match the source land cover product and trim the grids near the sampling points to obtain a grid that can cover a certain range near the sampling points. (3) Use these grids to cover the Google Earth HD images to ensure that the locations and area of the sample point units match the source land cover product. Note that due to the display scale on Google Earth, the grids covering the entire North Pole could not be displayed at a low viewing angle, and only small-scale grids were able to display the locations of the grids at a higher resolution. It is also the reason why the grids were trimmed near the sampling points. (4) At each sampling point, the land cover type is judged by three experienced land cover experts, who participated in the study in Iceland and Norway. The land cover type unanimously determined by the three experts is considered the final land cover type. The CAVM, the land cover map of Alaska and the European land cover product Corine provided references for visual interpretation. After the experts perform their visual interpretation, a judgment report is produced to record the points that are typical or difficult to distinguish. The report contains four elements: latitude and longitude, feature type, a satellite image and panoramic photo. This report may serve as a reference for reliability evaluations of subsequent sample points and lays a foundation for the more accurate interpretation of subsequent images. (5) Review the sample units. After interpreting the land cover type of the sample units, the samples are sent to the other two land cover experts for inspection and correction. For any discrepancy, the experts again determine the sample type. The sample point collection process for GlobeLand30 is essentially the same as above. The only difference is that in evaluating the 30-m resolution, an easily interpretable point in the sample grid is used as a replacement. Therefore, two land cover verification sets are obtained. When interpreting the sample point types, the same standard is used (i.e., the IPCC’s Class I definition of land cover types). In the subsequent accuracy verification, we verified the accuracy of these land cover products based on the IPCC’s Class I definition, rather than the accuracy evaluated according to the classification criteria of each product; thus, our results and the results of the product’s own verification may be significantly different. However, if the four products are verified using the same method, the comparison results between the products will be clearer, thus providing a useful reference for users.

2.2.4. Spatial Variation in Consistency and Accuracy

To obtain the spatial variation in consistency, the four land cover products are superimposed and analyzed in the pixel-by-pixel correspondence [33], and the results are divided into the following five types:
  • Totally inconsistent areas, implying the classes identified by the four land cover products are all different
  • Lowly consistent areas, implying the classes identified by two of the four land cover products are identical
  • Moderately consistent areas, implying the classes identified by two of the four land cover products are identical and that the classes identified by the other two land cover products are identical
  • Highly consistent areas, implying the classes identified by three of the four land cover products are identical
  • Fully consistent areas, implying the classes identified by the four land cover products are all identical

3. Results

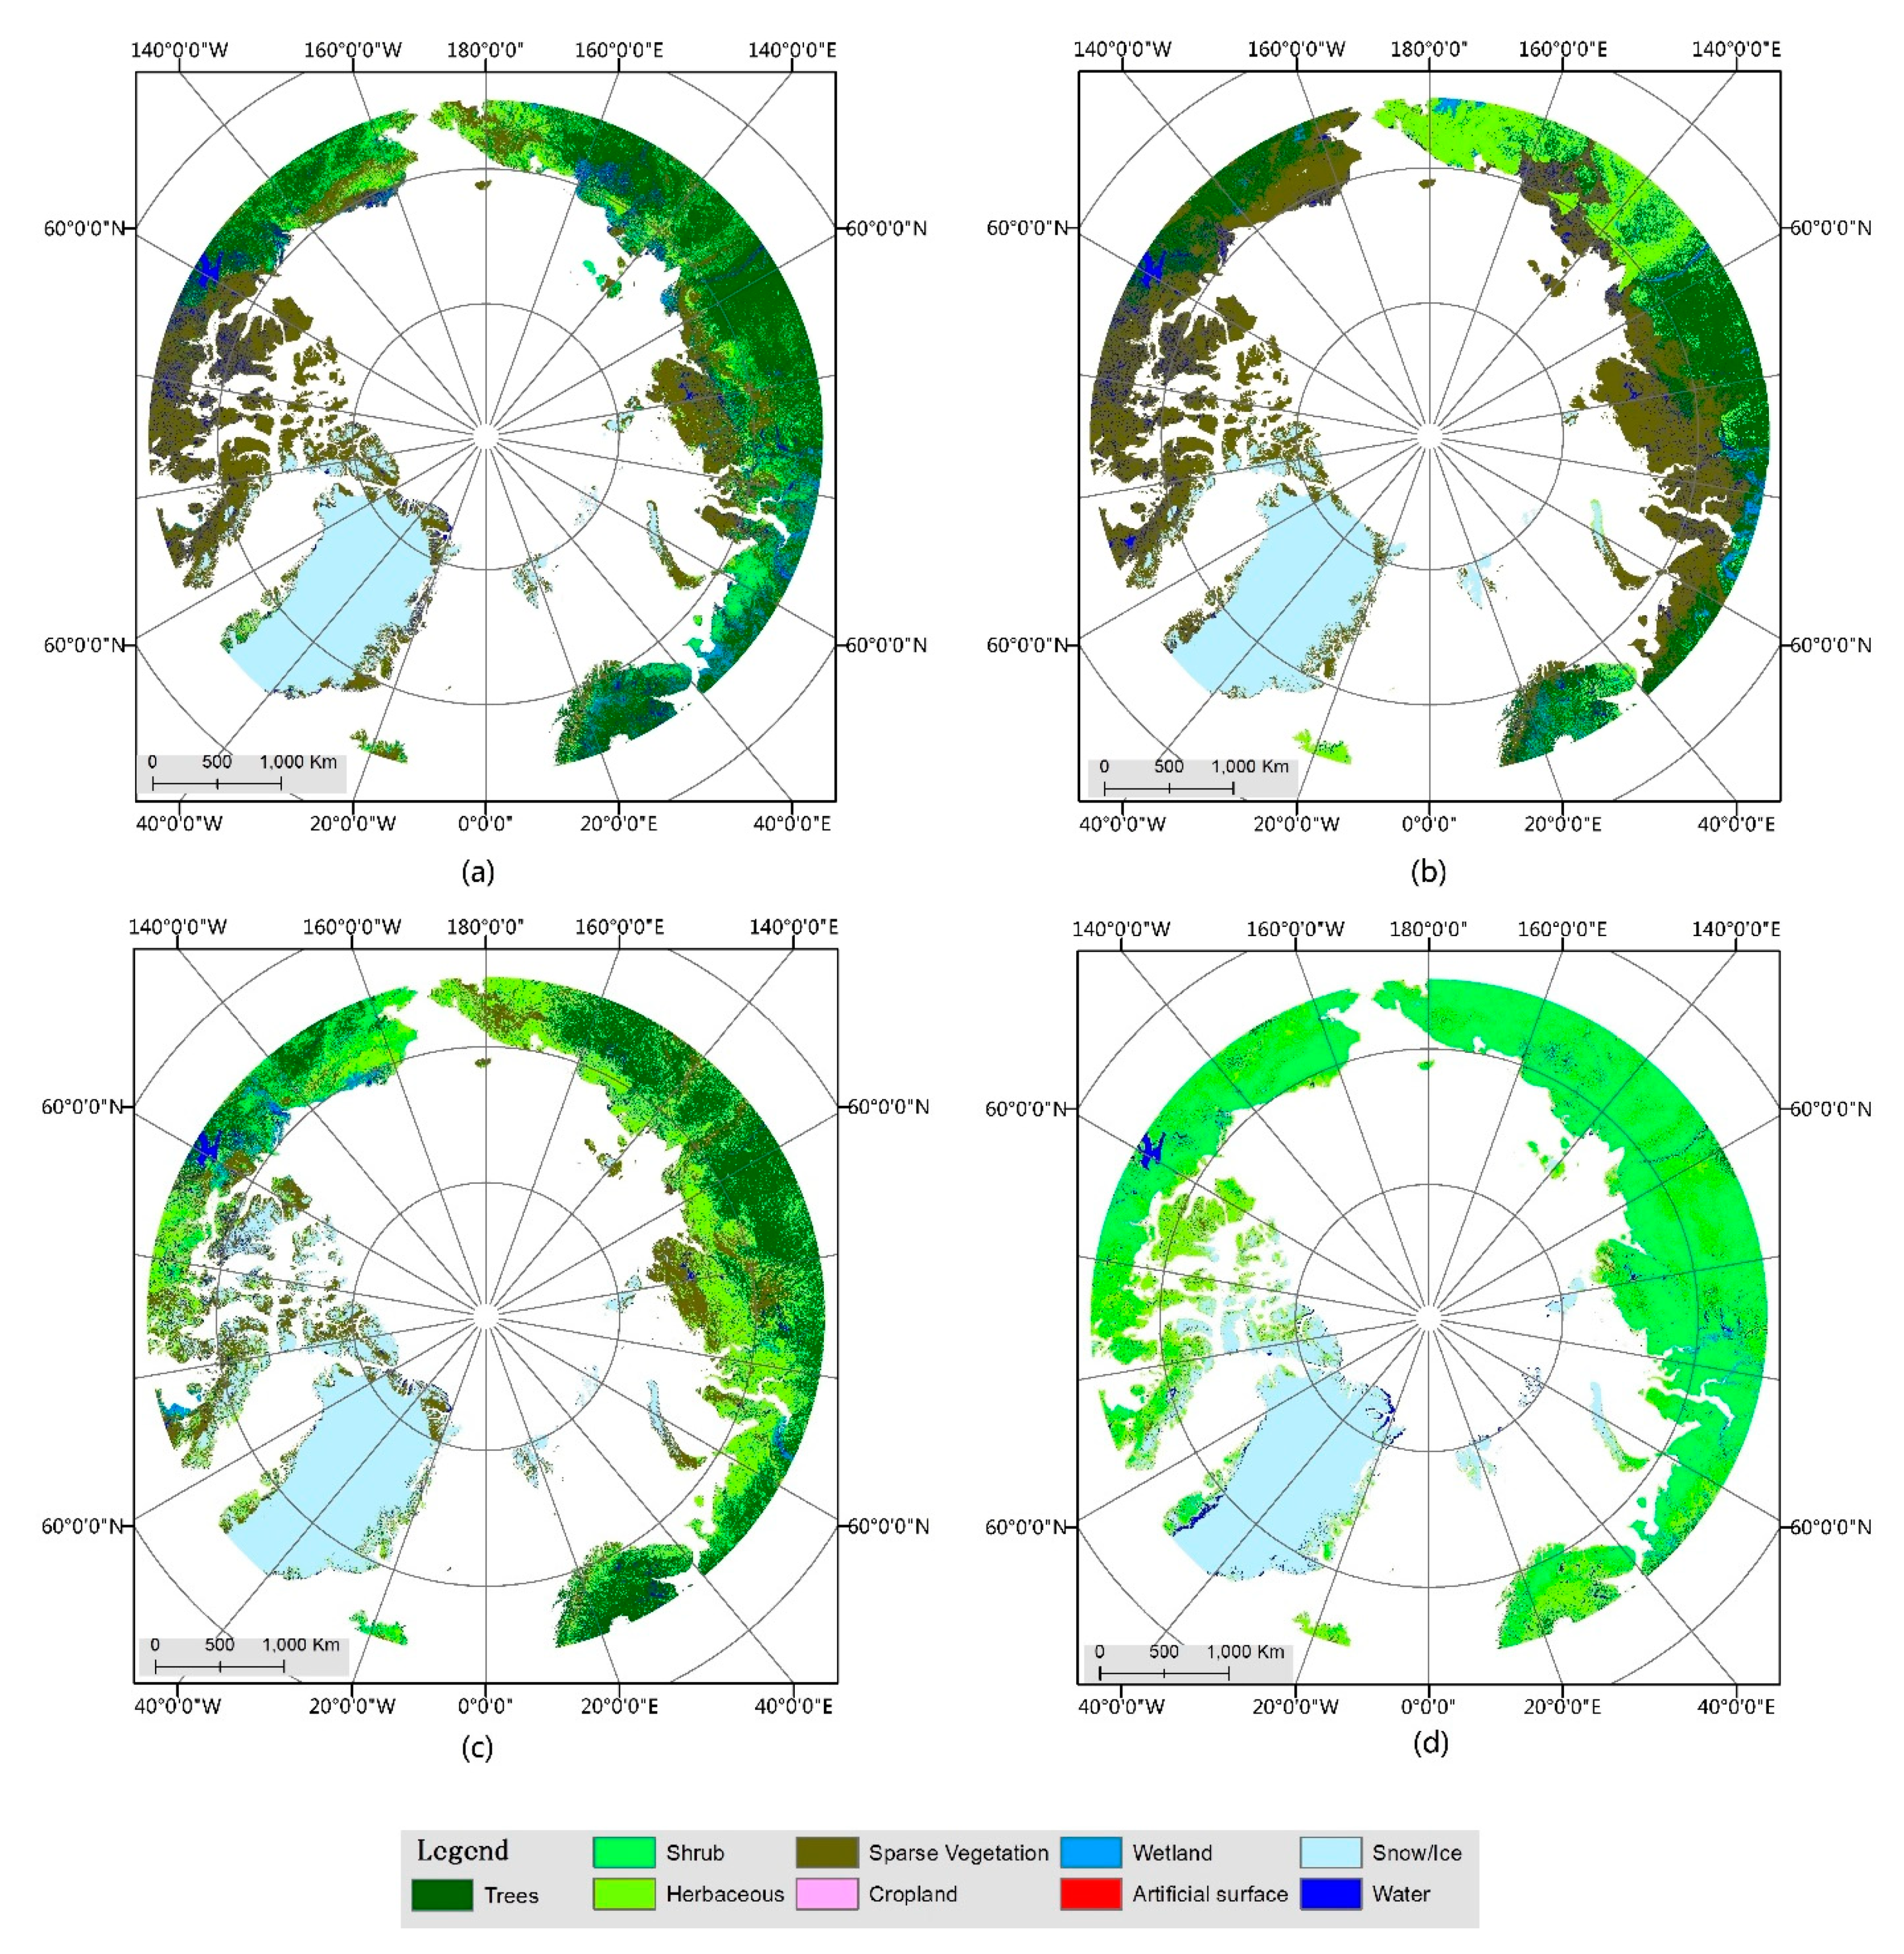
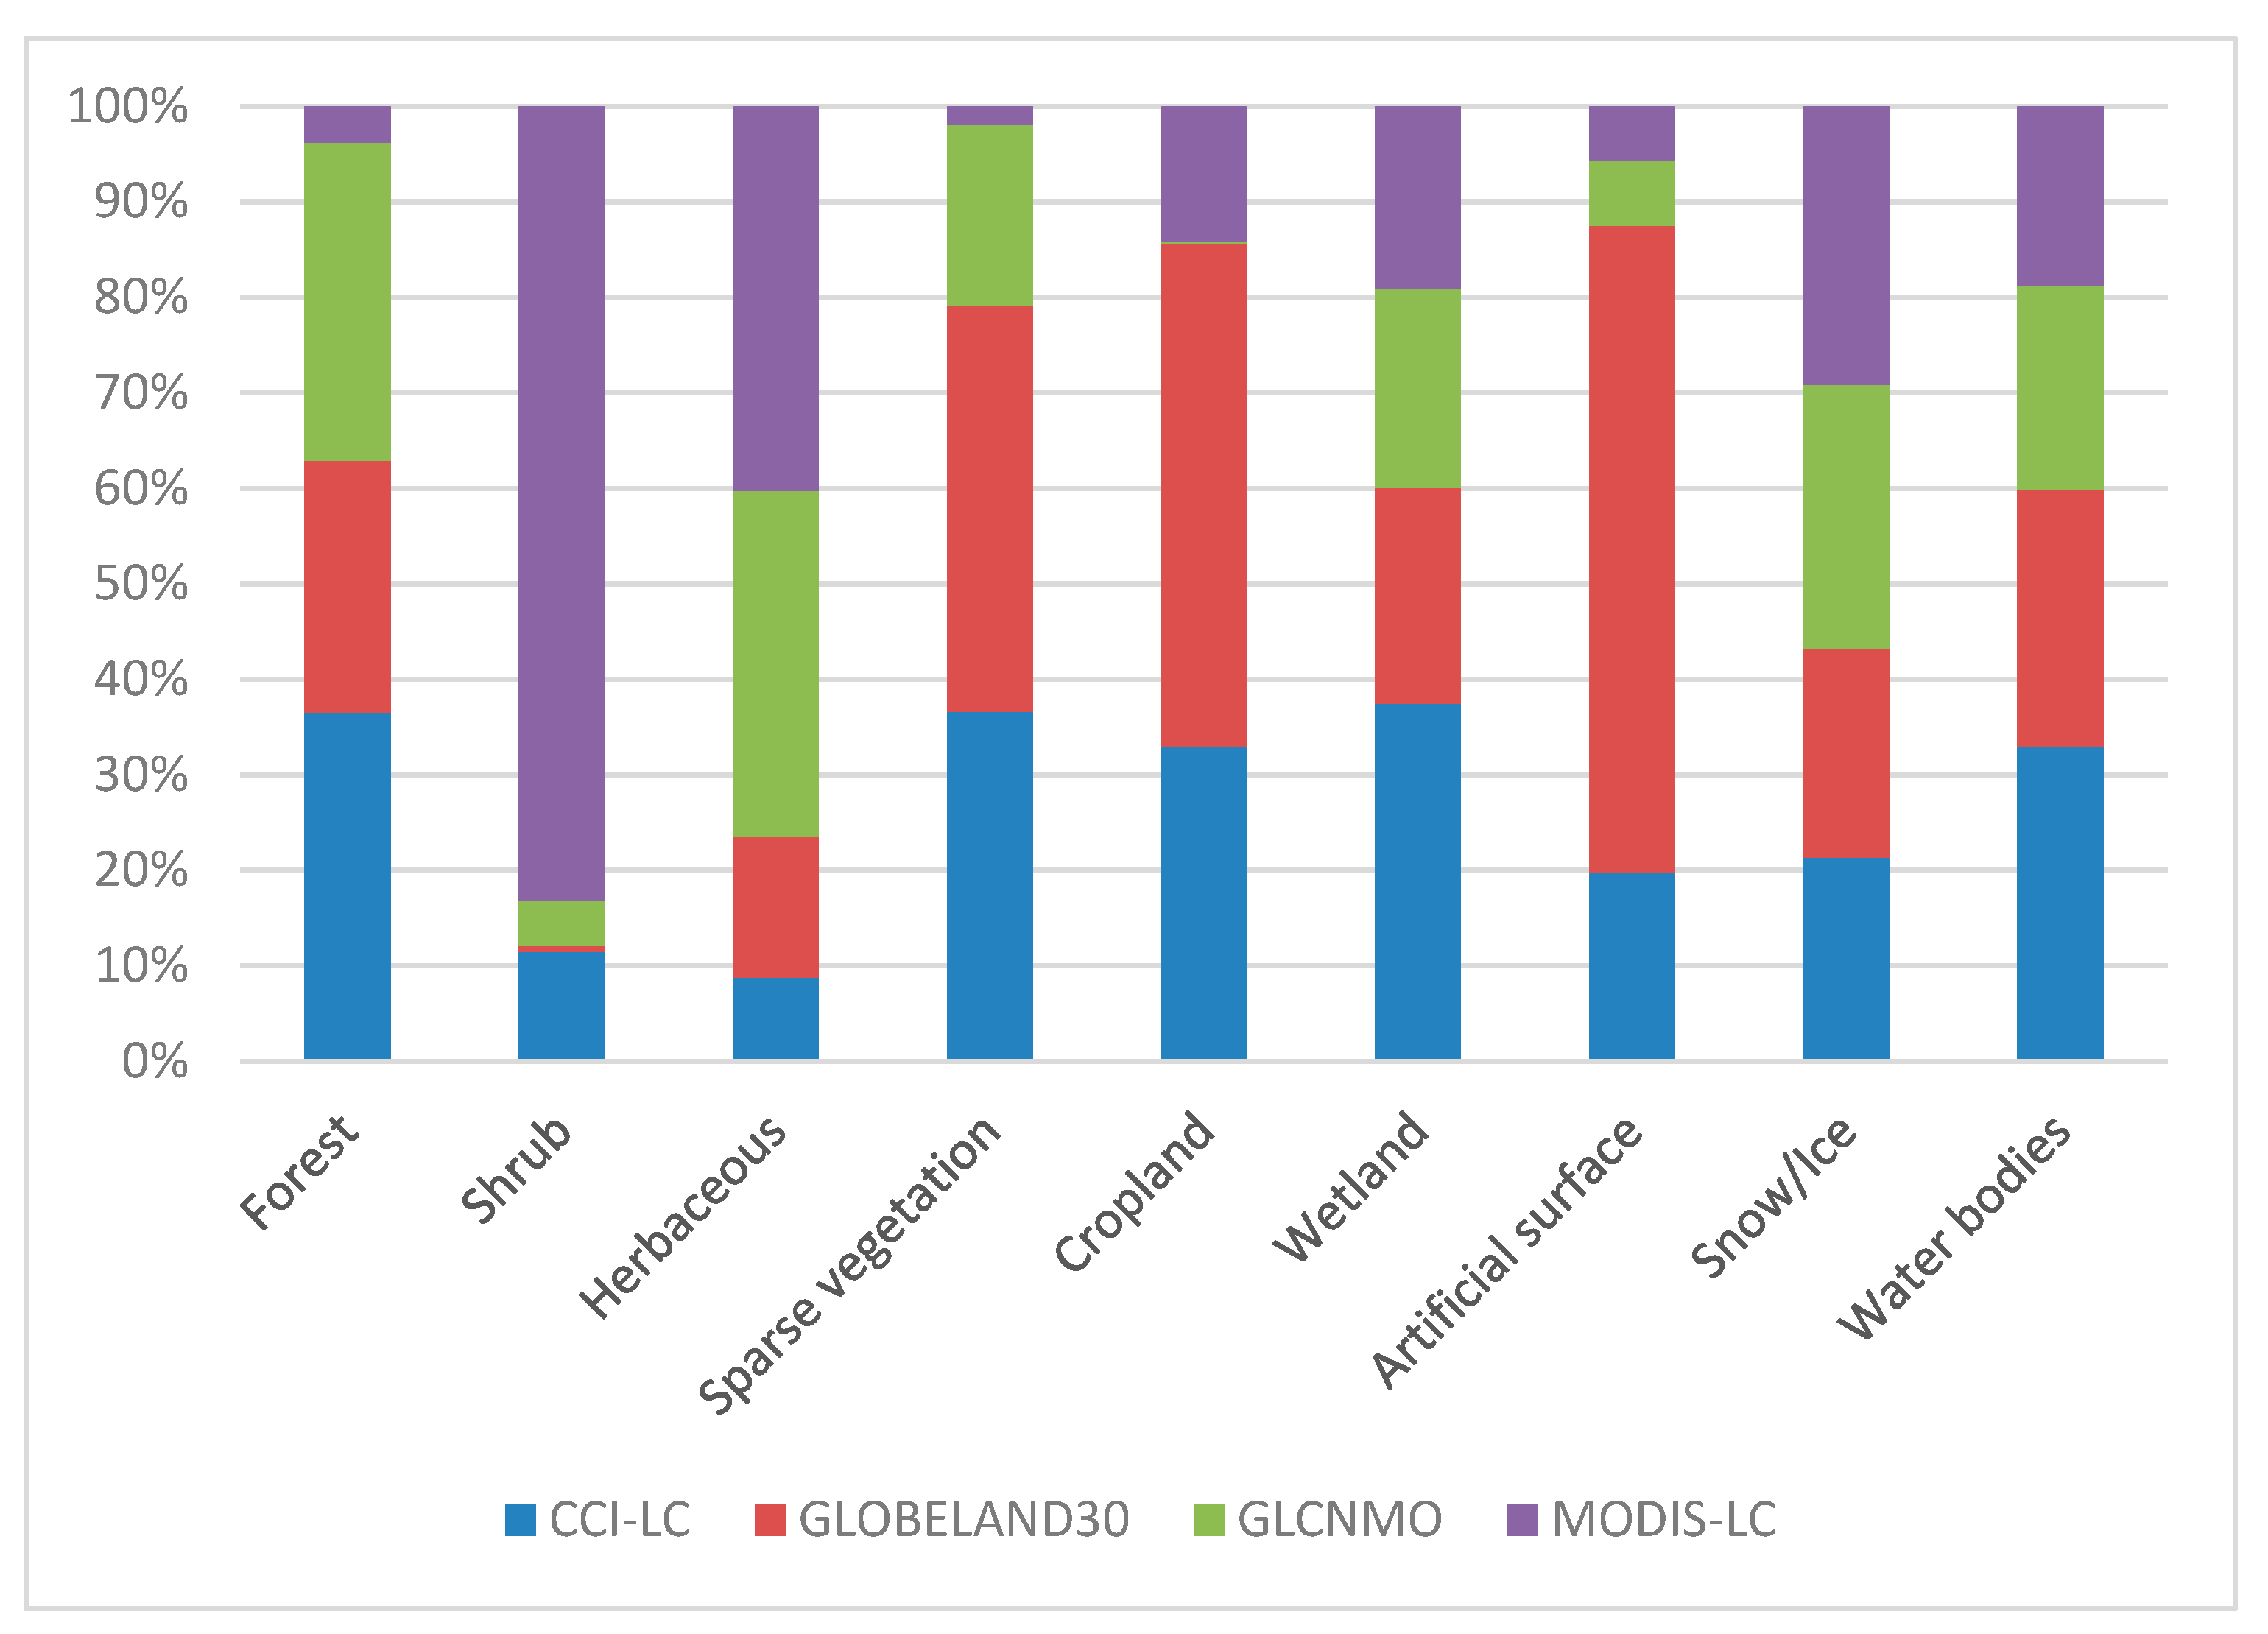
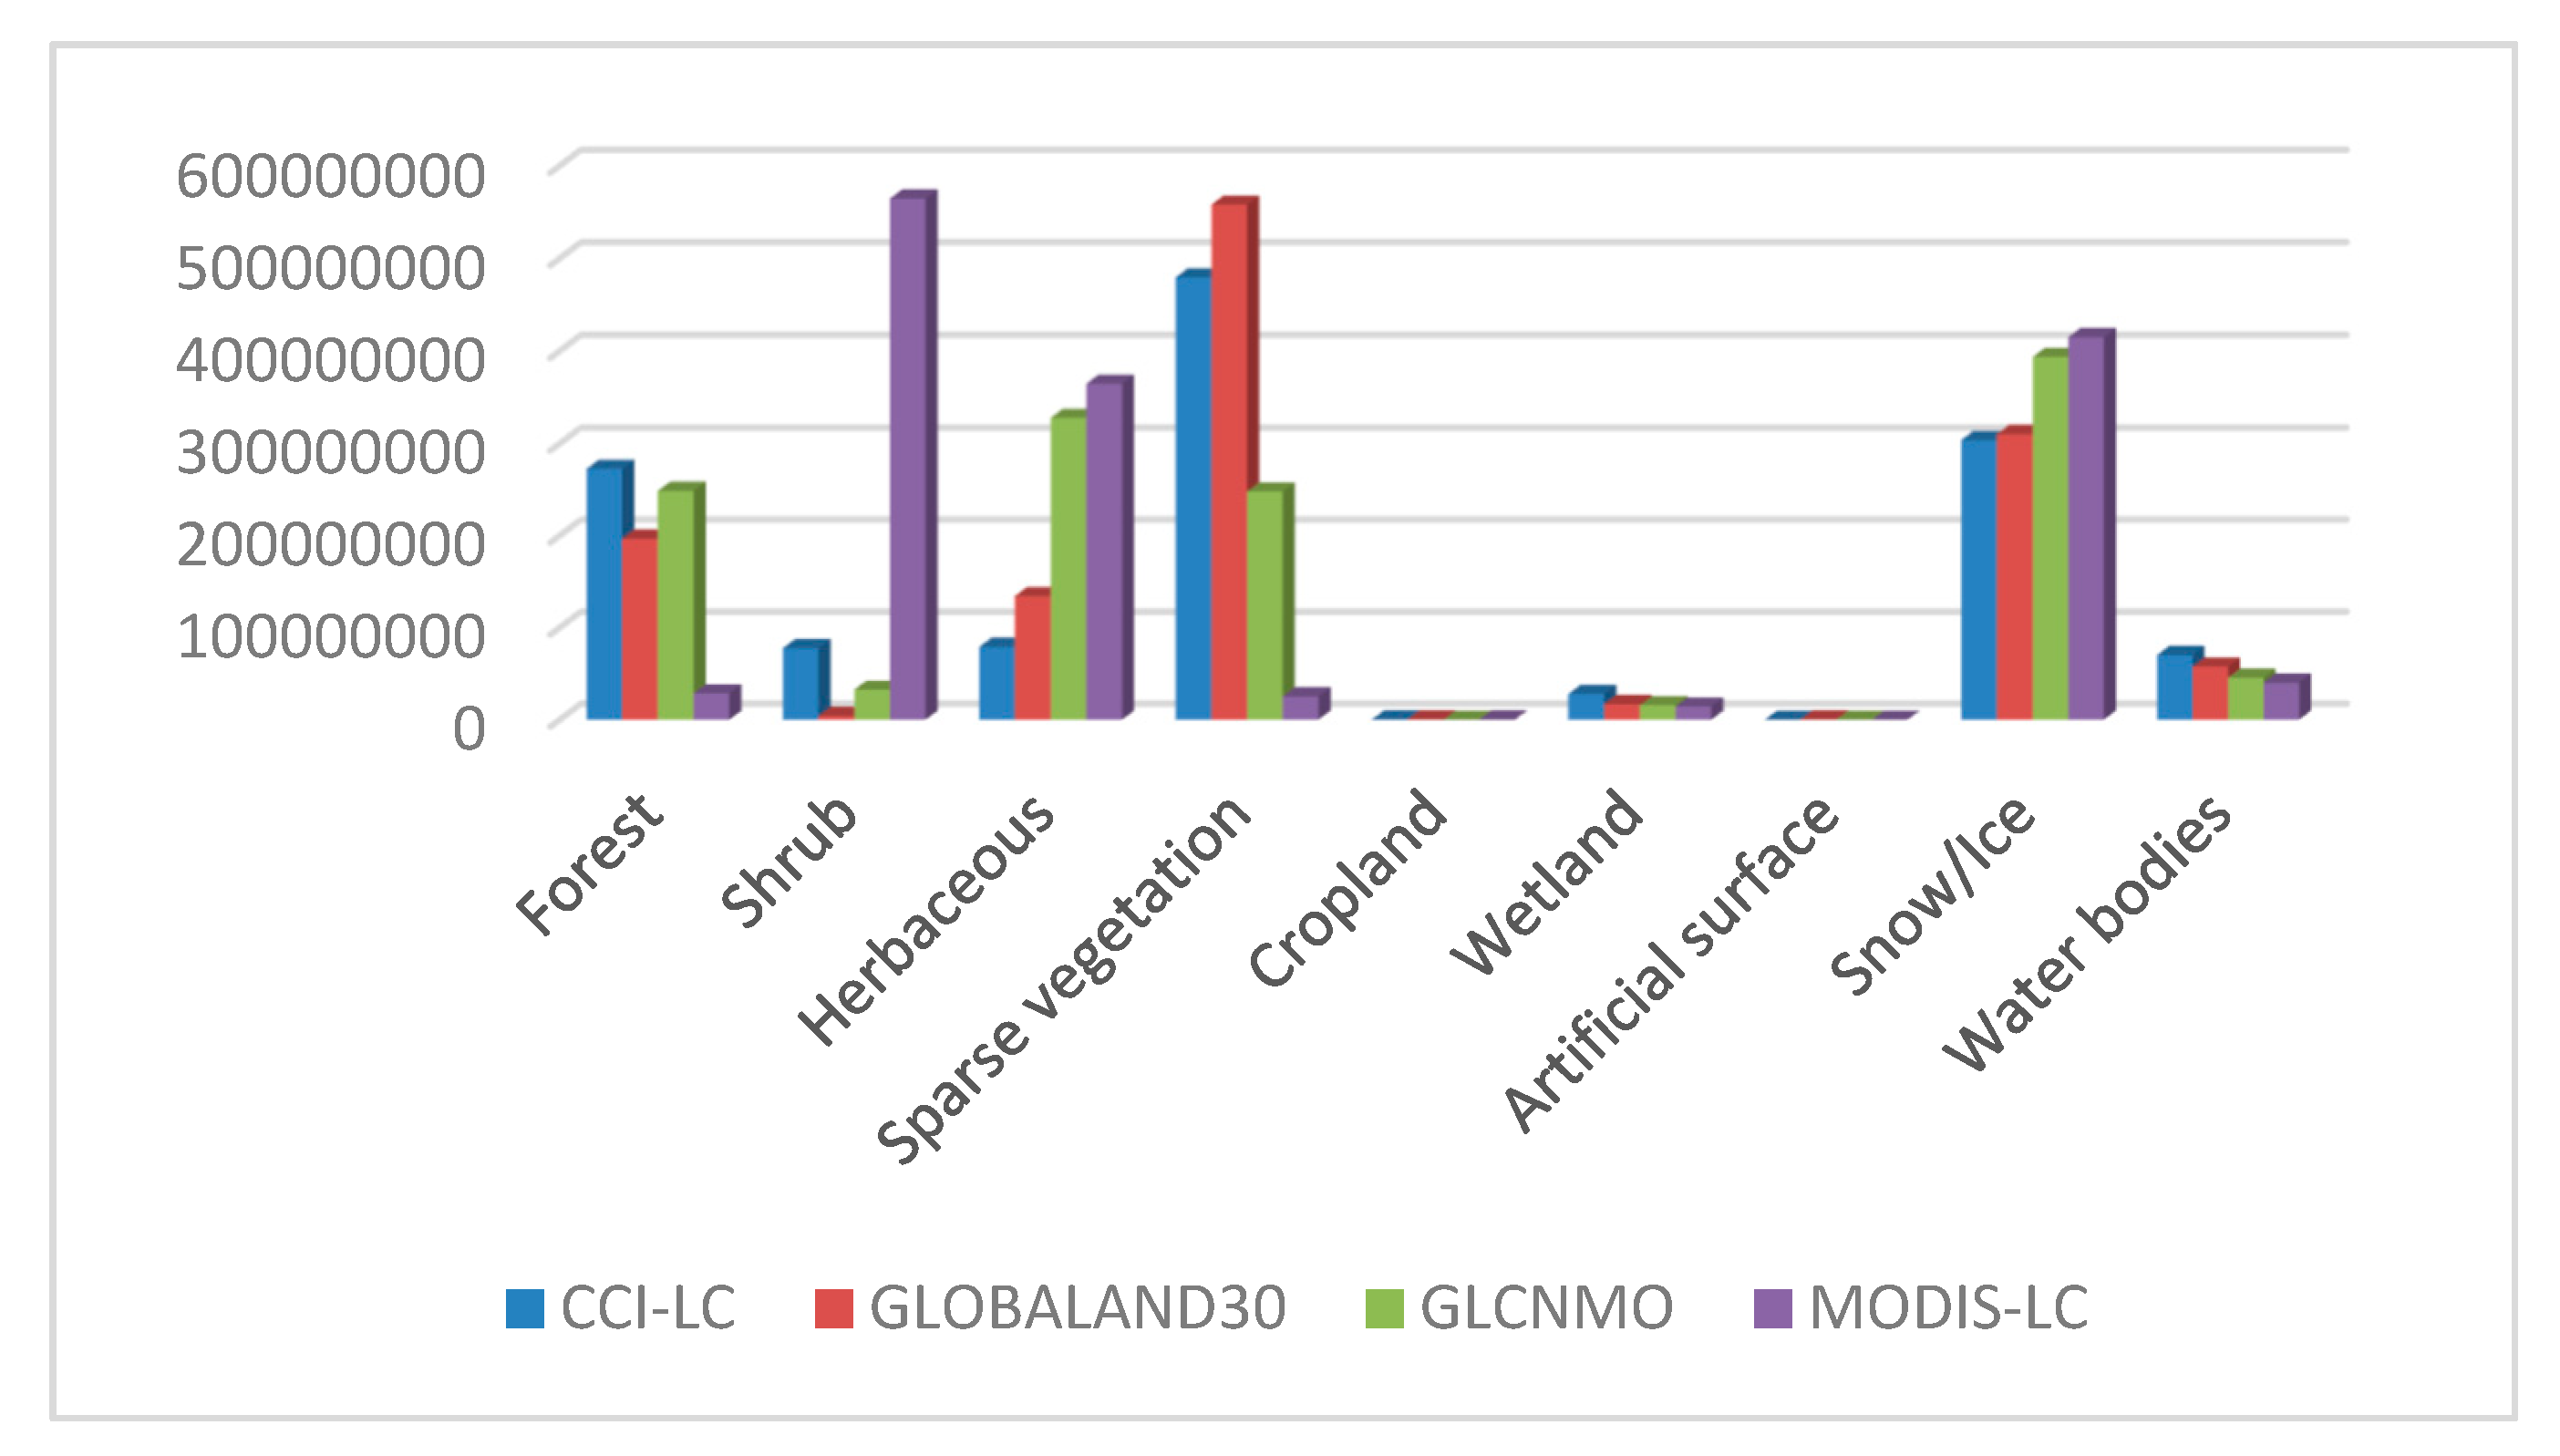
3.1. Comparison of Global Land Cover for the Arctic

3.1.1. Thematic Similarities

Figure 1 shows the result of after integrating the classification systems, the classification results of the four products were determined to be very different. Figure 2 and Figure 3 presents the area and proportion of each land cover class in the four products. Except for the area and proportion of permanent snow/ice and water bodies, the other class types exhibit significant differences. Larger differences appear among shrubs, herbaceous cover and sparse vegetation, followed by forests and wetlands. Although there is a major difference in the proportion of croplands and artificial surfaces, the absolute errors produced by these two types are relatively small as they comprise relatively small areas. Sparse vegetation constitutes the largest land cover type in GlobeLand30, which may be attributed to the classification basis in the Arctic region. Some shrubs and herbaceous cover are included in the tundra, and no further classification detail of the high-latitude Arctic region is performed. Regarding the herbaceous land cover type, the results of MODIS-LC and GLCNMO are not dissimilar, but the other two products present large differences, with the herbaceous land cover area being the smallest in CCI-LC.

3.1.2. Forests

Figure 1 shows the forest distribution for the four land cover products. There is a significant difference between MODIS-LC and the other three products. MODIS-LC exhibited approximately no forest distribution in the study area, and only sparse forest distribution is observed at approximately 65°N. However, except for MODIS-LC, forest distribution is extensive among the other three land cover products, GLCNMO, CCI-LC and GlobeLand30, which exhibit little difference in forest distribution. Forests are concentrated in Scandinavia, North Siberia, the Far East and the southwestern region of Brooks Range, Alaska in North America. Among the land cover products, CCI-LC and GLCNMO exhibit the highest similarity, whereas GlobeLand30 depicts comparatively less forest area. These differences primarily exist in the area between the Verkhoyansk Mountains and Chukotskiy Range in the Far East. GlobeLand30 does not classify this block area as forest, whereas CCI-LC and GLCNMO do. From a latitude perspective, the forest is predominantly distributed in the low latitudes, and as observed from the topography, the forest is primarily distributed in flat areas. The Scandinavian and Verkhoyansk Mountains have no forest distribution, although they are surrounded by forests, whereas Brooks Range in North America becomes the dividing line of forest distribution.

3.1.3. Sparse Vegetation

The differences between the four land cover products are great regarding sparse vegetation. Among the products, GlobeLand30 has the largest sparse vegetation area, distributed in Yamalo-Nenets, the North Siberian Lowland, islands of northern Canada and north of the Brooks Range and high mountains in Alaska. The sparse vegetation area of CCI-LC is larger than that of GlobeLand30, with the primary difference between the two being in the Bolshezemelskaya Tundra and Alaska regions. GLCNMO exhibits a smaller sparse vegetation area than CCI-LC, approximately the entirety of which is distributed north of 70°N and in the high mountains of the Arctic, whereas MODIS-LC depicts approximately no sparse vegetation. Table 1 indicates that the classification difference of sparse vegetation may be related to the vegetation coverage threshold used by various products in their classification.

3.1.4. Herbaceous Cover

In the herbaceous classification, two very different situations exist among the four land cover products. CCI-LC is similar to GlobeLand30, whereas MODIS-LC is similar to GLCNMO. Among them, CCI-LC depicted the smallest herbaceous cover, which is distributed in the transitional zones between tundra and forest in Alaska, the Chukotskiy Peninsula and Siberia. Although the area of herbaceous cover is not much different between GlobeLand30 and CCI-LC, its geographical distribution is significantly different between the two. GlobeLand30 revealed approximately no herbaceous distribution in the ecotone, whereas the herbaceous cover was concentrated in the Far East, east of the Verkhoyansk Mountains, in northern Chukotskiy Peninsula and Iceland. Unlike the herbaceous cover distribution of the first two products, for GLCNMO and MODIS-LC, the herbaceous vegetation covers approximately all areas north of the tree-line except Greenland and the islands of northern Canada. The combined areas of herbaceous and sparse vegetation cover are the same among the four products, indicating that the difference is primarily attributed to the division of herbaceous cover and sparse vegetation. Such a large difference in area may be attributed to differences in classification criteria and methods used in the various land cover products.

3.1.5. Shrubs

In MODIS-LC, shrubs are widely distributed in the Arctic, constituting approximately 67% of the Arctic’s land area. Shrubs are sparsely distributed in CCI-LC, with the majority concentrated in the northern part of the Kola Peninsula and the Bolshezemelskaya tundra. Sporadic distribution is also observed in the high-latitude vegetation ecotone in Siberia and the Far East. Although CCI-LC is second only to MODIS-LC among the four land cover products in terms of total shrub area, the shrub area classified by the two products is vastly different. The shrub area of CCI-LC only constitutes approximately 10% of the Arctic’s land area. Of the other two products, GlobeLand30 and GLCNMO, the shrub area is small, constituting 0.7% and 1.1% of the Arctic’s land area, respectively. The reason why the shrub area of MODIS-LC differs remarkably from that of other products is attributed to the type of classification system. MODIS-LC uses the IGBP classification system, in which the classification threshold of shrubs is set as 10%–100%. However, different classification systems cannot explain the classification difference between CCI-LC and GLCNMO. The classification system for both products is LCCS, and the classification criteria are also the same. The two land cover products were produced in adjacent years; thus, the difference cannot be attributed to time. Therefore, the most likely reason for the contrast between the two products is the difference in the classification methods adopted by CCI-LC and GLCNMO.

3.1.6. Wetlands

The difference in the total wetland area among the four products is not significant. CCI-LC has the largest wetland area, amounting to 3%. The wetland areas of the other three products, GlobeLand30, MODIS-LC and GLCNMO, are slightly smaller than that of CCI-LC. In terms of the geographical distribution of wetlands, the products all include wetlands distributed on both sides of several major rivers in Russia, with the Lena and Yenisei Rivers being the most evident. The products reveal significant differences along the Arctic coast of Alaska, the Arctic coast of Canada and west of the Bolshezemelskaya tundra in Russia. GlobeLand30 and MODIC-LC do not depict any wetlands on the Arctic coast of Alaska and the Arctic coast of Canada, whereas only on the Arctic coast of Canada are wetlands not present in CCI-LC. In GLCNMO, there are no wetlands in the area west of the Bolshezemelskaya tundra in Russia. All wetlands portrayed by the land cover products are located in low-lying areas with abundant water, which is accurate on the macro-level. However, the differences among the products in wetland classification also reflect the imperfections of the classification system. Some areas along the coast of the Arctic Ocean, such as the Arctic Delta and the coastal marsh of Alaska, should be classified as wetlands, but MODIS-LC and GlobeLand30 depict approximately no wetland distribution.

3.1.7. Artificial Surfaces and Cropland

Areas occupied by artificial surfaces and cropland in the Arctic are rare, and the sum of the two land cover types accounts for less than 1% of the total land area. Although they are scarce, the two land cover types are most closely attributed to human activities. Therefore, it is important to have a clear understanding of both land cover types to study the impact of human activities on the Arctic and the use of Arctic resources. Artificial surfaces and cropland in the Arctic are primarily concentrated in the low latitudes of Scandinavia and western Russia. There is also a small distribution area in Alaska, United States, and approximately no distribution in Siberia, the Far East and the islands of northern Canada. Table 1 shows that the classification results of land cover vary greatly among the four products; this outcome is likely the result of different data sources being used. With a reduction in spatial resolution, the artificial surfaces and cropland area also gradually decreases. This result is also logical. In the Arctic, the two land cover types are sparsely and sporadically distributed across the vast region. Due to the influence of coarse resolution, it is difficult to capture the reflection spectrum of artificial surfaces and cropland, resulting in unsatisfactory classification results. The advantages of the GlobeLand30 product are manifested for these land cover classes. The 30-m spatial resolution can be well adapted to the distribution of urban areas, croplands and other artificial surface types, whereby the area obtained is the largest and relatively complete.

3.1.8. Snow/Ice and Water Bodies

Permanent snow/ice and water bodies are the two land cover types with the smallest difference among the four products, especially permanent snow/ice, which is a type of surface feature that is relatively easy to distinguish. Permanent snow/ice is concentrated in Greenland, on islands in the Arctic Ocean and the islands of northern Canada. Differences primarily exist on the islands of northern Canada, where MODIS-LC and GLCNMO exhibited the least permanent snow cover in the region. Permanent snow/ice is a land cover type that can be easily distinguished from other features in remote sensing classification. Therefore, differences are caused by different time phases for the same image, and different time phases can result in different degrees of snow/ice melting. In water bodies, unexpected results were obtained. Due to the effect of spatial resolution, GlobeLand30 can detect water bodies comprising a smaller area, thus reflecting the largest water area. However, CCI-LC exhibited the largest water area, followed by GlobeLand30, although the difference is not significant.

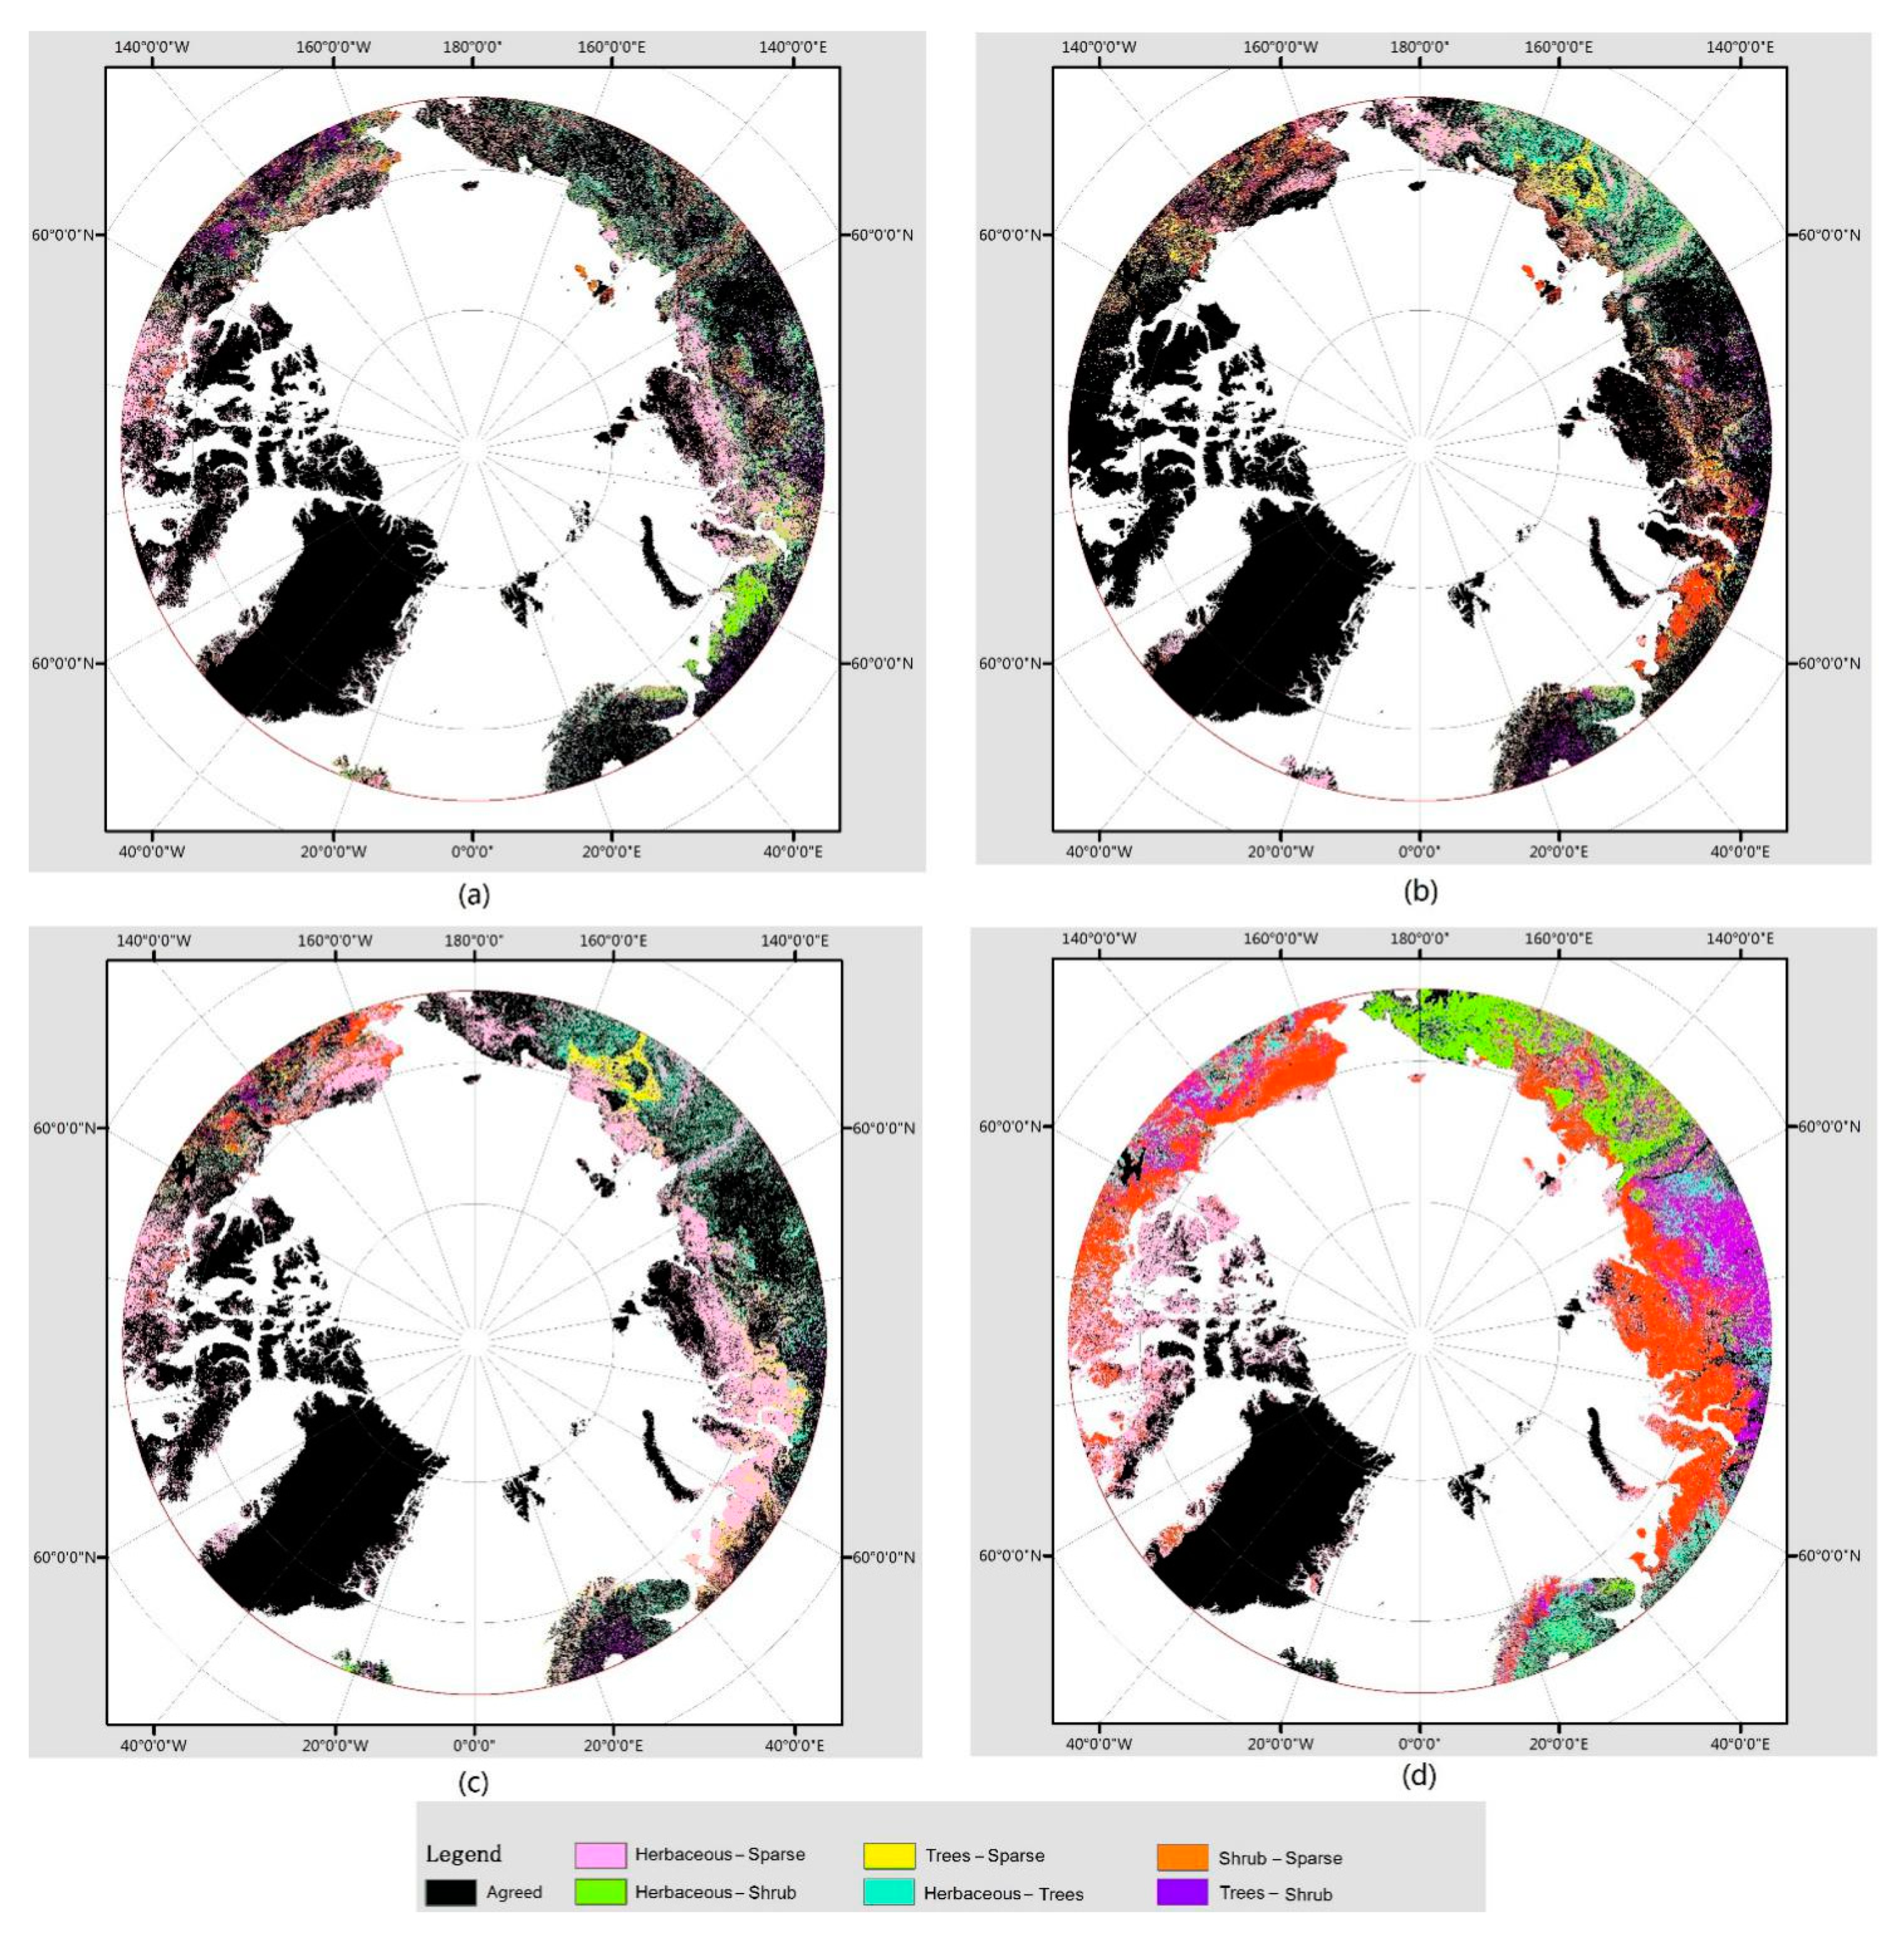
3.2. Spatial (Dis)Agreement

The Figure 4 shows the results of a pixel-by-pixel comparison of the four land cover products. Since MODIS is vastly different from the other three products, only a comparison between MODIS and GlobeLand30 is presented. Among the four land cover products, the highest degree of agreement was 71.4% between CCI-LC and GlobeLand30, followed by 61% between GLCNMO and CCI-LC, and 56.3% between GLCNMO and GlobeLand30, whereas MODIS had a very low agreement of approximately 30% with the other three. The Figure 4 illustrates that the land cover types classified by the land cover products with high agreement are the three large homogeneous regions of forest, sparse vegetation and snow/ice. In addition to the high agreement of the large homogeneous regions, high regional consistency is also illustrated on the map. For example, on the Chukotskiy Peninsula, the agreement of herbaceous cover classification is high. Regions with disagreement appear in the ecotone between forest and sparse vegetation and some places with complex terrain, such as the Alaska Range and some river valleys. The map produces a mixing and distribution of the land cover types with no agreement. Due to display reasons, not all details are able to be depicted in the figure. Thus, the four land cover types, forest, shrub, herbaceous cover and sparse vegetation, that are easily mixed and widely distributed in the Arctic region are selected for analysis of their mixing and distribution. As shown in the Figure 4, herbaceous cover and sparse vegetation are significantly mixed and distributed, and the concentration of such mixing and distribution appears in North Siberia and south of the Canadian islands. Second, when CCI-LC, GLCNMO and GlobeLand30 are compared, significant variance is confirmed in the Kolyma Lowland and Yana River Lowland in Russia’s Far East. GlobeLand30 classifies the land cover type of the two locations as sparse vegetation, whereas the other two products classify the locations as a symbiotic zone of wetlands and forests. Furthermore, it is worth noting that Scandinavia’s classification agreement is not high, and the mixing and distribution situation is very complicated. This area is not only the most densely populated area in the Arctic Circle but also the area with the most fragmented landscape. Peatland, shrubs, herbaceous cover, wetlands and forests are all present in this area, which is why they present poor agreement. Another place worthy of attention appears in Iceland. Although Iceland is not in the Arctic Circle, a considerable part of it is north of 65°N. It is also evident from the figure that several land cover maps present poor agreement in Iceland, and there is a mixing of shrubs and herbaceous cover/sparse vegetation.

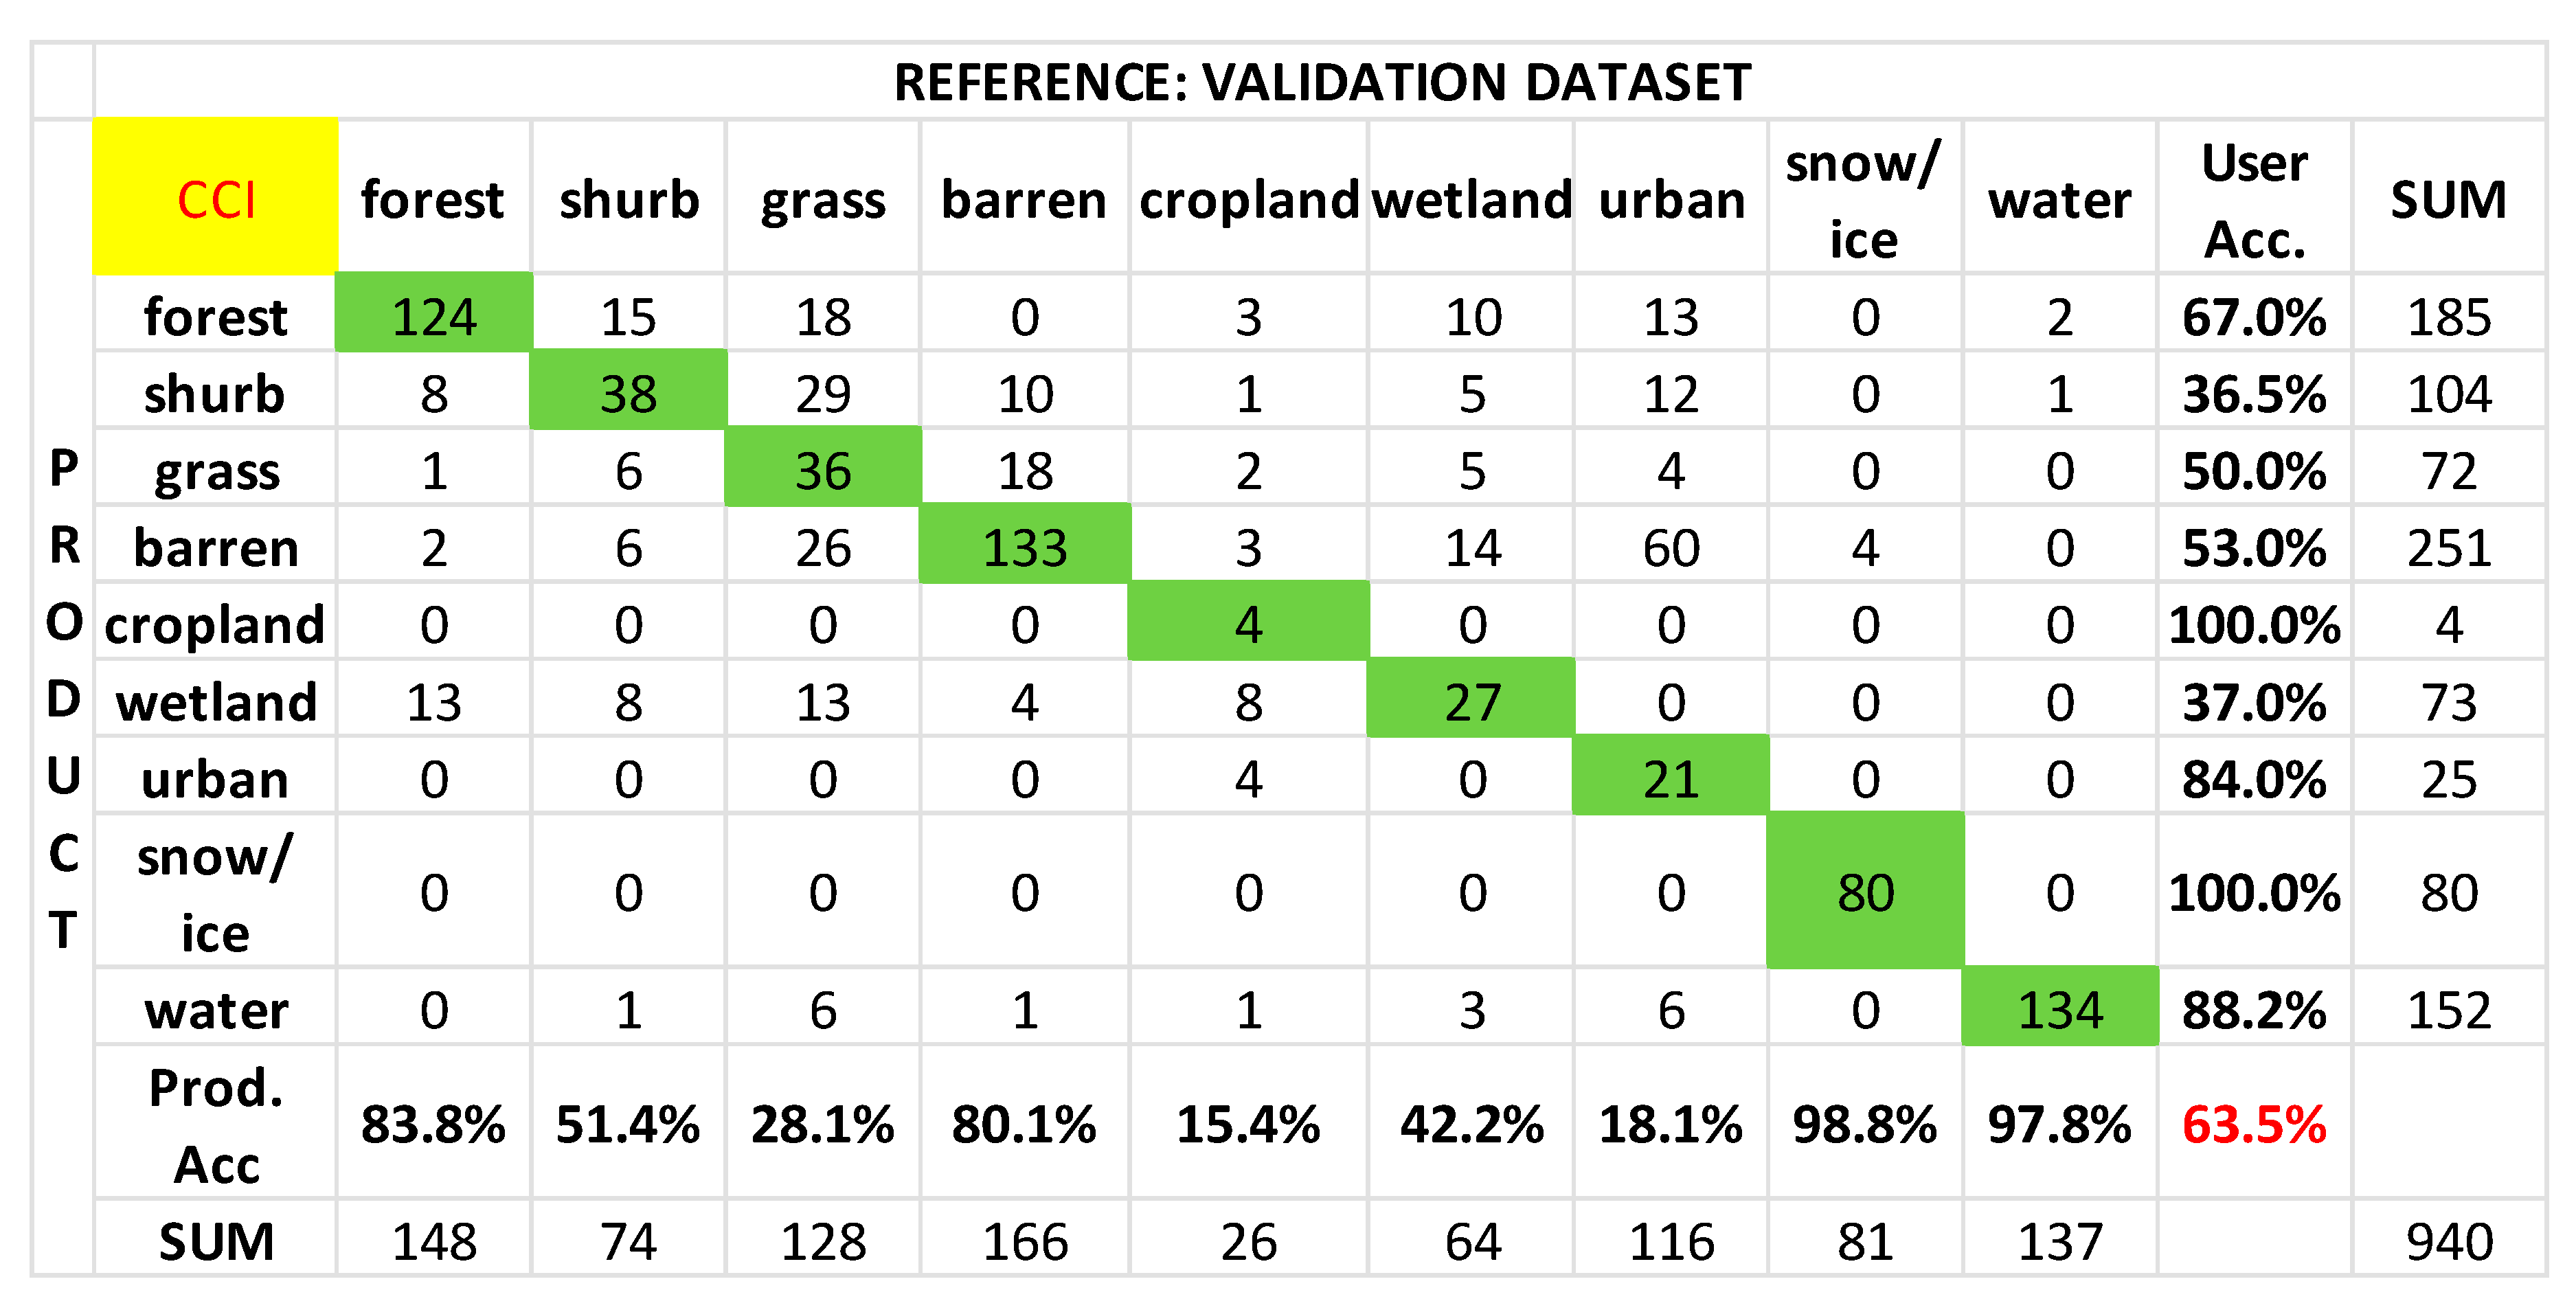
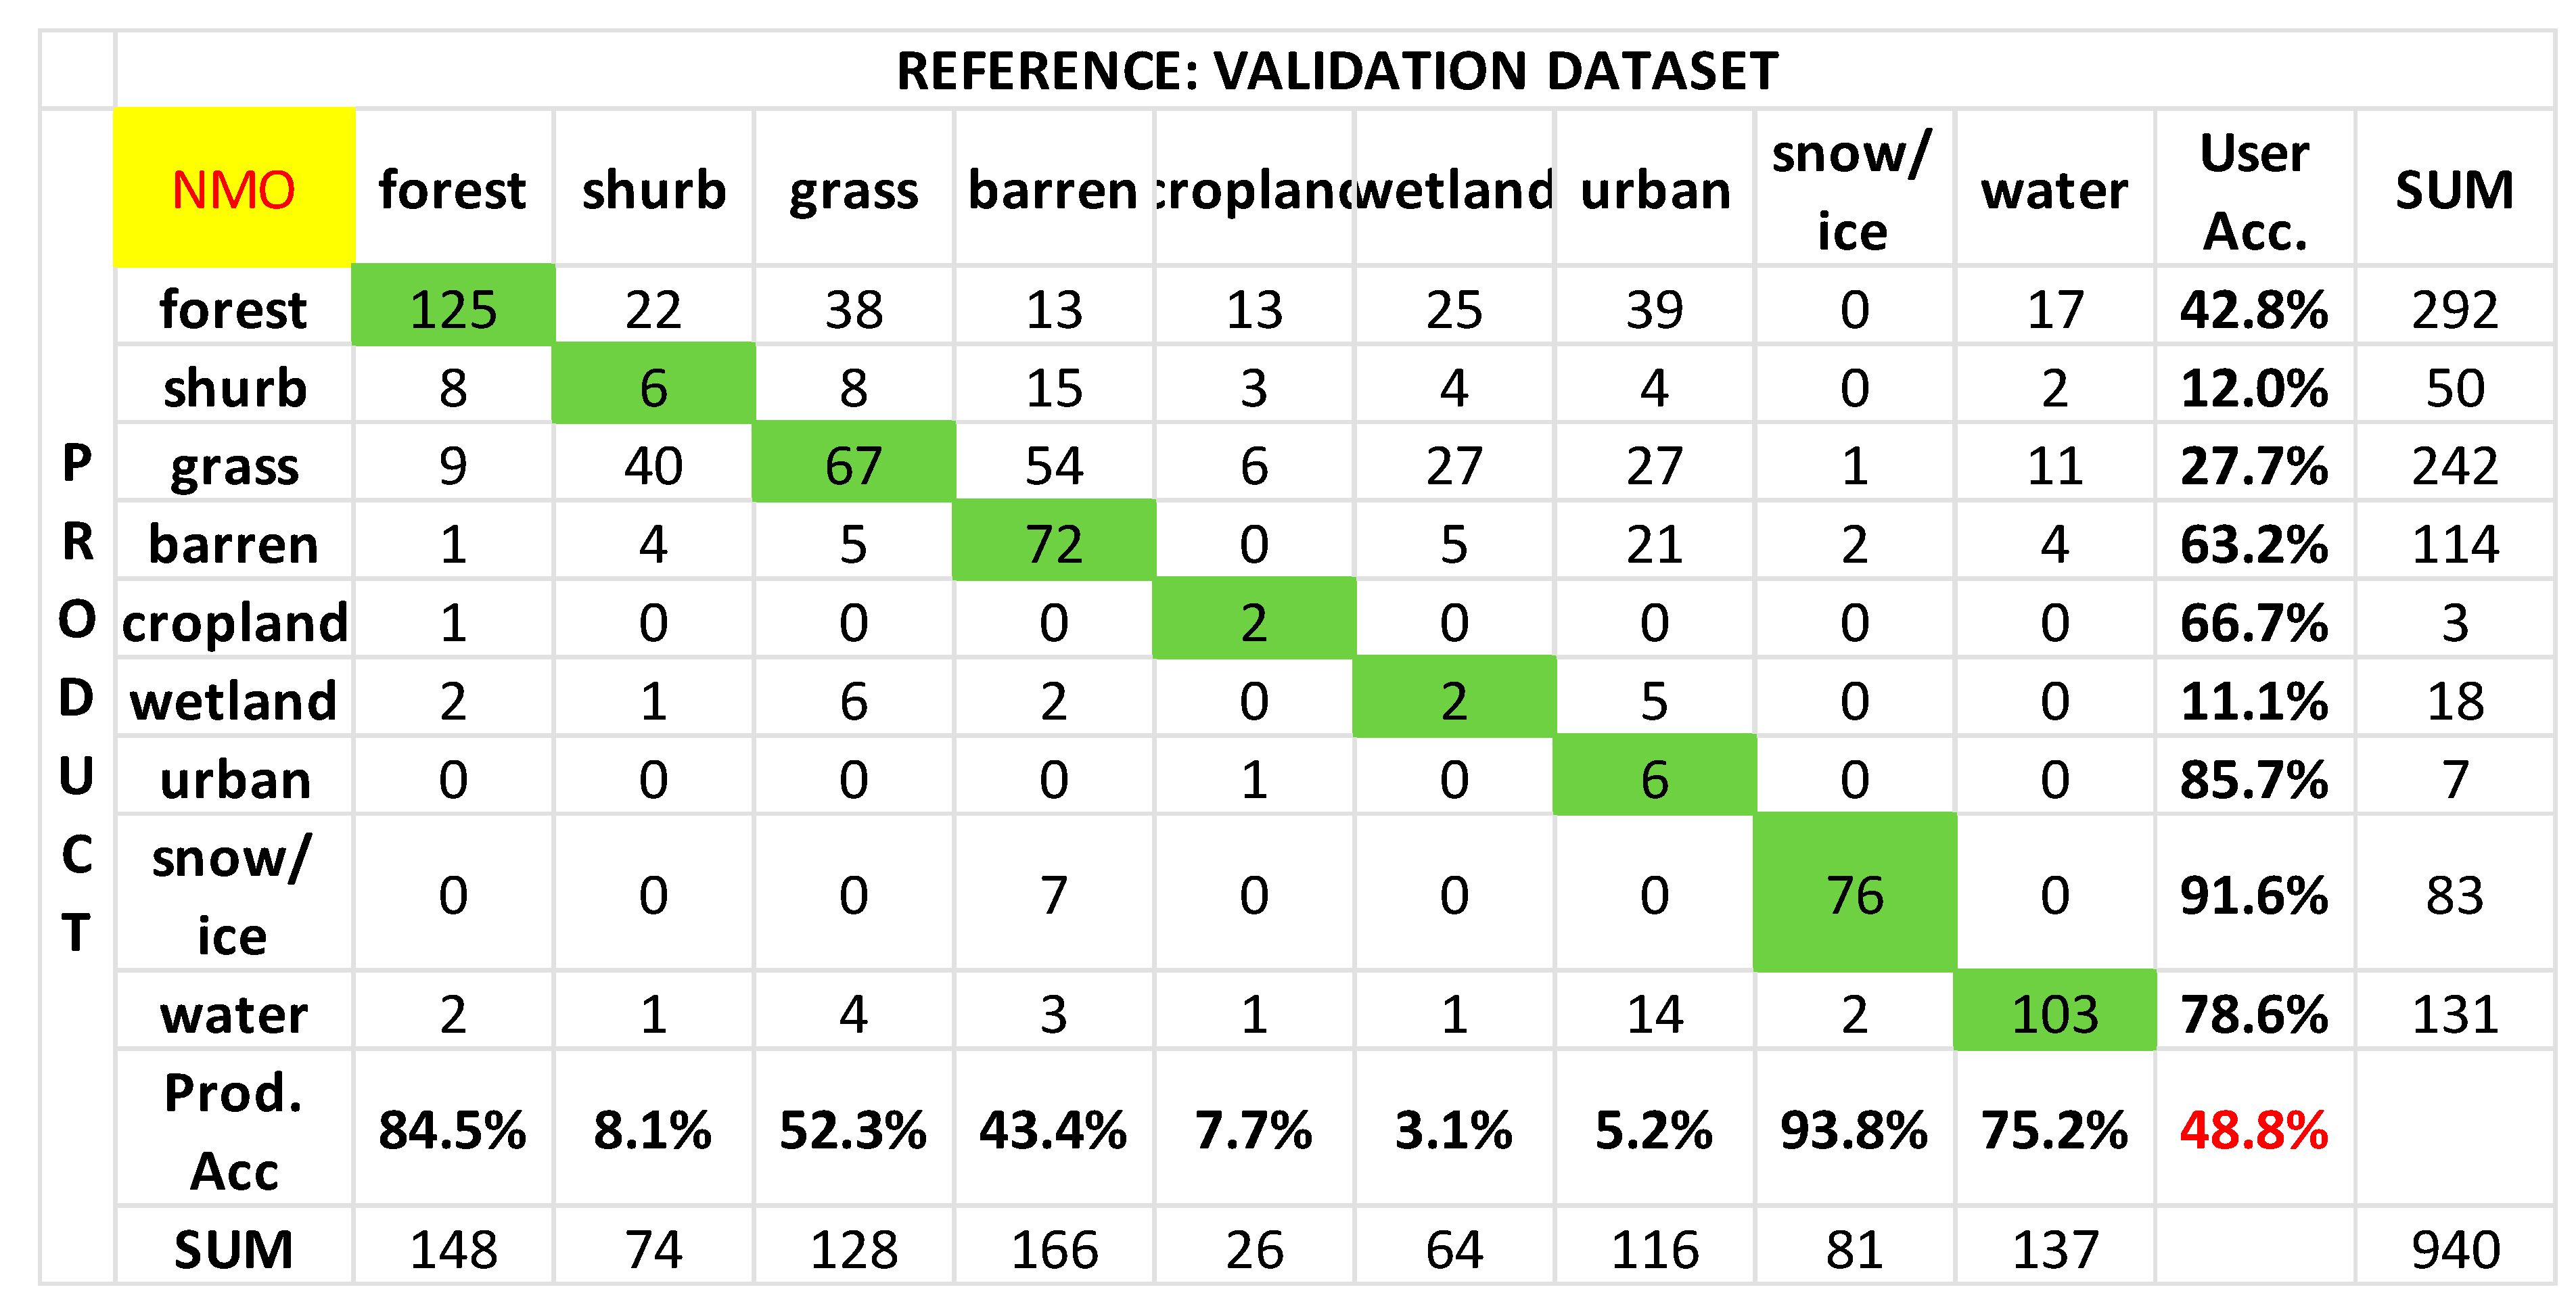
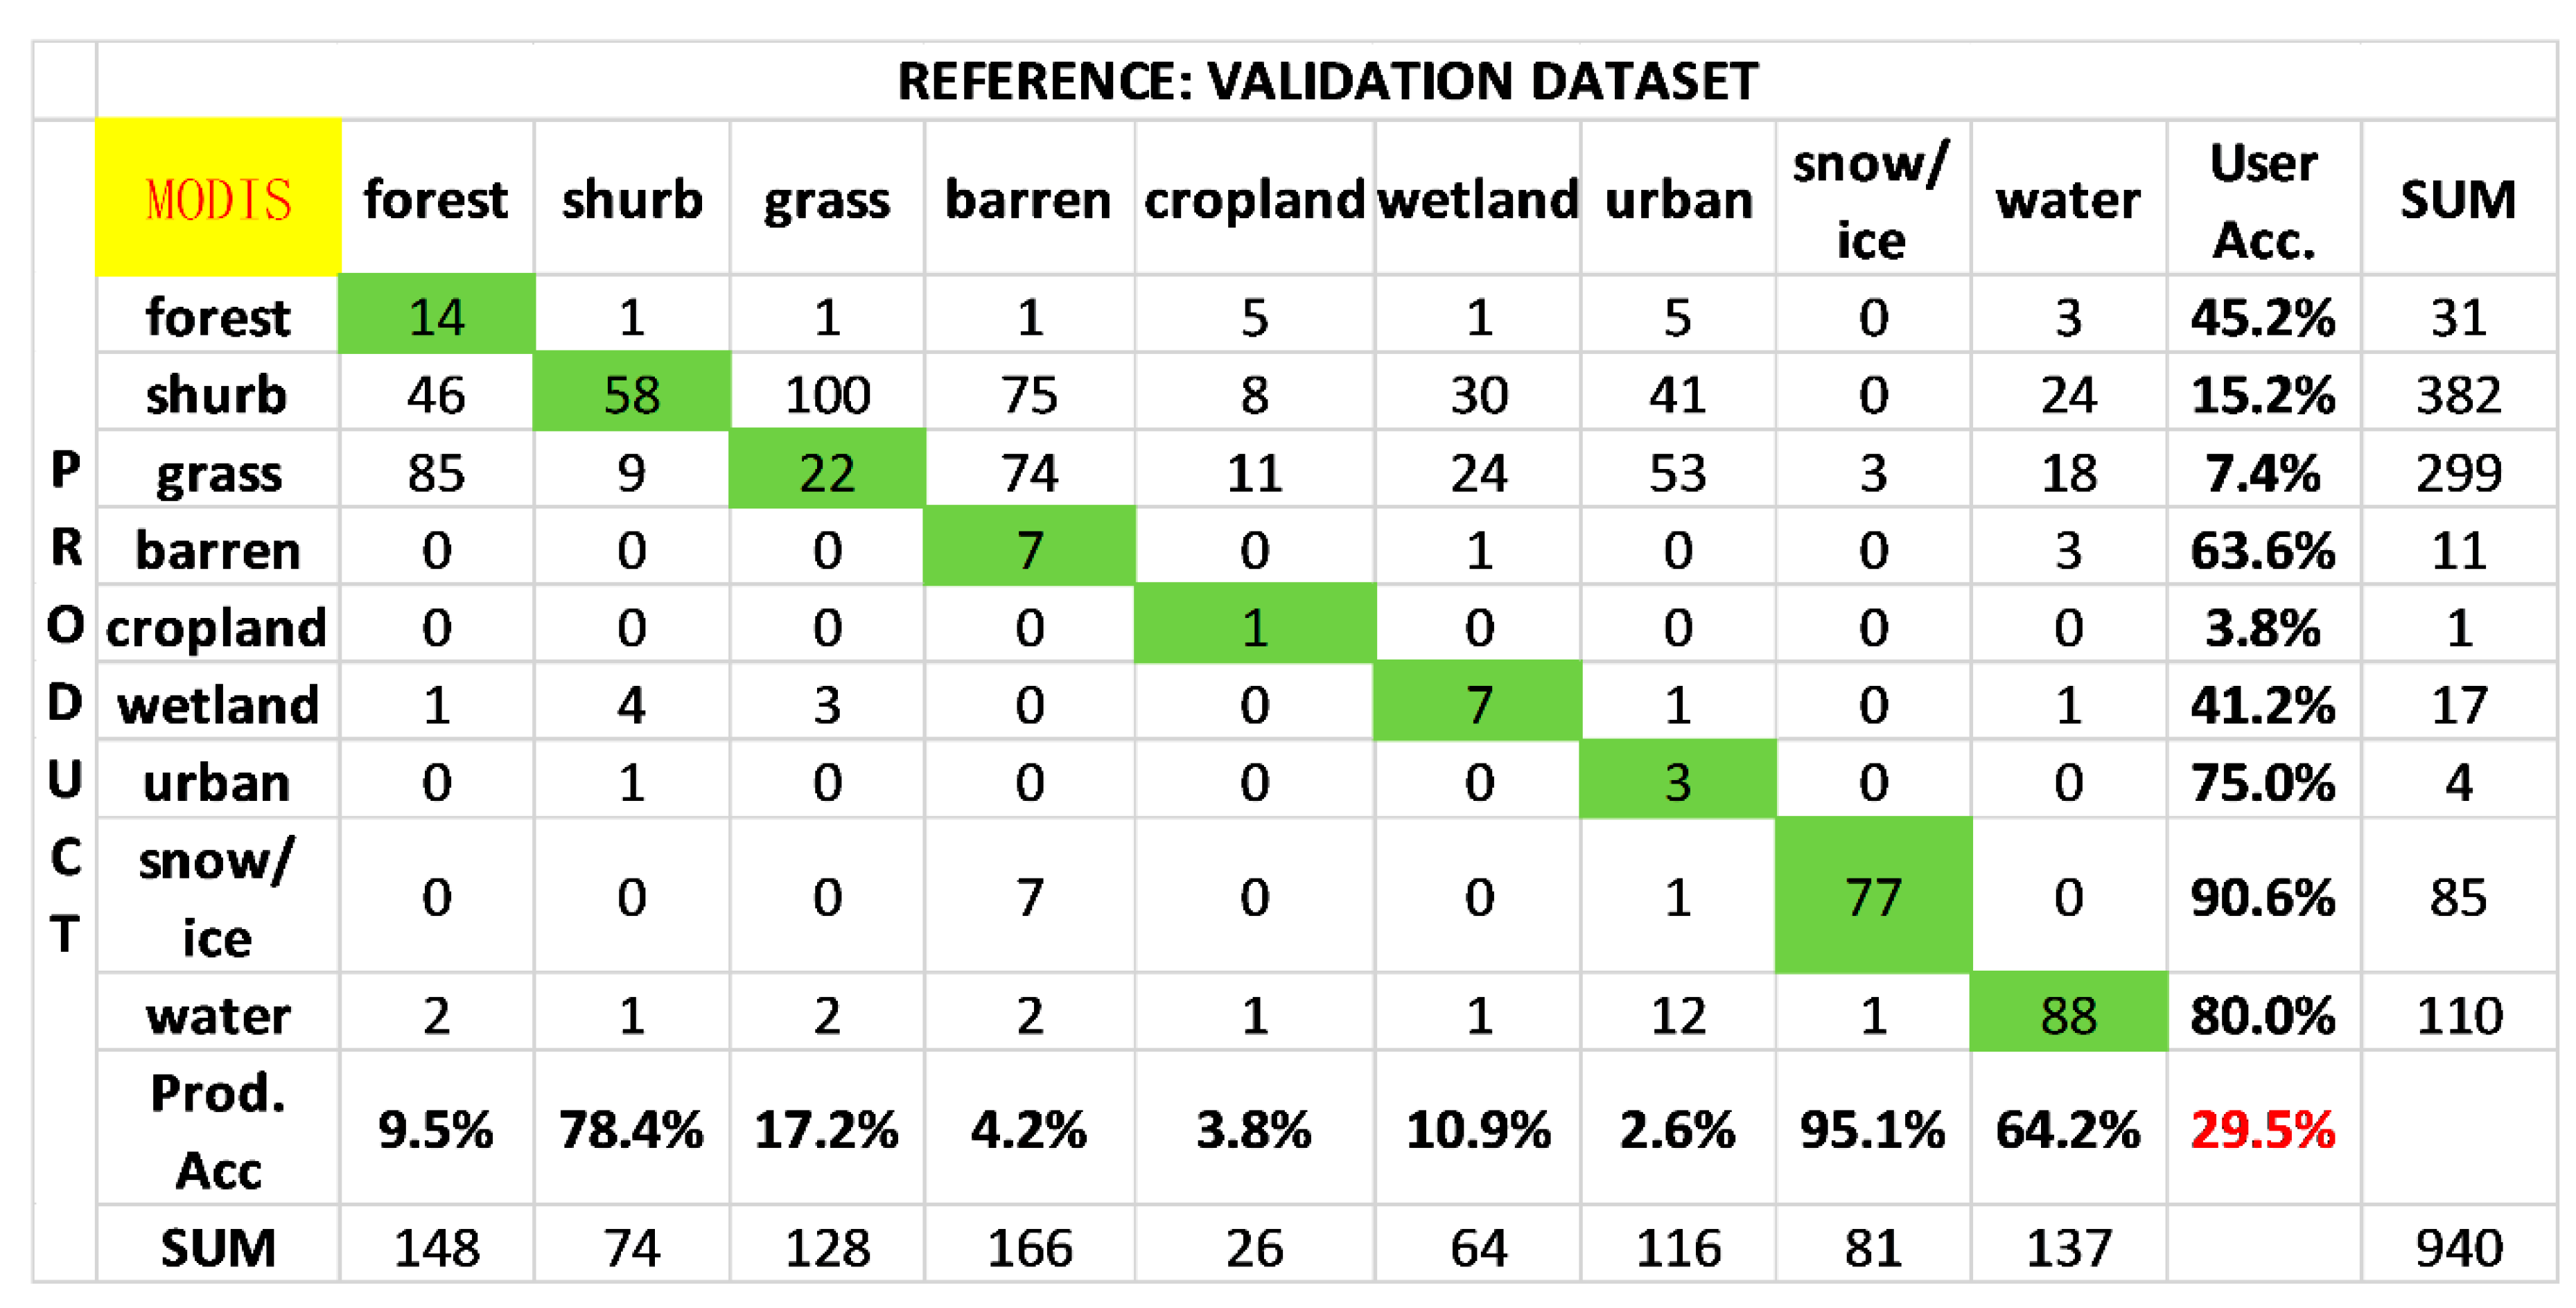
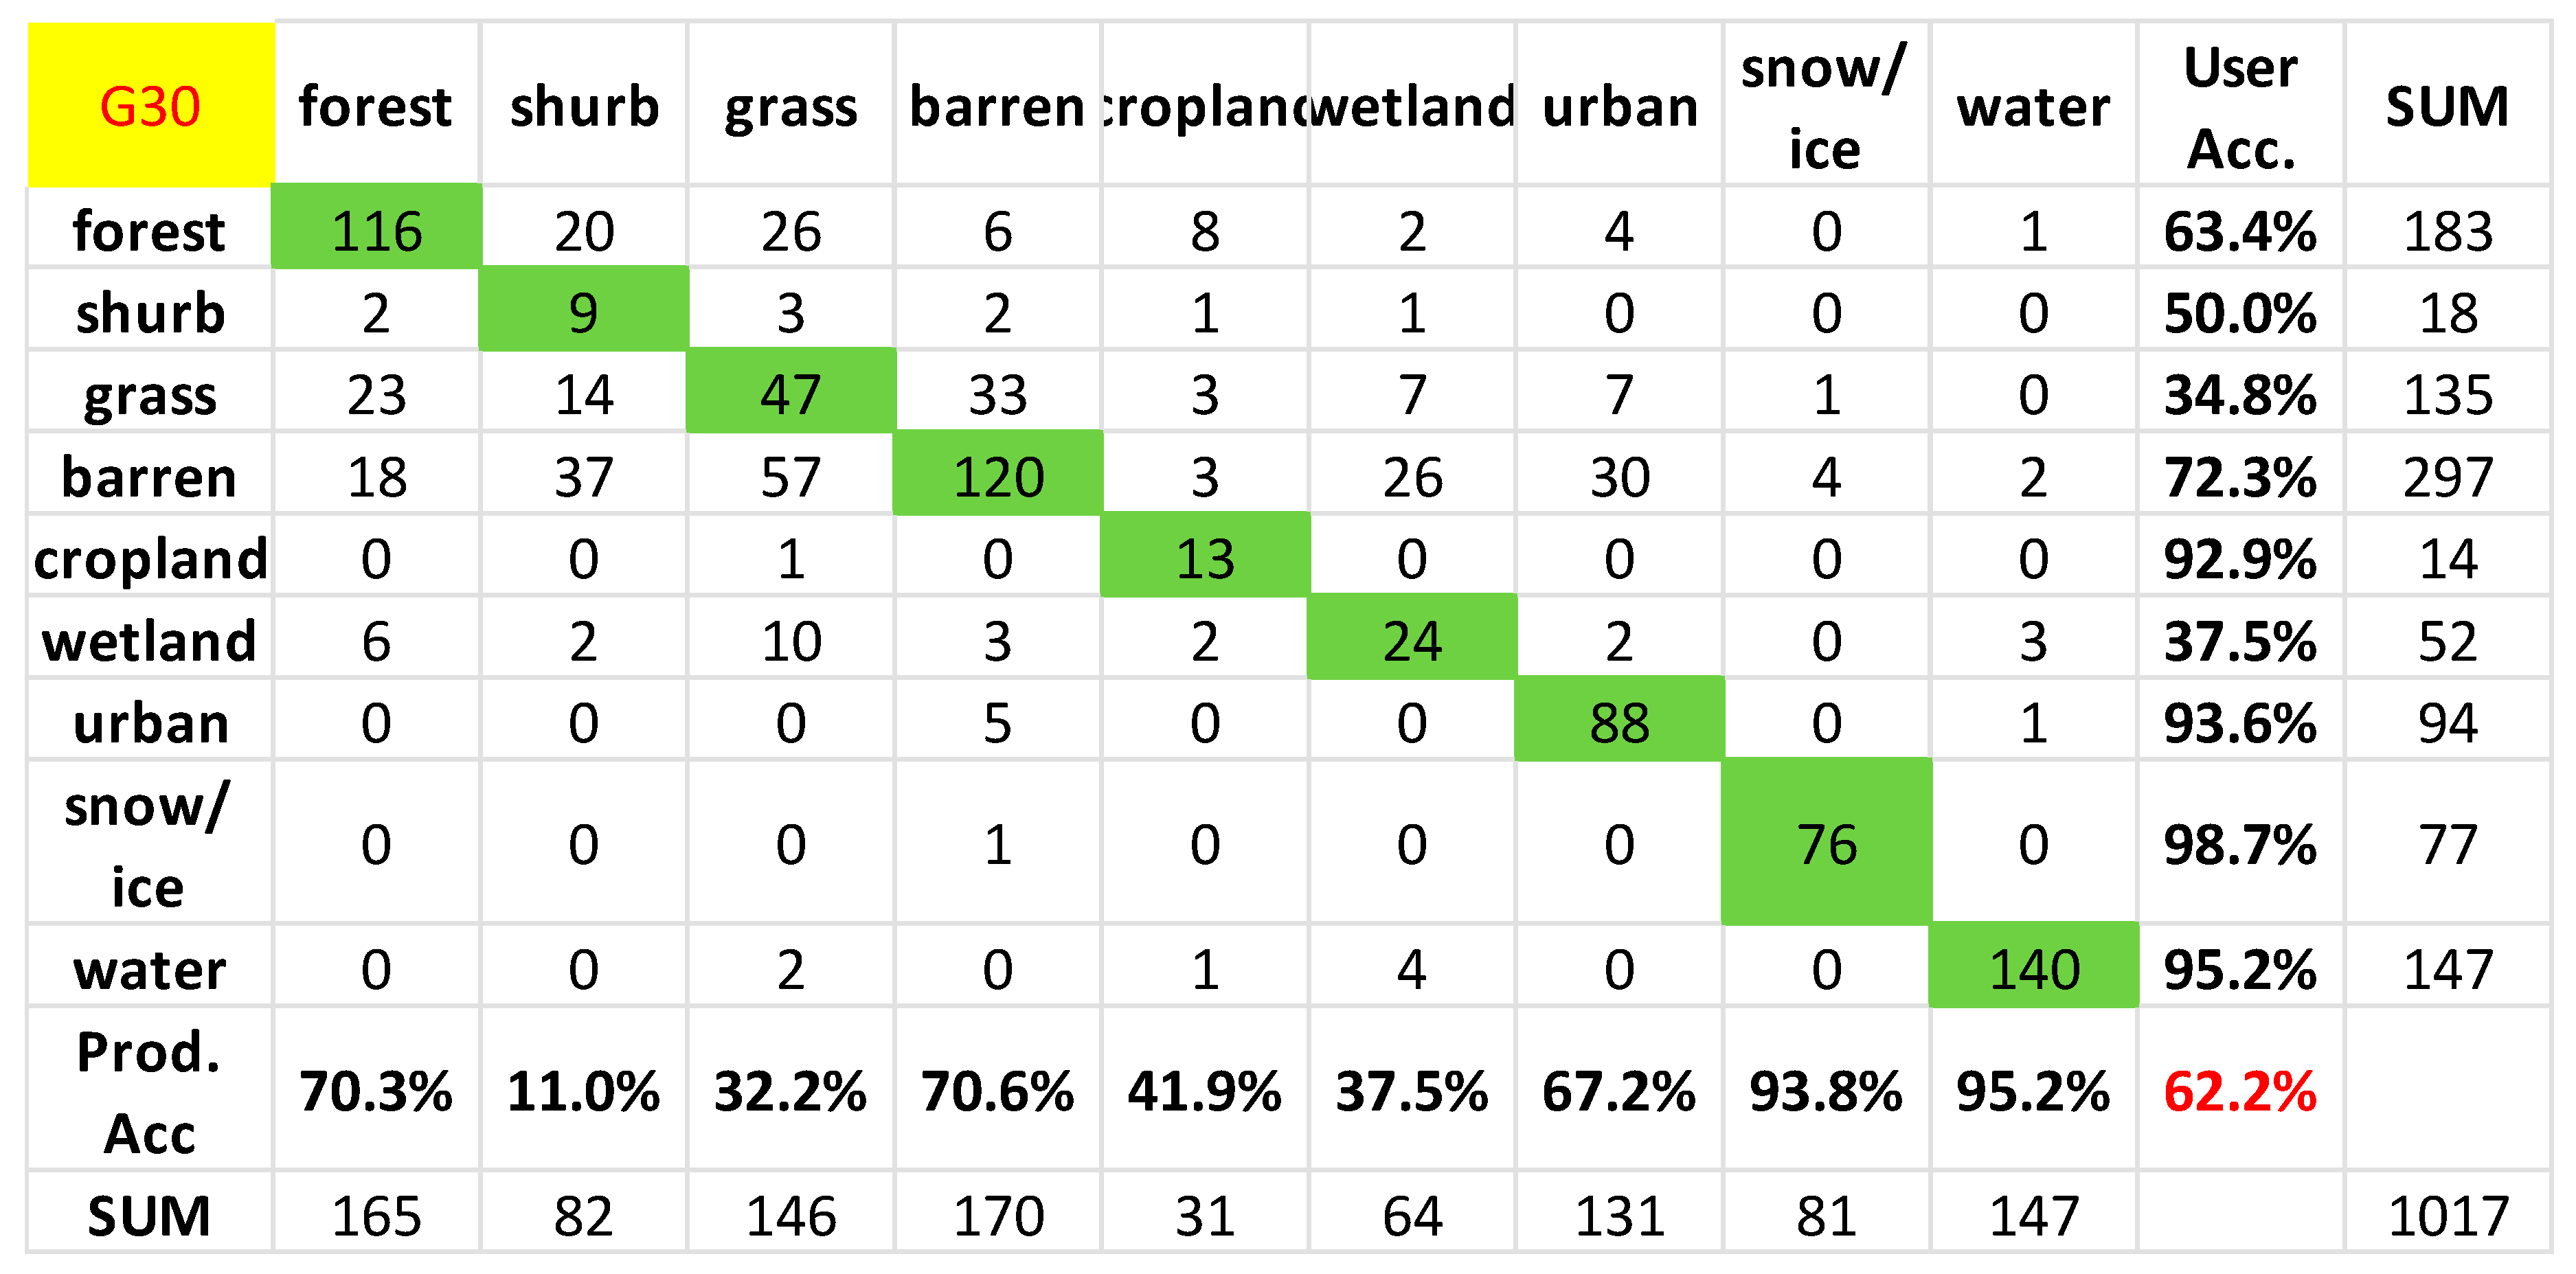
3.3. Comparison of Validation Results

Figure 5 shows the spatial distribution of validation point. Based on the validation point data, confusion matrices of four land cover products are created (see the Figure 6, Figure 7, Figure 8 and Figure 9). The confusion matrices contain four indices for agreement evaluation: user accuracy, production accuracy and overall accuracy. According to the confusion matrices, the overall accuracy of the four land cover products is not high, and GlobeLand30 and CCI-LC have the highest overall accuracy of only 62.6% and 61.3%, respectively. The other two products, GLCNMO and MODIS, with a spatial resolution of 500 m, do not have a high overall accuracy. The accuracy of GLCNMO is 47.7%. The performance of MODIS is even worse as its overall accuracy is only 28.2%, which is far from the standard for application. The classification accuracy of GlobeLand30 in the Arctic region is surprising. It is originally thought to have had the highest overall accuracy. Although its spatial resolution has evident advantages compared with the other products, its classification accuracy is not as good as CCI-LC. However, spatial resolution cannot completely determine the resolution of the product. The classification method, the selection of sample points and the selection of classification systems also have a greater impact on classification accuracy. In the classification accuracy of each class, the classification accuracy of snow/ice is the highest among the four land cover types, having obtained a level of more than 90%. Water bodies have an even higher classification accuracy. The classification accuracy of CCI-LC and GlobeLand30 is as high as 98% in water bodies, whereas that of GLCNMO and MODIS have an accuracy of 75.2% and 64.2%, respectively. Therefore, MODIS is not satisfactory in the classification accuracy of water bodies. This situation also appears in the classification of forests. The production accuracy of MODIS is only 10%, whereas user accuracy is 45.2%, which is significantly higher than production accuracy. This situation also fully demonstrates that MODIS significantly underestimates the proportion of forests when performing classification in the Arctic region. A similar situation also occurs in GlobeLand30′s classification of cropland. Contrary to the classification of forests, among the four land cover products, MODIS has an accuracy of 78.4%, which is much higher than the accuracy of CCI-LC (51.4%) and GLCNMO (8.1%), but its user accuracy is as low as 15.2%. Production accuracy is much higher than user accuracy, which demonstrates that MODIS significantly overestimates the proportion of shrubs in the Arctic’s total land cover. A similar situation also occurs in the classification of forest by GLCNMO. Scattered and small in size, cropland and urban areas constitute the smallest proportion of land cover types in the Arctic region. Therefore, the advantage of a higher spatial resolution in GlobeLand30 may be fully embodied in these two land cover types. The classification accuracy of urban areas is 69.8%, much higher than that of the other three land cover products. The accuracy of cropland is 39.3%, which performs better than the other three land cover types. In the classification of wetlands, the performance of the four land cover products is not satisfactory, as the classification accuracy is less than 40%, whereas GLCNMO reaches the minimum threshold. Since the user accuracy of GLCNMO is 11.1% and production accuracy is only 3.1%, it cannot effectively classify wetlands in the Arctic region. The results of wetland classification are approximately the same as the results of Karen’s [48] verification of several land cover datasets by field sampling in Siberia. To a certain extent, this demonstrates that the classification of wetlands by means of remote sensing in the Arctic has problems that require solving. Moreover, the KAPPA coefficients of the four land cover products are not much different, all being approximately 0.55. In the classification of Arctic vegetation, the two types of land cover with the highest classification accuracy are forests and sparse vegetation. The classification accuracy of CCI-LC and GLCNMO for forest reached more than 80%. The accuracy of GlobeLand30 is only slightly lower (71.6%). In the classification of sparse vegetation, the accuracy of GlobeLand30 is 72.3%. As previously expected, the classification accuracy of shrubs in the four land cover products is very low, and GLCNMO has the lowest producer accuracy of only 8.1%. In the Arctic, shrubs predominantly appear in two regions. One is the tundra and taiga ecotone and the other is the tundra zone. In the tundra and taiga ecotone, shrubs are easily mixed and distributed in forests. Given the harsh climate, the taiga trees in the north are short and sparse. In addition, the herbaceous vegetation and shrubs under forest cover may cause confusing spectral characteristics, resulting in mixing. In the tundra zone, the identification of shrubs is even more troublesome. Nonherbaceous plants, lichen/moss and sedge plants in the vast tundra zone can all be mixed with shrubs. Unexpected circumstances appear in the classification accuracy of herbaceous cover. As herbaceous cover has a large coverage area and evident image features in the Arctic region, its classification accuracy in the four products is low. The highest classification accuracy appears in CCI-LC. The user accuracy of herbaceous cover classification is 50%, the production accuracy is only 28.1% and even GlobeLand30 with the highest spatial resolution can only achieve a production accuracy of 27.3%. Based on the confusion matrices, the four land cover products are not the same in terms of the confusion of herbaceous cover. In GlobeLand30, herbaceous cover is predominantly mixed with sparse vegetation. The most evident class mixed with herbaceous cover in CCI-LC and MODIS is shrubs, whereas in GLCNMO, herbaceous cover has been visibly mixed with forests. This situation may be caused by the land cover characteristics in the Arctic region. Due to high latitudes, there may be vegetation zoning, such that the land cover type in the ecotone easily mixes. Herbaceous cover is in the middle of the Arctic barren tundra and the southern forest, therefore, it may cause mixing of herbaceous cover, sparse vegetation and forests.

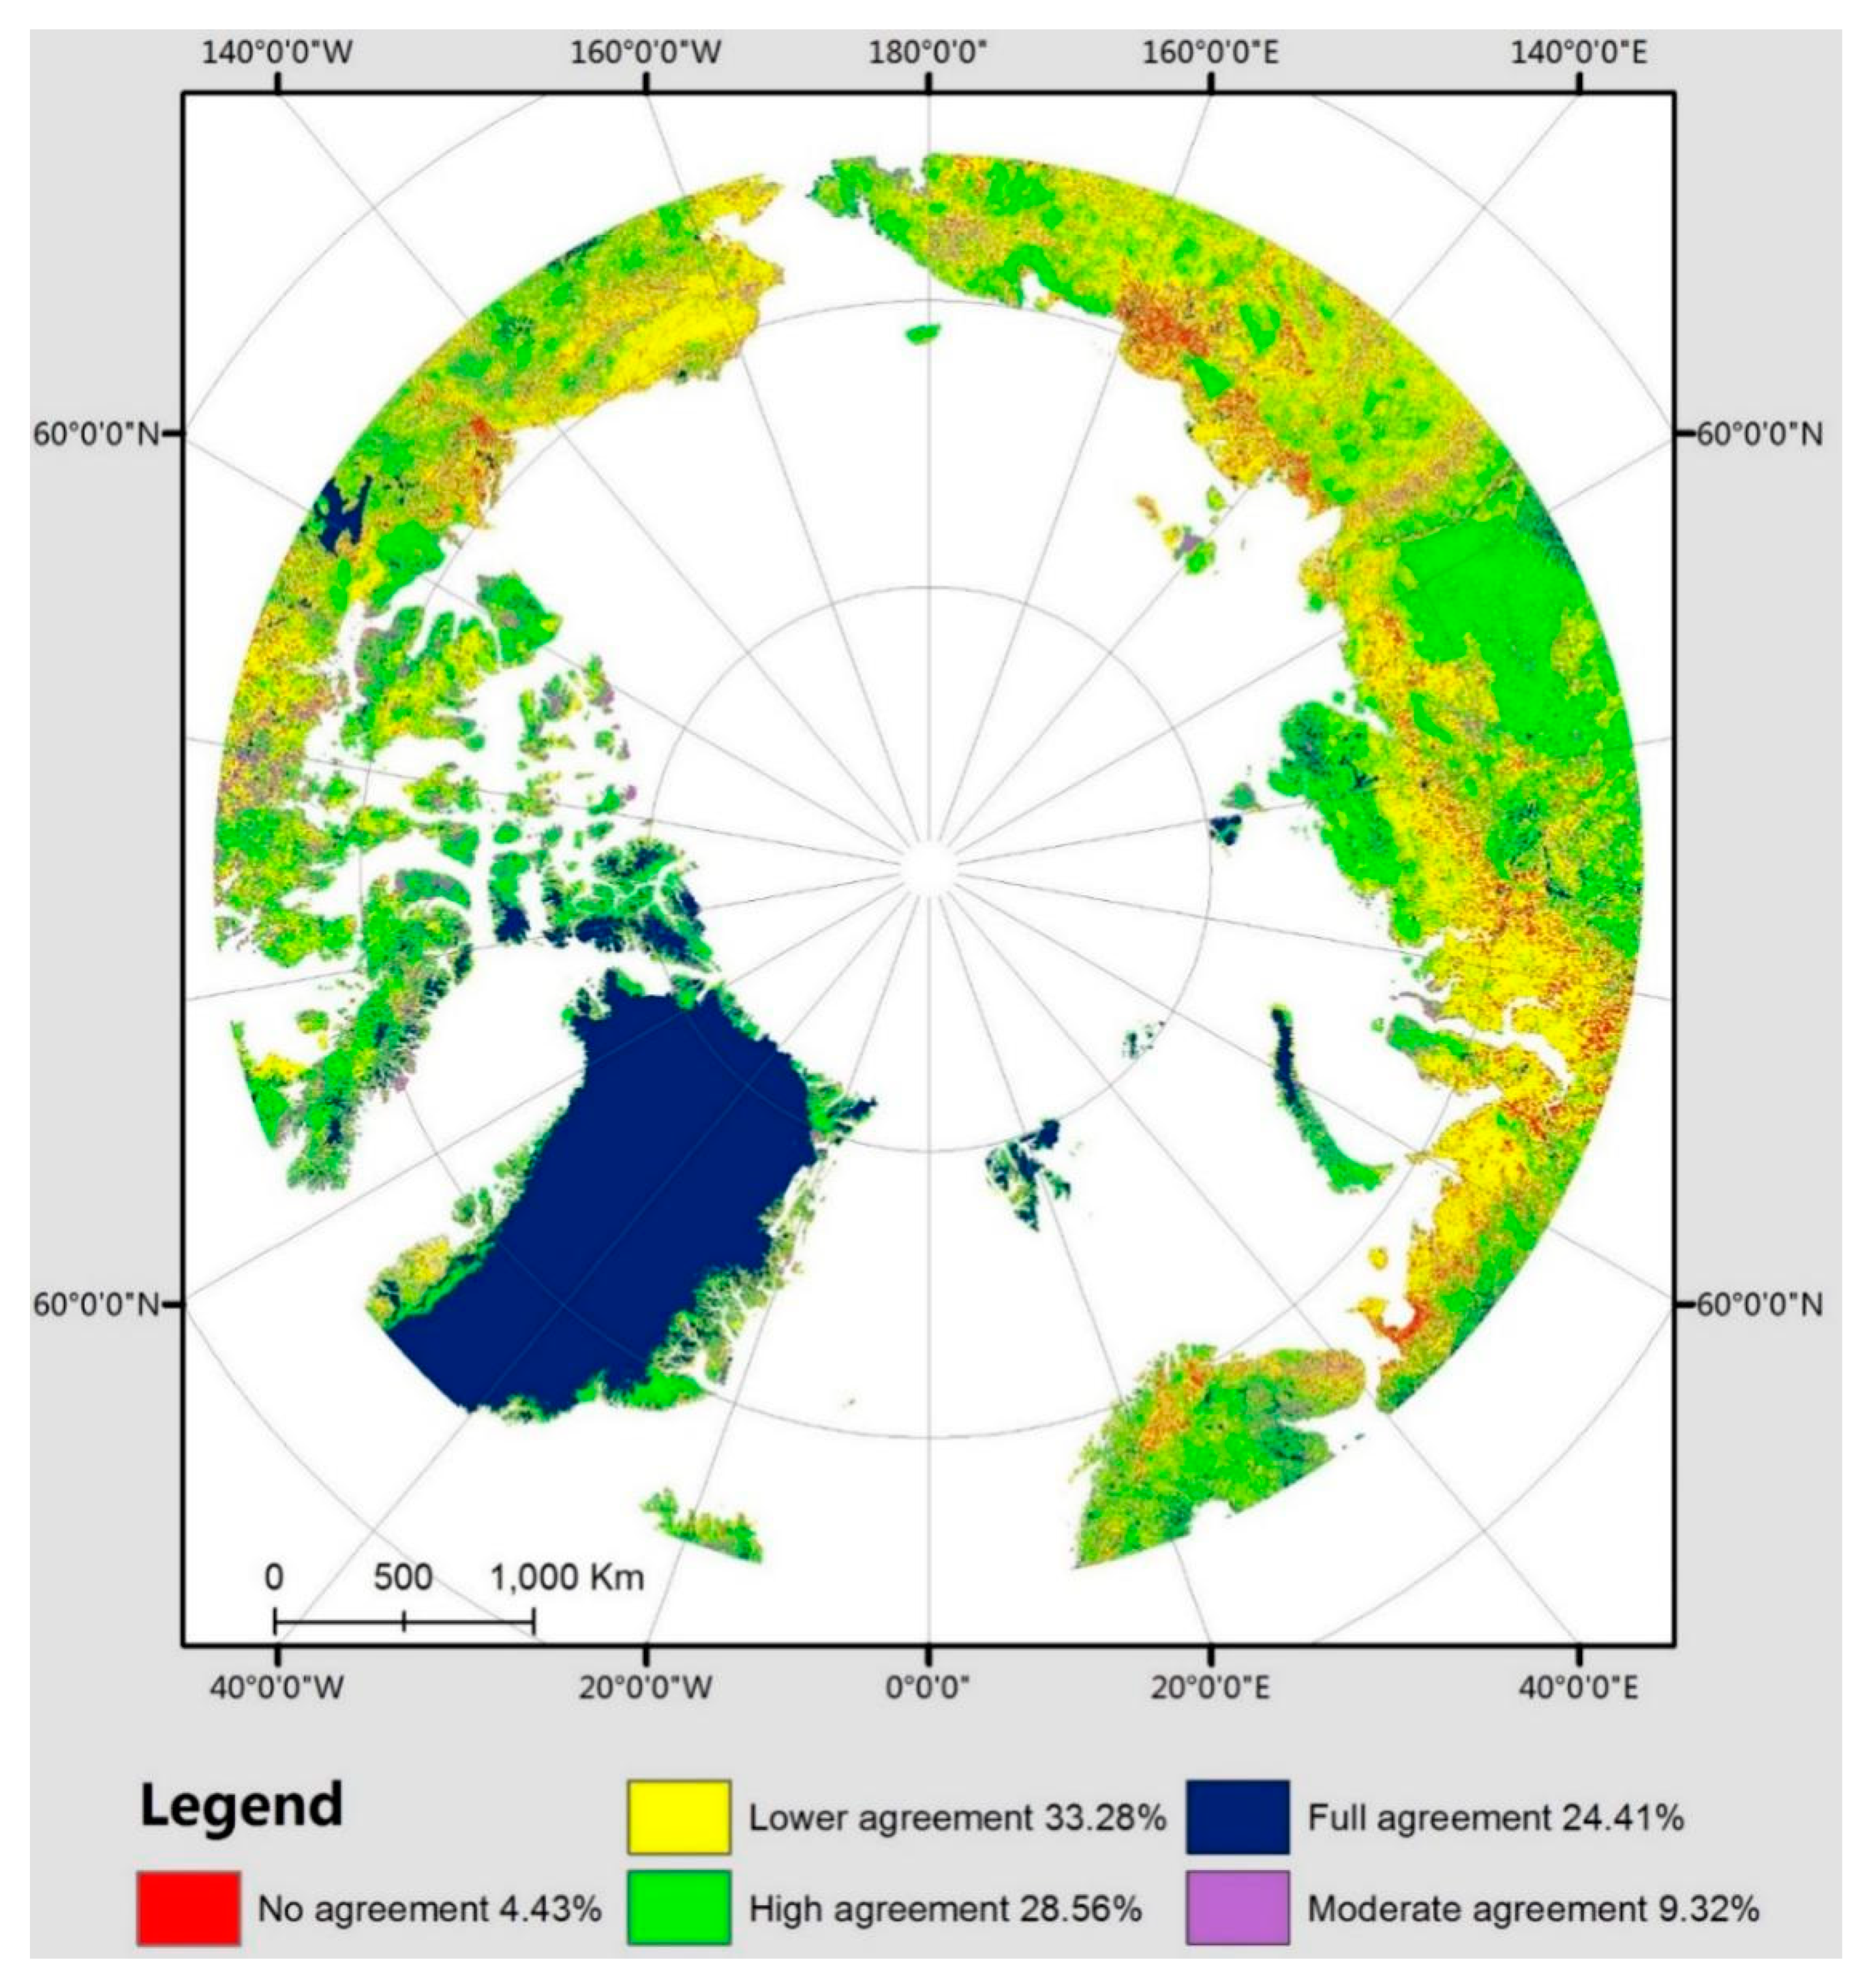
3.4. Spatial Variation in Consistency

Figure 10 shows the spatial variation in consistency. As we can see, water bodies and snow/ice indicate a high agreement, with the sparse vegetation in Greenland, Great Bear Lake, and the islands of northern Canada being the most prominent places. Since MODIS is significantly different from the other three products, after validation at the verification points, it may be concluded that MODIS is relatively unsuccessful in the classification of land cover types in the Arctic region. Therefore, the green areas in the image (i.e., the areas with the same classification results from the three land cover products), are also areas with more accurate and reliable classification, such as the taiga belt in northern Russia, the Chukotskiy Peninsula, the islands of northern Canada and the southern part of the Scandinavian Peninsula. The common feature of these areas is the obvious homogenization of land cover. In contrast, the areas with the least agreement of classification results are all found in vegetation ecotones, high mountainous areas and river valleys, where fragmented landscapes are evident. The figure shows that the classification results of places such as the Scandinavian Mountains, North Siberian Lowland, Kolyma Lowland and Alaska Range exhibit high disagreement.

4. Discussion

The Arctic is a unique region. It seems desolate but is actually vibrant. Although sparsely populated, it has always been affected by human activities. For this unique region, using remote sensing for observation is an excellent choice, but the use of remote sensing data for land cover classification in the Arctic involves unique challenges.
First, there is a lack of data quality and quantity. The Arctic land surface is covered by snow and ice during the long winter days. In summer, the frequency of cloud cover also impedes access to land surface image. Give the superposition of these two factors, the number of Arctic region images available for classification is less than one-tenth that of other regions. The inability to obtain high-quality images directly affects the accuracy of subsequent classifications. Second, in the classification of vegetation, the Arctic growth season is very short, which also significantly limits the ability to distinguish vegetation based on seasonal characteristics. Third, a low solar altitude, large changes in soil moisture throughout the year and ubiquitous lichens increase classification difficulty in the Arctic [49]. Although many challenges exist in the classification of Arctic land cover, there are still appropriate ways to improve classification accuracy. First, classification accuracy may be enhanced according to climatic zones or other geographic factors. Land cover in the Arctic is less disturbed by humans, and most of the landscape grows under natural conditions. Therefore, the addition of climatic or geographic factors may greatly improve results. The CAVM is the result of combining remote sensing data with other relevant elements. For example, considering the climate–vegetation relationship, Sullamenashe et al. [50] used MODIS data to classify the northern regions of the Eurasian continent, successfully improving the classification accuracy to 73%. Second, medium- and high-resolution images such as Landsat and Sentinel have been successfully applied in parts of the Arctic but they have not been applied in a wider range of classifications. GlobeLand30 has achieved success in detecting global land cover. Thus, it is an excellent choice for the use of high-resolution images to map Arctic land cover after designing a proper classification system. Third, approximately all land cover products rely on optical remote sensing images, and SAR and LiDAR technologies have proven their advantages in many aspects, especially in the detection of shrubs and wetlands [51,52,53,54].
Second, although the Arctic is vast and magnificent with many homogeneous areas, such as the boundless glaciers on Greenland, the vast taiga forest of Siberia and the vast tundra of the extreme north, two 500-m resolution land cover products, GLCNMO and MODIS-LC, have poor accuracies of 48.8% and 29.5%, respectively, which may be attributed to classification methods or sample collection. However, to some extent, the 500-m resolution does not accurately reflect the Arctic land cover characteristics because, in addition to large homogeneous areas, the Arctic also features a significantly fragmented landscape. For example, in the tundra zone, in the water-filled depressions and on both sides of water bodies, the vegetation is more abundant and more complex than other areas with shrubs, herbaceous cover and forests that are sequentially positioned alongside water bodies, and these differences are not discernable in products with a resolution of 500 m. Furthermore, there are many plateau mountains in the Arctic, and vegetation has evident vertical zoning in the mountains. Typically, due to snow accumulation in winter and melting in summer, bare ground or sparse vegetation may appear near a mountain top. Then, at lower elevations, zones inlaid with herbaceous cover and shrubs generally extend to the hillsides and forests are distributed near the foot of the mountain. This vertical zoning feature is also unrecognizable at a resolution of 500 m. In addition, some researchers have noted that coarse-resolution images cannot accurately reveal the presence of shrubs [55]. In addition to the detection of vegetation, resolution also has a significant impact on the detection of water. Most soil types in the Arctic are permafrost. As Arctic temperatures continue to warm, the thawing of permafrost becomes more evident. This has led to an increase in inland water bodies in the Arctic, which may affect wetland areas and carbon dioxide and methane emissions in the Arctic region [16,20,56]. In fact, a significant increase in wetland areas is observed in the differences between GlobeLand30 2000 and 2010. This also indirectly illustrates the importance of accurately identifying inland water bodies, and 500-m or 300-m land cover products cannot accurately detect changes in inland waters, such as the emergence or disappearance of some small lakes [17]. In terms of monitoring human activities, 30-m resolution products also have significant advantages. Although the Arctic has been comparatively less developed and utilized by humans, the impact of humans on the Arctic’s fragile ecological environment should not be ignored, especially in the context of current global warming. A clear understanding of the areas and manners of human activity in the Arctic is important in the protection and use of the region and its resources. Due to the fact that the Arctic is sparsely populated and there are few large settlements such as those in middle and low latitudes, it is difficult to accurately detect artificial surfaces in the Arctic region with a resolution of 500 m. Therefore, based on the aforementioned aspects, the advantages of high-resolution imagery for this region are evident.
In addition to the shortcomings in the classification methods and data, the classification system is also one of the reasons for the low classification accuracy of the global land cover data in the Arctic. The global land cover classification system was established for global classification, with due consideration of global land cover characteristics, which inevitably led to limitations in its application to such a unique geographical location as the Arctic. In regard to shrubs, although several global land cover products include this land cover type, the accuracy of these land cover products for the Arctic is unsatisfactory. Even MODIS-LC produces large-scale misclassifications, due not only to poor samples or technical reasons but also the different growth patterns of shrubs at high latitudes compared to middle and low latitudes [57]. Another noteworthy issue includes the distribution of lichens/mosses in the Arctic. Among the compared products, only CCI-LC treats lichens and mosses as separate types. The distribution of lichens is of great significance to the study of reindeer pastures and environmental pollution. However, this type is ignored from the perspective of global classification. Until currently, there has been no universally recognized and accepted land cover classification system for the Arctic and high latitudes. There are many subjects worthy of further exploration and study [58]. The classification systems used for different research purposes vary widely. In local studies, some investigations for specific purposes, such as studies on carbon storage and carbon emissions, and studies on wetland models, often use high-resolution images to meticulously divide the land cover types. However, such division is not applicable to the entire Arctic region. The classification abilities of low- and medium-resolution remote sensing images limit the feasibility of meticulous division. Therefore, in the use of low- and medium-resolution images for land cover classification, it is necessary to integrate similar types or those with small differences. Langford recently proposed dividing the vegetation on the Arctic tundra into graminoid types, lichens, mosses and forbs.
Finally, researchers must establish a shared reference database for the Arctic region [59], which is particularly important as data acquisition is difficult in the Arctic. Fieldwork data with high confidence will be of great assistance in land cover classification and the evaluation of classification results. The quality of sample points is closely related to the final classification results. Some studies have indicated that in Eurasia’s Arctic region, the classification difference between Siberia and the Far East is greater than that between Northern Europe and Western Russia, which may be attributed to scarce field sampling data in remote areas. Establishing a shared reference library is important for both the production of remote sensing products in the early stages and in the analysis of subsequent geographic results.

5. Conclusions

To provide a reference for the application of global land cover products in the Arctic region, this study compared and evaluated four commonly used global land cover products, formulating the following conclusions: (1) Among the four land cover products, CCI-LC has the highest accuracy in the Arctic (63.5%); GlobeLand30 has the next best overall accuracy (62.2%); and the overall accuracy of GLCNMO is below 50% (only 48.8%). MODIS land cover has distinct deviations in the Arctic region, and its overall accuracy is only 29.5%. Therefore, the use of MODIS and GLCNMO land cover products is not recommended in Arctic-related studies. (2) Based on an evaluation of the agreement among the four land cover products, the areas with better classification results and those with unsatisfactory classification in the Arctic region are provided for future reference. (3) GlobeLand30 is the best choice among the four products when finely divided and unevenly distributed surface features, such as water bodies, urban areas and cropland, are involved. CCI-LC has the highest overall accuracy, and its classification accuracies in forests, shrubs, sparse vegetation, snow/ice and water bodies are all good. The overall accuracy of GlobeLand30 is not much different from that of CCI-LC, both of which exhibited the greatest difference in the classification of shrubs. CCI-LC performs better than GlobeLand30 in this classification, whereas the latter obtains higher accuracy than the former in classifying urban areas and cropland. In general, the existing global land cover products are not ideal in terms of accuracy for the Arctic and are not suitable for studies on land cover changes in the region.

Author Contributions

L.L. drafted the manuscript and was responsible for the research design, data processing and results analysis. Q.L. reviewed the manuscript and was responsible for the research design, technical support and analysis. H.L. and C.H. supported the data preparation. G.L. provided some useful suggestions on data comparison. All of the authors contributed to editing and reviewing the manuscript.

Funding

This research was funded by the National Key Research and Development Program of China, No. 2016YFC1402701.

Acknowledgments

Thanks to the National Key Research and Development Program of China, No. 2016YFC1402701. Thanks to Yongke Yang for his help in the gird net problem.

Conflicts of Interest

The authors declare no conflicts of interest.

References

  1. Friedl, M.A.; Sulla-Menashe, D.; Tan, B.; Schneider, A.; Ramankutty, N.; Sibley, A.; Huang, X. Modis collection 5 global land cover: Algorithm refinements and characterization of new datasets. Remote Sens. Environ. 2010, 114, 168–182. [Google Scholar] [CrossRef]
  2. Mcguire, A.D.; Melillo, J.M.; Kicklighter, D.W.; Pan, Y.; Schloss, A.L. Equilibrium responses of global net primary production and carbon storage to doubled atmospheric carbon dioxide: Sensitivity to changes in vegetation nitrogen concentration. Glob. Biogeochem. Cycles 1997, 11, 173–189. [Google Scholar] [CrossRef] [Green Version]
  3. Schlesinger, W.H. Biogeochemistry: An analysis of global change. Q. Rev. Biol. 1997, 54, 353–423. [Google Scholar]
  4. Anisimov, O.; Kokorev, V.; Zhil’tsova, Y. Temporal and spatial patterns of modern climatic warming: Case study of northern eurasia. Clim. Chang. 2013, 118, 871–883. [Google Scholar] [CrossRef]
  5. Reynolds, J.F.; Tenhunen, J.D. Landscape function and disturbance in arctic tundra. Ecol. Stud. 1996, 120. [Google Scholar]
  6. Lloyd, A.H. Ecological histories from alaskan tree lines provide insight into future change. Ecology 2005, 86, 1687–1695. [Google Scholar] [CrossRef]
  7. Holtmeier, F.K.; Broll, G. Sensitivity and response of northern hemisphere altitudinal and polar treelines to environmental change at landscape and local scales. Glob. Ecol. Biogeogr. 2005, 14, 395–410. [Google Scholar] [CrossRef]
  8. Kullman, L. Rapid recent range-margin rise of tree and shrub species in the swedish scandes. J. Ecol. 2010, 90, 68–77. [Google Scholar] [CrossRef]
  9. Coops, N.C.; Morsdorf, F.; Schaepman, M.E.; Zimmermann, N.E. Characterization of an alpine tree line using airborne lidar data and physiological modeling. Glob. Chang. Biol. 2014, 19, 3808–3821. [Google Scholar] [CrossRef] [PubMed]
  10. Jia, G.J.; Epstein, H.E.; Walker, D.A. Spatial heterogeneity of tundra vegetation response to recent temperature changes. Glob. Chang. Biol. 2010, 12, 42–55. [Google Scholar] [CrossRef]
  11. Elmendorf, S.C.; Henry, G.H.R.; Hollister, R.D.; Björk, R.G.; Boulangerlapointe, N.; Cooper, E.J.; Cornelissen, J.H.C.; Day, T.A.; Dorrepaal, E.; Elumeeva, T.G. Plot-scale evidence of tundra vegetation change and links to recent summer warming. Nat. Clim. Chang. 2012, 2, 453–457. [Google Scholar] [CrossRef]
  12. Frost, G.V.; Epstein, H.E.; Walker, D.A.; Matyshak, G.; Ermokhina, K. Seasonal and long-term changes to active-layer temperatures after tall shrubland expansion and succession in arctic tundra. Ecosystems 2017, 21, 1–14. [Google Scholar] [CrossRef]
  13. Atkins, J.; Epstein, H.; Welsch, D.L. Using landsat imagery to map understory shrub expansion relative to landscape position in a mid-appalachian watershed. Ecosphere 2018, 9, e02404. [Google Scholar] [CrossRef]
  14. Muskett, R.R.; Romanovsky, V.E. Groundwater storage changes in arctic permafrost watersheds from grace and in situ measurements. Environ. Res. Lett. 2009, 4, 045009. [Google Scholar] [CrossRef]
  15. Karlsson, J.M.; Lyon, S.W.; Destouni, G. Thermokarst lake, hydrological flow and water balance indicators of permafrost change in western siberia. J. Hydrol. 2012, 464–465, 459–466. [Google Scholar] [CrossRef]
  16. Raudina, T.V.; Loiko, S.V.; Lim, A.; Manasypov, R.M.; Shirokova, L.S.; Istigechev, G.I.; Kuzmina, D.M.; Kulizhsky, S.P.; Vorobyev, S.N.; Pokrovsky, O.S. Permafrost thaw and climate warming may decrease the co 2, carbon, and metal concentration in peat soil waters of the western siberia lowland. Sci. Total Environ. 2018, 634, 1004–1023. [Google Scholar] [CrossRef]
  17. Sui, Y.; Fu, D.; Wang, X.; Su, F. Surface water dynamics in the north america arctic based on 2000–2016 landsat data. Water 2018, 10, 824. [Google Scholar] [CrossRef]
  18. Gian-Reto, W.; Eric, P.; Peter, C.; Annette, M.; Camille, P.; Beebee, T.J.C.; Jean-Marc, F.; Ove, H.G.; Franz, B. Ecological responses to recent climate change. Nature 2002, 416, 389–395. [Google Scholar]
  19. Pearson, R.G.; Phillips, S.J.; Loranty, M.M.; Beck, P.S.A.; Damoulas, T.; Knight, S.J.; Goetz, S.J. Shifts in arctic vegetation and associated feedbacks under climate change. Nat. Clim. Chang. 2013, 3, 673–677. [Google Scholar] [CrossRef]
  20. Schuur, E.A.; McGuire, A.D.; Schadel, C.; Grosse, G.; Harden, J.W.; Hayes, D.J.; Hugelius, G.; Koven, C.D.; Kuhry, P.; Lawrence, D.M.; et al. Climate change and the permafrost carbon feedback. Nature 2015, 520, 171–179. [Google Scholar] [CrossRef]
  21. Walker, D.A.; Bay, C.; Daniëls, F.J.A.; Einarsson, E.; Elvebakk, A.; Johansen, B.E.; Kapitsa, A.; Kholod, S.S.; Murray, D.F.; Talbot, S.S. Toward a new arctic vegetation map: A review of existing maps. J. Veg. Sci. 1995, 6, 427–436. [Google Scholar] [CrossRef]
  22. Walker, D.A.; Gould, W.A.; Maier, H.A.; Raynolds, M.K. The circumpolar arctic vegetation map: Avhrr-derived base maps, environmental controls, and integrated mapping procedures. Int. J. Remote Sens. 2002, 23, 4551–4570. [Google Scholar] [CrossRef]
  23. Rees, G.; Danks, F. Derivation and Assessment of Vegetation Maps for Reindeer Pasture Analysis in Arctic European Russia. Remote Sens. Environ. 2007, 43, 290–304. [Google Scholar] [CrossRef]
  24. Virtanen, T.; Ek, M. The fragmented nature of tundra landscape. Int. J. Appl. Earth Obs. Geoinf. 2014, 27, 4–12. [Google Scholar] [CrossRef]
  25. Virtanen, T.; Mikkola, K.; Nikula, A. Satellite image based vegetation classification of a large area using limited ground reference data: A case study in the usa basin, north-east european russia. Polar Res. 2004, 23, 51–66. [Google Scholar] [CrossRef]
  26. Schneider, J.; Grosse, G.; Wagner, D. Land cover classification of tundra environments in the arctic lena delta based on landsat 7 etm+ data and its application for upscaling of methane emissions. Remote Sens. Environ. 2009, 113, 380–391. [Google Scholar] [CrossRef]
  27. Scepan, J.; Menz, G.; Hanse, M.C. The discover validation image interpretation process. Photogramm. Eng. Remote Sens. 1999, 65, 1075–1081. [Google Scholar]
  28. Mayaux, P.; Eva, H.; Gallego, J.; Strahler, A.H.; Herold, M.; Agrawal, S.; Naumov, S.; De Miranda, E.E.; Bella, C.M.D.; Ordoyne, C. Validation of the global land cover 2000 map. Trans. Geosci. Remote Sens. Ieee 2006, 44, 1728–1739. [Google Scholar] [CrossRef] [Green Version]
  29. Kasimu, A. Production of global land cover data-glcnmo. J. Geogr. Geol. 2014, 4, 22–49. [Google Scholar]
  30. Defourny, P.; Kirches, G.; Brockmann, C.; Boettcher, M.; Peters, M.; Bontemps, S.; Lamarche, C.; Schlerf, M.; Santoro, M. Land Cover CCI: Product User Guide Version 2. 2016. Available online: http://maps.elie.ucl.ac.be/CCI/ viewer/download/ESACCI-LC-PUG-v2.5.pdf (accessed on 5 March 2016).
  31. Gong, P.; Wang, J.; Yu, L.; Zhao, Y.; Zhao, Y.; Liang, L.; Niu, Z.; Huang, X.; Fu, H.; Liu, S. Finer resolution observation and monitoring of global land cover: First mapping results with landsat tm and etm+ data. Int. J. Remote Sens. 2013, 34, 2607–2654. [Google Scholar] [CrossRef]
  32. Chen, J.; Chen, J.; Liao, A.; Cao, X.; Chen, L.; Chen, X.; He, C.; Han, G.; Peng, S.; Lu, M. Global land cover mapping at 30 m resolution: A pok-based operational approach. J. Photogramm. Remote Sens. 2015, 103, 7–27. [Google Scholar] [CrossRef]
  33. Pérez-Hoyos, A.; García-Haro, F.J.; San-Miguel-Ayanz, J. Conventional and fuzzy comparisons of large scale land cover products: Application to corine, glc2000, modis and globcover in europe. Isprs J. Photogramm. Remote Sens. 2012, 74, 185–201. [Google Scholar] [CrossRef]
  34. Masellia, F.; Conesea, C.; Petkovb, L. Use of probability entropy for the estimation and graphical representation of the accuracy of maximum likelihood classifications. Isprs J. Photogramm. Remote Sens. 1994, 49, 13–20. [Google Scholar] [CrossRef]
  35. Colditz, R.R.; Saldaña, G.L.; Maeda, P.; Espinoza, J.A.; Tovar, C.M.; Hernández, A.V.; Benítez, C.Z.; López, I.C.; Ressl, R. Generation and analysis of the 2005 land cover map for mexico using 250 m modis data. Remote Sens. Environ. 2012, 123, 541–552. [Google Scholar] [CrossRef]
  36. Tchuenté, A.T.K.; Roujean, J.L.; Jong, S.M.D. Comparison and relative quality assessment of the glc2000, globcover, modis and ecoclimap land cover data sets at the african continental scale. Int. J. Appl. Earth Obs. Geoinform. 2011, 13, 207–219. [Google Scholar] [CrossRef]
  37. Kuenzer, C.; Leinenkugel, P.; Vollmuth, M.; Dech, S. Comparing global landcover products–implications for geoscience applications: an investigation for the trans-boundary Mekong Basin. Int. J. Remote Sens. 2014, 35, 2752–2779. [Google Scholar] [CrossRef]
  38. Bai, Y.; Feng, M.; Jiang, H.; Wang, J.; Zhu, Y.; Liu, Y. Assessing consistency of five global land cover data sets in China. Remote Sen. 2014, 6, 8739–8759. [Google Scholar] [CrossRef]
  39. Yang, Y.; Xiao, P.; Feng, X.; Li, H. Accuracy assessment of seven global land cover datasets over China. ISPRS J. Photogramm. Remote Sens. 2017, 125, 156–173. [Google Scholar] [CrossRef]
  40. Krankina, O.N.; Pflugmacher, D.; Hayes, D.J.; McGuire, A.D.; Hansen, M.C.; Häme, T.; Elsakov, V.; Nelson, P. Vegetation cover in the eurasian arctic: Distribution, monitoring, and role in carbon cycling. In Eurasian Arctic Land Cover and Land Use in a Changing Climate; Springer: Dordrecht, The Netherlands, 2010; pp. 79–108. [Google Scholar]
  41. Bartsch, A.; Höfler, A.; Kroisleitner, C.; Trofaier, A.M. Land cover mapping in northern high latitude permafrost regions with satellite data: Achievements and remaining challenges. Remote Sens. 2016, 8, 980. [Google Scholar] [CrossRef]
  42. Hansen, M.C.; Defries, R.S.; Townshend, J.R.G.; Sohlberg, R. Global land cover classification at 1 km spatial resolution using a classification tree approach. Int. J. Remote Sens. 2000, 21, 1331–1364. [Google Scholar] [CrossRef]
  43. Loveland, T.R.; Reed, B.C.; Brown, J.F.; Ohlen, D.O.; Zhu, Z.; Yang, L.; Merchant, J.W. Development of a global land cover characteristics database and igbp discover from 1 km avhrr data. Int. J. Remote Sens. 2000, 21, 1303–1330. [Google Scholar] [CrossRef]
  44. Corresponding, E.B.; Belward, A.S. Glc2000: A new approach to global land cover mapping from earth observation data. Int. J. Remote Sens. 2005, 26, 1959–1977. [Google Scholar]
  45. Bontemps, S.; Defourny, P.; Brockmann, C.; Herold, M.; Kalogirou, V.; Arino, O. New global land cover mapping exercise in the framework of the ESA Climate Change Initiative. In Proceedings of the 2012 IEEE International Geoscience and Remote Sensing Symposium, Munich, Germany, 22–27 July 2012. [Google Scholar]
  46. Arino, O.; Bicheron, P.; Achard, F.; Latham, J.; Witt, R.; Weber, J.L. Globcover: The most detailed portrait of earth. Esa Bull. Bull. Ase. Eur. Space Agency 2008, 2008, 24–31. [Google Scholar]
  47. Clark, M.L.; Aide, T.M.; Grau, H.R.; Riner, G. A scalable approach to mapping annual land cover at 250 m using MODIS time series data: a case study in the Dry Chaco ecoregion of South America. Remote Sens. Environ. 2010, 114, 2816–2832. [Google Scholar] [CrossRef]
  48. Frey, K.E.; Smith, L.C. How well do we know northern land cover? Comparison of four global vegetation and wetland products with a new ground-truth database for West Siberia. Glob. Biogeochem. Cycles 2007, 21. [Google Scholar] [CrossRef]
  49. Rees, W.G.; Williams, M.; Vitebsky, P. Mapping land cover change in a reindeer herding area of the russian arctic using landsat tm and etm+ imagery and indigenous knowledge. Remote Sens. Environ. 2003, 85, 441–452. [Google Scholar] [CrossRef]
  50. Sullamenashe, D.; Friedl, M.A.; Krankina, O.N.; Baccini, A.; Woodcock, C.E.; Sibley, A.; Sun, G.; Kharuk, V.; Elsakov, V. Hierarchical mapping of northern eurasian land cover using modis data. Remote Sens. Environ. 2011, 115, 392–403. [Google Scholar] [CrossRef]
  51. Rees, G. Characterisation of arctic treelines by lidar and multispectral imagery. Polar Rec. 2007, 43, 345–352. [Google Scholar] [CrossRef]
  52. Ørka, H.O.; Wulder, M.A.; Gobakken, T.; Næsset, E. Subalpine zone delineation using lidar and landsat imagery. Remote Sens. Environ. 2012, 119, 11–20. [Google Scholar] [CrossRef]
  53. Reese, H.; Nyström, M.; Nordkvist, K.; Olsson, H. Combining airborne laser scanning data and optical satellite data for classification of alpine vegetation. Int. J. Appl. Earth Obs. Geoinform. 2014, 27, 81–90. [Google Scholar] [CrossRef]
  54. Bolton, D.; Coops, N.; Hermosilla, T.; Wulder, M.; White, J. Evidence of vegetation greening at alpine-treeline ecotones: Three decades of landsat spectral trends informed by lidar-derived vertical structure. Environ. Res. Lett. 2018, 13, 084022. [Google Scholar] [CrossRef]
  55. Westermann, S.; Østby, T.I.; Gisnås, K.; Schuler, T.V.; Etzelmüller, B. A ground temperature map of the north atlantic permafrost region based on remote sensing and reanalysis data. Cryosphere 2015, 9, 753–790. [Google Scholar] [CrossRef]
  56. Keller, K.; Blum, J.D.; Kling, G.W. Stream geochemistry as an indicator of increasing permafrost thaw depth in an arctic watershed. Chem. Geol. 2010, 273, 76–81. [Google Scholar] [CrossRef]
  57. Christie, K.S.; Lindberg, M.S.; Ruess, R.W.; Schmutz, J.A. Spatio-temporal patterns of ptarmigan occupancy relative to shrub cover in the arctic. Polar Biol. 2014, 37, 1111–1120. [Google Scholar] [CrossRef]
  58. Walker, D.A.; Daniëls, F.J.A.; Alsos, I.; Bhatt, U.S.; Breen, A.L.; Buchhorn, M.; Bültmann, H.; Druckenmiller, L.A.; Edwards, M.E.; Ehrich, D. Circumpolar arctic vegetation: A hierarchic review and roadmap toward an internationally consistent approach to survey, archive and classify tundra plot data. Environ. Res. Lett. 2016, 11, 055005. [Google Scholar] [CrossRef]
  59. Pope, A.; Rees, W.G.; Fox, A.J.; Fleming, A. Open access data in polar and cryospheric remote sensing. Remote Sens. 2014, 6, 6183–6220. [Google Scholar] [CrossRef]
Figure 1. Reclassified (a) Climate Change Initiative Land Cover (CCI-LC 2010), (b) GlobeLand30-2010, (c) Global Land Cover by the National Mapping Organization (GLCNMO)-2008 and (d) Moderate Resolution Imaging Spectroradiometer Land Cover (MODIS-LC) 2001.
Remotesensing 11 01396 g001
Figure 2. Percentage of every class type in the four land cover products.
Remotesensing 11 01396 g002
Figure 3. Total pixel count of the seven aggregated classes from the four land cover products.
Remotesensing 11 01396 g003
Figure 4. Spatial Comparison of aggregated land cover classes between: (a) GlobeLand 30 and CCI-LC, (b) CCI-LC and GLCNMO, (c) GlobeLand 30 and GLCNMO, (d) MODIS-LC and GlobeLand 30.
Remotesensing 11 01396 g004
Figure 5. Spatial distribution of validation point.
Remotesensing 11 01396 g005
Figure 6. Confusion matrices of CCI-LC 2010.
Remotesensing 11 01396 g006
Figure 7. Confusion matrices of GLCNMO 2008.
Remotesensing 11 01396 g007
Figure 8. Confusion matrices of MODIS-LC 2010.
Remotesensing 11 01396 g008
Figure 9. Confusion matrices of GlobeLand30 2010.
Remotesensing 11 01396 g009
Figure 10. Spatial consistency of the four land cover products.
Remotesensing 11 01396 g010
Table 1. Land cover data parameters.
DataTimeResolutionMethodData Source/SensorClassification SystemOverall Accuracy
GlobCover2005 and 2009300 mSupervised/unsupervised classificationMERISLCCS (22)67.10%
MODIS LC(MCD12C1) 2001–2012, (MCD12Q1) 2001–2012, (MCD12Q2) 2001–2013(MCD12C1) 0.05° ≈ 5600 m
(MCD12Q1 and MCD12Q2) 500 m
Decision-making tree, artificial neural networkTerraIGBP (17)75%
GLCNMO2003, 2008, 20131 kmSupervised classification tree methodTerraLCCS (20)87.00%
IGBP DISCoverApril 1992–March 19931 kmUnsupervised classification, post-classification processingNOAA-AVHRRIGBP (17)66.90%
GlobeLand302000, 201030 mPOK-basedLandsatTM/ETM+(10)80.50%
GLC-SHARE20121 kmData fusionGLC2009, CroplandsExtent, MODISVCF 2010, Mangroves, Africover, CorineLC, NorthAmericaLCCS (11)80.20%
UMDApril 1992–March 19931°, 8 km, 1 kmSupervised classification tree methodNOAA-AVHRRIGBP (14)69%
CCI-LC2000, 2005, 2010300 mUnsupervised classificationMERISFR, MERISRR SPOT-VGTLCCS (22)74.10%
GLC2000November 1999–December 2000950 mUnsupervised classificationSPOT-4 VEGETATIONLCCS (22)68.6 ± 5%
Table 2. Generalized global land-cover legend with corresponding classes from individual global legends.
Target LegendCodeGLOBALAND30CodeMODIS-LCCodeCCI-LCCodeGLCNMO
Forest20Forest1Needleleaf evergreen forest60Broadleaf deciduous closed to open (>15%)1Broadleaf evergreen forest
61Broadleaf deciduous closed (>40%)
2Broadleaf evergreen forest62Broadleaf deciduous open (15%–40%)2Broadleaf deciduous forest
70Needleleaf evergreen closed to open (>15%)
3Needleleaf deciduous forest71Needleleaf evergreen closed (>40%)3Needleleaf evergreen forest
72Needleleaf evergreen open (15%–40%)4 Needleleaf deciduous forest
4Broadleaf deciduous forest80Needleleaf deciduous closed to open (>15%)
90mixed leaf type5Mixed forest
5Mixed forest100Mosaic tree and shrub (>50%)
160Wetland tree6Tree open
Shrubland40Shrubland6Closed shrublands120Shrubland7Shrub
121Shrubland evergreen
7Open shrublands122Shrubland deciduous
Herbaceous30Grassland8Woody savannas110Mosaic herbaceous cover (>50%)8Herbaceous
9Savannas
10Grasslands130Grassland
Sparse vegetation70Tundra16Sparse vegetation140Lichens and mosses10Sparse vegetation
150Sparse vegetation (<15%)
152Sparse shrub (<15%)16Bare area, consolidated (gravel, rock)
90Bare area153Sparse herbaceous cover (<15%)
200Bare areas17Bare area, unconsolidated (sand)
201Consolidated bare areas
202Unconsolidated bare areas
Cropland10Cropland12Cropland10Cropland11Cropland
11Herbaceous cove
14Cropland/vegetation mosaic30Mosaic cropland (>50%)/natural vegetation13Cropland/other vegetation mosaic
40Mosaic natural vegetation
Wetland50Wetland11Permanent wetlands180Wetland shrub or herbaceous15Wetland
Urban80Urban13Urban190Urban areas18Urban
Snow/ice100Snow/ice15Snow/ice220Permanent snow and ice19Snow/ice
Water bodies60Water bodies0Water bodies210Water bodies20Water bodies

