Improvement of Hourly Surface Solar Irradiance Estimation Using MSG Rapid Scanning Service

 , ,
, ,  ,
,  , ,
, ,  , , , and
Abstract
:
1. Introduction
2. Materials and Methods
3. Results and Discussion
4. Conclusions
Author Contributions
Funding
Conflicts of Interest
References
- Besharat, F.; Dehghan, A.A.; Faghih, A.R. Empirical models for estimating global solar radiation: A review and case study. Renew. Sustain. Energy Rev. 2013, 21, 798–821. [Google Scholar] [CrossRef]
- Trnka, M.; Žalud, Z.; Eitzinger, J.; Dubrovský, M. Global solar radiation in Central European lowlands estimated by various empirical formulae. Agric. Meteorol. 2005, 131, 54–76. [Google Scholar] [CrossRef]
- Dagon, K.; Schrag, D.P. Exploring the effects of solar radiation management on water cycling in a coupled land–atmosphere model. J. Clim. 2016, 29, 2635–2650. [Google Scholar] [CrossRef]
- Zhang, Q.; Cui, N.; Feng, Y.; Jia, Y.; Li, Z.; Gong, D. Comparative Analysis of Global Solar Radiation Models in Different Regions of China. Adv. Meteorol. 2018, 2018, 389483. [Google Scholar] [CrossRef]
- Huang, J.; Yu, H.; Guan, X.; Wang, G.; Guo, R. Accelerated dryland expansion under climate change. Nat. Clim. Chang. 2016, 6, 166–171. [Google Scholar] [CrossRef]
- Yang, K.; Koike, T. A general model to estimate hourly and daily solar radiation for hydrological studies. Water Resour. 2005, 41. [Google Scholar] [CrossRef] [Green Version]
- Shook, K.R.; Pomeroy, J.W. Memory effects of depressional storage in northern prairie hydrology. Hydrol. Process. 2011, 25, 3890–3898. [Google Scholar] [CrossRef]
- Lapo, K.E.; Hinkelman, L.M.; Sumargo, E.; Hughes, M.; Lundquist, J.D. A critical evaluation of modeled solar irradiance over California for hydrologic and land-surface modeling. J. Geophys. Res. Atmos. 2016, 122, 299–317. [Google Scholar] [CrossRef]
- Kothe, S.; Dobler, A.; Beck, A.; Ahrens, B. The radiation budget in a regional climate model. Clim. Dyn. 2011, 36, 1023–1036. [Google Scholar] [CrossRef]
- Benghanem, M.; Mellit, A. Radial Basis Function Network-Based Prediction of Global Solar Radiation Data: Application for Sizing of a Stand-Alone Photovoltaic System Al-Madinah, Saudi Arabia. Energy 2010, 35, 3751–3762. [Google Scholar] [CrossRef]
- Clack, C.T.M. Modeling Solar Irradiance and Solar PV Power Output to Create a Resource Assessment Using Linear Multiple Multivariate Regression. J. Appl. Meteorol. Climatol. 2017, 56, 109–125. [Google Scholar] [CrossRef]
- Ruiz-Arias, J.A.; Gueymard, C.A. Extensive worldwide validation and climate sensitivity analysis of direct irradiance predictions from 1-min global irradiance. Sol. Energy 2016, 128, 1–30. [Google Scholar]
- Vignola, F. Variability of Solar Radiation Data over Short Time Intervals. Available online: https://pdfs.semanticscholar.org/ad5b/02eae64bb287d4a0fbab5cc05c243039a11e.pdf (accessed on 1 January 2019).
- Perez, R.; Seals, R.; Zelenka, A. Comparing satellite remote sensing and ground network measurements for the production of site/time specific irradiance data. Sol. Energy 1997, 60, 89–96. [Google Scholar] [CrossRef]
- Zelenka, A.; Czeplak, G.; D’Agostino, V.; Josefson, W.; Maxwell, E.; Perez, R. Techniques for Supplementing Solar Radiation Network Data; International Energy Agency: Paris, France, 1992. [Google Scholar]
- Wang, Q. A model to estimate global radiation in complex terrain. Bound. Layer Meteorol. 2006, 119, 409–429. [Google Scholar] [CrossRef]
- Perez, R.; Seals, R.; Zelenka, A. Production of site/time-specific hourly irradiances—Satellite remote sensing vs. network interpolation. In Production of Site/Time-Specific Irradiances from Satellite and Ground Data; Report 98-3; New York State Energy Research and Development Authority: Albany, NY, USA, 1998. [Google Scholar]
- Perez, R.; Aguiar, R.; Collares-Pereira, M.; Dumortier, D.; Estrada-Cajigal, V.; Gueymard, C.; Ineichen, P.; Littlefair, P.; Lund, H.; Michalsky, J.; et al. Solar resource assessment: A review. In Solar Energy—The State of the Art, Position Papers; James and James Science Publishers: London, UK, 2001; pp. 497–562. [Google Scholar]
- Cano, D.; Monget, J.M.; Albuisson, M.; Guillard, H.; Regas, N.; Wald, L. A method for the determination of the global solar radiation from meteorological satellite data. Sol. Energy 1986, 37, 31–39. [Google Scholar] [CrossRef] [Green Version]
- Hammer, A.; Heinemann, D.; Hoyer, C.; Lorenz, E.; Muller, R.; Beyer, H.G. Solar energy assessment using remote sensing technologies. Remote Sens. Environ. 2003, 86, 423–432. [Google Scholar] [CrossRef] [Green Version]
- Qu, Z.; Oumbe, A.; Blanc, P.; Espinar, B.; Gesell, G.; Gschwind, B.; Klüser, L.; Lefèvre, M.; Saboret, L.; Schroedter-Homscheidt, M.; et al. Fast radiative transfer parameterisation for assessing the surface solar irradiance: The Heliosat-4 method. Meteorol. Z. 2016, 26, 33–57. [Google Scholar] [CrossRef]
- Rigollier, C.; Lefèvre, M.; Wald, L. The method Heliosat-2 for deriving shortwave solar radiation from satellite images. Sol. Energy 2004, 77, 159–169. [Google Scholar] [CrossRef] [Green Version]
- Deneke, H.M.; Feijt, A.J.; Roebeling, R.A. Estimating surface solar irradiance from METEOSAT SEVIRI-derived cloud properties. Remote Sens. Environ. 2008, 112, 3131–3141. [Google Scholar] [CrossRef]
- Geraldi, E.; Romano, F.; Ricciardelli, E. An Advanced Model for the Estimation of the Surface Solar Irradiance under All Atmospheric Conditions Using MSG/SEVIRI Data. IEEE Trans. Geosci. Remote Sens. 2012, 50, 2934–2953. [Google Scholar] [CrossRef]
- Romano, F.; Cimini, D.; Cersosimo, A.; Di Paola, F.; Gallucci, D.; Gentile, S.; Geraldi, E.; Larosa, S.; Nilo, S.T.; Ricciardelli, E.; et al. Improvement in Surface Solar Irradiance Estimation Using HRV/MSG Data. Remote Sens. 2018, 10, 1288. [Google Scholar] [CrossRef]
- Linares-Rodriguez, A.; Ruiz-Arias, J.A.; Pozo-Vazquez, D.; Tovar-Pescador, J. An artificial neural network ensemble model for estimating global solar radiation from Meteosat satellite images. Energy 2013, 61, 636–645. [Google Scholar] [CrossRef]
- Antonanzas-Torres, F.; Urraca, R.; Antonanzas, J.; Fernandez-Ceniceros, J.; Martinez-de-Pison, F.J. Generation of daily global solar irradiation with support vector machines for regression. Energy Convers. Manag. 2015, 96, 277–286. [Google Scholar] [CrossRef]
- Zou, L.; Wang, L.; Lin, A.; Zhu, H.; Peng, Y.; Zhao, Z. Estimation of global solar radiation using an artificial neural network based on an interpolation technique in southeast China. J. Atmos. Sol. Terr. Phys. 2016, 146, 110–122. [Google Scholar] [CrossRef]
- Schmetz, J.; Pili, P.; Tjemkes, S.; Just, D.; Kerkmann, J.; Rota, S.; Ratier, A. An Introduction to Meteosat second generation (MSG). Bull. Am. Meteorol. Soc. 2002, 83, 977–992. [Google Scholar] [CrossRef]
- Gallucci, D.; Romano, F.; Cersosimo, A.; Cimini, D.; Di Paola, F.; Gentile, S.; Geraldi, E.; Larosa, S.; Nilo, S.T.; Ricciardelli, E.; et al. Nowcasting Surface Solar Irradiance with AMESIS via Motion Vector Fields of MSG-SEVIRI Data. Remote Sens. 2018, 10, 845. [Google Scholar] [CrossRef]
- World Meteorological Organization. Guide to Meteorological Instruments and Methods of Observation; WMO-No. 8; World Meteorological Organization: Geneva, Switzerland, 2014. Available online: https://www.weather.gov/media/epz/mesonet/CWOP-WMO8.pdf (accessed on 31 December 2018).
- Kippen and Zonen, Manual—Pyranometers—CMP Series—Kipp & Zonen. 2016. Available online: http://www.kippzonen.com/Download/72/Manual-Pyranometers-CMP-series-English (accessed on 31 December 2018).
- ESTI Reloaded TheEuropean Solar Test Installation. Available online: https://ec.europa.eu/jrc/sites/jrcsh/files/Esti_reloaded_en.pdf (accessed on 8 November 2018).
- Lundqvist, M.; Helmke, C.; Ossenbrink, H.A. ESTI-LOG PV plant monitoring system. Sol. Energy Mater. Sol. Cells 1997, 47, 289–294. [Google Scholar] [CrossRef]
- Ricciardelli, E.; Romano, F.; Cuomo, V. Physical and statistical approaches for cloud identification using Meteosat Second Generation-Spinning Enhanced Visible and Infrared Imager Data. Remote Sens. Environ. 2008, 112, 2741–2760. [Google Scholar] [CrossRef]
- Ricciardelli, E.; Cimini, D.; Di Paola, F.; Romano, F.; Viggiano, M. A statistical approach for rain intensity differentiation using Meteosat Second Generation-Spinning enhanced visible and infrared imager observations. Hydrol. Earth Syst. Sci. 2014, 18, 2559–2576. [Google Scholar] [CrossRef]
- Nilo, S.T.; Romano, F.; Cermak, J.; Cimini, D.; Ricciardelli, E.; Cersosimo, A.; Di Paola, F.; Gallucci, D.; Gentile, S.; Geraldi, E.; et al. Fog Detection Based on Meteosat Second Generation-Spinning Enhanced Visible and InfraRed Imager High Resolution Visible Channel. Remote Sens. 2018, 10, 541. [Google Scholar] [CrossRef]
- Mace, G.G.; Zhang, Q. The CloudSat radar-lidar geometrical profile product (RL-GeoProf): Updates, improvements, and selected results. J. Geophys. Res. Atmos. 2014, 119, 9441–9462. [Google Scholar] [CrossRef] [Green Version]
- Younes, S.; Claywell, R.; Muneer, T. Quality control of solar radiation data: Present status andproposed new approaches. Energy 2005, 30, 1533–1549. [Google Scholar] [CrossRef]
- Iqbal, M. Introduction to Solar Radiation; Academic Press Inc.: Cambridge, MA, USA, 1983. [Google Scholar]
- Clarke, P. Mathematical Modelling of BIPV-Micro Wind System: Production, Storage and Usages. Ph.D. Thesis, Napier University, Edinburgh, UK, 2009. [Google Scholar]


| Date (dd/mm/yyyy) | Ispra | Tito |
|---|---|---|
| 11 March 2018 | Cloudy | Clear or broken clouds during the morning, cloud during the afternoon |
| 12 March 2018 | Partially cloudy | Clear or broken clouds during the first morning, cloud since 10 a.m. |
| 13 March 2018 | Partially cloudy | Partially cloudy |
| 14 March 2018 | Clear, small cloud in the afternoon | Partially Clear |
| 15 March 2018 | Cloudy | Clear with cloudy passages |
| 16 March 2018 | Clear with cloudy passages | Partially cloudy |
| 17 March 2018 | Cloudy | Partially cloudy |
| 18 March 2018 | Cloudy | Partially cloudy |
| 19 March 2018 | Cloudy | Partially cloudy |
| 20 March 2018 | Cloudy during the morning, partially cloudy during the afternoon | Partially cloudy during the morning, cloudy during the afternoon |
| 21 March 2018 | Cloudy during the morning, partially clear during the afternoon | Cloudy |
| 22 March 2018 | Clear during the morning, partially cloudy during the afternoon | Cloudy |
| 23 March 2018 | Clear | Cloudy |
| 24 March 2018 | Cloudy | Partially cloudy |
| 25 March 2018 | Clear with cloudy passages | Partially cloudy |
| Date (dd/mm/yyyy) | 15-Minute Temporal Sampling | ||||||
|---|---|---|---|---|---|---|---|
| CORR | MBE (W/m2) | RMSE (W/m2) | MAE (W/m2) | MAPE (%) | nMBE (%) | nRMSE (%) | |
| 11 March 2018 | 0.997 | 3.205 | 18.733 | 13.170 | 5.821 | 0.789 | 4.6 |
| 12 March 2018 | 0.966 | 35.138 | 76.460 | 43.338 | 25.761 | 13.863 | 30.1 |
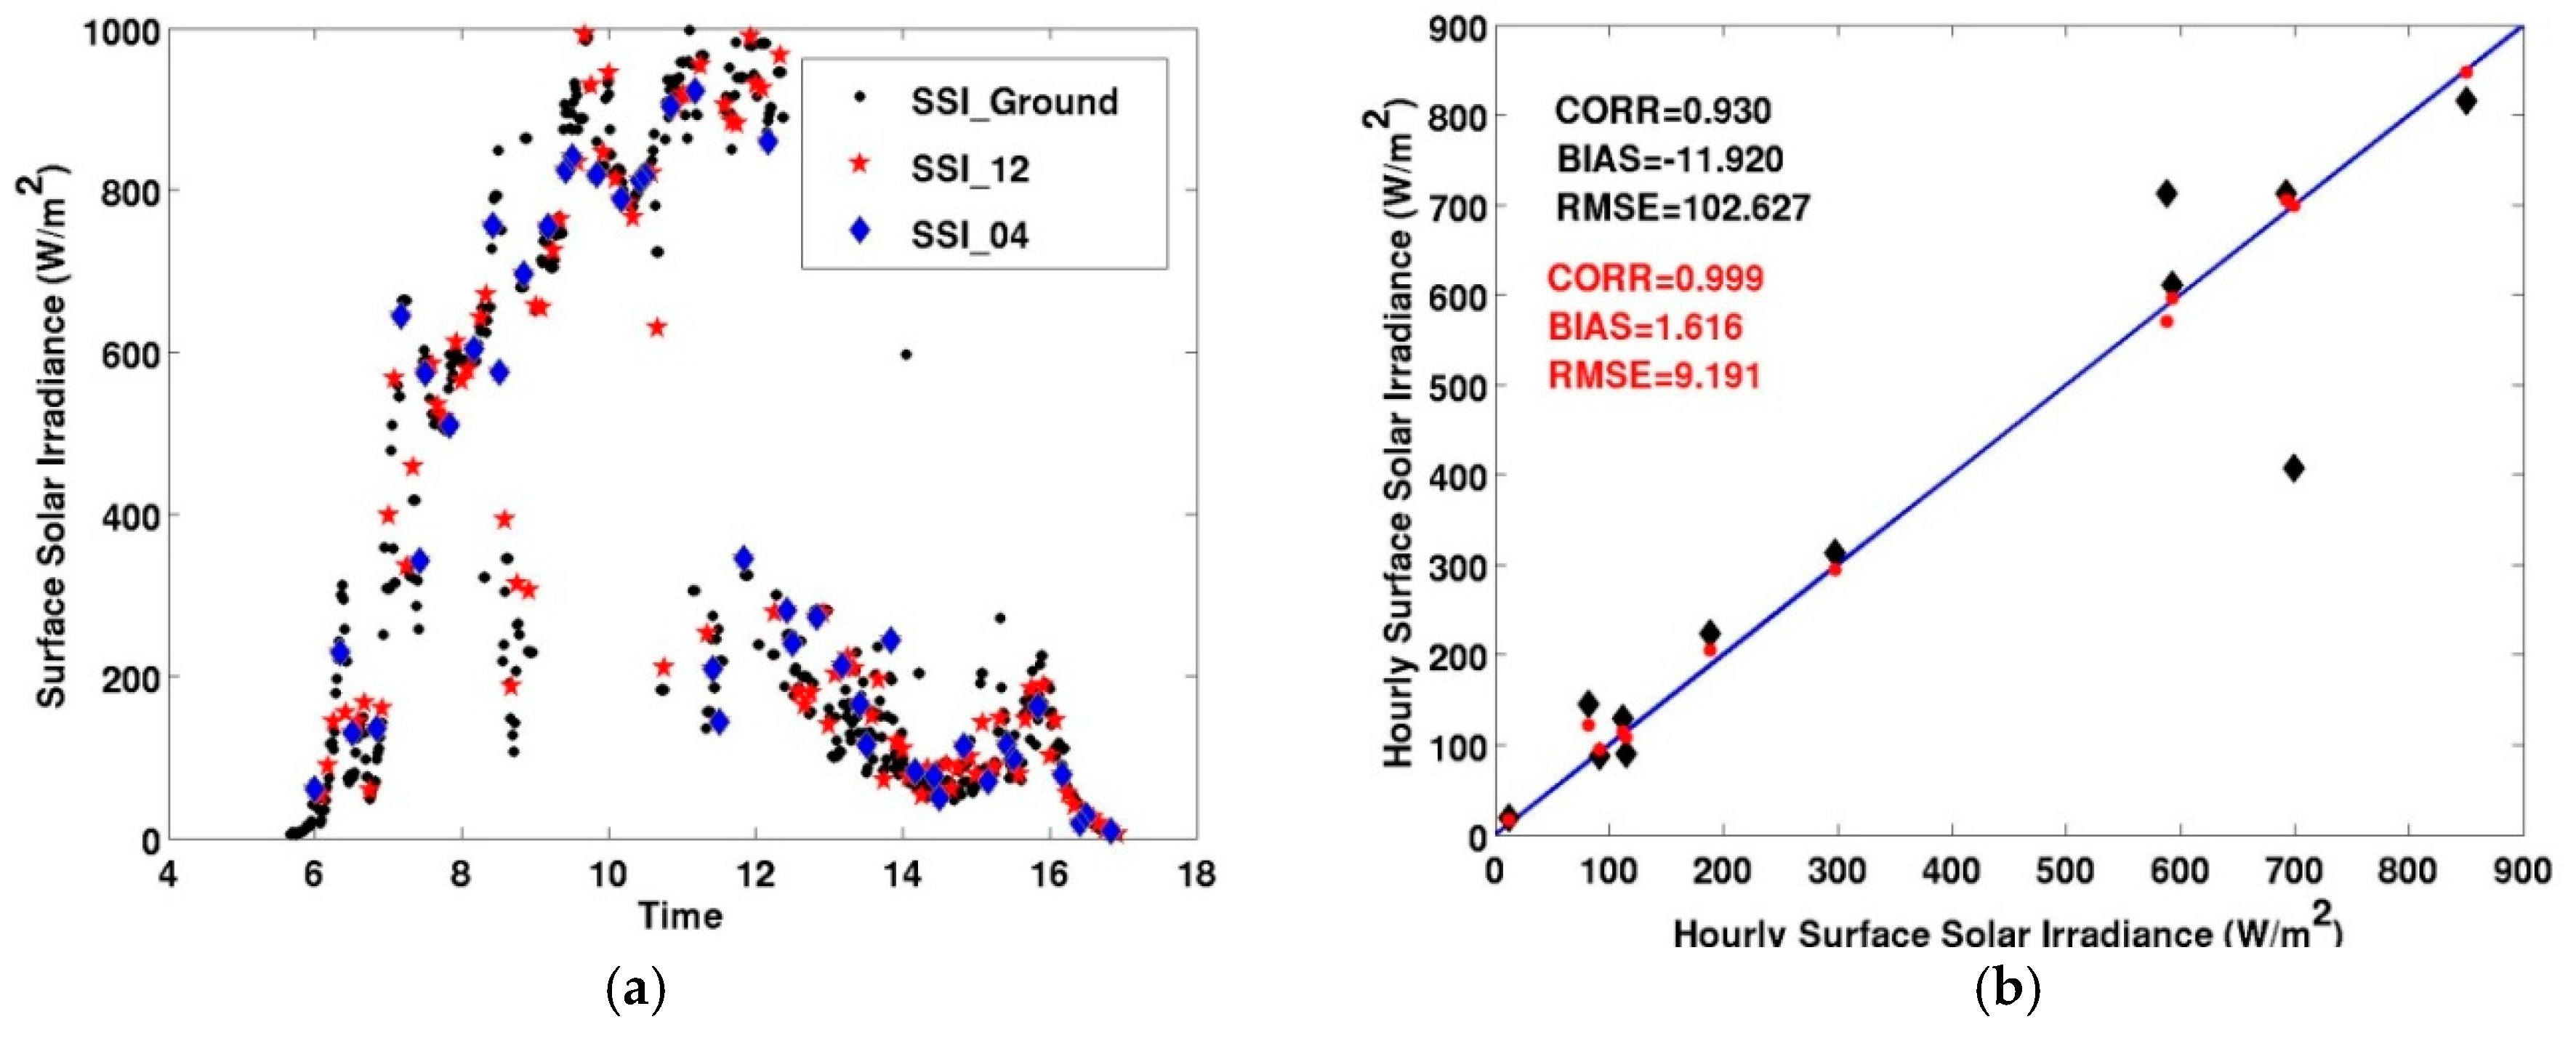
| 13 March 2018 | 0.930 | −11.920 | 102.627 | 59.080 | 14.041 | −3.023 | 26.0 |
| 14 March 2018 | 0.960 | 19.748 | 63.218 | 43.256 | 10.126 | 5.592 | 17.9 |
| 15 March 2018 | 0.991 | −9.931 | 31.714 | 26.963 | 7.700 | −2.738 | 8.7 |
| 16 March 2018 | 0.988 | 6.097 | 33.029 | 27.791 | 6.657 | 1.725 | 9.3 |
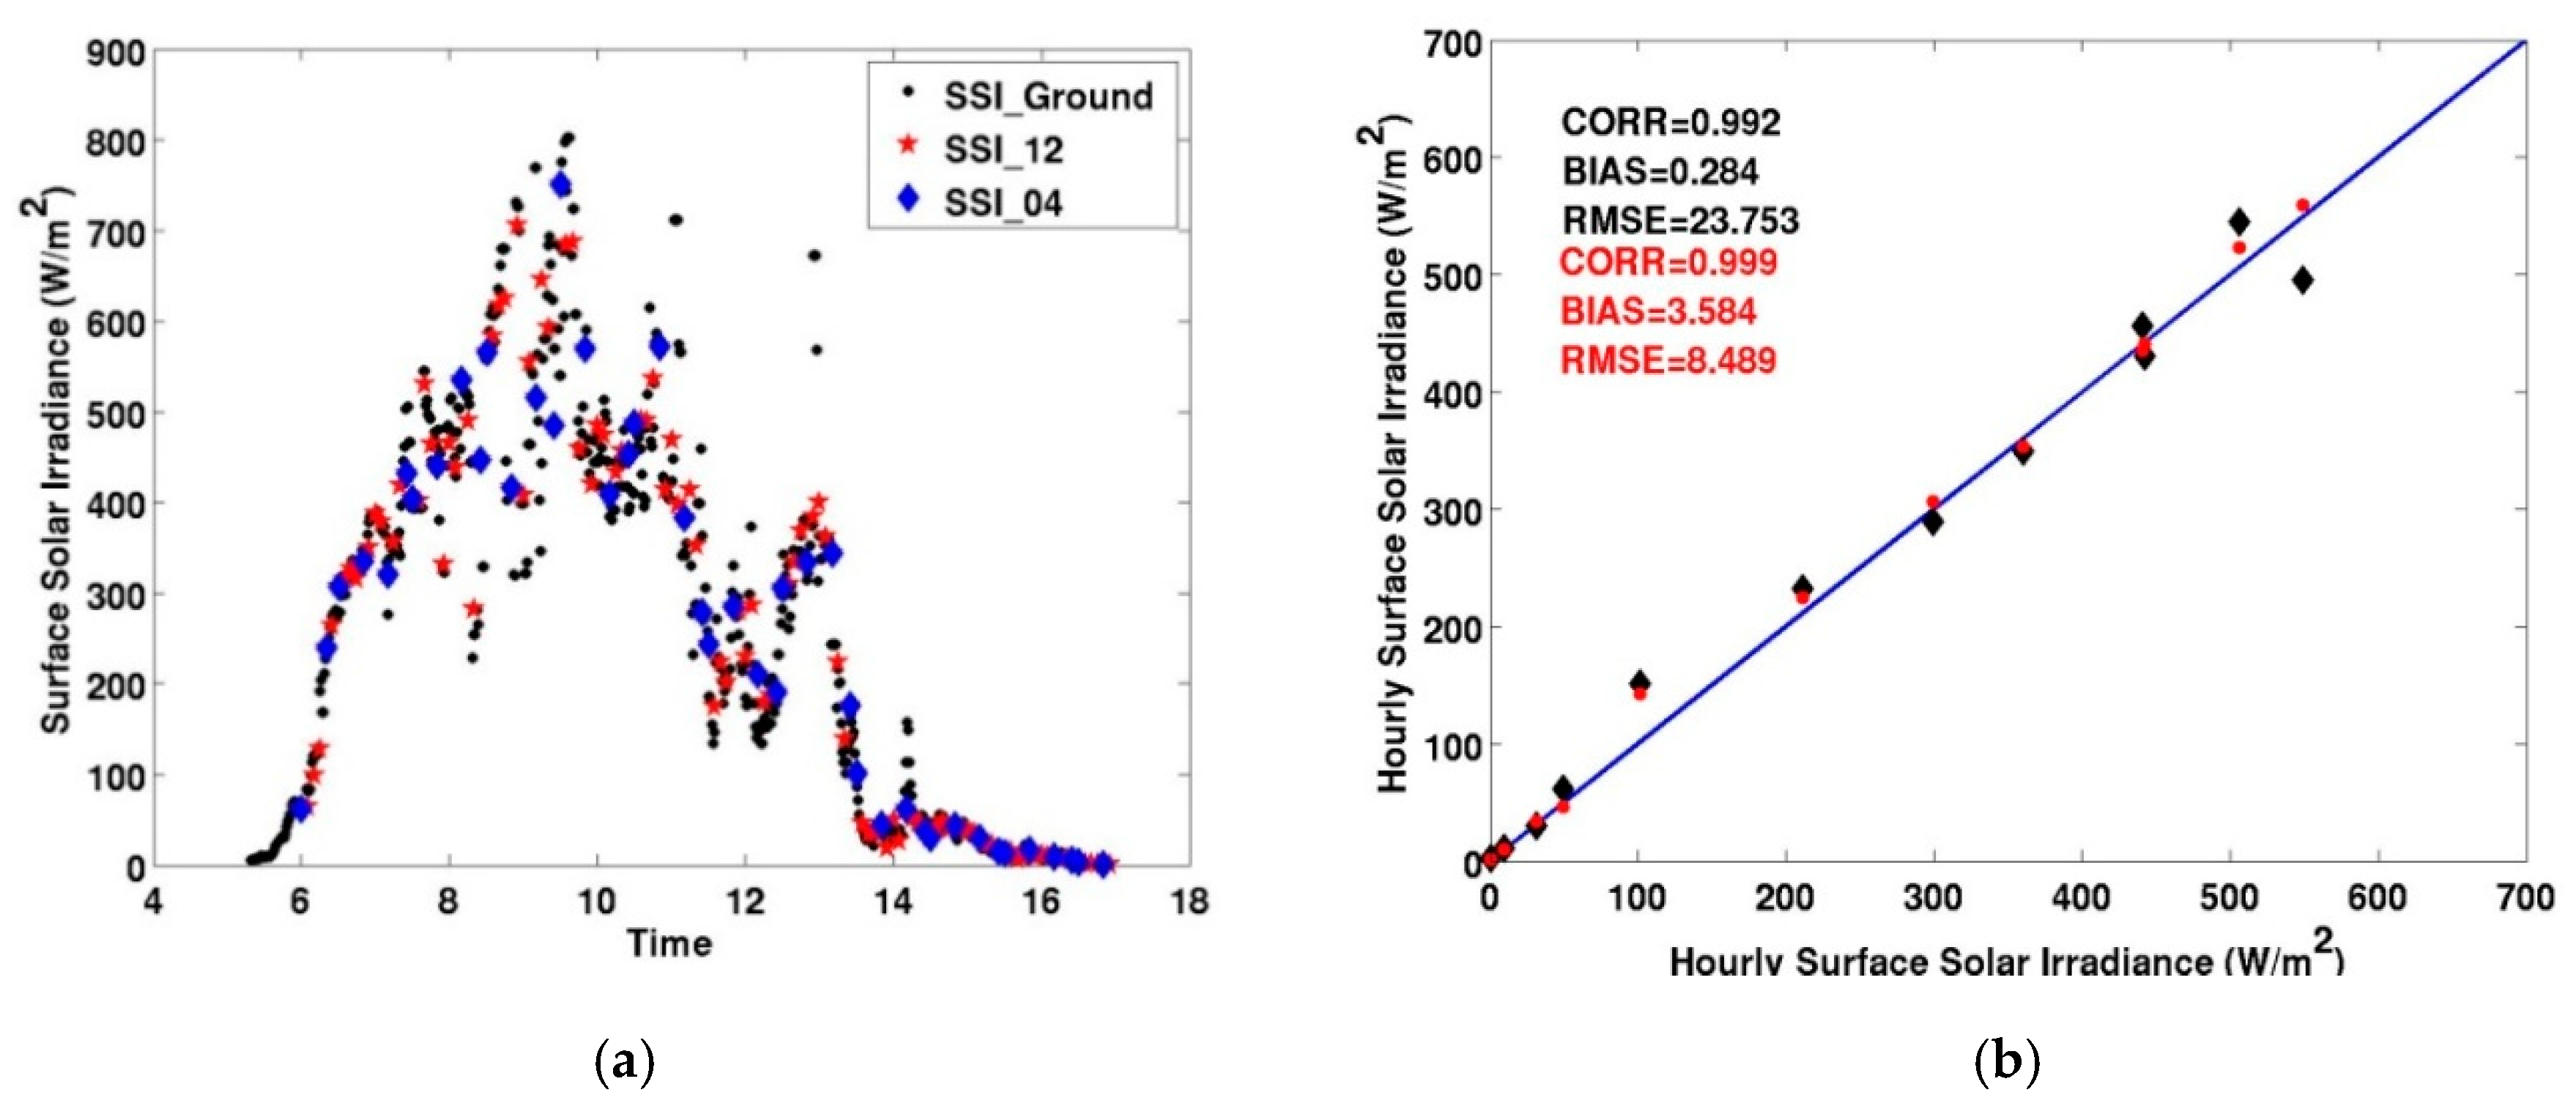
| 17 March 2018 | 0.992 | 0.284 | 23.753 | 17.834 | 8.862 | 0.987 | 8.2 |
| 18 March 2018 | 0.994 | −10.176 | 25.006 | 19.093 | 7.760 | −3.702 | 9.0 |
| 19 March 2018 | 0.962 | −21.829 | 65.298 | 49.942 | 17.598 | −8.565 | 25.6 |
| 20 March 2018 | 0.993 | −11.307 | 26.279 | 21.496 | 10.622 | −4.446 | 10.3 |
| 21 March 2018 | 0.973 | −13.011 | 24.678 | 20.722 | 11.625 | −7.595 | 14.4 |
| 22 March 2018 | 0.996 | 0.502 | 2.411 | 1.875 | 5.312 | 1.244 | 5.9 |
| 23 March 2018 | 0.998 | 6.118 | 7.548 | 6.211 | 6.175 | 6.021 | 7.4 |
| 24 March 2018 | 0.993 | 5.510 | 24.147 | 19.321 | 5.794 | 1.686 | 7.3 |
| 25 March 2018 | 0.987 | −8.507 | 19.126 | 14.570 | 7.170 | −4.633 | 10.4 |
| Date (dd/mm/yyyy) | Five-Minute Temporal Sampling | ||||||
|---|---|---|---|---|---|---|---|
| CORR | MBE (W/m2) | RMSE (W/m2) | MAE (W/m2) | MAPE (%) | nMBE (%) | nRMSE (%) | |
| 11 March 2018 | 0.999 | 2.598 | 13.160 | 7.502 | 2.512 | 0.640 | 3.2 |
| 12 March 2018 | 0.998 | 3.823 | 16.810 | 13.365 | 11.843 | 1.508 | 6.6 |
| 13 March 2018 | 0.999 | 1.616 | 9.191 | 6.859 | 2.813 | 0.411 | 2.3 |
| 14 March 2018 | 0.996 | 4.749 | 17.873 | 14.459 | 4.411 | 1.345 | 5.0 |
| 15 March 2018 | 0.999 | 0.936 | 8.045 | 7.009 | 2.502 | 0.258 | 2.2 |
| 16 March 2018 | 0.999 | 0.056 | 6.416 | 4.619 | 1.594 | 0.158 | 1.8 |
| 17 March 2018 | 0.999 | 3.584 | 8.489 | 6.701 | 3.634 | 1.246 | 2.9 |
| 18 March 2018 | 0.999 | 1.950 | 5.071 | 3.983 | 3.351 | 0.709 | 1.8 |
| 19 March 2018 | 0.993 | −21.596 | 32.291 | 22.008 | 7.190 | −8.473 | 12.6 |
| 20 March 2018 | 0.999 | −2.782 | 10.896 | 7.677 | 3.632 | −1.094 | 4.2 |
| 21 March 2018 | 0.988 | −0.552 | 13.881 | 9.908 | 6.850 | −0.322 | 8.1 |
| 22 March 2018 | 0.999 | 0.544 | 1.423 | 1.130 | 3.078 | 1.348 | 3.5 |
| 23 March 2018 | 0.998 | 2.260 | 4.727 | 3.896 | 4.667 | 2.224 | 4.6 |
| 24 March 2018 | 0.999 | 6.069 | 9.667 | 7.227 | 2.171 | 1.857 | 2.9 |
| 25 March 2018 | 0.997 | −3.599 | 8.714 | 5.512 | 2.660 | −1.960 | 4.7 |
| Date (dd/mm/yyyy) | 15-Minute Temporal Sampling | ||||||
|---|---|---|---|---|---|---|---|
| CORR | MBE (W/m2) | RMSE (W/m2) | MAE (W/m2) | MAPE (%) | nMBE (%) | nRMSE (%) | |
| 11 March 2018 | 0.960 | 2.404 | 5.596 | 2.910 | 14.595 | 7.015 | 16.3 |
| 12 March 2018 | 0.965 | −18.481 | 43.777 | 26.023 | 9.695 | −8.033 | 19.0 |
| 13 March 2018 | 0.997 | 12.219 | 20.962 | 16.032 | 5.982 | 3.433 | 5.9 |
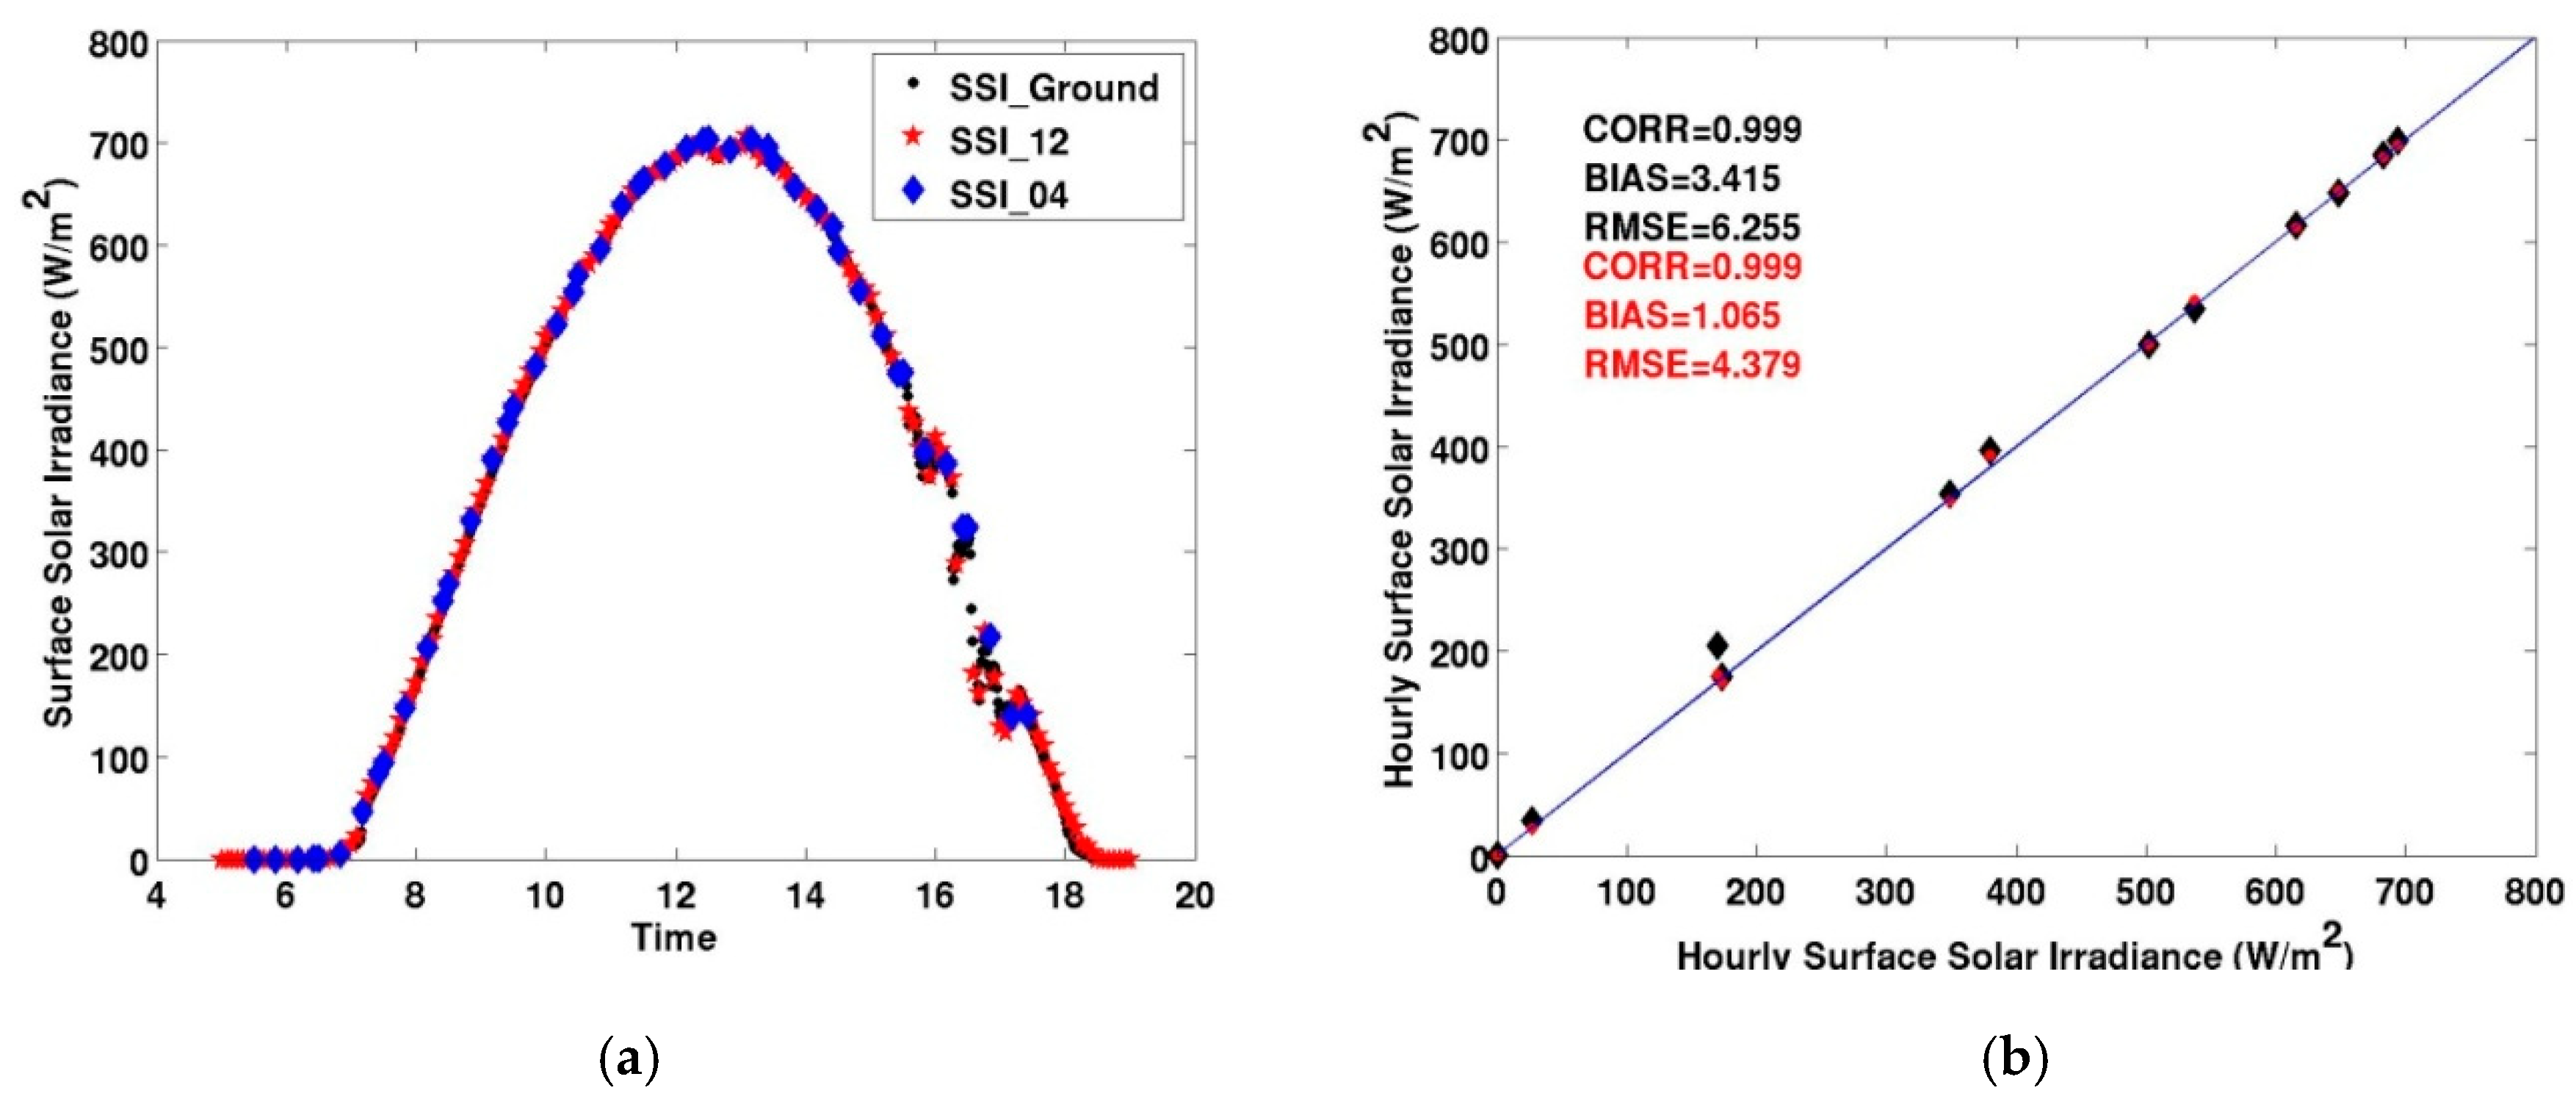
| 14 March 2018 | 0.999 | 3.415 | 6.255 | 4.426 | 3.550 | 0.763 | 1.4 |
| 15 March 2018 | 0.976 | −0.751 | 5,079 | 3.468 | 8.922 | −1.809 | 12.0 |
| 16 March 2018 | 0.999 | 2.922 | 7.387 | 4.683 | 1.649 | 0.650 | 1.6 |
| 17 March 2018 | 0.989 | 4.967 | 9.435 | 6.386 | 18.140 | 8.441 | 16.0 |
| 18 March 2018 | 0.995 | 4.328 | 7.715 | 5.486 | 7.874 | 6.289 | 11.2 |
| 19 March 2018 | 0.991 | 1.095 | 3.261 | 2.603 | 4.890 | 2.257 | 6.7 |
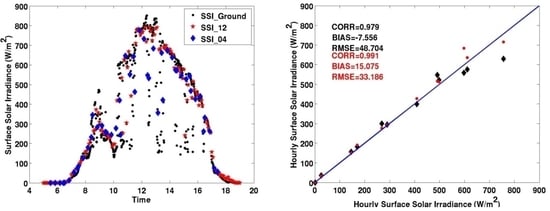
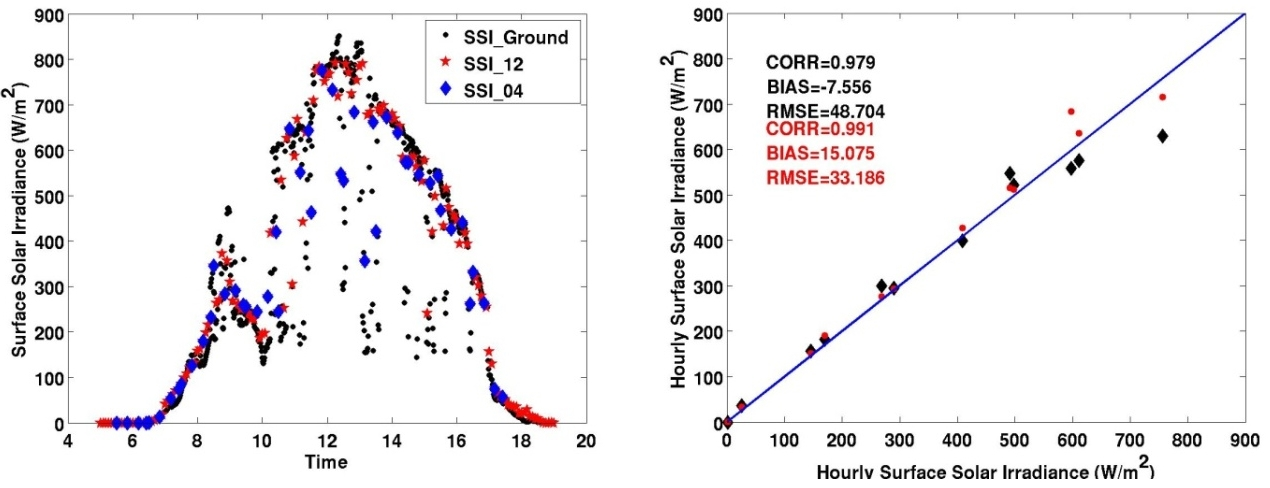
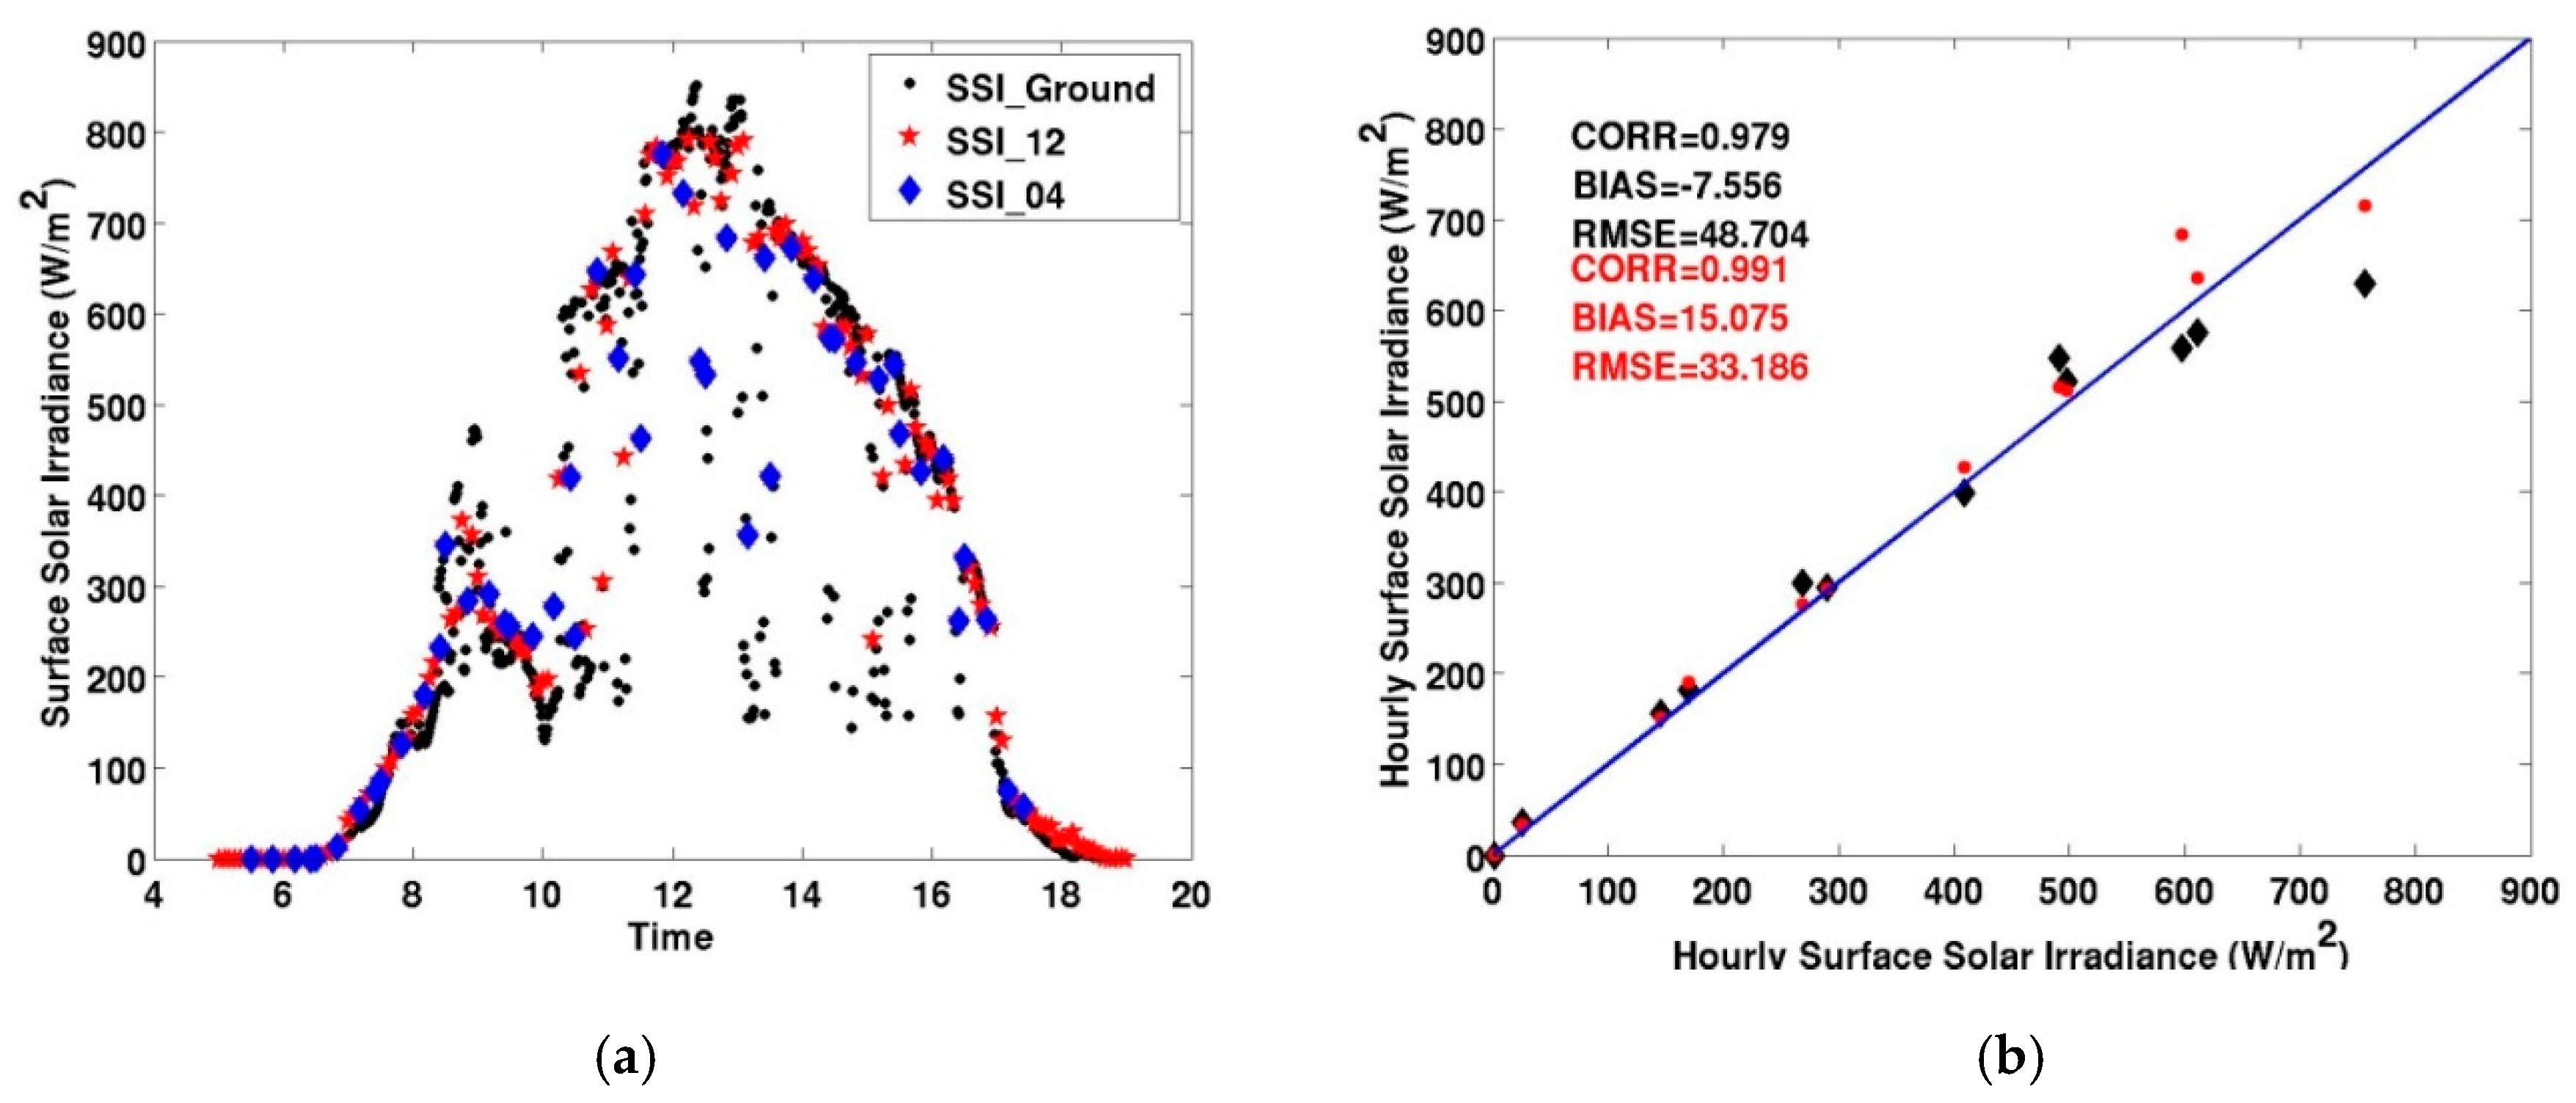
| 20 March 2018 | 0.979 | −7.556 | 48.704 | 34.514 | 10.580 | −1.941 | 12.5 |
| 21 March 2018 | 0.995 | 22.518 | 35.452 | 25.894 | 5.249 | 5.229 | 8.2 |
| 22 March 2018 | 0.995 | 18.637 | 29.296 | 20.479 | 4.692 | 4.448 | 6.9 |
| 23 March 2018 | 0.999 | 1.269 | 3.519 | 3.114 | 1.044 | 0.270 | 0.8 |
| 24 March 2018 | 0.993 | −6.310 | 26.834 | 17.879 | 8.972 | −2.350 | 9.9 |
| 25 March 2018 | 0.992 | 16.987 | 37.139 | 20.930 | 4.516 | 4.083 | 8.9 |
| Day (dd/mm/yyyy) | Five-Minute Temporal Sampling | ||||||
|---|---|---|---|---|---|---|---|
| CORR | MBE (W/m2) | RMSE (W/m2) | MAE (W/m2) | MAPE (%) | nMBE (%) | nRMSE (%) | |
| 11 March 2018 | 0.972 | 1.772 | 4.651 | 2.314 | 14.245 | 5.171 | 13.6 |
| 12 March 2018 | 0.993 | −6.851 | 19.684 | 10.711 | 3.649 | −2.978 | 8.5 |
| 13 March2018 | 0.999 | 3.942 | 9.261 | 6.066 | 3.254 | 1.108 | 2.6 |
| 14 March 2018 | 0.999 | 1.065 | 4.379 | 3.026 | 0.907 | 0.238 | 0.9 |
| 15 March 2018 | 0.996 | 0.776 | 2.122 | 1.866 | 5.998 | 1.869 | 5.1 |
| 16 March 2018 | 0.999 | 2.694 | 7.625 | 5.111 | 2.861 | 0.599 | 1.6 |
| 17 March 2018 | 0.989 | 3.169 | 8.419 | 6.492 | 19.550 | 5.386 | 14.3 |
| 18 March 2018 | 0.997 | 2.619 | 5.217 | 3.770 | 4.932 | 3.805 | 7.5 |
| 19 March 2018 | 0.998 | 0.683 | 1.657 | 1.350 | 3.187 | 1.408 | 3.4 |
| 20 March /2018 | 0.991 | 15.075 | 33.186 | 23.250 | 7.267 | 3.873 | 8.5 |
| 21 March 2018 | 0.997 | 19.061 | 27.882 | 20.131 | 4.118 | 4.426 | 6.4 |
| 22 March 2018 | 0.998 | 11.550 | 17.735 | 12.589 | 3.313 | 2.757 | 4.2 |
| 23 March 2018 | 0.999 | 0.349 | 4.473 | 3.860 | 1.132 | 0.742 | 0.9 |
| 24 March 2018 | 0.996 | 5.742 | 18.398 | 13.628 | 5.777 | 2.138 | 6.8 |
| 25 March 2018 | 0.997 | 7.122 | 20.447 | 10.083 | 2.490 | 1.711 | 4.9 |
| N | 15-Minute Temporal Sampling | ||||||
|---|---|---|---|---|---|---|---|
| CORR | MBE (W/m2) | RMSE (W/m2) | MAE (W/m2) | MAPE (%) | nMBE (%) | nRMSE (%) | |
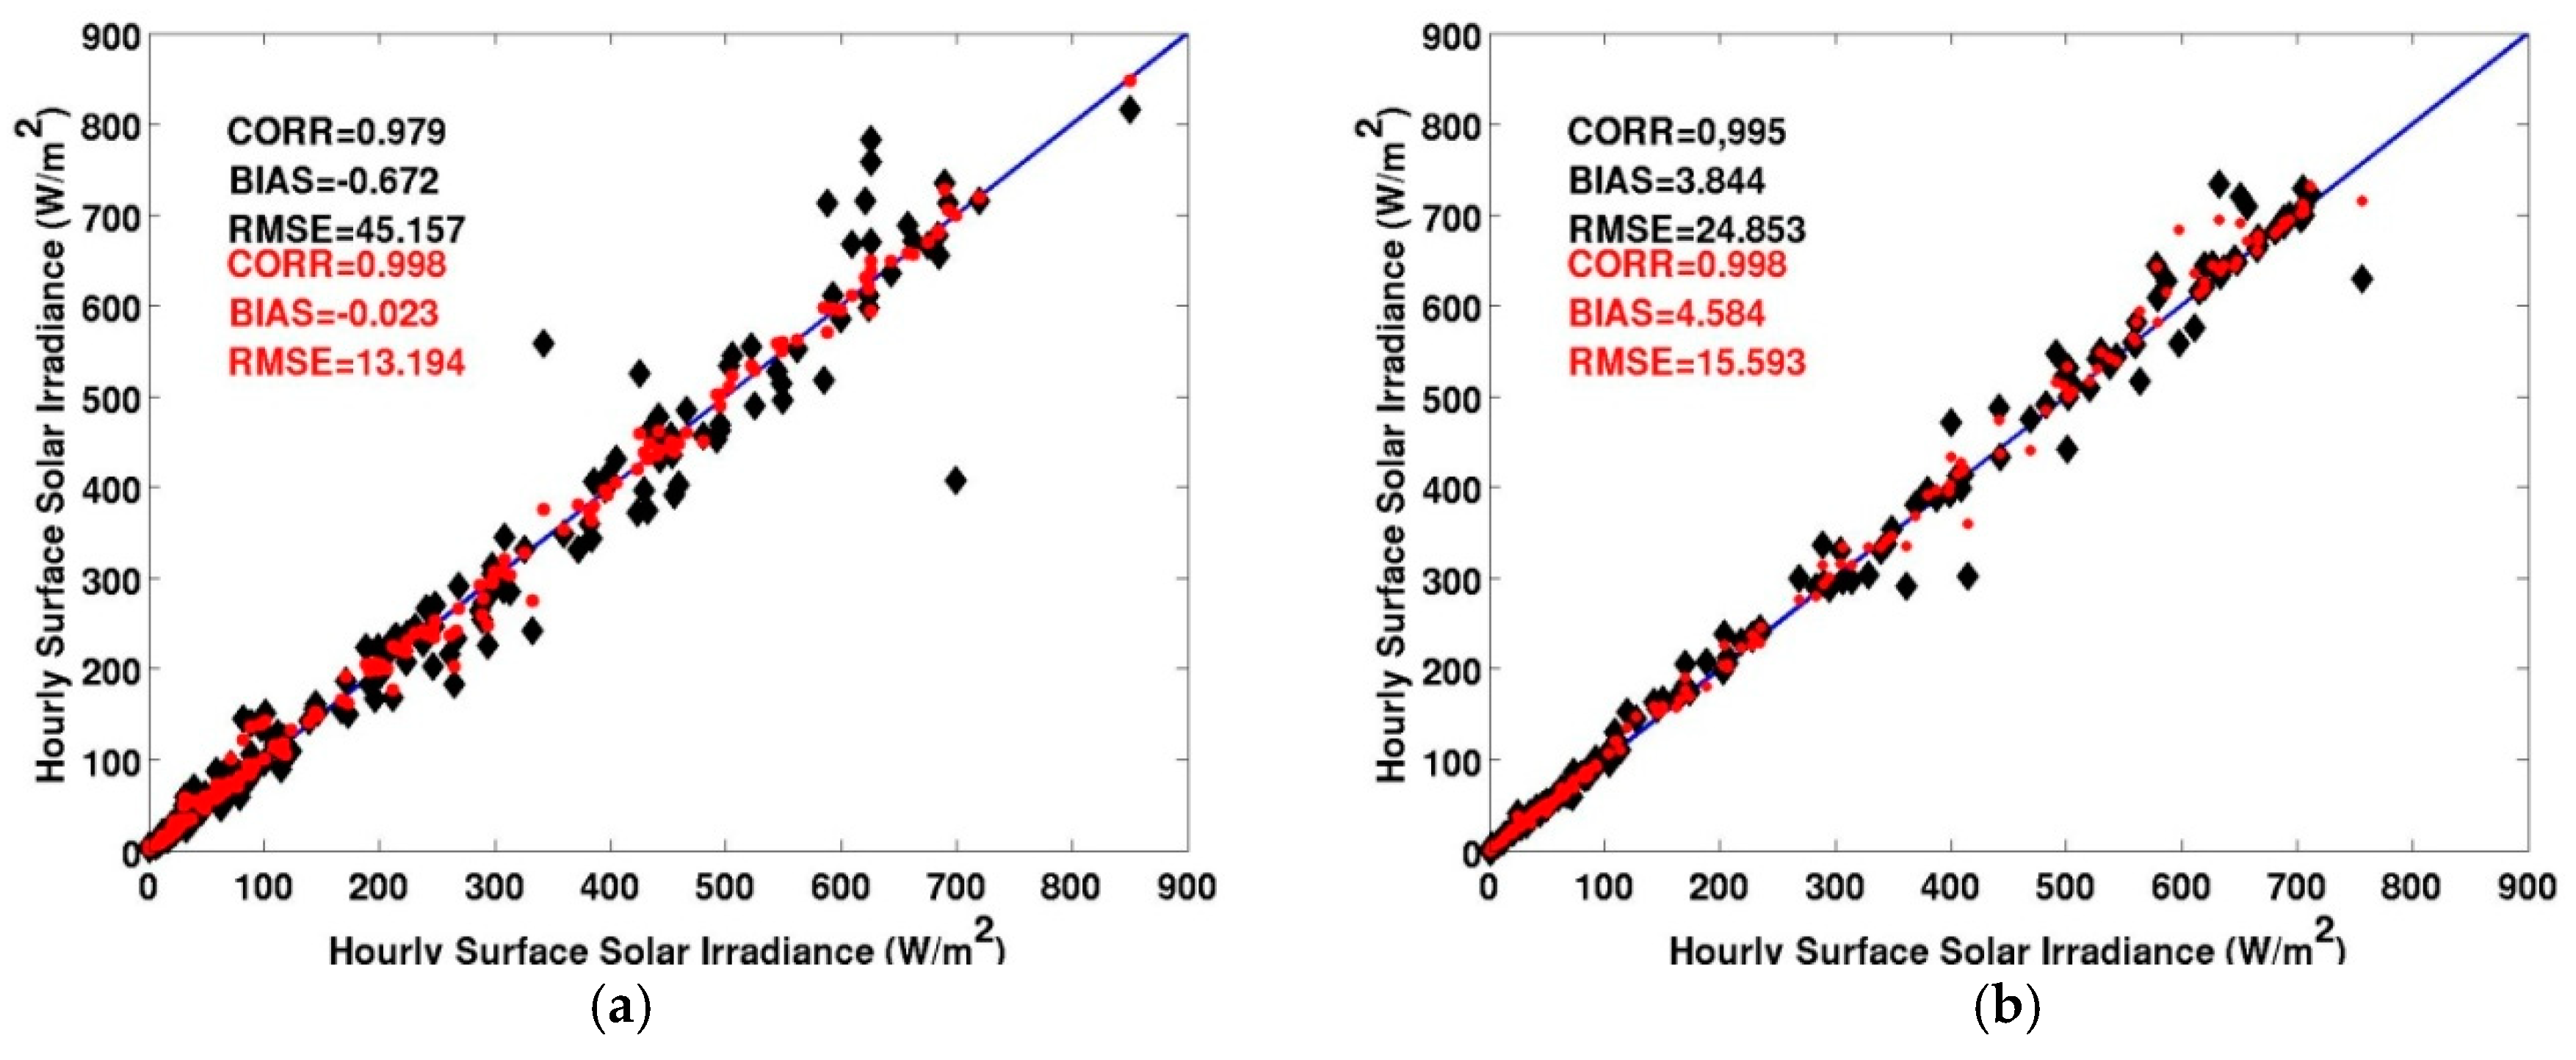
| 150 | 0.979 | −0.672 | 45.157 | 25.644 | 10.068 | −0.273 | 18.3 |
| N | Five-Minute Temporal Sampling | ||||||
|---|---|---|---|---|---|---|---|
| CORR | MBE (W/m2) | RMSE (W/m2) | MAE (W/m2) | MAPE (%) | nMBE (%) | nRMSE (%) | |
| 150 | 0.998 | −0.023 | 13.194 | 8.124 | 4.194 | −0.009 | 5.3 |
| N | 15-Minute Temporal Sampling | ||||||
|---|---|---|---|---|---|---|---|
| CORR | MBE (W/m2) | RMSE (W/m2) | MAE (W/m2) | MAPE (%) | nMBE (%) | nRMSE (%) | |
| 150 | 0.995 | 3.844 | 24.853 | 12.988 | 7.357 | 1.516 | 9.8 |
| N | Five-Minute Temporal Sampling | ||||||
|---|---|---|---|---|---|---|---|
| CORR | MBE (W/m2) | RMSE (W/m2) | MAE (W/m2) | MAPE (%) | nMBE (%) | nRMSE (%) | |
| 150 | 0.998 | 4.584 | 15.593 | 8.283 | 5.512 | 1.809 | 6.1 |
© 2019 by the authors. Licensee MDPI, Basel, Switzerland. This article is an open access article distributed under the terms and conditions of the Creative Commons Attribution (CC BY) license (http://creativecommons.org/licenses/by/4.0/).
Share and Cite
Gallucci, D.; Romano, F.; Cimini, D.; Di Paola, F.; Gentile, S.; Larosa, S.; Nilo, S.T.; Ricciardelli, E.; Ripepi, E.; Viggiano, M.; et al. Improvement of Hourly Surface Solar Irradiance Estimation Using MSG Rapid Scanning Service. Remote Sens. 2019, 11, 66. https://doi.org/10.3390/rs11010066
Gallucci D, Romano F, Cimini D, Di Paola F, Gentile S, Larosa S, Nilo ST, Ricciardelli E, Ripepi E, Viggiano M, et al. Improvement of Hourly Surface Solar Irradiance Estimation Using MSG Rapid Scanning Service. Remote Sensing. 2019; 11(1):66. https://doi.org/10.3390/rs11010066
Chicago/Turabian StyleGallucci, Donatello, Filomena Romano, Domenico Cimini, Francesco Di Paola, Sabrina Gentile, Salvatore Larosa, Saverio T. Nilo, Elisabetta Ricciardelli, Ermann Ripepi, Mariassunta Viggiano, and et al. 2019. "Improvement of Hourly Surface Solar Irradiance Estimation Using MSG Rapid Scanning Service" Remote Sensing 11, no. 1: 66. https://doi.org/10.3390/rs11010066