Article

Development of Raman Lidar for Remote Sensing of CO2 Leakage at an Artificial Carbon Capture and Storage Site

1
Division of Earth Environmental System Science Major of Spatial Information Engineering, Pukyong National University, Busan 48513, Korea
2
Department of Urban Environmental Engineering, Kyungnam University, Gyeongsangnam-do 631-701, Korea
3
GeoGreen21 Co., Ltd., Seoul 08376, Korea
4
Department of Earth and Environmental Sciences, Korea University, Seoul 02841, Korea
5
SOLETOP Co., Ltd., 409 Expo-ro, Yuseong-gu, Daejeon 34051, Korea
*
Author to whom correspondence should be addressed.
Remote Sens. 2018, 10(9), 1439; https://doi.org/10.3390/rs10091439
Submission received: 17 July 2018 / Revised: 3 September 2018 / Accepted: 6 September 2018 / Published: 9 September 2018
(This article belongs to the Section Atmospheric Remote Sensing)

Abstract

:
We developed a Raman lidar system that can remotely detect CO2 leakage and its volume mixing ratio (VMR). The system consists of a laser, a telescope, an optical receiver, and detectors. Indoor CO2 cell measurements show that the accuracy of the Raman lidar is 99.89%. Field measurements were carried out over a four-day period in November 2017 at the Eumsong Environmental Impact Evaluation Test Facility (EIT), Korea, where a CO2 leak was located 0.2 km from the Raman lidar. The results show good agreement between CO2 VMR measured by the Raman lidar system (CO2 VMRRaman LIDAR) and that measured by in situ instruments (CO2 VMRIn-situ). The correlation coefficient (R), mean absolute error (MAE), root mean square error (RMSE), and percentage difference between CO2 VMRIn-situ and CO2 VMRRaman LIDAR are 0.81, 0.27%, 0.37%, and 4.92%, respectively. The results indicate that Raman lidar is an effective tool in detecting CO2 leakage and in measuring CO2 VMR remotely.

1. Introduction

The average temperature of Earth has increased by 0.8 °C since the beginning of the twentieth century, garnering worldwide interest [1]. This global warming is reported to be caused by an increase in the concentrations of greenhouse gases (e.g., CO2, CH4, N2O, O3, and CFCs) produced by human activities such as fossil fuel combustion, industrial processes, and deforestation [2,3].
As concern about increasing greenhouse gas concentrations has increased, many countries have begun to regulate carbon emissions [4] according to the Kyoto Protocol [5]. Carbon capture and storage (CCS) is considered a promising technology to reduce atmospheric CO2 [3,6]. However, leakage of CO2 from large-scale CCS can affect the CO2 reduction efficiency and have serious impacts on the surrounding ecosystem, such as reduced soil pH, damage to plant and microbial communities, and groundwater contamination [7]. Previous studies [8,9] have monitored CO2 leaking from CCS sites. Hui et al. [8] assessed CO2 leakage from a storage facility in Xuzhou city, Jiangsu province, China, using multiple in situ instruments and wireless sensor networks. Elio et al. [9] reported a technique for measuring CO2 soil flux at an artificial CO2 injection site in Hontomin, Spain. While these in situ instruments have a high CO2 measurement accuracy, many instruments are required to monitor large CCS sites. It may be difficult to detect a small, continuous CO2 leak if in situ instruments are sparsely distributed at a large CCS site. In contrast, remote sensing techniques can be used to monitor CO2 leakages over a large CCS site using a single instrument. However, in compiling a map of CO2 distribution via two-dimensional horizontal scanning, some spots might be missed by Raman lidar because of the nature of the terrain or the presence of obstacles.
The detection limit (LDL), accuracy, and cost of the in situ instrument used by Jung et al. [10] were 0 ppm, 1.5% of reading, and about $35,000, respectively, while those of the instrument used by Jun et al. [11] were 0 ppm, 1% of reading, and about $5500, respectively. There is no commercially available Raman lidar designed to measure CO2. Only one previous study [12] has reported tropospheric CO2 measurement using Raman lidar, although the authors provided no information on the LDL, precision, or cost of the lidar. Atmospheric CO2 measurements have been reported down to 40 ppmv for 20,000 shots at altitudes up to 1.5 km. Since a lidar system with a 50 mJ laser and repetition rate of 20 Hz costs about $40,000 [12], the cost of the lidar is thought to be higher than this figure.
In the present study, we developed a Raman lidar technique capable of detecting and remotely sensing the mixing ratio information of CO2 leakage from the surface. The remainder of this paper is organized as follows. The Raman lidar hardware system and the algorithms used to retrieve the CO2 volume mixing ratio (CO2 VMR) are described in Section 2, and the indoor and outdoor CO2 measurement performance of the system is reported in Section 2 and Section 3. Finally, the discussion, and conclusions are given in Section 4 and Section 5, respectively.

2. Materials and Methods

We used the elastic scattering and the Raman lidar equation to retrieve CO2 mixing ratios. The lidar equation applied to CO2 Raman lidar is as follows [13]:
P ( λ , z ) = E ( λ ) × exp ( 0 z α ( λ , z ) d z ) × β ( λ , z ) × exp ( 0 z α ( λ , z ) d z ) S a r e a z 2 × ξ ( z ) × η λ ,
where P ( λ , z ) is the returned backscatter signal from distance z at the laser wavelength λ , E ( λ ) is the initial laser energy, α is the total (=aerosol + molecular) extinction coefficient, β is the total (=aerosol + molecular) backscatter coefficient, S a r e a is the telescope receiver area, ξ describes the overlap function, and η λ is the receiver efficiency that reflects how many of the incoming photons are detected. Raman scattering refers to a process of inelastic scattering of light by molecules such as CO2 in which the wavelength of the incident light is changed [14]. The Nd:YAG laser of wavelength 355 nm used in this study is shifted to a wavelength of 371.6 nm caused by the vibrational Raman process of CO2 molecules. For reference, the Raman scattering wavelength of N2 molecules in dry air in the lower troposphere is 386.7 nm. By using Equation (1), the backscattered signal from a Raman CO2 channel at 371.6 nm, P C O 2 , can be expressed as
P C O 2 ( z ) = k C O 2 z 2 σ C O 2 ( π ) n C O 2 ( z ) q ( λ C O 2 ,   z 0 ,   z ) exp ( 0 z α ( λ , z ) d z ) ,
where k C O 2 is a proportionality constant for the system optical efficiency, the telescope receiver area, photomultiplier tube (PMT) efficiency, and the laser output energy. σ C O 2 is the backscattered cross-section for CO2 caused by Raman scattering, n C O 2 is the number density for CO2 as a function of distance z , and α ( λ ) is the volume extinction coefficient at wavelength λ .
P N 2 ( z ) = k N 2 z 2 σ N 2 ( π ) n N 2 ( z ) q ( λ N 2 ,   z 0 ,   z ) exp ( 0 z α ( λ , z ) d z ) ,
where k N 2 is a proportionality constant for the system optical efficiency, the telescope receiver area, photomultiplier tube (PMT) efficiency, and the laser output energy. σ N 2 is the backscattered cross-section for N2 caused by Raman scattering, n N 2 is the number density for N2 as a function of distance z , and α ( λ ) is the volume extinction coefficient at wavelength λ .
exp ( 0 z α ( λ , z ) d z ) = q ( λ 0 ,   z 0 ,   z ) ,
where q ( λ 0 ,   z 0 ,   z ) is the atmospheric transmittance from Raman lidar at distance z 0 to z at wavelength 355 nm. We used Raman signals of N2 as a reference to calculate the CO2 mixing ratio. The CO2 mixing ratio is the mass of CO2 divided by the mass of dry air in a given volume [12]. Since N2 is present at a constant rate in dry air, the N2 Raman signal, P N 2 , is used as a measure of dry air [13]. The CO2 mixing ratio can be derived from the normalization signal, which is the quotient of the CO2 Raman signal divided by the N2 Raman signal. The normalization signal can be expressed as
Normalization   signal = P C O 2 ( z ) P N 2 ( z ) .
The backscatter signals of CO2 and N2 were used to calculate the normalization signal. The Raman scattering signals of CO2 and N2 are obtained at different wavelengths (371.7 and 386.7 nm, respectively), and thus it has been assumed that there is no wavelength dependence with respect to extinction and consequently to atmospheric transmittance.
Figure 1 shows a flow chart of the process used to calculate the CO2 volume mixing ratio using the Raman lidar system. First, the normalized ratio is calculated using the CO2 and N2 inelastic signals caused by Raman scattering, as measured by the Raman lidar system.
In the right part of Figure 1, the regression coefficients are determined using the calculated normalized ratio and the CO2 VMR measured by the in situ instrument. The regression coefficients are then used in the calibration equation. The surface CO2 mixing ratios are calculated using a regression between the calculated normalized ratio and the CO2 VMR measured by an in situ instrument.

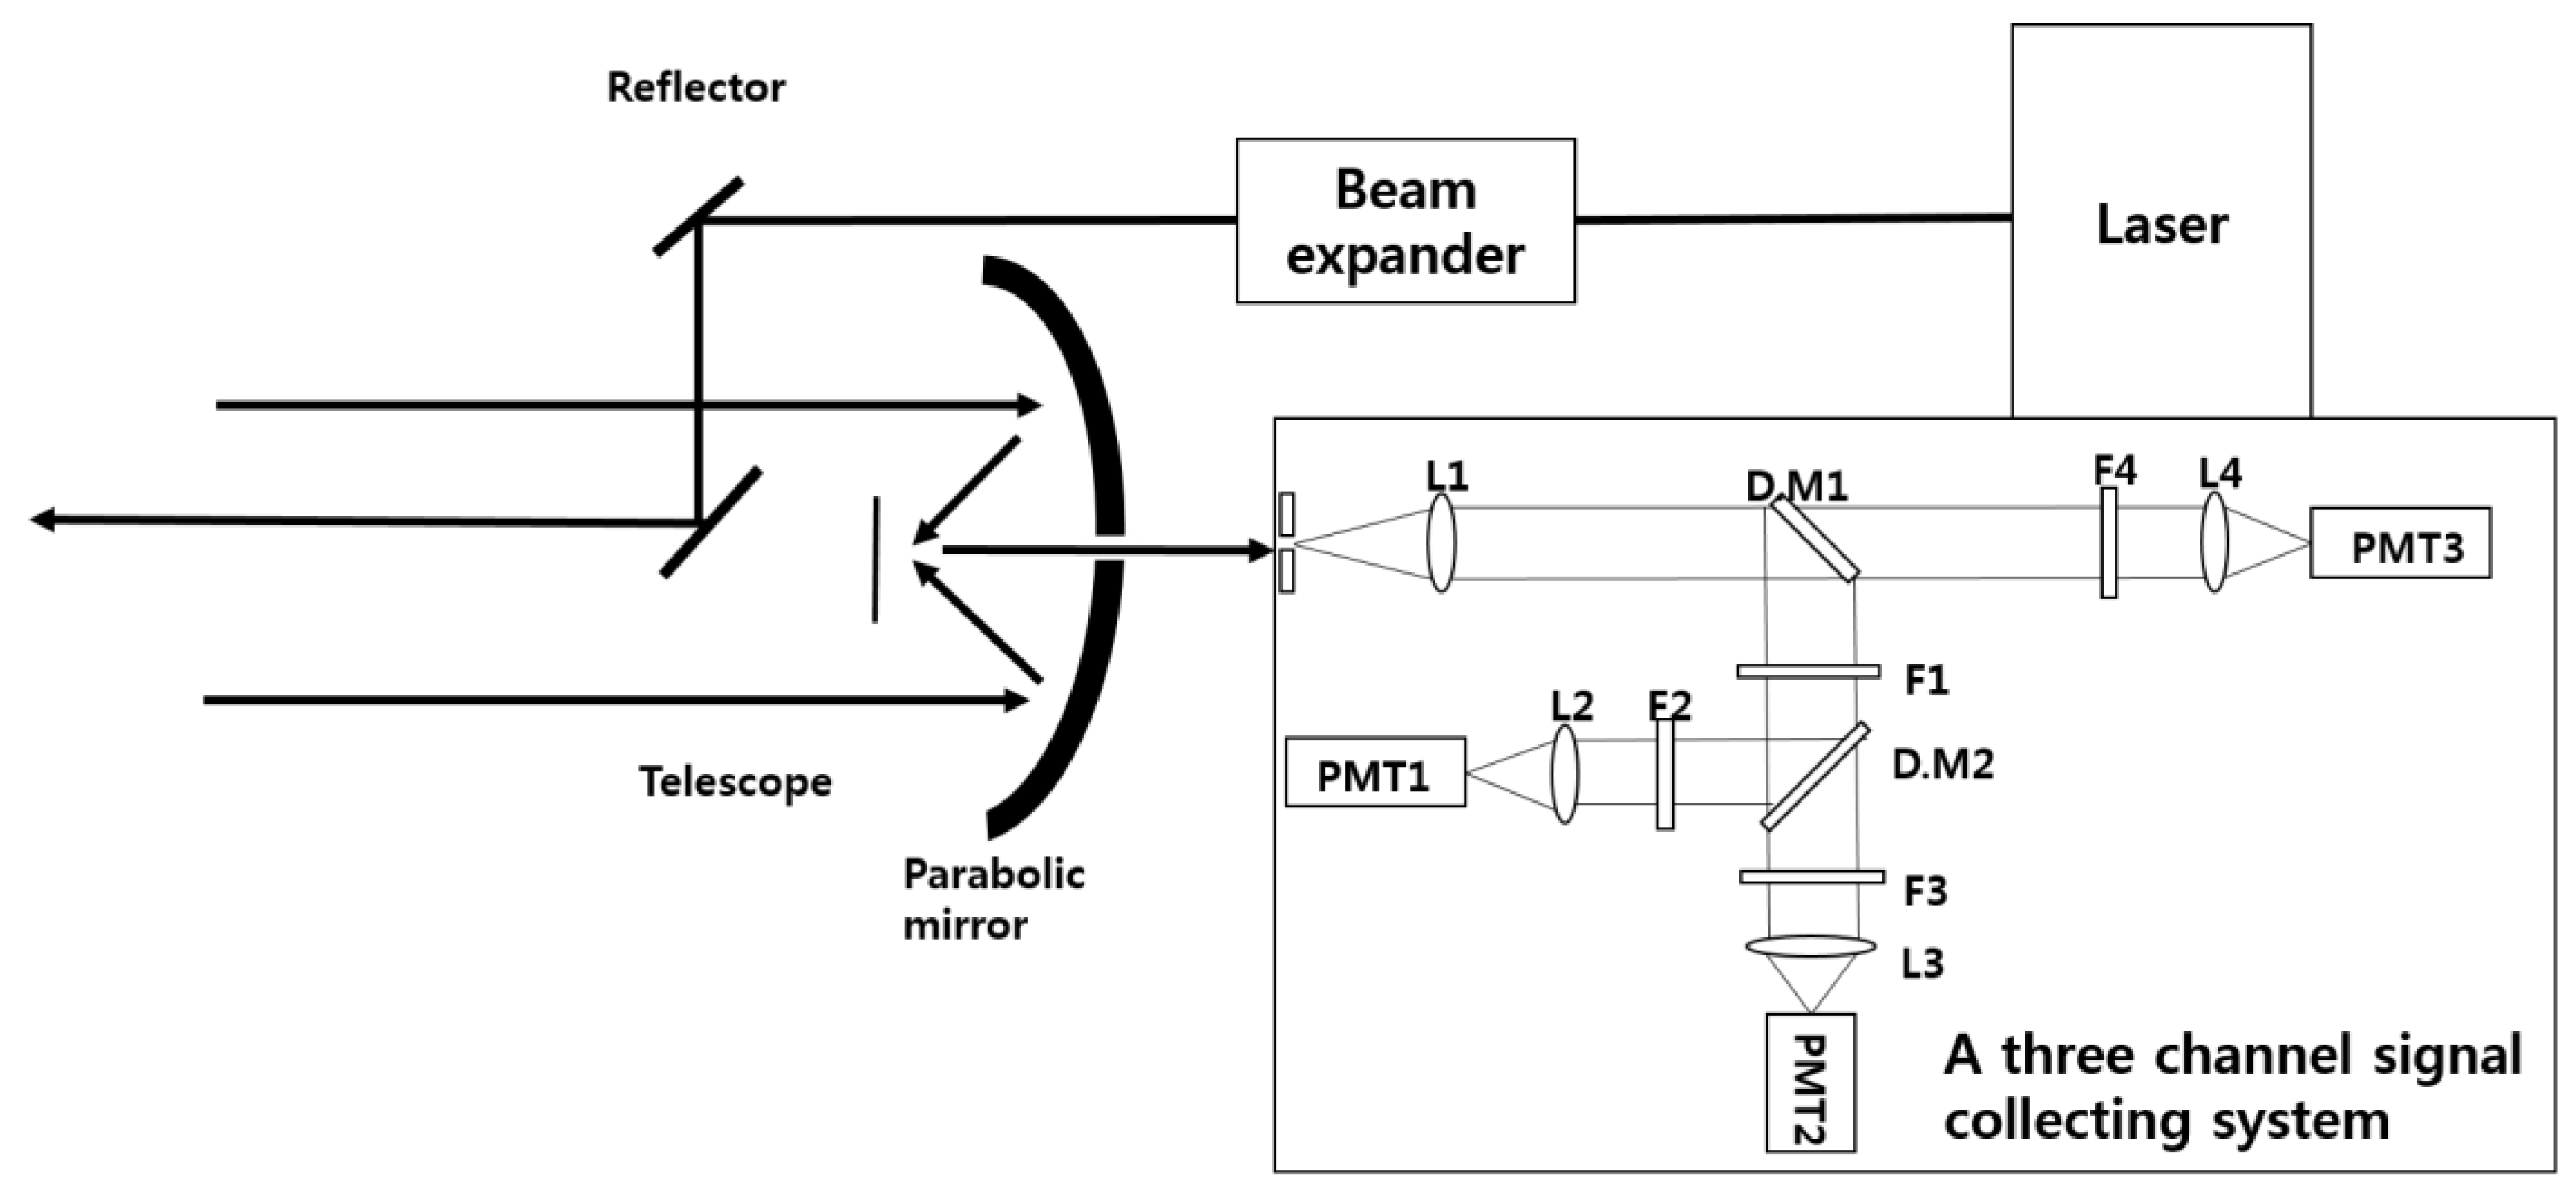
2.1. Raman Lidar Setup

The Raman lidar system consists of the third harmonic of a Nd:YAG laser of wavelength 355 nm with 80 mJ energy and 20 Hz repetition rate, a telescope, an optical receiver, and detectors. The pulsed laser is emitted horizontally to the ground from the Nd:YAG laser. Since the laser is emitted horizontally, the diameter of the laser beam was expanded, using a beam expander, by a factor of five times to ensure eye safety. The eye safety distance of our Raman lidar system is 208 m. The Raman lidar is applied co-axially with respect to the optical system to detect CO2 near the location of the lidar, with an overlap distance of 5–10 m. To observe CO2 mixing ratios, the Raman lidar system measures backscatter signals caused by CO2 Raman, N2 Raman, and Rayleigh–Mie scattering. These signals are detected and recorded as a function of distance and wavelength. To achieve real-time monitoring, a three-channel signal collection system was designed to collect the three types of backscatter signals simultaneously (Figure 2).
A Schmidt–Cassegrain telescope with a diameter of 15.24 cm is used as an optical receiver. First, the scattered light is collected by the telescope. After passing through a pinhole, it is narrowed by the collimating lens (L1). A dichroic beam splitter (D.M1) reflects the light at wavelengths above 355 nm. Since the Raman scattering signal is weaker than Rayleigh–Mie scattering [12], a notch filter (F1) is used which reflects light at 355 nm and transmits it at all other wavelengths, thus reflecting the elastic signals caused by Rayleigh–Mie (total) scattering and detecting the inelastic signal caused by Raman scattering. The CO2 filter (F2) transmits light with a wavelength of 371.7 nm to detect the Raman scattering signals of CO2 and reflects light at all other wavelengths. The CO2 filter (F3) transmits light at 386.7 nm and reflects all other wavelengths to detect the Raman scattering signals of N2 needed to calculate the CO2 VMR. The 355 nm filter (F4) transmits light at 355 nm to detect the elastic scattering signal used in aligning the lidar signal. The lenses L2, L3 and L4 are used to focus the CO2 Raman, N2 Raman, and elastic signals into the PMT. The signals detected by the three-channel collecting system are analyzed to determine the CO2 mixing ratio. Table 1 summarizes the main components of the CO2 Raman lidar system.

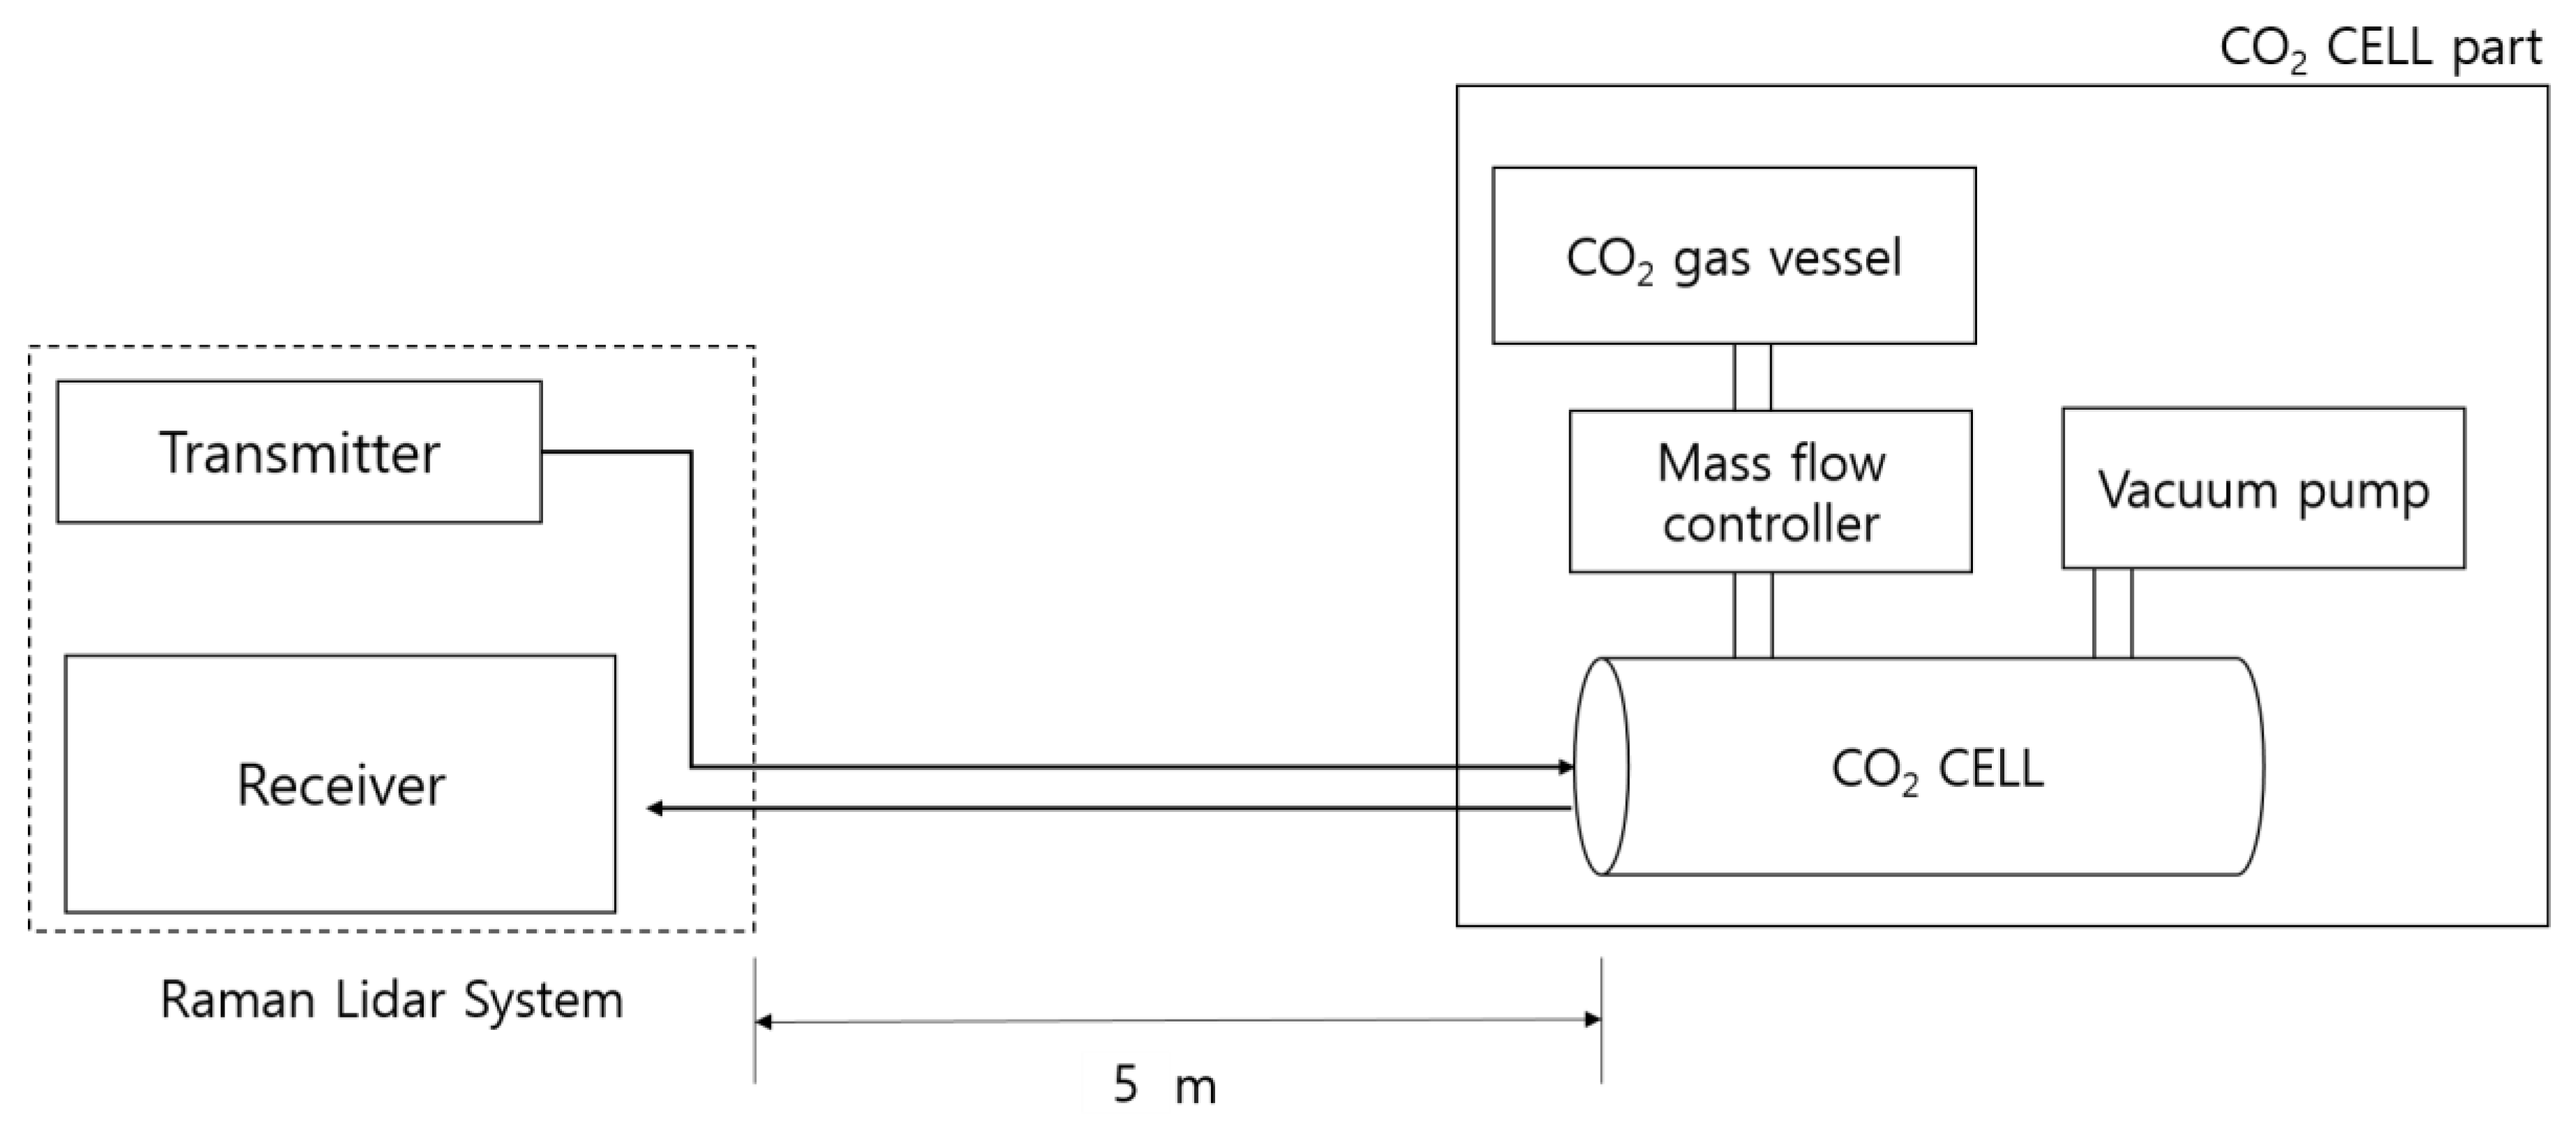
2.2. Indoor CO2 Cell Measurement

Indoor CO2 cell measurements were carried out to quantify the accuracy of the lower detection limit of the Raman Lidar system. Figure 3 shows a schematic diagram of the indoor CO2 cell setup using the Raman lidar. The cell measurement setup consists of a CO2 gas vessel, a mass flow controller (MFC), a CO2 gas cell, a vacuum pump, and the Raman lidar system. CO2 in the CO2 gas vessel is injected into the CO2 cell using the MFC, which controls the CO2 mixing ratio in the cell. A vacuum pump is connected to the cell to release CO2 gas from the cell into the air.
To measure the VMR of CO2 gas using Raman lidar, the inside of the CO2 cell is evacuated and CO2 gas is injected. The CO2 VMR of the cell is set to range from 10% to 100%, as the lowest measurement unit of the vacuum gauge used in this study is 1%. The inelastic signals of CO2 and N2 caused by Raman scattering are subsequently measured by the Raman lidar and are hereafter referred to as the normalized ratio.

3. Results

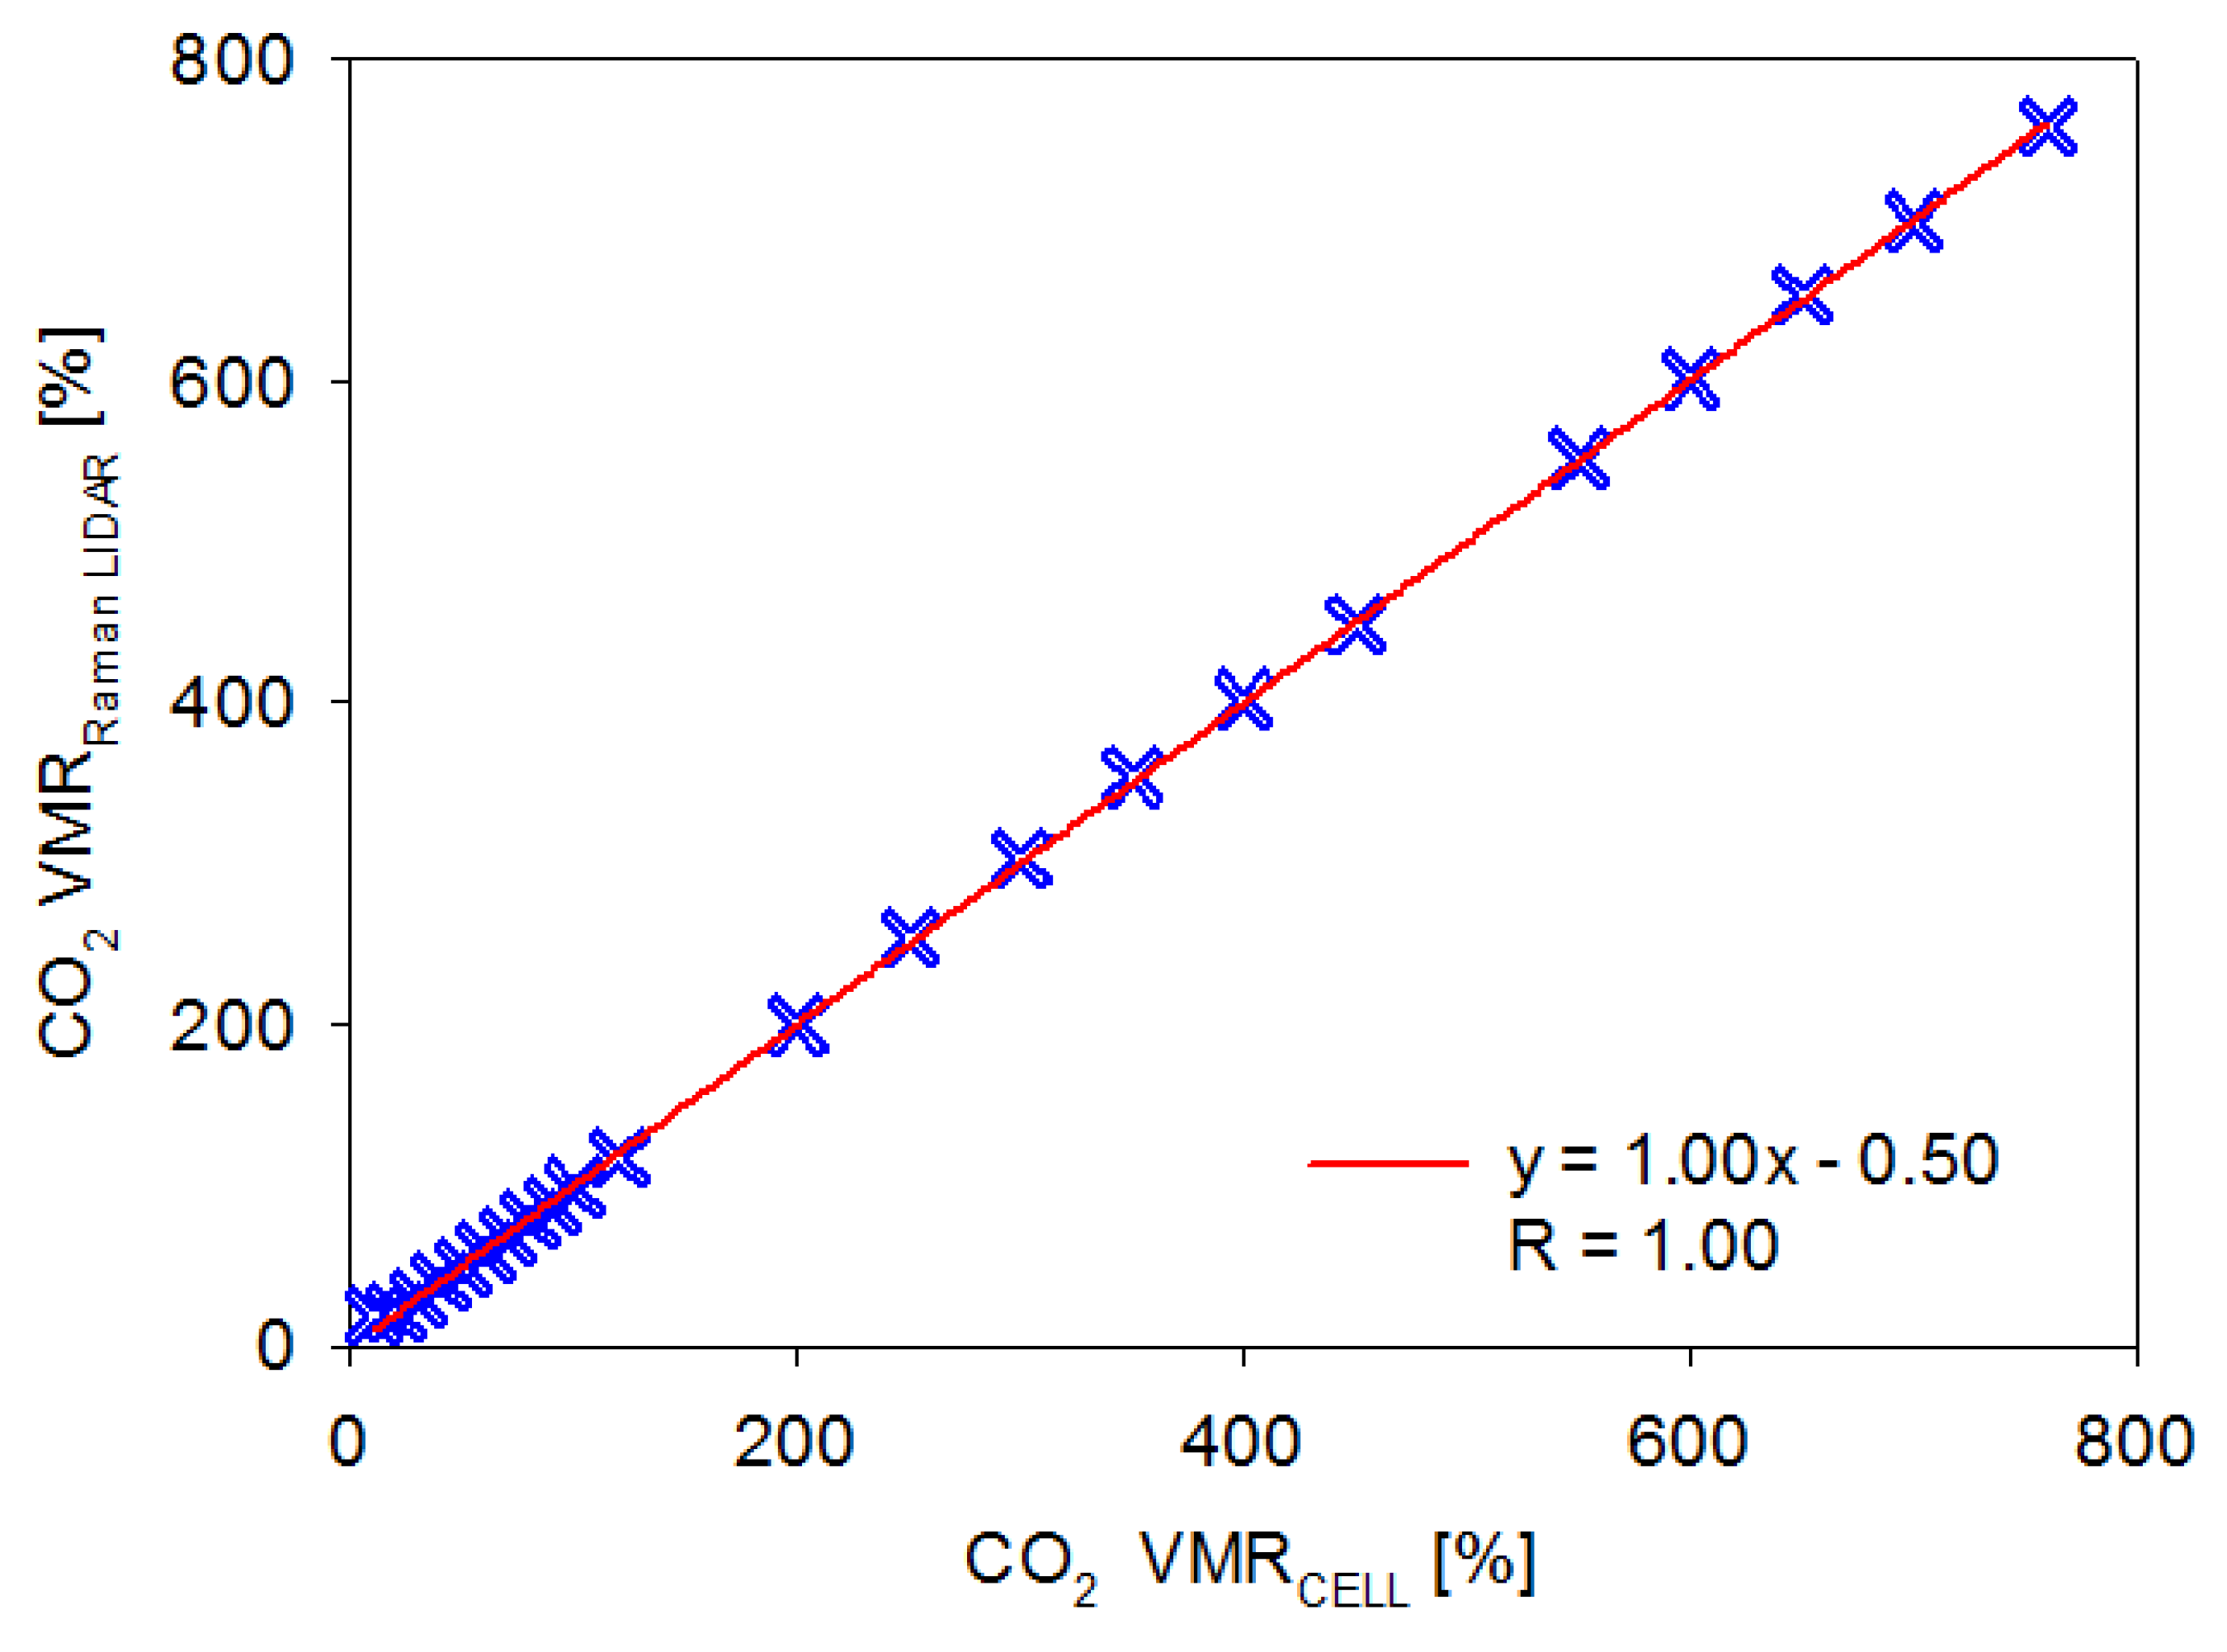
3.1. Indoor CO2 Cell Measurement
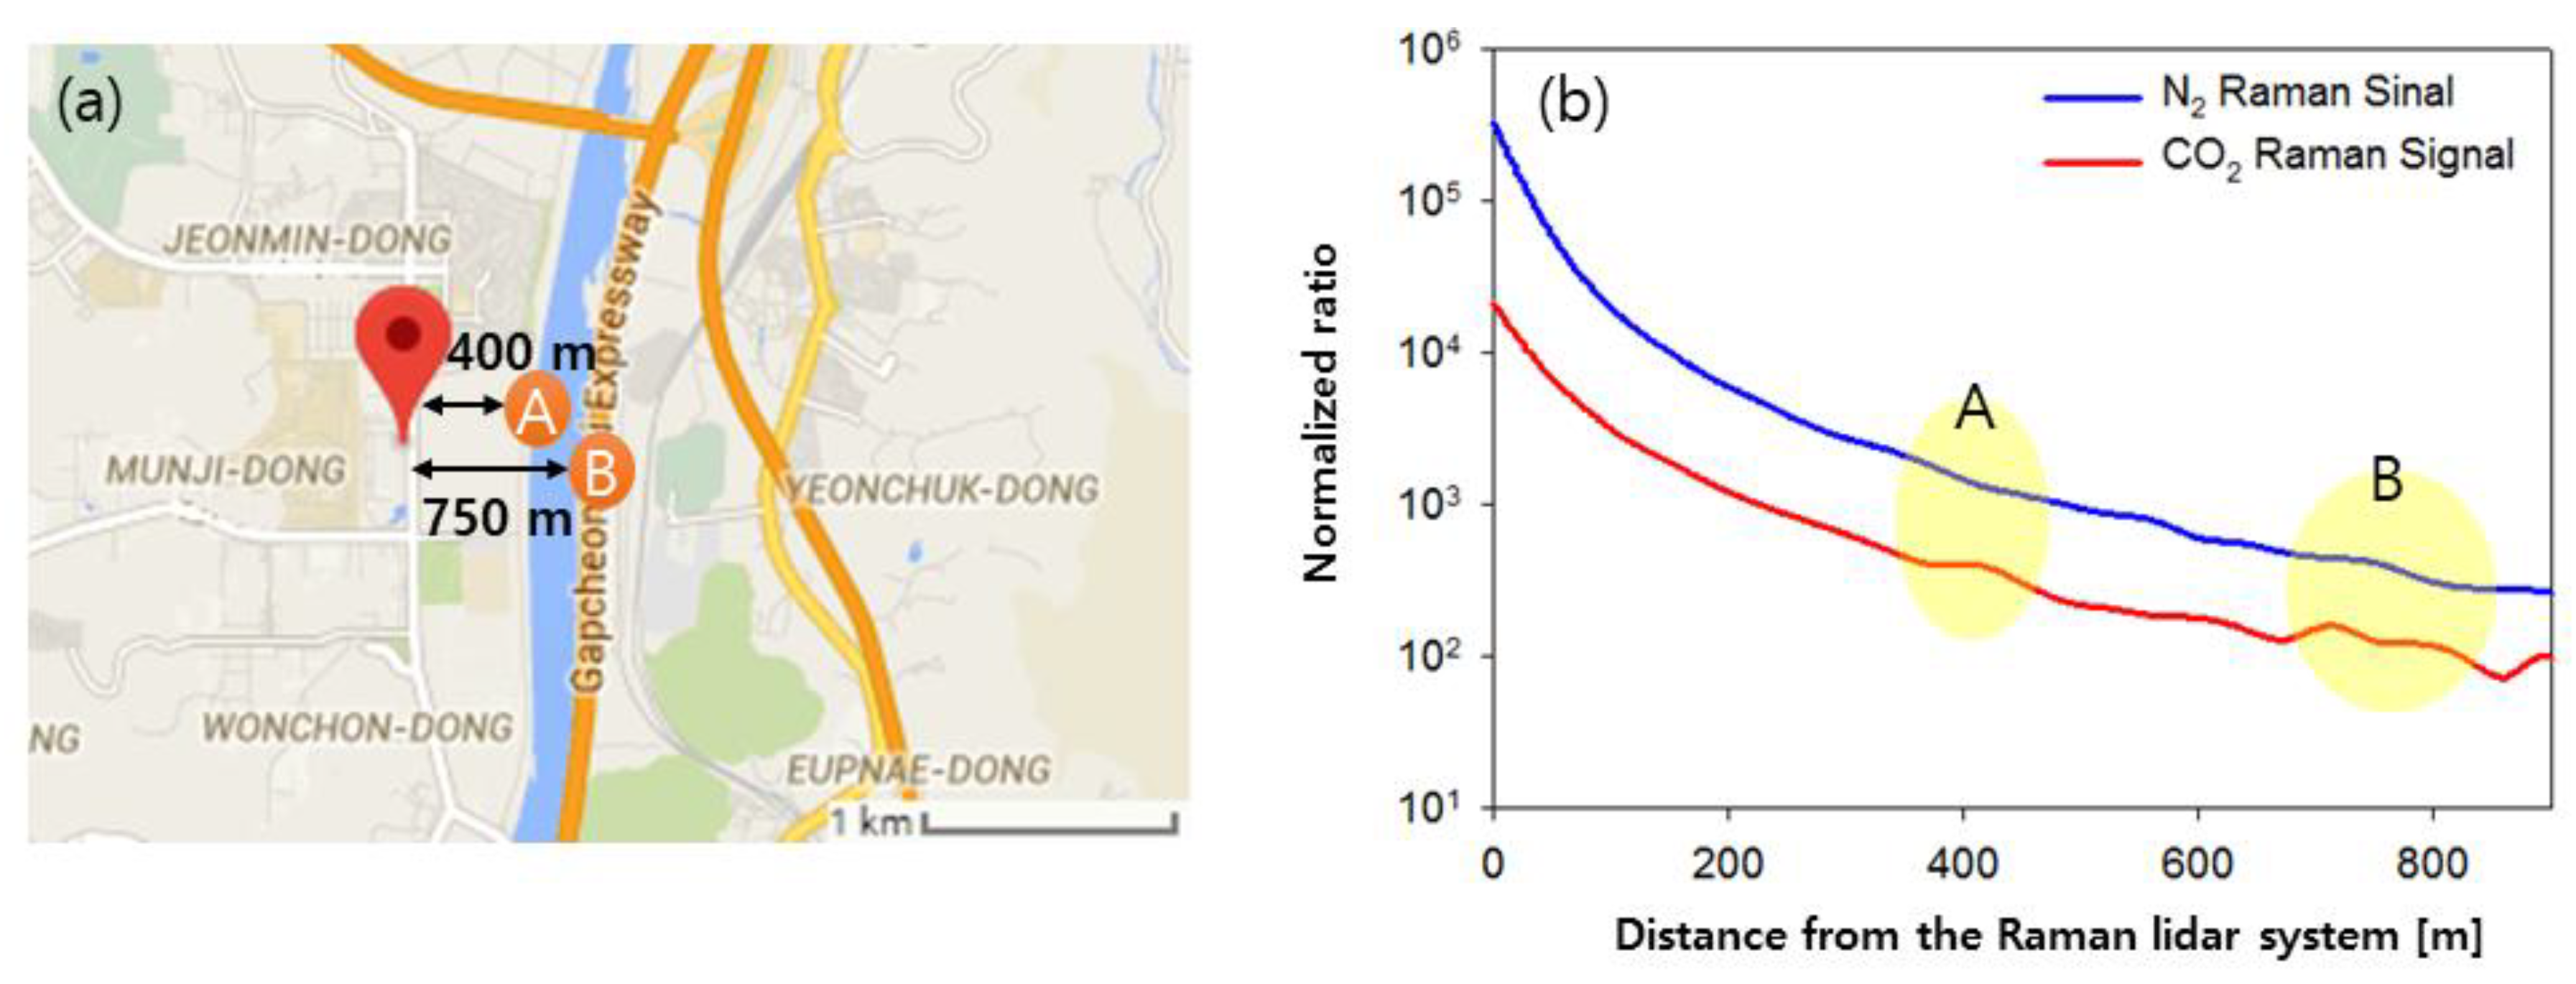
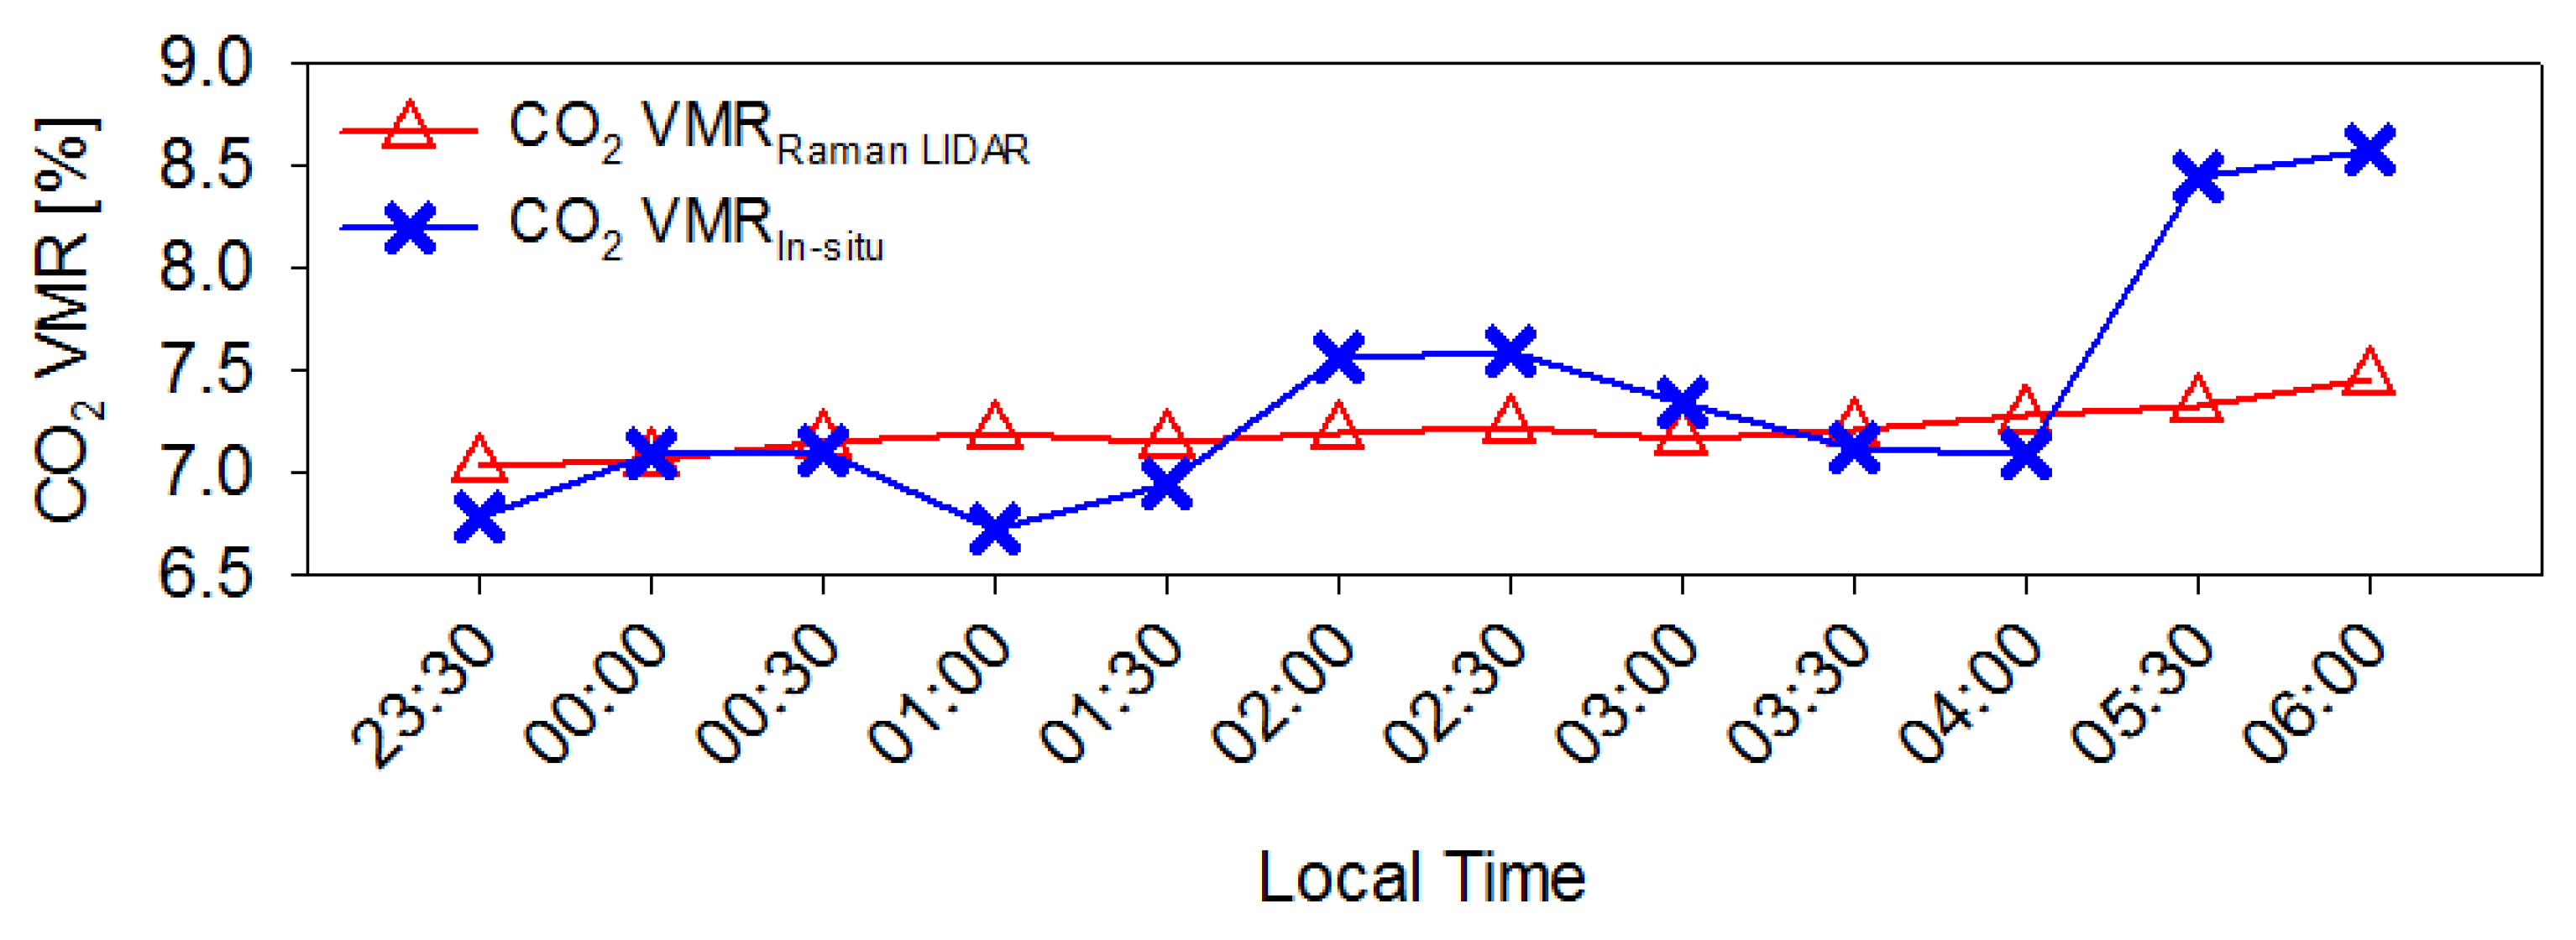
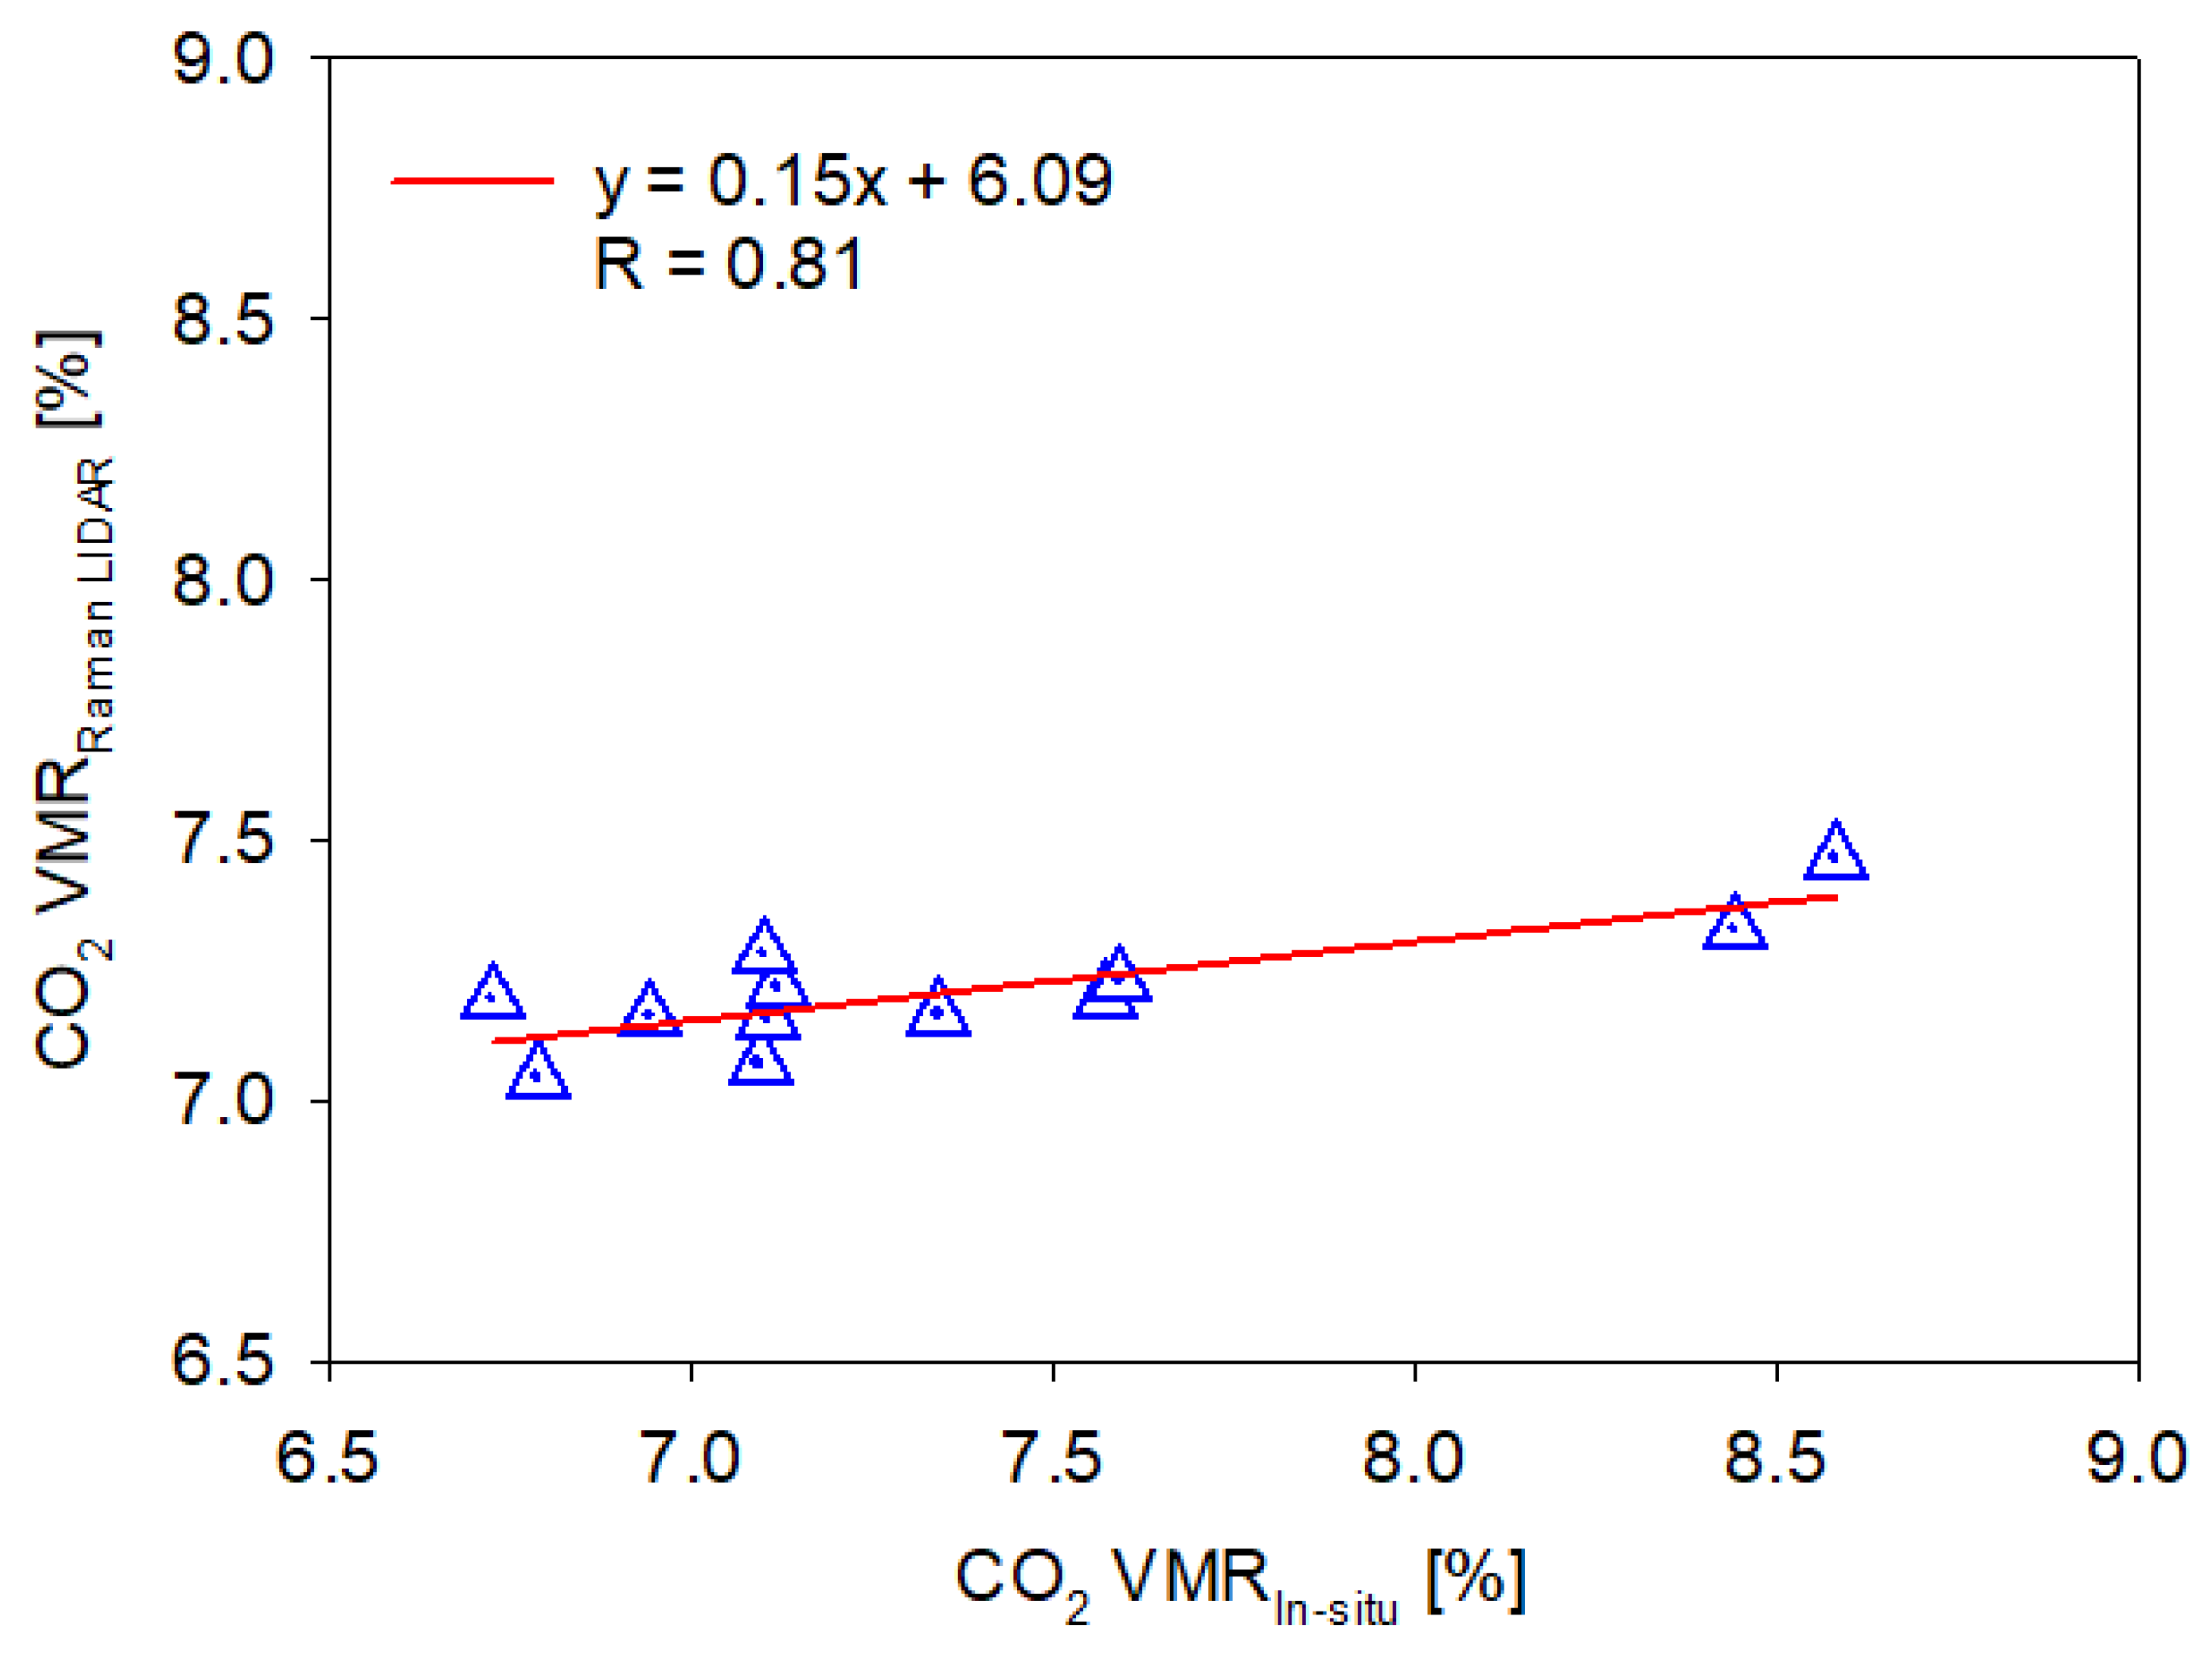
Figure 4 shows the correlation between the normalized ratio measured by CO2 Raman lidar and the CO2 VMRs from the CO2 cell. The x-axis represents the CO2 VMR inside the CO2 cell (CO2 VMRCELL) and the y-axis represents the normalized ratio, calculated from the inelastic signals of CO2 and N2 caused by Raman scattering (see Equation (5)). The correlation coefficient (R) between the CO2 VMRRaman LIDAR and the normalized ratio is 1, showing excellent agreement. The deviation from the regression line observed at CO2 VMR of 10% in Figure 4 is due to the inaccuracy of the vacuum gauge used to set the CO2 concentration in the vacuum cell. The vacuum gauge has a concentration error of 1%. Next, the CO2 VMR in the cell is retrieved using the normalized ratio and the regression equation obtained in Figure 4 based on the method displayed in Figure 1.
Figure 5 shows the correlation between CO2 VMRCELL and CO2 VMR as measured by the Raman lidar system (CO2 VMRRaman LIDAR). CO2 VMRRaman LIDAR obtained from CO2 Raman Lidar shows a good agreement with CO2 VMRCELL. Both R and the slope between CO2 VMRCELL and CO2 VMRRaman LIDAR are 1.00. An R value close to 1 indicates more stable and consistent laser power and higher repeatability of the detector than an R value lower than 1, because CO2 is the only variable that changes during the training and retrieval of indoor cell measurements of CO2. If the R value departs from 1, then the output power of the laser is not consistent or the repeatability of the detector is not sufficient for CO2 retrieval. The CO2 in the cell was measured 20 times by Raman lidar under constant conditions. We calculated the error of the value measured by Raman lidar when the CO2 VMR in the cell was the same as that during CO2 measurements. The CO2 measurement accuracy of our Raman lidar is 99.89% based on the indoor CO2 cell test.

3.2. Field Test

To examine the Raman lidar system’s capability in measuring spatially resolved CO2 and N2 Raman signals remotely, it was used to detect signals at a distance of 900 m from the lidar. The test was carried out on 30 October 2017, at a study site in Daejeon, South Korea, as shown in Figure 6a. We detected the Raman signals of CO2 and N2 for 1 h during the night. The effective spatial resolution of the Raman lidar was 250 ns (37.5 m). CO2 and N2 inelastic signals caused by Raman scattering were measured between the lidar system and a mountain location. During the daytime, the background signal from sunlight is stronger than the Raman scattering signal, so measurements were made only at night. Figure 6b shows the Raman signals of CO2 and N2 as a function of distance from the lidar system and the motorway. The increased CO2 Raman signals found at 400 and 750 m from the lidar system represent the locations of a local motorway (A) and the Gapcheondosi Expressway (B), respectively. The enhanced Raman signals of CO2 at locations A and B in Figure 6b imply that the lidar system is capable of detecting spatially resolved Raman signals of CO2 emitted from motor vehicles. The Raman lidar obtained clear and stable Raman scattering signals of N2 and CO2 at a distance of 900 m from the lidar system.
CO2-Leakage Measurement Campaign
To examine the CO2-leakage measurement capability of the lidar system, measurements were carried out using both the CO2 Raman lidar system and an in situ CO2 probe (VAISALA, GMP343). The measurements took place between 20 and 24 November 2017, at the Eumseong Environmental Impact Evaluation Test Facility (EIT) on Seepage of Geologically Stored CO2, an artificial CO2 gas-leakage site (36°96′N, 127°47′E). As shown in Figure 7, CO2 is injected at 0.5 m below the surface and left to leak back out. CO2 gas was injected into the ground at 12 L/min for 12 h on 22 November, 2017. The Raman lidar system is located 200 m from the in situ CO2 measurement device, which is located near the CO2 injection location. The Raman lidar line-of-sight is located 0.5 m above the surface of the CO2 injection inlet. The effective spatial resolution of the Raman lidar is 250 ns (37.5 m) and the beam diameter is about 29.98 cm at the target. The in situ instrument measured the CO2 VMR at a distance of 1 m from the Raman lidar line-of-sight. A linear regression equation between the normalized ratio and CO2 VMR measured by the in situ instrument is derived based on the measurements on 24 November, 2017. Six hours after stopping the CO2 gas injection, the measurement of CO2 on the surface was started using the CO2 Raman lidar. The change in Raman scattering signals with respect to the change in the CO2 mixing ratio on the surface was measured as CO2 gas was being injected into the ground at 12 L/min. During the campaign period, the in situ instrument with its inlet located 0.5 m from the surface often failed to measure CO2 leakage near the surface. This is thought to be associated with low CO2 concentrations even at 0.5 m from the surface, probably due to a negligible exit velocity of CO2 molecules. To evaluate the performance via comparison with the in situ measurement, the point of view of the lidar system was focused at the in situ inlet location to increase the lidar’s sensitivity to CO2 molecules.
Figure 8 shows the time series of CO2 VMRIn-situ measured by the in situ instrument (blue line) and CO2 VMRRaman LIDAR measured by the Raman lidar system (red lines) at the Eumseong EIT site during the field campaign. The CO2 gas was artificially injected into the ground and left to leak from the surface. An increasing trend in both CO2 VMRIn-situ and CO2 VMRRaman LIDAR is expected with continued CO2 injection. In Figure 8, the CO2 VMR measured by the CO2 Raman lidar increases steadily over time, while the CO2 VMR measured by the in situ instrument shows an increasing trend with large variability over a short time interval. The reason for this difference between the steadily increasing CO2 VMRRaman LIDAR and the increasing CO2 VMRIn-situ trend with large fluctuations could be associated with differences in measurement coverage. The spatial effective resolution of the Raman lidar is 37.5 m, which is different from the in situ instrument inlet area with a diameter of 1.5 cm. It is clearly shown that CO2 VMRRaman LIDAR tends to be lower than CO2 VMRIn-situ obtained from the CO2 leakage spot in Figure 9, which implies a certain influence of the ambient CO2 VMR on the CO2 VMRRaman LIDAR since the ambient CO2 VMR is likely to be lower than the CO2 VMR of the leakage and also does not change rapidly for a short time period [15]. In the present study, if the CO2 concentration of the leak is lower than the concentration of CO2 leaking from the field campaign in the case of a small leak, our current Raman lidar system with a spatial resolution of 37.5 m is barely able to detect the CO2 leak due to the long spatial resolution of the system. Therefore, the spatial resolution of the lidar system is an important factor in improving the CO2 precision and detection limit, especially for small leaks. A high-speed photon counter, which provides fine spatial resolution, is required to enhance the precision and detection limit. The LDL and precision of the Raman lidar are also thought to affect the overall efficiency and capability of the lidar to detect such small variations in low CO2 levels. The trend difference in Figure 8 between CO2 VMRIn-situ and CO2 VMRRaman LIDAR under windy conditions could be associated with the wind direction between a CO2 leak and the measurement location of each instrument, as the closest distance between the Raman lidar line-of-sight and the in situ instrument is 1 m. However, the effect of wind direction and speed could not be quantified due to the unavailability of wind data during the campaign period.
Figure 9 shows the results of linear regression for CO2 VMRIn-situ and CO2 VMRRaman LIDAR at the Eumseong EIT site, revealing a correlation. The R value and slope between CO2 VMRIn-situ and CO2 VMRRaman LIDAR are 0.81 and 0.15, respectively. The mean absolute error (MAE), the root mean square error (RMSE) and the percentage difference between CO2 VMRIn-situ and CO2 VMRRaman LIDAR are 0.27%, 0.37%, and 4.92%, respectively. The errors due to a decrease in backscattered Raman signals that follow a Poisson distribution are 4.9% (112.5 m), 5.4% (150.0 m), or 6.3% (187.5 m). The uncertainty due to the regression coefficients, as calculated from the residuals between the regression line and measured values, is 5.5%. Thus, the total error in CO2 VMRRaman LIDAR, which is calculated by error propagation, is estimated to be 7.4% (112.5 m), 7.7% (150.0 m), or 8.4% (187.5 m).

4. Discussion

Hui et al. [8] monitored CO2 leakage from a geological CO2 storage site in Xuzhou, Jiangsu, China, using multiple in situ instruments and wireless sensor networks, and Elio et al. [9] applied a technique for measuring CO2 soil flux at a CO2 injection site at Hontomin, Spain. While these in situ instruments have high CO2 measurement accuracy, a large number of such instruments are needed to monitor large CCS sites. To enhance monitoring efficiency over a large area, remote sensing techniques are desired. Therefore, as part of efforts to develop remote sensing techniques for CO2 measurements at the Earth’s surface, we developed the first compact, lightweight, and portable Raman lidar system for remote sensing of surface CO2 leakage. To examine the performance of the lidar, it was used to detect strong Raman signals of CO2 at two roads located 400 and 750 m from the instrument. In the case of measurements at an artificial CO2 leakage site, the CO2 VMRs at 0.5 m from the surface and 200 m from the Raman lidar were measured successfully and show a good correlation with data collected by an in situ instrument. It is also necessary to understand the longest remote sensing distance with the highest possible accuracy. In order to quantify the longest remote sensing distance of our Raman lidar system, it should be measured in the area without any obstacles on the line of sight. To obtain a relative accuracy from the comparison between CO2 VMRs obtained from in situ instrument and the lidar, multiple in situ sensors need to be deployed at several distances on the line of the lidar sight.
During the campaign period, the CO2 VMRs were detected successfully only near the surface, probably due to the low CO2 exit velocity from the ground. In the case of such low velocities, the altitude of the lidar line of sight needs to be lowered to measure CO2, since this compound is likely to exist near the surface. However, lowering the measurement altitude may cause noise such as fluorescence effect in the backscatter signals if the laser encounters obstacles near the surface or the ground itself, arising from the lowered altitude of the line of sight. Our current CO2 retrieval algorithm needs to be improved to account for fluorescence effects. In addition, Elio et al. [9] proposed a CCS area of 3 km × 3 km that requires a Raman lidar scan that can provide sufficiently high spatial resolution to detect CO2 leakage from a small site. In the present study, a laser with 80 mJ power was used in the lidar. A laser with stronger power and a more efficient receiver is needed to generate the Raman signal of CO2 for sites far from the laser and to detect weak CO2 Raman signals. In addition, in the case of elevated terrain along the lidar line of sight, the measurement distance on the line of sight is reduced, meaning that a lidar located at a single spot cannot complete two-dimensional horizontal scanning over a large CCS site with elevated terrain.

5. Conclusions

We developed a Raman lidar system that remotely detects CO2 leakage and CO2 VMR. The system consists of a laser, a telescope, an optical receiver, and detectors. In terms of indoor CO2 cell measurement, CO2 Raman lidar shows very high accuracy. Field measurements were carried out using Raman lider at the Eumseong EIT site where a CO2 leak is located 0.2 km from the Raman lidar system. There is good agreement between CO2 VMRRaman LIDAR as measured by the Raman lidar system and CO2 VMRIn-situ as measured by an in situ instrument at the Eumseong EIT site. The R value and percentage difference between CO2 VMRIn-situ and CO2 VMRRaman LIDAR are 0.81 and 4.92%, respectively. Discrepancies between the CO2 values measured by Raman lidar and by the in situ instrument could be due to differences between measurement coverage and the measurement geometry of the two approaches. In the case of low CO2 exit velocities, it is necessary to measure the CO2 by lowering the altitude of both lidar and in situ instruments. In the case of lidar, lowering the measurement altitude may cause noise signals such as fluorescence to be included in the backscatter signals when the laser hits the ground due to the terrain. Therefore, the lidar algorithm and measurement methods need to be studied further. The CO2 VMR measurement resolution and detection limit also requires further study at low levels of CO2. In a future experiment, wind data will be used to assess the optimal measurement height for the detection and measurement of CO2 leaks.

Author Contributions

The Raman lidar system was developed by H.K., S.C., S.P., and M.Y. In situ data collection and analysis were done by S.-T.Y. and S.-C.J. Retrieval of CO2 VMRRaman LIDAR was conducted by D.K., H.L. and J.-Y.R.

Funding

This research was funded by Korea Environmental Industry & Technology Institute grant number 2018001810001.

Acknowledgments

This subject is supported by Korea Ministry of Environment (MOE) as “K-COSEM Research Program”. This work was financially supported by the BK21 plus Project of the Graduate School of Earth Environmental Hazard System. Authors appreciate the valuable comments from the reviewers which certainly improved the quality of the paper.

Conflicts of Interest

The authors declare no conflict of interest.

References

  1. Ko, D.; Yoo, G.; Yun, S.T.; Chung, H. Impacts of CO2 leakage on plants and microorganisms: A review of results from CO2 release experiments and storage sites. Greenh. Gas. Sci. Technol. 2016, 6, 319–338. [Google Scholar] [CrossRef]
  2. Metz, B. (Ed.) Carbon Dioxide Capture and Storage: Special Report of the Intergovernmental Panel on Climate Change; Cambridge University Press: Cambridge, UK, 2005. [Google Scholar]
  3. IPCC. Climate Change 2014: Mitigation of Climate Change. Contribution of Working Group III to the Fifth Assessment Report of the Intergovernmental Panel on Climate Change; Edenhofer, O., Pichs-Madruga, R., Sokona, Y., Farahani, E., Kadner, S., Seyboth, K., Eds.; Cambridge University Press: Cambridge, UK; New York, NY, USA, 2014. [Google Scholar]
  4. Andrews, A.E.; Kofler, J.D.; Trudeau, M.E.; Williams, J.C.; Neff, D.H.; Masarie, K.A.; Chao, D.Y.; Kitzis, D.R.; Novelli, P.C.; Zhao, C.L.; et al. CO2, CO, and CH 4 measurements from tall towers in the NOAA Earth System Research Laboratory‘s Global Greenhouse Gas Reference Network: Instrumentation, uncertainty analysis, and recommendations for future high-accuracy greenhouse gas monitoring efforts. Atmos. Meas. Tech. 2014, 7, 647–687. [Google Scholar] [CrossRef]
  5. Grubb, M.; Vrolijk, C.; Brack, D. The Kyoto Protocol: A Guide and Assessment; Royal Institute of International Affairs Energy and Environmental Programme: London, UK, 1997; ISBN 1853835803. [Google Scholar]
  6. Koornneef, J.; Ramírez, A.; Turkenburg, W.; Faaij, A. The environmental impact and risk assessment of CO2 capture, transport and storage–an evaluation of the knowledge base. Prog. Energy Combust. Sci. 2012, 38, 62–86. [Google Scholar] [CrossRef]
  7. West, J.M.; Pearce, J.M.; Coombs, P.; Ford, J.R.; Scheib, C.; Colls, J.J.; Smith, K.L.; Steven, M.D. The impact of controlled injection of CO2 on the soil ecosystem and chemistry of an English lowland pasture. Energy Procedia 2009, 1, 1863–1870. [Google Scholar] [CrossRef]
  8. Yang, H.; Qin, Y.; Feng, G.; Ci, H. Online monitoring of geological CO2 storage and leakage based on wireless sensor networks. IEEE Sensors J. 2013, 13, 556–562. [Google Scholar] [CrossRef]
  9. Elío, J.; Nisi, B.; Ortega, M.F.; Mazadiego, L.F.; Vaselli, O.; Grandia, F. CO2 soil flux baseline at the technological development plant for CO2 injection at Hontomin (Burgos, Spain). Int. J. Greenh. Gas Control 2013, 18, 224–236. [Google Scholar] [CrossRef] [Green Version]
  10. Jung, N.H.; Han, W.S.; Watson, Z.T.; Graham, J.P.; Kim, K.Y. Fault-controlled CO2 leakage from natural reservoirs in the Colorado Plateau, East-Central Utah. Earth Planet. Sci. Lett. 2014, 403, 358–367. [Google Scholar] [CrossRef]
  11. Jun, S.C.; Cheon, J.Y.; Yi, J.H.; Yun, S.T. Controlled release test facility to develop environmental monitoring techniques for geologically stored CO2 in Korea. Energy Procedia 2017, 114, 3040–3051. [Google Scholar] [CrossRef]
  12. Zhao, P.; Zhang, Y.; Wang, L.; Cao, K.; Su, J.; Hu, S.; Hu, H. Measurement of tropospheric CO2 and aerosol extinction profiles with Raman lidar. Chin. Opt. Lett. 2008, 6, 157–160. [Google Scholar] [CrossRef]
  13. Stoyanov, D.; Grigorov, I.; Kolarov, G.; Peshev, Z.; Dreischuh, T. LIDAR atmospheric sensing by metal vapor and Nd: YAG lasers. In Advanced Photonic Sciences; InTech: London, UK, 2012. [Google Scholar]
  14. Whiteman, D.N.; Melfi, S.H.; Ferrare, R.A. Raman lidar system for the measurement of water vapor and aerosols in the Earth’s atmosphere. App. Opt. 1992, 31, 3068–3082. [Google Scholar] [CrossRef] [PubMed]
  15. Ehleringer, J.R.; Cerling, T.E. Atmospheric CO2 and the ratio of intercellular to ambient CO2 concentrations in plants. Tree Physiol. 1995, 15, 105–111. [Google Scholar] [CrossRef] [PubMed]
Figure 1. Flow chart for calculating the CO2 volume mixing ratio using the Raman lidar system.
Remotesensing 10 01439 g001
Figure 2. Schematic of the CO2 Raman lidar system.
Remotesensing 10 01439 g002
Figure 3. Schematic diagram of the indoor CO2 cell test.
Remotesensing 10 01439 g003
Figure 4. CO2 VMRCELL versus normalized ratio diagram.
Remotesensing 10 01439 g004
Figure 5. CO2 VMRCELL versus CO2 VMRRaman LIDAR diagram.
Remotesensing 10 01439 g005
Figure 6. (a) Study area in Daejeon, Korea; (b) N2 and CO2 Raman signals measured by the Raman lidar system.
Remotesensing 10 01439 g006
Figure 7. Schematic representation of the Eumseong Environmental Impact Evaluation Test Facility for the seepage of geologically stored CO2.
Remotesensing 10 01439 g007
Figure 8. Time series of CO2 VMRIn-situ and CO2 VMRRaman LIDAR on November 23, 2017.
Remotesensing 10 01439 g008
Figure 9. CO2 VMRIn-situ versus CO2 VMRRaman LIDAR diagram.
Remotesensing 10 01439 g009
Table 1. Components of the Raman lidar system.
ComponentSpecification
LaserNd:YAG laser
Wavelength: 355 nm
Pulse Energy: 80 mJ
Beam divergence: <1.5 mrad (full angle)
Repetition rate: 20 Hz
Pulse duration: 9 ns
F1Notch filter, 355 nm
Spectral Range: 350–1100 nm
Nominal Transmission: 1.0%
F2CO2 Raman (371.7 nm)
CWL: 371.7 nm
FWHM: 0.5 nm
Tabs > 70% @ 371.7 nm (Typical T > 85%)
OD > 7 @ 354.7 nm
OD > 6 from 200–1200 nm out-of-band
F3N2 Raman (386.7 nm)
FWHM < 0.6 nm
OD7
Transmission: 386.7 nm > 80% T Absolute
F4355 nm filter
CWL: 355 nm
FWHM: 10 nm
OD > 5
Transmission > 90%
PMT1CO2 Channel
R9880U-210
PMT2N2 Channel
R9880U-210
PMT3355 nm Channel
R9880U-210
Telescope6-In. Schmidt Cassegrain
Beam expander5X, fixed beam-expander
Size of the Raman lidar system1100 × 850 × 550 mm (W × H × D)
Weight of the Raman lidar system70 kg
Power demand of the Raman lidar system1000 W

