Letter

Mapping High Mountain Lakes Using Space-Borne Near-Nadir SAR Observations

Key Laboratory of Space Utilization, Technology and Engineering Center for Space Utilization, Chinese Academy of Sciences, Beijing 100094, China
*
Author to whom correspondence should be addressed.
Remote Sens. 2018, 10(9), 1418; https://doi.org/10.3390/rs10091418
Submission received: 10 August 2018 / Revised: 3 September 2018 / Accepted: 5 September 2018 / Published: 6 September 2018
(This article belongs to the Special Issue Remote Sensing of Environmental Changes in Cold Regions)

Abstract

:
Near-nadir interferometric imaging SAR (Synthetic Aperture Radar) techniques are promising in measuring global water extent and surface height at fine spatial and temporal resolutions. The concept of near-nadir interferometric measurements was implemented in the experimental Interferometric Imaging Radar Altimeters (InIRA) mounted on Chinese Tian Gong 2 (TG-2) space laboratory. This study is focused on mapping the extent of high mountain lakes in the remote Qinghai–Tibet Plateau (QTP) areas using the InIRA observations. Theoretical simulations were first conducted to understand the scattering mechanisms under near-nadir observation geometry. It was found that water and surrounding land pixels are generally distinguishable depending on the degree of their difference in dielectric properties and surface roughness. The observed radar backscatter is also greatly influenced by incidence angles. A dynamic threshold method was then developed to detect water pixels based on the theoretical analysis and ancillary data. As assessed by the LandSat results, the overall classification accuracy is higher than 90%, though the classifications are affected by low backscatter possibly from very smooth water surface. The algorithms developed from this study can be extended to all InIRA land measurements and provide support for the similar space missions in the future.

Graphical Abstract

1. Introduction

Lakes are essential components in global hydraulic cycle and climate processes. The expansion and shrinkage of lake extent are strongly influenced by seasonal climate patterns as well as long term environmental changes [1,2]. Lakes provide strong feedbacks to regional and global environments, and the emergence and expansion of thaw-lakes are found having profound impacts on high-latitude ecosystems [3]. There is high priority to monitor the dynamics of lake area and water storage for assessing global change impacts and forecasting the future climate change scenarios. The areas and levels of high mountain lakes in the Qinghai–Tibet Plateau (QTP) are particularly important for monitoring the impacts of glacier melting [4], mitigating the hazards from glacier lake outbursts [5], and detecting the climate pattern changes [6] due to the region’s high sensitivity and vulnerability to climate changes [7,8,9].
A large number of lakes are distributed in the QTP whose lake areas are more than half of the total lake area of China [1]. The unique high mountain lakes in QTP also represents one of the largest lake systems in the world [10]. However, most of the lakes in the region are located in remote areas, which make it difficult for human surveying of the lake physical and chemical parameters. Remote sensing has been successfully used for mapping global water bodies. A variety of studies applying optical remote sensing have been conducted for detecting land surface water over the QTP and the globe [11,12,13,14,15,16]. Among these studies, the research described in [16] used satellite optical images from the China–Brazil Earth Resources Satellite (CBERS) and the National Aeronautics and Space Administration (NASA)/United States Geological Survey (USGS) Landsat to provide detailed mapping of the boundaries of natural lakes in China including the QTP region. However, the CBERS and LandSat images or similar optical observations only work well for clear-sky conditions, and this restriction normally leads to retrievals with coarse temporal resolutions [17]. Satellite passive microwave radiometer is capable of all-sky sensing of land surface and has been used for deriving global surface water products. The products derived from the Special Sensor Microwave Imagers (SSMI), the Advanced Microwave Scanning Radiometer on the Earth Observing System (AMSR-E), and the Soil Moisture Active Passive (SMAP) are sensitive to short-term changes of water surface but are at resolutions about 25 km [18,19,20]. These products therefore cannot be used for mapping small lakes. In contrast, the next generation near-nadir interferometric imaging SAR (Synthetic Aperture Radar) such as the NASA Surface Water Ocean Topography (SWOT) mission is promising for high spatial and temporal mapping of lakes including those smaller than 1 km2 (SWOT) [21,22,23,24]. The main payloads of SWOT include two Ka-band Radar Interferometers designed for near-nadir SAR imaging and interferometric measurement [22]. SWOT is scheduled for launch in 2021 and its potential for accurate inundation mapping has been demonstrated by SWOT airborne simulator in the field campaign [24]. Similar to SWOT in the designing concept, a pair of near-nadir Interferometric Imaging Radar Altimeters (InIRA) mounted on Chinese unmanned space laboratory Tian Gong 2 (TG-2) have collected Ku-band SAR observations over the globe since 2016. The InIRA provides a unique opportunity to evaluate the near-nadir imaging techniques in measuring water cycle components from space. In this study, we developed an algorithm to map lake bodies in Northern QTP based on TG-2 InIRA observations and theoretical simulations. The derived lake body maps were evaluated by LandSat results. Detailed descriptions of the study region and data set are in the following Section 2.1 and Section 2.2, theory and algorithms are described in Section 2.3 and Section 2.4, and the results are presented in Section 3 and discussed in Section 4.

2. Materials and Methods
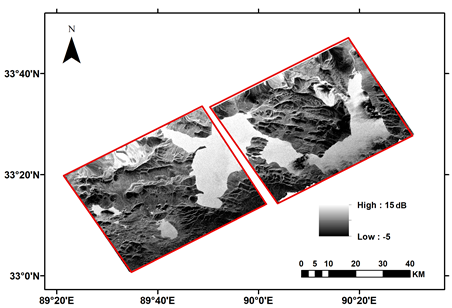
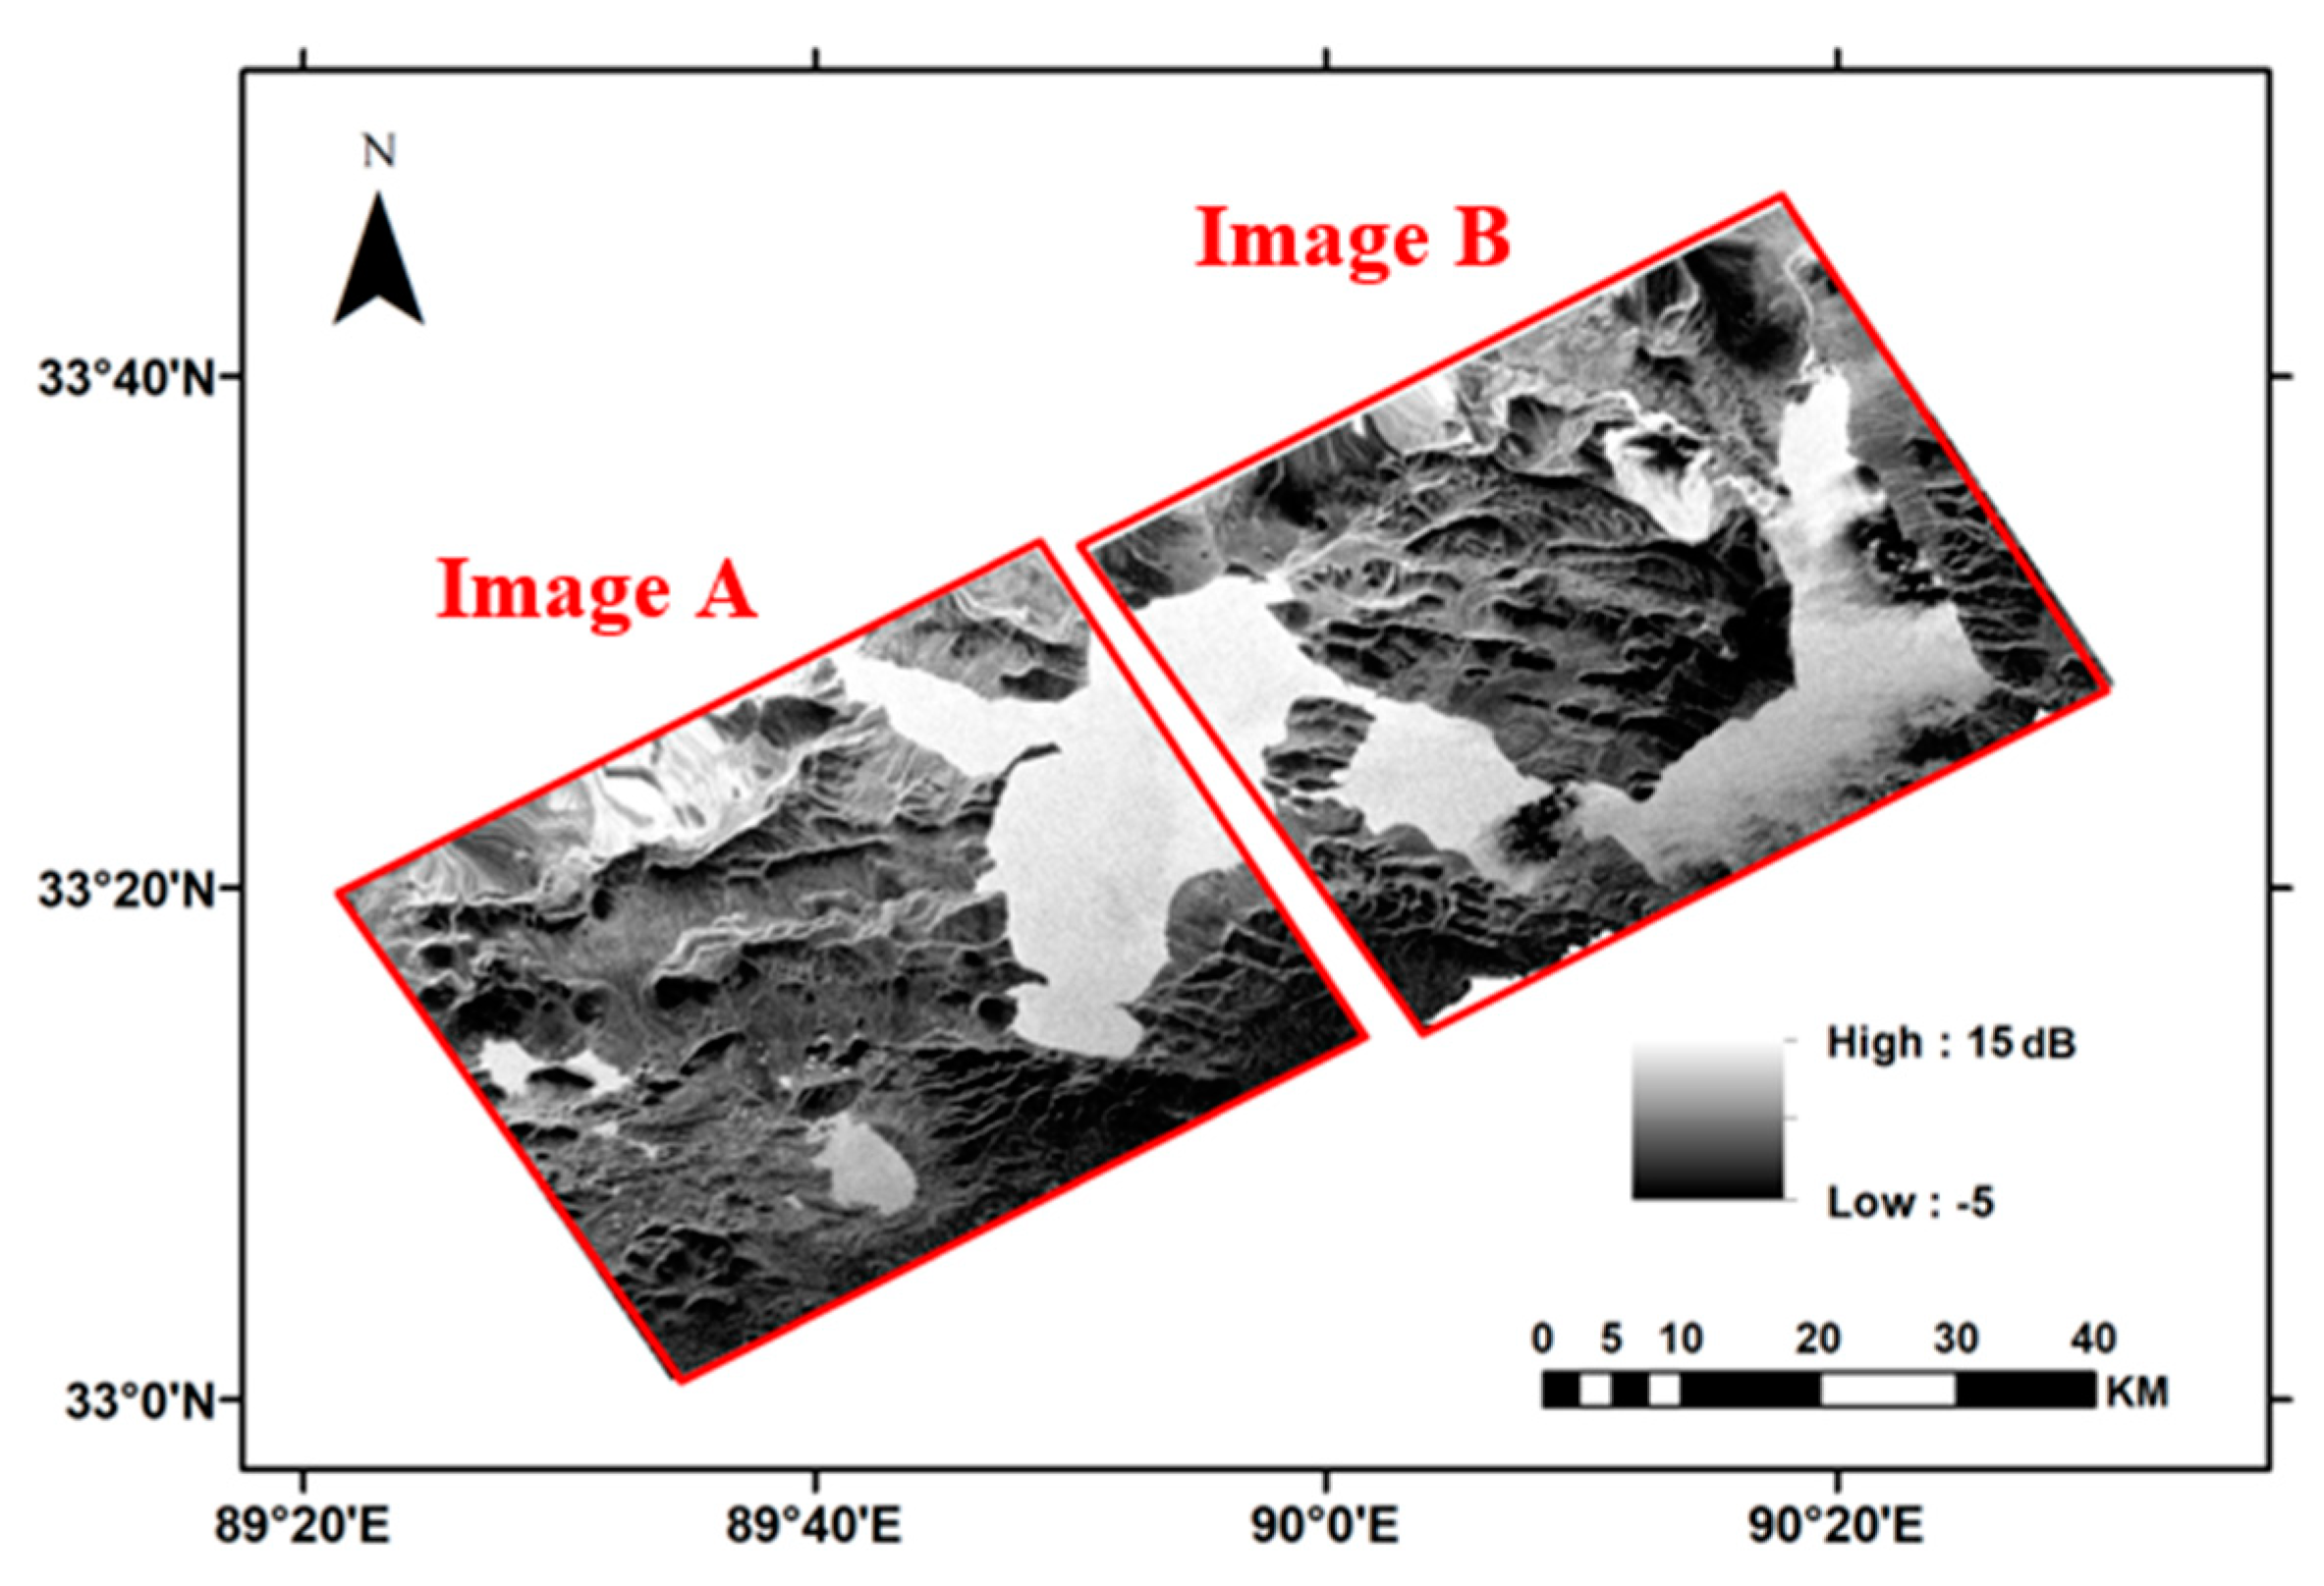
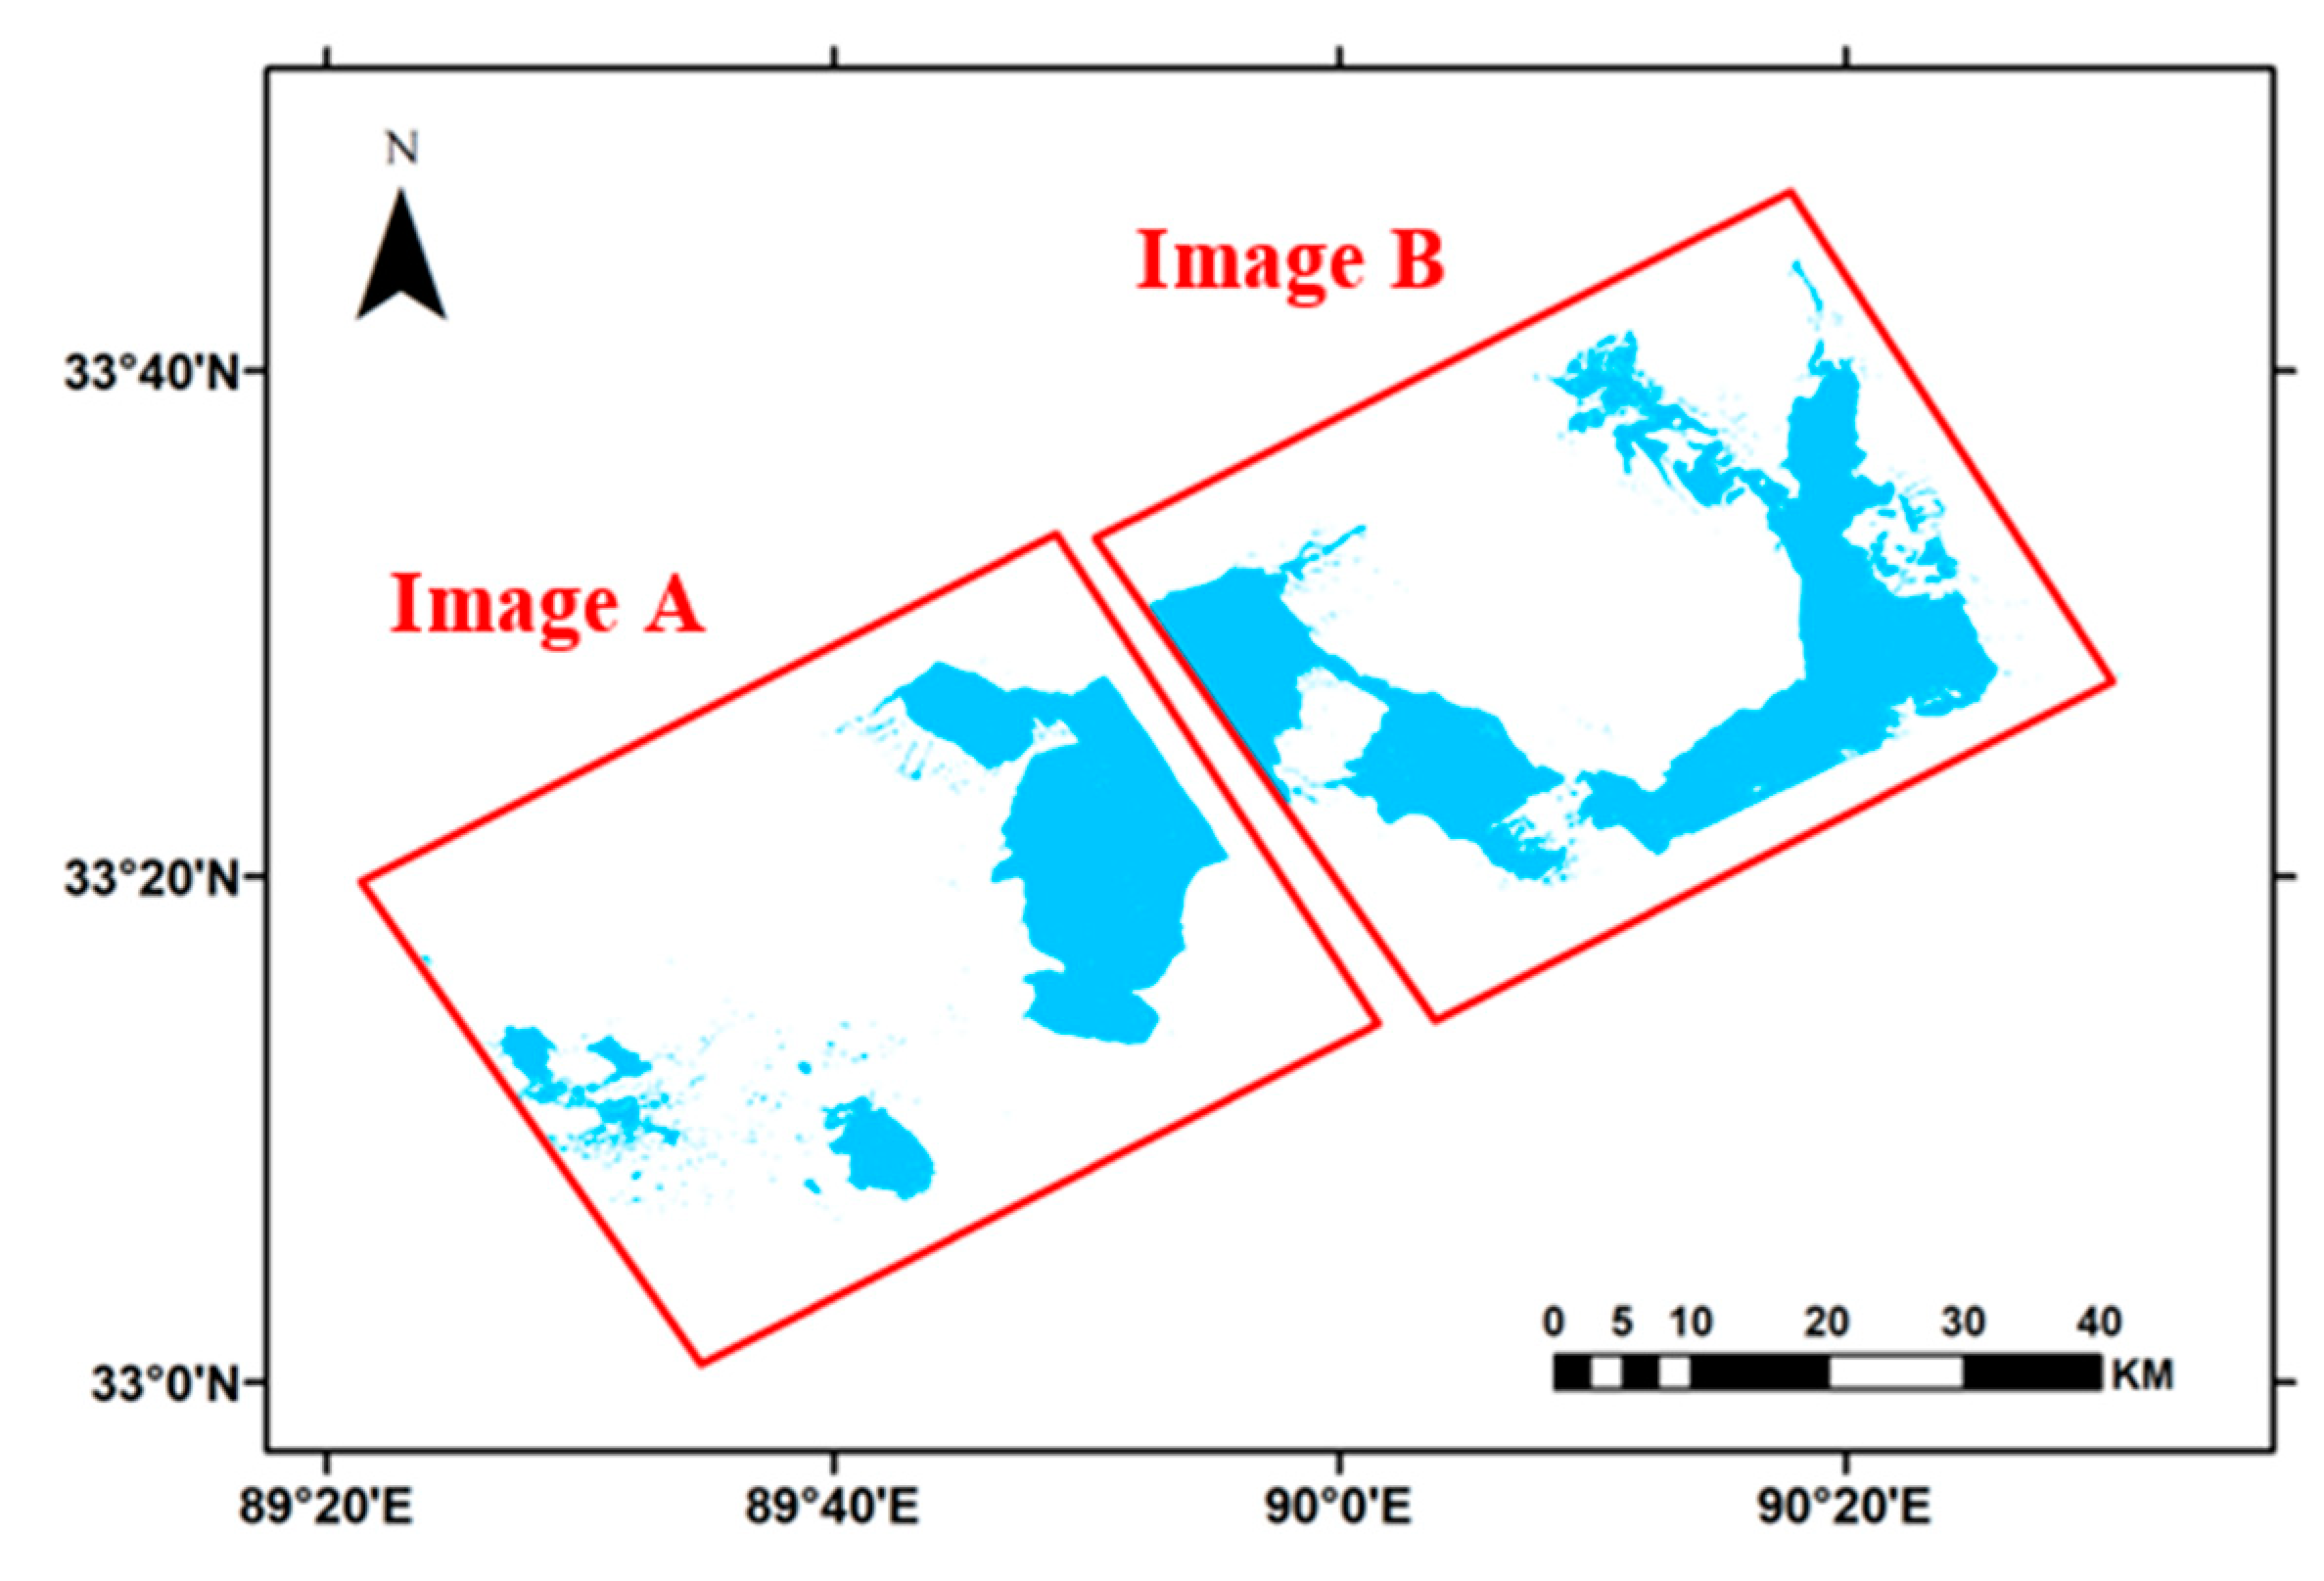
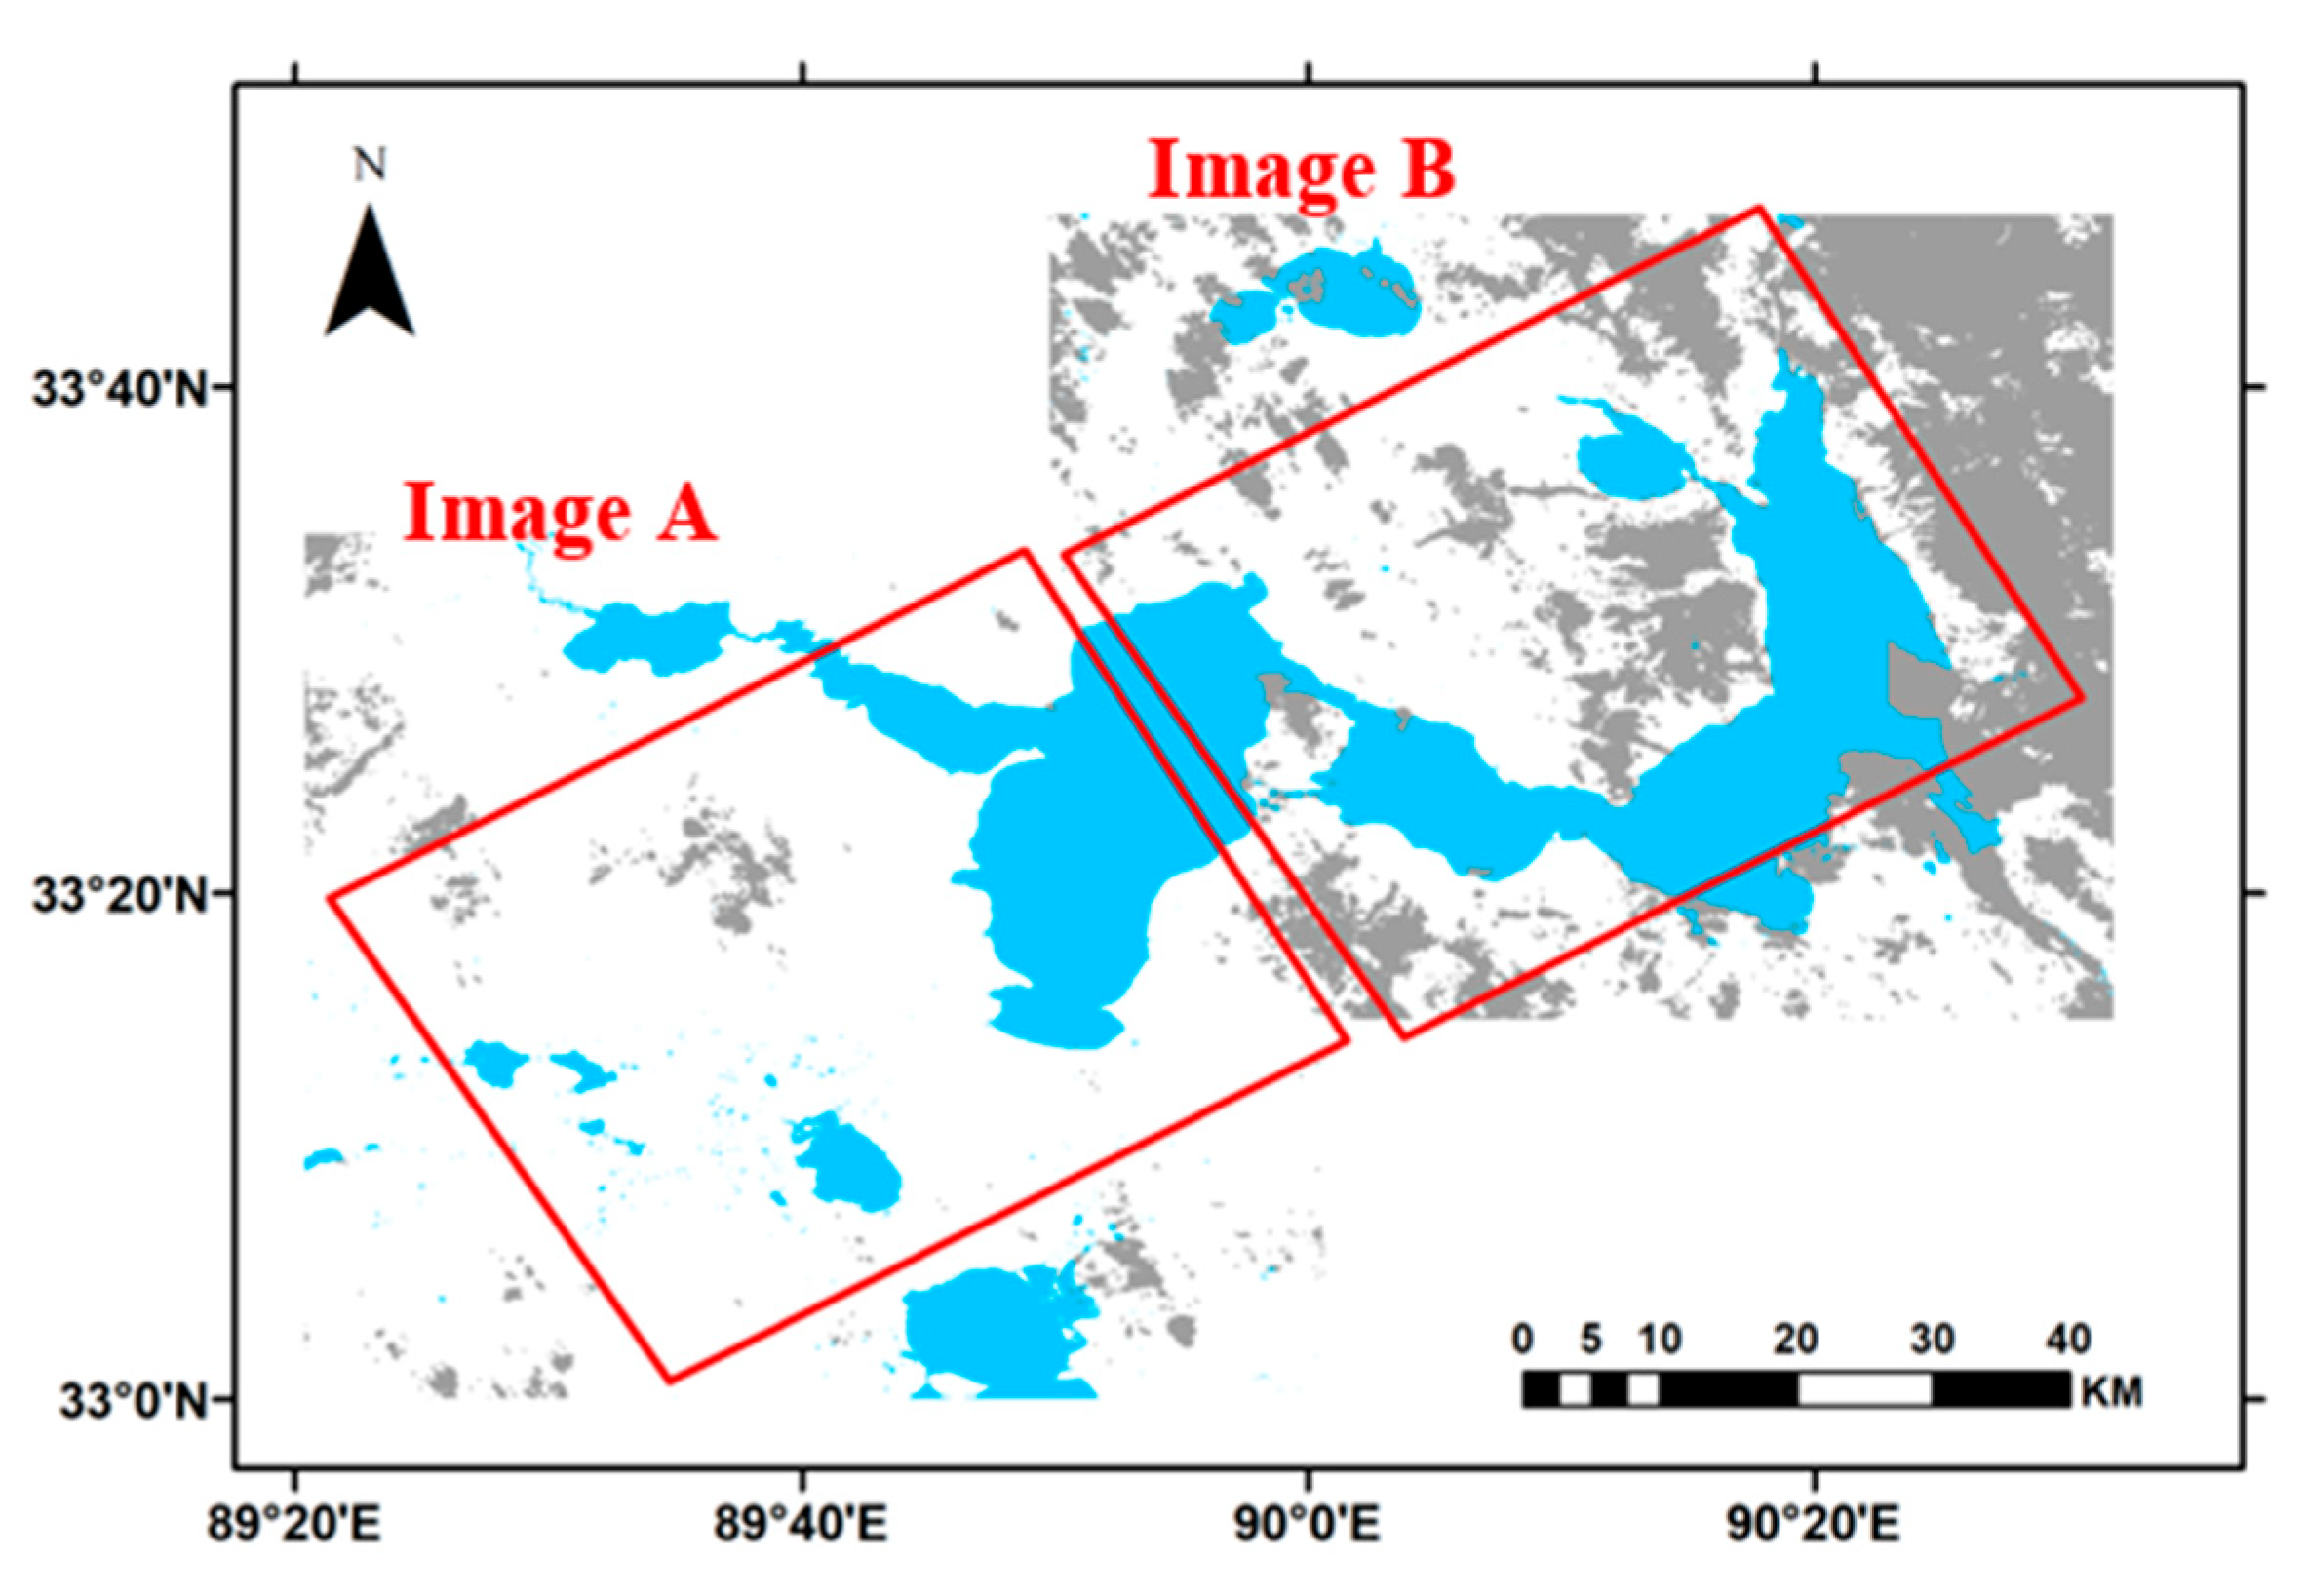
2.1. Study Region

The study region (within the red rectangles of Figure 1) was located within Nagqu prefecture of Tibet Autonomous Region, China, covering about 3600 km2 area. The natural environment of the region is cold and dry, typical of that of the Northern QTP where elevations are normally higher than 4000 m and annual precipitation is as low as 247.3 mm [1,25]. Major lakes within the study areas include Que’er Caka, Khongnam Tso, Dorosidong Co, Maqiao Co., and Chibzhang Co. Most of the lakes in the regions are saline lakes [26,27]. Due to the scarce of precipitation, glaciers of the region provide important water supplies to many lakes; the lake area changes are affected by factors such as glacier retreat, permafrost degradation, and climate pattern changes [1,26,27]. The two largest lakes of the region are Dorsoidong Co (center latitude 33.41°, longitude 89.88°) and Chibzhang Co (center latitude 33.47°, longitude 90.34°), both of which are glacier-fed lakes undergoing expansions and interlinked with other in recent years [26].

2.2. Instrument and Data Set

The InIRA mounted on TG-2 space laboratory was developed by the China Manned Space Engineering Project and has been operational since 15 September 2016. The TG-2 space laboratory is served as a test bed for scientific research and new technologies, and carries more than 50 scientific instruments. There are also more than 10 science and application space experiments conducted in TG-2 in the fields of earth science, astronomy, microgravity physics, microgravity fluid physics, space life science, space environment, and space physics. The InIRA is an interferometric synthetic aperture radar (InSAR) system with near-nadir imaging capacity at Ku-band. As the first space-borne interferometric radar altimeters, the experimental InIRA system is designed for evaluating the near-nadir imaging and interferometric techniques in measuring sea surface height, water body extent and land elevation. The detailed parameters of the instrument for land applications are listed in Table 1.
For this study, the VV-polarized SAR backscatter images (Figure 1) acquired by InIRA of the study region on 23 September 2016 were used for mapping lake extent. The two images (Images A and B of Figure 1) sequentially acquired by InIRA were Level 2 scientific data with radiometric and geometric calibrations conducted and downloaded from Space Application Data Promoting Service Platform for China Manned Space Engineering (http://www.msadc.cn). As seen in Figure 1, the backscattering coefficients range from −5 to 15 dB and the overall bright lake areas are generally distinguishable from the surrounding darker land areas. However, geometric distortions are found over the northern edges of the images. The layover and shadow regions which are typical to the SAR observations over mountainous areas are also shown in the two images.
Two ancillary data sets were used in this study for algorithm development. The data sets include the official elevation product of InIRA and LandSat-based water occurrence dataset (WOD) [15]. The official Level 3 elevation products of InIRA (Figure 2) derived using signals with high interferometric coherence were obtained from http://www.msadc.cn. The elevation data are used to calculate terrain slopes for identifying hilly areas. Since no valid data were available over areas with strong geometric distortions, the elevation product also serves as a reference to mask out the non-retrievable pixels. The second ancillary data set WOD was generated based on 30 m Landsat images from 1984 to 2015 [15]. The WOD was produced by analyzing the Landsat 5, 7, and 8 archives. The data of WOD range from 0% (always land) to 100% (permanent water) and represent the global surface water persistence over more than three decades. For this study, about 120 pixels with water occurrence >95% were randomly selected for each InIRA image. These pixels are highly likely to be part of a permanent water body and are used for establishing the training data sets for InIRA water detection.
We also chose LandSat Operational Land Imager (OLI) images as the ancillary data for validation purposes. The LandSat/OLI image used for this study was acquired on 9 September 2016 over the study region, and downloaded from USGS website (https://landsat.usgs.gov/). The selected LandSat image has relatively less cloud coverage and is closest to the InIRA observations in acquisition date, though not exactly the same. For validating the InIRA water retrievals, the Landsat/OLI image was processed by Fmask algorithm [28] for generating 30-m water mask, which was then interpolated to 40-m resolution image using the nearest neighbor method. The Fmask algorithm was designed to identify cloud, cloud shadow, snow, land, and water pixels using LandSat or Sentinel 2 images, and was recently improved for its use over mountainous areas [29].

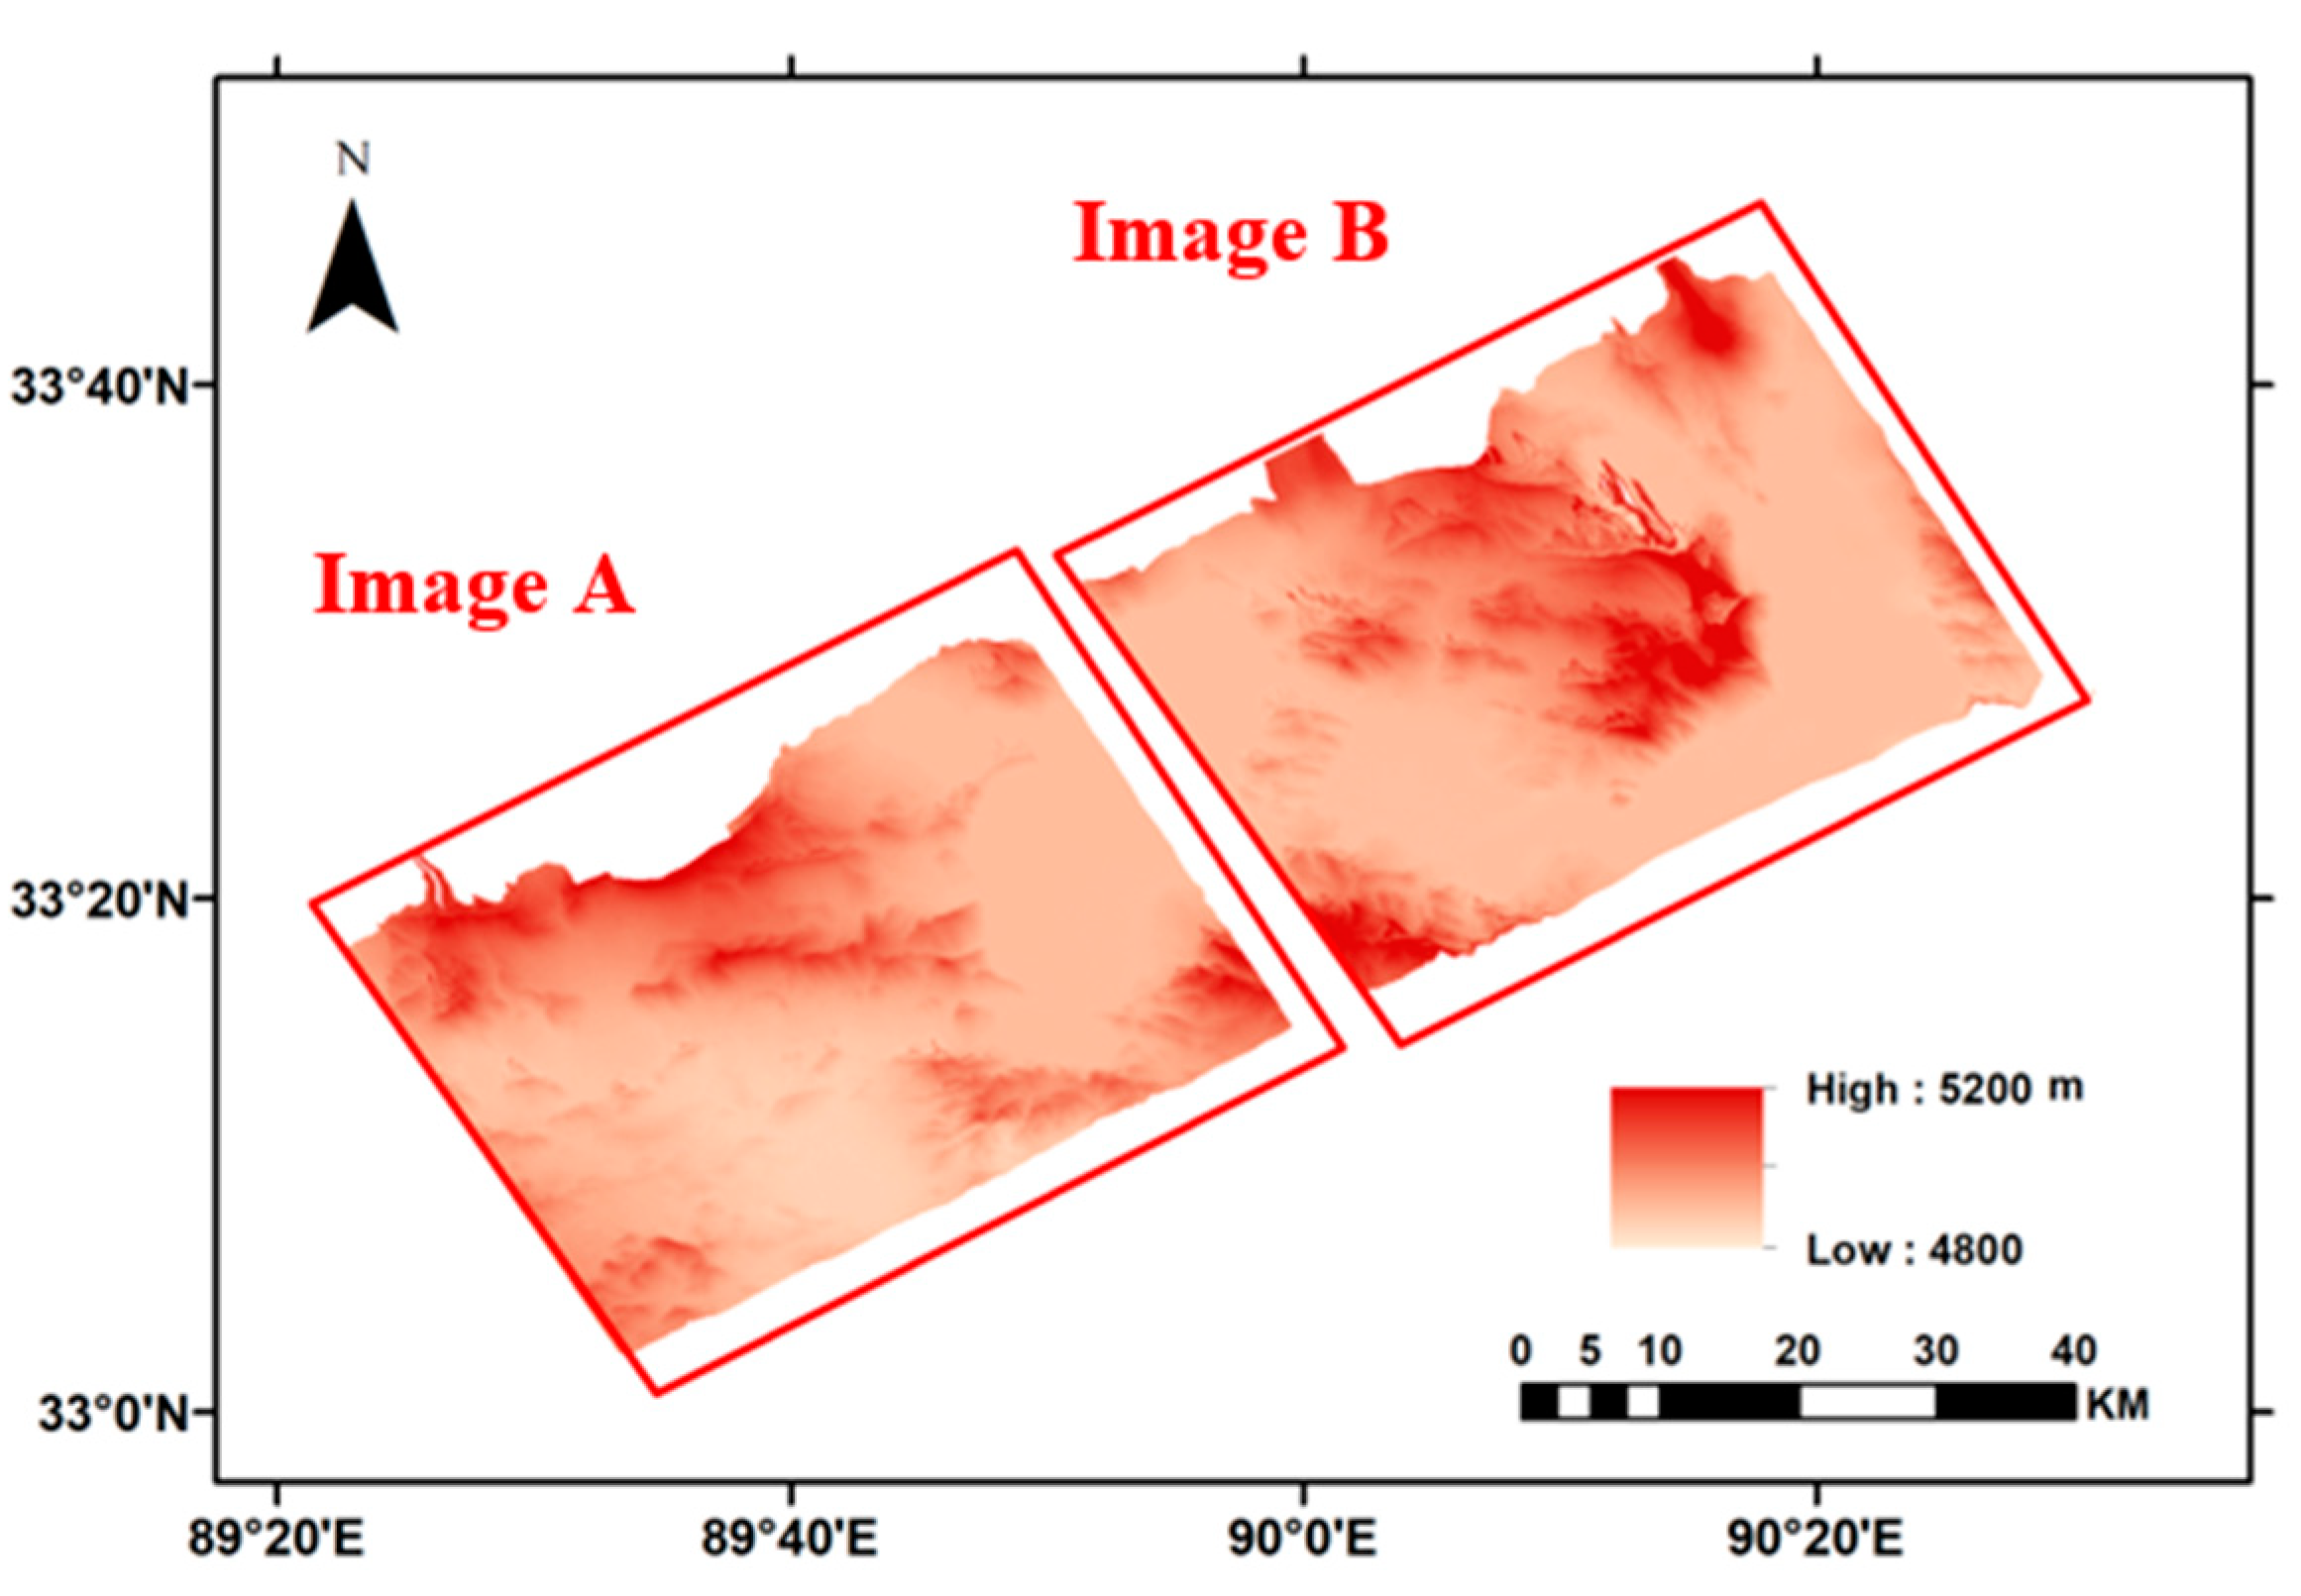
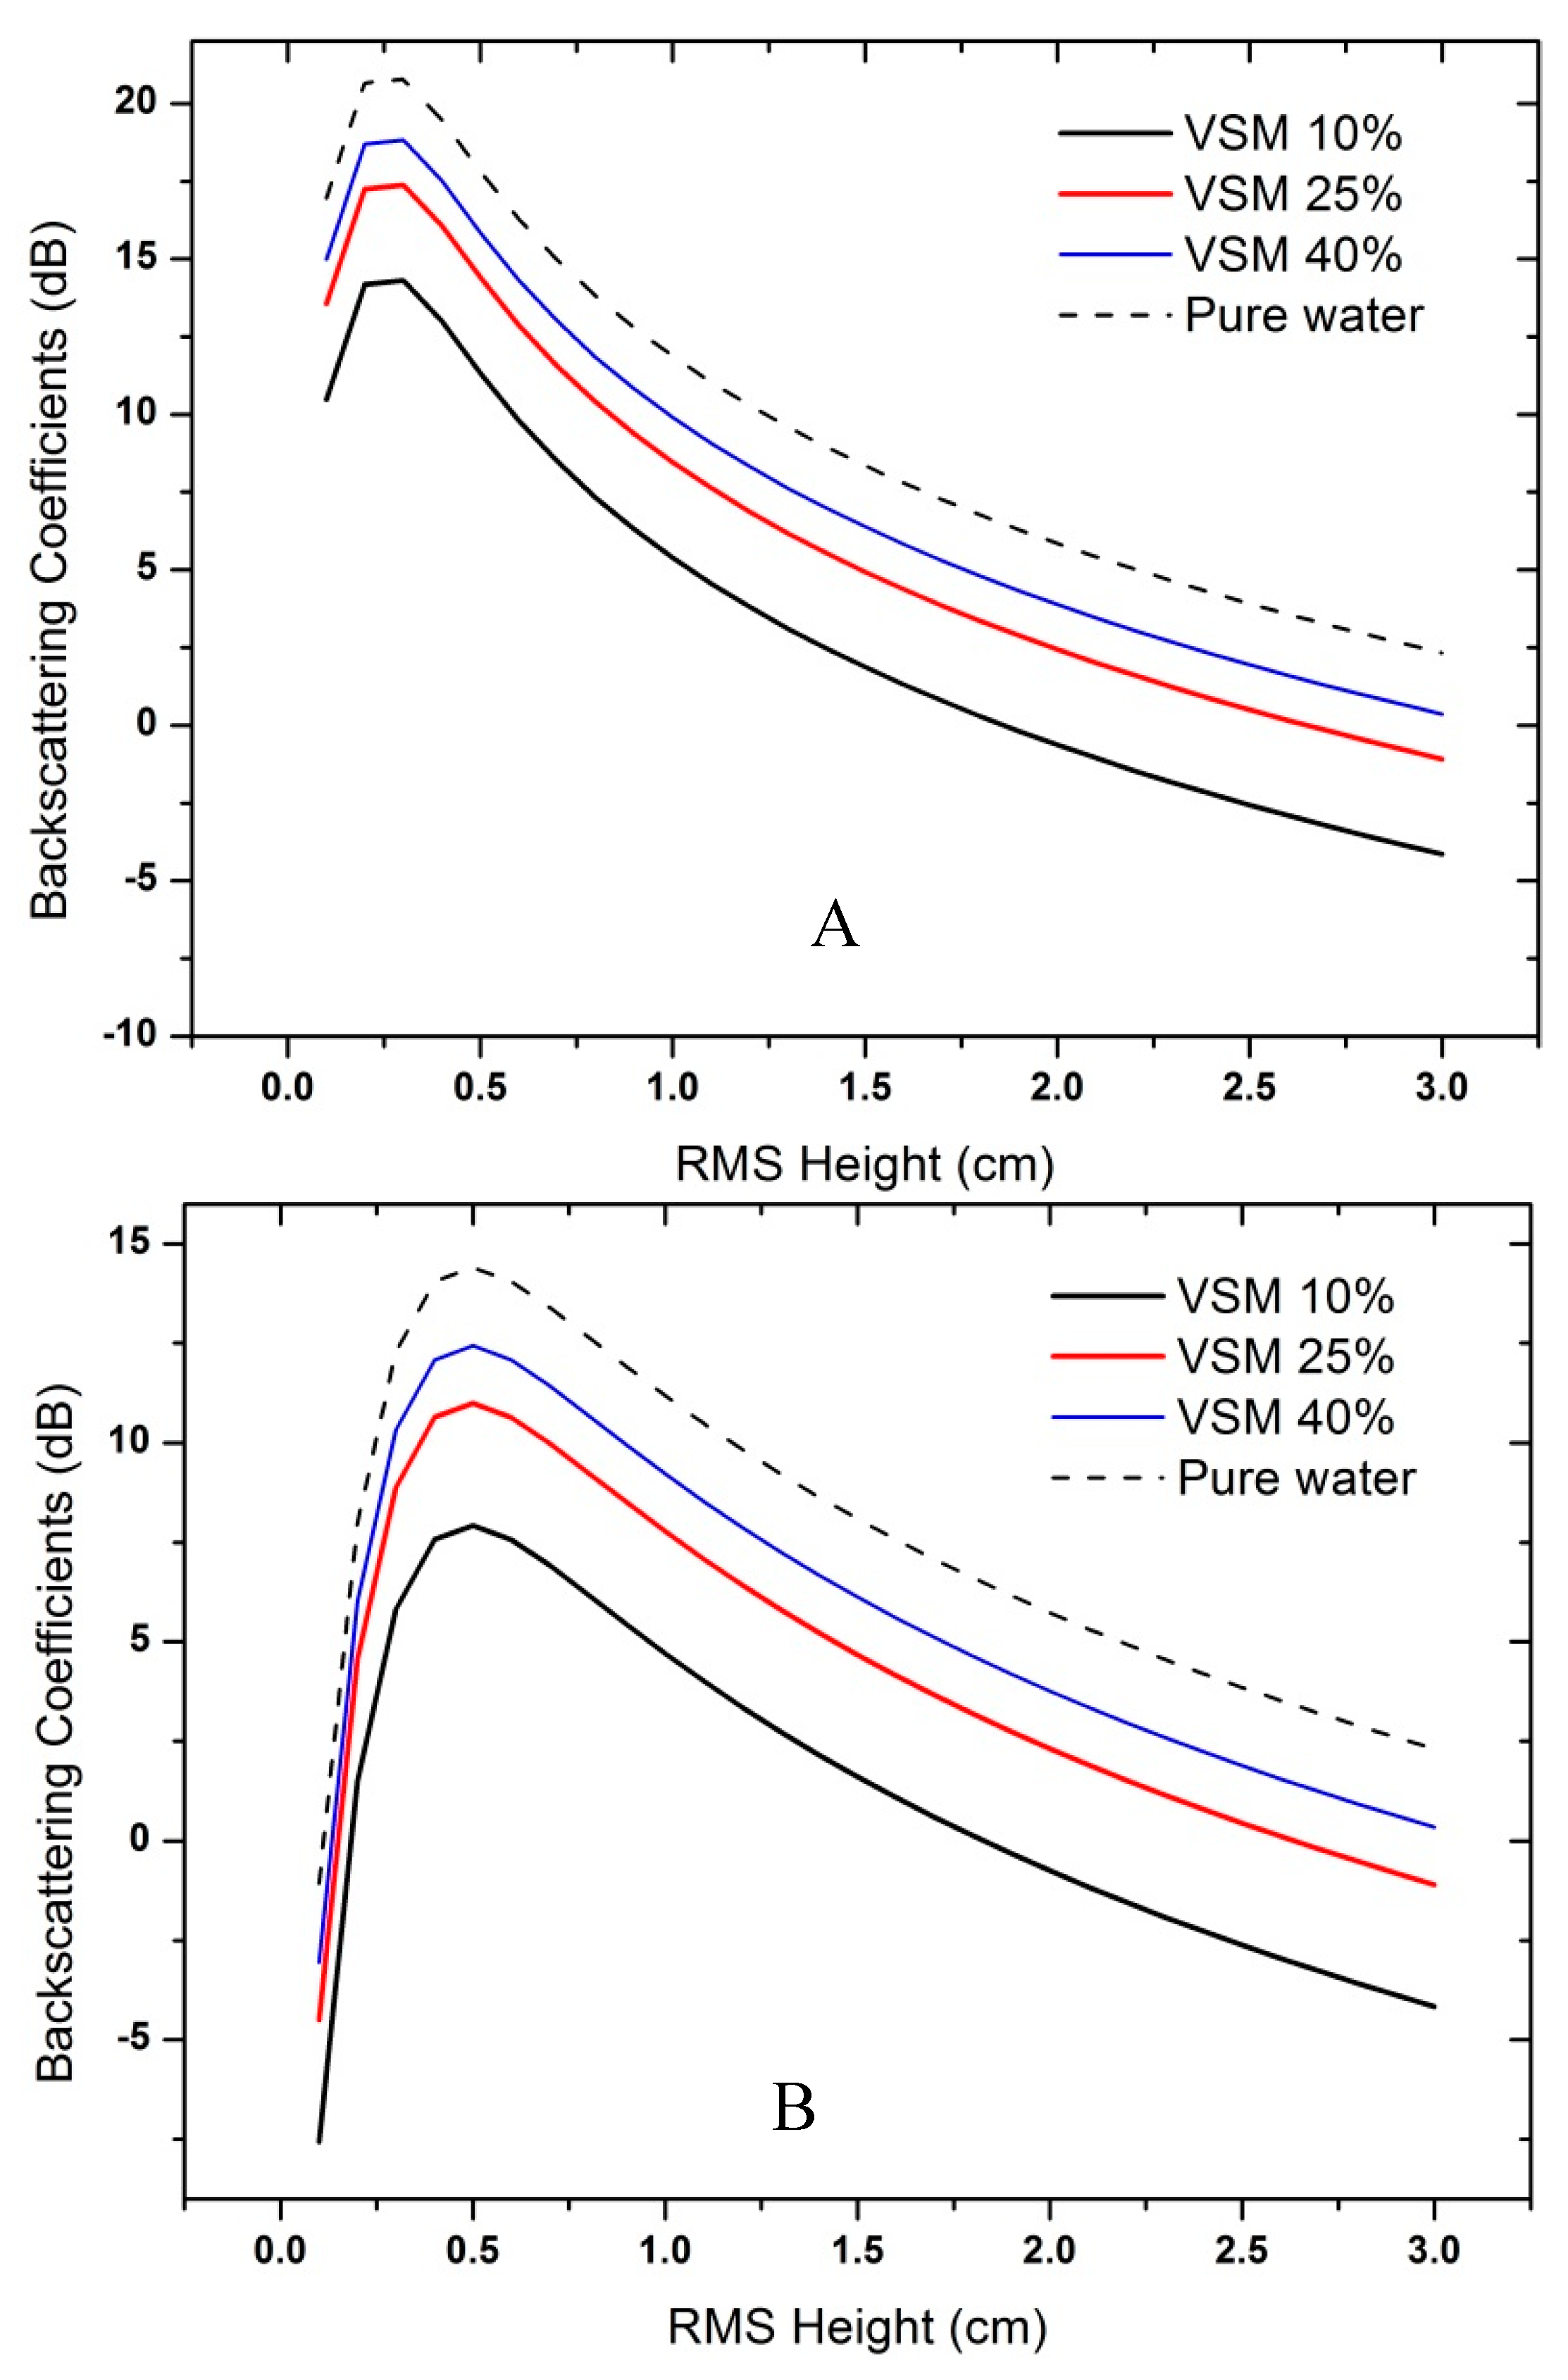
2.3. Theoretical Simulations

Similar to the conventional SAR applications, the near-nadir SAR studies requires the understanding of the interactions between microwave and land surface features through theoretical models, field experiments, or both. Radar backscattering can be simulated through numerical simulations based on rigid electromagnetic theories or their simplified forms. The Integral Equation Method (IEM) developed in the literature [30,31,32] has a relatively simple algebraic form with physically justified assumptions while retains high accuracy under a wide range of surface roughness and dielectric conditions. The IEM model bridges the validity gaps between the traditional small perturbation (SPM) and geometrical optics (GO) models [30,31], and has been successfully applied to microwave remote sensing including forward model simulations and inversion algorithm development [33,34,35,36].
For investigating the possibility of identifying water and land through InIRA observations, we simulated the InIRA signals under a set of soil and water conditions using IEM model. Typical input parameters used by IEM for describing surface roughness include root mean square (RMS) height, correlation length, and correlation function. The model inputs for this study are listed in Table 2. The dielectric properties of soil are calculated by the Dobson model [37]. Considering little vegetation presence in the study region, only bare soil conditions were simulated. The QTP lakes are brackish or saline with salinity ranging from <3‰ to hypersaline conditions [38]. For simulating the backscattering from saline lake surfaces, we assumed the salinity 35.0‰, which is the average salinity level of sea water. The dielectric properties of salty water are calculated by the Stogryn dielectric model [39].

2.4. SAR Water Detection Method

We developed a dynamic threshold algorithm for InIRA aiming at detecting water bodies from bare or sparsely vegetated soil of the focused region using limited pixels selected from WOD as prior knowledge. The first step is to select pixels representing permanent water within a InIRA image. The water pixels are randomly selected from the WOD data whose historical water occurrence is higher than 95%, meaning likely part of a permanent water body. Similarly, the same number of land pixels is determined using the WOD data if 0% water occurrence is documented. The backscattering coefficients of the selected land and water pixels are then obtained from the InIRA images and constitute a training data set. For this study, the training data set for each InIRA image contains about 120 water pixels and 120 land pixels. The portion of training pixels over the number of total retrievable pixels is very small (less than 0.1%) but provide important reference information of land and water scattering characteristics at different incidence angles and across the study regions since the training points were randomly selected and distributed over the image. As the second step, the terrain slope derived from Tian Gong 2 elevation products was calculated for each pixel and used for additional constraints to the water and land classifications. For a given pixel, its slope is determined by the rates of elevation changes in both X and Y directions of an InIRA image. To minimize possible impacts on the classifications caused by geometry distortions detected on the image edges and mountainous regions, we use TG-2 elevation product to mask out the pixels without valid elevation retrievals. The last step is to loop through each pixel and determine its land or water attribute. A pixel is assigned as water if its observed backscattering coefficient is closer to the value of nearest water pixel than that of the nearest land pixel pre-defined in the training data set, and its terrain slope is lower than 5°, indicating a relatively flat area.
The method was applied to the InIRA images and evaluated by the Fmask results derived from LandSat OLI observations. The classification results are assessed by the following metrics including overall accuracy, producer’s accuracy, and user’s accuracy. The overall accuracy is the ratio between the number of correctly classified pixels and the total number of pixels. The producer’s accuracy represents the proportion of reference land or water features being correctly classified. The user’s accuracy is referred to classification reliability and represents the proportion of classified water or land pixels being consistent with the reference pixels [40].

3. Results

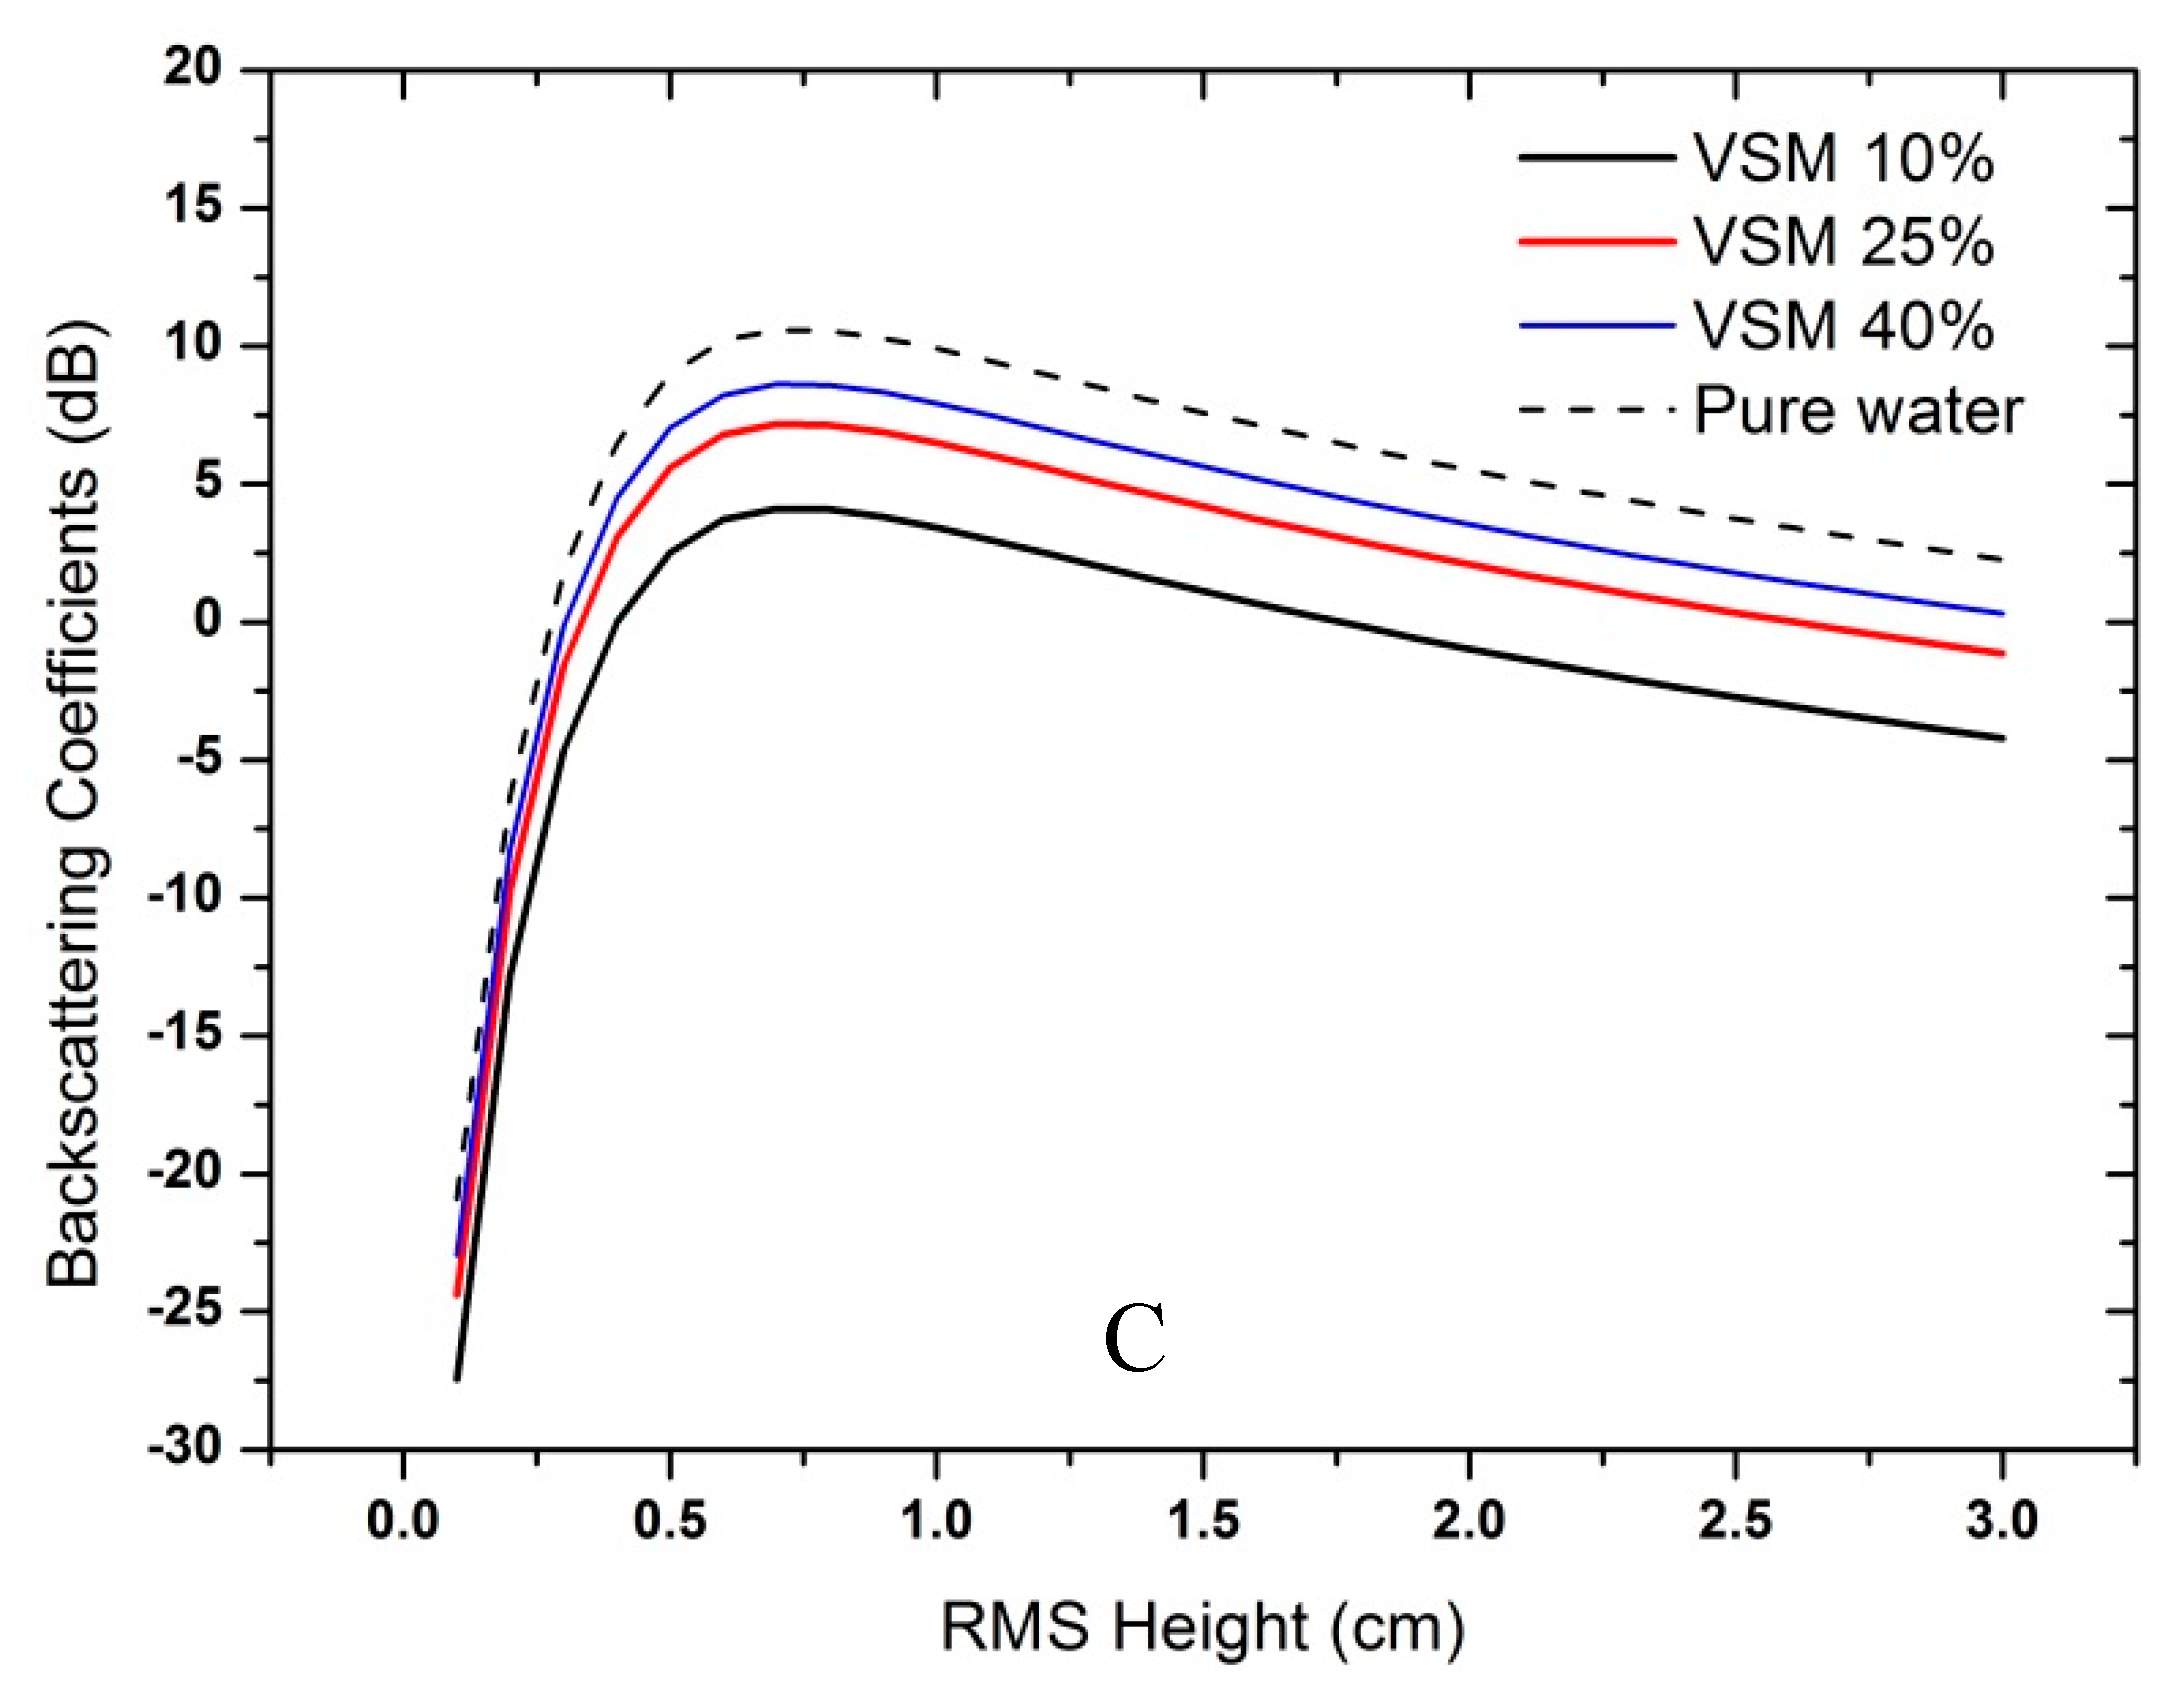
3.1. Theoretical Simulations

The simulation results (Figure 3) show the backscatter patterns of soil and water over different surface roughness parameters, dielectric properties, and incidence angles. The water backscattering under small incidence angle conditions is typically stronger than that of soil for a given surface roughness. This is caused by the higher dielectric value of water than those of soil at normal wetness levels (≤0.4 cm3/cm3). Comparing with the dielectric properties, the surface roughness is a more dominant factor that determines the backscatter magnitudes. For very smooth surface (e.g., still water), the backscatter signals from soil and water are generally low and similar to each other (e.g., Figure 3B when RMS height less than 0.25 cm) since most of the scattered signals are distributed in a narrow specular direction. For smooth surface (e.g., RMS height 0.5 cm) which can be seen in water bodies with wind-driven ripples and waves, and natural (e.g., large rocks) or artificial land features (e.g., airplane runway), the near-nadir backscatter is generally very strong due to increased diffuse scattering into the observed direction. The diffuse scattering tends to be more uniform in all directions as the surface roughness further increases (e.g., RMS height 3.0 cm), therefore the intensity of the received signals at near-nadir directions decrease. In summary, the surface roughness difference between normally smooth water surface and relatively rough soil surface is the key to distinguish the two features in InIRA images. For evaluating the impacts of incidence angles, the simulations were conducted for 2, 5, and 8°, which cover the incidence angle range of InIRA. As illustrated by Figure 3A–C, the pattern of backscattering coefficients changing with surface roughness is significantly affected by the sensor viewing geometry. The backscatter peaks earlier as the RMS height increases but then drops faster for smaller incidence angles. For larger incidence angles, the magnitudes of backscattering coefficients from soil and water surfaces with RMS height smaller than 0.5 cm (Figure 3C) appear to be similarly small.
The above simulations suggest: (a) water and surrounding soil can be generally separated through their differences in backscatter intensity except for the very calm/rough water or very smooth soil. Prior knowledge of the land feature information may help avoid the misclassifications of smooth water and land; (b) the backscatter intensity of water and soil varies with their roughness and dielectric values; and (c) the incidence angle increases from InIRA near-range to far-range, and different incidence angles significantly affects the radar backscatter observations. Therefore, for the applications over a large region with a variety of land surface and incidence angle conditions, a dynamic threshold classification method is needed.

3.2. Land and Water Classifications

The dynamic threshold algorithm was applied to InIRA images (Figure 1) for the regions with valid TG-2 elevation data (Figure 2). The mean threshold values are 9.8 dB and 7.1 dB for Images A and B, respectively. The classified lake water result (Figure 4) was compared to the LandSat/OLI water classifications by Fmask method (Figure 5). The detailed error matrices were listed in Table 3 and Table 4 for the respective Images A and B. The Fmask is proved accurate in detecting land features; however, its water and land classifications are also affected by the presence of cloud and its shadow. The comparisons with Fmask result were only made when land and water classifications are available. As such, the total pixel number of Image B (Table 4) is smaller than that of Image A (Table 3) due to a larger portion of cloud coverage over the Image B area in the LandSat/OLI observations.
The accuracy metrics were calculated from the error matrices. For both images, most water and land pixels as shown in the reference LandSat/OLI results are correctly detected by InIRA with the overall classification accuracy 96.13% for image A and 90.09% for Image B. For land pixels in Image A, the producer’s accuracy is 96.71% and user’s accuracy 98.41%; for water pixels, the producer’s accuracy is 93.85% and user’s accuracy 87.88%. For land pixels in Image B, the producer’s accuracy is 94.34% and user’s accuracy is 89.47%; for water pixels, the producer’s accuracy is 83.95% and user’s accuracy is 91.12%. Though the overall accuracy is higher than 90%, the producer’s accuracy for water classifications using Image B decreases for about 10% as compared with that of Image A, suggesting increased misclassifications of the referenced LandSat/OLI water pixels. In Image B, the major water areas not detected by InIRA were coincident in locations with the dark regions of InIRA backscattering coefficient image (Figure 1). As analyzed by theoretical simulations (Section 3.1), low backscatter from water surface is possibly caused by very smooth water surface when there is no/little wind.

4. Discussion

The future NASA SWOT mission is promising in estimating global water budget at high accuracy, fine spatial and favorable temporal resolutions. The near-nadir SAR imaging and interferometric measuring techniques adopted by SWOT represent a novel way to realize the goal of global water measurements. The experimental InIRA mounted on TG-2 space laboratory has provided unique Ku-band observations since 2016 and these data contain rich information that needs to be interpreted for understanding the advantages and drawbacks of near-nadir SAR imaging techniques for water cycle observations. For this study, we applied the images to the classifications of high mountain waters with the supports of theoretical simulations. Both the theoretical predictions and actual SAR images prove the potential of using SWOT-like instruments in fine-scale detection of water bodies. Compared with LandSat/OLI (Figure 5), the InIRA Ku-band observations (Figure 1) and classifications (Figure 4) are less affected by the atmospheric conditions and have similarly high classification accuracy.
The main issue of the near-nadir imaging technique in water body detection is its strong dependence on surface roughness. In extreme cases when the water body is perfectly still, low backscatter from water surface or dark-water observations can be confused with soil signals. Referenced data sets from other sensors or InIRA time-series observations may help mitigate the problem. Similar issue was independently confirmed by airborne observations from AirSWOT measurements, though the flat surface problem can be partially overcome by increasing the observation frequency (e.g., to the SWOT Ka-band) [21,24]. Considering limited near-nadir microwave observations from satellites, the studies on InIRA may help to mitigate the dark-water issue for future SWOT mission. We also noticed the geometric distortions in InIRA images which need to be corrected by improved data processing. Despite the above issues, the contrasting land and water backscattering behaviors were observed by the space-borne InIRA and utilized in high accurate water body mapping at 40-m resolution by the dynamic threshold method. The findings of this work help to improve the designing of instruments, data processing flow, and algorithm performance in the future studies.

5. Conclusions

The lakes in QTP are highly sensitive to global environment changes while are less studied due to harsh natural conditions. The expansion and shrinking of these high mountain lakes contain the useful information of the surrounding environment changes. This study represents the first lake mapping efforts using the novel space-borne near-nadir SAR imaging techniques. The resulting water maps show high consistency with the alternative LandSAT/OLI results while less affected by cloud coverage and weather conditions. The algorithm was also found not applicable to the lakes with very smooth surface and needs to be improved in the future studies by introducing ancillary data sets or time series information. Besides the direct applications of InIRA in high mountain studies, the accumulated observations from InIRA and its algorithms developed in this study also provide support for future missions and their global applications.

Author Contributions

S.L. designed the whole study and supervised the data analysis. H.T., Z.L., Z.Z., and Y.L. developed the algorithm, conducted the data analysis, and crafted the manuscript. W.Z. significantly edited the manuscript. K.L. and B.Q. revised the manuscript.

Funding

This research was funded by China Manned Space Engineering Program Tiangong-2 data Platform grant number [Y3140231WN] and National basic science data sharing service platform grant number [Y7031511WY].

Acknowledgments

The LandSat data are available from the U.S. Geological Survey.

Conflicts of Interest

The authors declare no conflict of interest. The funders had no role in the design of the study; in the collection, analyses, or interpretation of data; in the writing of the manuscript, and in the decision to publish the results.

References

  1. Bianduo; Bianbaciren; Li, L.; Wang, W.; Zhaxiyangzong. The response of lake change to climate fluctuation in north Qinghai-Tibet Plateau in last 30 years. J. Geogr. Sci. 2009, 19, 131–142. [Google Scholar] [CrossRef]
  2. Ma, R.; Duan, H.; Hu, C.; Feng, X.; Li, A.; Ju, W.; Jiang, J.; Yang, G. A half-century of changes in China’s lakes: Global warming or human influence? Geophys. Res. Lett. 2010, 37. [Google Scholar] [CrossRef]
  3. Van Huissteden, J.; Berrittella, C.; Parmentier, F.J.W.; Mi, Y.; Maximov, T.C.; Dolman, A.J. Methane emissions from permafrost thaw lakes limited by lake drainage. Nat. Clim. Chang. 2011, 1, 119–123. [Google Scholar] [CrossRef]
  4. Zhang, G.; Xie, H.; Kang, S.; Yi, D.; Ackley, S.F. Monitoring lake level changes on the Tibetan Plateau using ICESat altimetry data (2003–2009). Remote Sens. Environ. 2011, 115, 1733–1742. [Google Scholar] [CrossRef]
  5. Yao, T.; Thompson, L.; Yang, W.; Yu, W.; Gao, Y.; Guo, X.; Yang, X.; Duan, K.; Zhao, H.; Xu, B.; et al. Different glacier status with atmospheric circulations in Tibetan Plateau and surroundings. Nat. Clim. Chang. 2012, 2, 663–667. [Google Scholar] [CrossRef]
  6. Du, J.; Kimball, J.S.; Jones, L.A.; Watts, J.D. Implementation of satellite based fractional water cover indices in the pan-Arctic region using AMSR-E and MODIS. Remote Sens. Environ. 2016, 184, 469–481. [Google Scholar] [CrossRef]
  7. Cheng, G.; Wu, T. Responses of permafrost to climate change and their environmental significance, Qinghai-Tibet Plateau. J. Geophys. Res. Earth Surf. 2007, 112, F02S03. [Google Scholar] [CrossRef]
  8. Yang, K.; Wu, H.; Qin, J.; Lin, C.; Tang, W.; Chen, Y. Recent climate changes over the Tibetan Plateau and their impacts on energy and water cycle: A review. Glob. Planet. Chang. 2014, 112, 79–91. [Google Scholar] [CrossRef]
  9. Liu, Q.; Du, J.; Shi, J.; Jiang, L. Analysis of spatial distribution and multi-year trend of the remotely sensed soil moisture on the Tibetan Plateau. Sci. China Earth Sci. 2013, 56, 2173–2185. [Google Scholar] [CrossRef]
  10. Jiang, Q.; Fang, H.; Zhang, J. Dynamic changes of lakes and the geo-mechanism in Tibet based on RS and GIS technology. In Remote Sensing of the Environment: 16th National Symposium on Remote Sensing of China; Tong, Q., Ed.; International Society for Optics and Photonics: Bellingham, WA, USA, 2008; Volume 7123, p. 71230S. [Google Scholar]
  11. Carroll, M.L.; Townshend, J.R.; DiMiceli, C.M.; Noojipady, P.; Sohlberg, R.A. A new global raster water mask at 250 m resolution. Int. J. Digit. Earth 2009, 2, 291–308. [Google Scholar] [CrossRef] [Green Version]
  12. Zhang, G.; Yao, T.; Xie, H.; Zhang, K.; Zhu, F. Lakes’ state and abundance across the Tibetan Plateau. Chin. Sci. Bull. 2014, 59, 3010–3021. [Google Scholar] [CrossRef]
  13. Wan, W.; Xiao, P.; Feng, X.; Li, H.; Ma, R.; Duan, H.; Zhao, L. Monitoring lake changes of Qinghai-Tibetan Plateau over the past 30 years using satellite remote sensing data. Chin. Sci. Bull. 2014, 59, 1021–1035. [Google Scholar] [CrossRef]
  14. Chen, J.; Chen, J.; Liao, A.; Cao, X.; Chen, L.; Chen, X.; He, C.; Han, G.; Peng, S.; Lu, M.; et al. Global land cover mapping at 30 m resolution: A POK-based operational approach. ISPRS J. Photogramm. Remote Sens. 2015, 103, 7–27. [Google Scholar] [CrossRef]
  15. Pekel, J.F.; Cottam, A.; Gorelick, N.; Belward, A.S. High-resolution mapping of global surface water and its long-term changes. Nature 2016, 540, 418–422. [Google Scholar] [CrossRef] [PubMed]
  16. Ma, R.; Yang, G.; Duan, H.; Jiang, J.; Wang, S.; Feng, X.; Li, A.; Kong, F.; Xue, B.; Wu, J.; et al. China’s lakes at present: Number, area and spatial distribution. Sci. China Earth Sci. 2011, 54, 283–289. [Google Scholar] [CrossRef]
  17. Joshi, N.; Baumann, M.; Ehammer, A.; Fensholt, R.; Grogan, K.; Hostert, P.; Jepsen, M.R.; Kuemmerle, T.; Meyfroidt, P.; Mitchard, E.T.; et al. A review of the application of optical and radar remote sensing data fusion to land use mapping and monitoring. Remote Sens. 2016, 8, 70. [Google Scholar] [CrossRef]
  18. Prigent, C.; Papa, F.; Aires, F.; Rossow, W.B.; Matthews, E. Global inundation dynamics inferred from multiple satellite observations, 1993–2000. J. Geophys. Res. Atmos. 2007, 112, D12107. [Google Scholar] [CrossRef]
  19. Schroeder, R.; McDonald, K.C.; Chapman, B.D.; Jensen, K.; Podest, E.; Tessler, Z.D.; Bohn, T.J.; Zimmermann, R. Development and evaluation of a multi-year fractional surface water data set derived from active/passive microwave remote sensing data. Remote Sens. 2015, 7, 16688–16732. [Google Scholar] [CrossRef]
  20. Du, J.; Kimball, J.S.; Galantowicz, J.; Kim, S.B.; Chan, S.K.; Reichle, R.; Jones, L.A.; Watts, J.D. Assessing global surface water inundation dynamics using combined satellite information from SMAP, AMSR2 and Landsat. Remote Sens. Environ. 2018, 213, 1–17. [Google Scholar] [CrossRef] [PubMed]
  21. Solander, K.C.; Reager, J.T.; Famiglietti, J.S. How well will the Surface Water and Ocean Topography (SWOT) mission observe global reservoirs? Water Resour. Res. 2016, 52, 2123–2140. [Google Scholar] [CrossRef] [Green Version]
  22. Fu, L.L.; Alsdorf, D.; Rodriguez, E.; Morrow, R.; Mognard, N.; Lambin, J.; Vaze, P.; Lafon, T. The SWOT (Surface Water and Ocean Topography) Mission: Spaceborne radar interferometry for oceanographic and hydrological applications. In Proceedings of the OCEANOBS’09 Conference, Venice, Italy, 21–25 September 2009. [Google Scholar]
  23. Durand, M.; Fu, L.L.; Lettenmaier, D.P.; Alsdorf, D.E.; Rodriguez, E.; Esteban-Fernandez, D. The surface water and ocean topography mission: Observing terrestrial surface water and oceanic submesoscale eddies. Proc. IEEE 2010, 98, 766–779. [Google Scholar] [CrossRef]
  24. Fjortoft, R.; Gaudin, J.M.; Pourthie, N.; Lalaurie, J.C.; Mallet, A.; Nouvel, J.F.; Martinot-Lagarde, J.; Oriot, H.; Borderies, P.; Ruiz, C.; et al. KaRIn on SWOT: Characteristics of near-nadir Ka-band interferometric SAR imagery. IEEE Trans. Geosci. Remote Sens. 2014, 52, 2172–2185. [Google Scholar] [CrossRef]
  25. Gao, Q.; Li, Y.; Wan, Y.; Qin, X.; Jiangcun, W.; Liu, Y. Dynamics of alpine grassland NPP and its response to climate change in Northern Tibet. Clim. Chang. 2009, 97, 515. [Google Scholar] [CrossRef]
  26. Song, C.; Sheng, Y. Contrasting evolution patterns between glacier-fed and non-glacier-fed lakes in the Tanggula Mountains and climate cause analysis. Clim. Chang. 2016, 135, 493–507. [Google Scholar] [CrossRef]
  27. Mao, D.; Wang, Z.; Yang, H.; Li, H.; Thompson, J.R.; Li, L.; Song, K.; Chen, B.; Gao, H.; Wu, J. Impacts of climate change on Tibetan lakes: Patterns and processes. Remote Sens. 2018, 10, 358. [Google Scholar] [CrossRef]
  28. Zhu, Z.; Wang, S.; Woodcock, C.E. Improvement and expansion of the Fmask algorithm: Cloud, cloud shadow, and snow detection for Landsats 4–7, 8, and Sentinel 2 images. Remote Sens. Environ. 2015, 159, 269–277. [Google Scholar] [CrossRef]
  29. Qiu, S.; He, B.; Zhu, Z.; Liao, Z.; Quan, X. Improving Fmask cloud and cloud shadow detection in mountainous area for Landsats 4–8 images. Remote Sens. Environ. 2017, 199, 107–119. [Google Scholar] [CrossRef]
  30. Wu, T.D.; Chen, K.S. A reappraisal of the validity of the IEM model for backscattering from rough surfaces. IEEE Trans. Geosci. Remote Sens. 2004, 42, 743–753. [Google Scholar]
  31. Fung, A.K.; Chen, K.S. An update on the IEM surface backscattering model. IEEE Geosci. Remote Sens. Lett. 2004, 1, 75–77. [Google Scholar] [CrossRef]
  32. Chen, K.S.; Wu, T.D.; Tsay, M.K.; Fung, A.K. Note on the multiple scattering in an IEM model. IEEE Trans. Geosci. Remote Sens. 2000, 38, 249–256. [Google Scholar] [CrossRef]
  33. Bindlish, R.; Barros, A.P. Multifrequency soil moisture inversion from SAR measurements with the use of IEM. Remote Sens. Environ. 2000, 71, 67–88. [Google Scholar] [CrossRef]
  34. Jiang, L.; Shi, J.; Tjuatja, S.; Dozier, J.; Chen, K.; Zhang, L. A parameterized multiple-scattering model for microwave emission from dry snow. Remote Sens. Environ. 2007, 111, 357–366. [Google Scholar] [CrossRef]
  35. Du, J.; Shi, J.; Sun, R. The development of HJ SAR soil moisture retrieval algorithm. Int. J. Remote Sens. 2010, 31, 3691–3705. [Google Scholar] [CrossRef]
  36. Baghdadi, N.; Gherboudj, I.; Zribi, M.; Sahebi, M.; King, C.; Bonn, F. Semi-empirical calibration of the IEM backscattering model using radar images and moisture and roughness field measurements. Int. J. Remote Sens. 2004, 25, 3593–3623. [Google Scholar] [CrossRef]
  37. Dobson, M.C.; Ulaby, F.T.; Hallikainen, M.T.; El-Rayes, M.A. Microwave dielectric behavior of wet soil—Part II: Dielectric mixing models. IEEE Trans. Geosci. Remote Sens. 1985, 1, 35–46. [Google Scholar] [CrossRef]
  38. Kropáček, J.; Maussion, F.; Chen, F.; Hoerz, S.; Hochschild, V. Analysis of ice phenology of lakes on the Tibetan Plateau from MODIS data. Cryosphere 2013, 7, 287–301. [Google Scholar] [CrossRef] [Green Version]
  39. Stogryn, A. Equations for calculating the dielectric constant of saline water (correspondence). IEEE Trans. Microw. Theory Tech. 1971, 19, 733–736. [Google Scholar] [CrossRef]
  40. Congalton, R.G.; Green, K. Assessing the Accuracy of Remotely Sensed Data: Principles and Practices; CRC Press: Boca Raton, FL, USA, 2008. [Google Scholar]
Figure 1. The InIRA observations over Nagqu area of Qinghai–Tibet Plateau (QTP).
Remotesensing 10 01418 g001
Figure 2. The elevation of the study region estimated by InIRA.
Remotesensing 10 01418 g002
Figure 3. Radar backscattering coefficients changes with surface roughness for incidence angle (A) 2°; (B) 5° and (C) 8°. VSM, volumetric soil moisture.
Remotesensing 10 01418 g003aRemotesensing 10 01418 g003b
Figure 4. Lake water detected by Tian Gong 2 InIRA images acquired on 23 September 2016 using a dynamic threshold algorithm (blue: water; white: land or no retrievals).
Remotesensing 10 01418 g004
Figure 5. Lake water detected using Landsat OLI image acquired on 9 September 2016 (blue: water; grey: cloud; white: land or no retrievals).
Remotesensing 10 01418 g005
Table 1. Parameters of Tian Gong 2 Interferometric Imaging Radar Altimeter.
AltitudeFrequencyIncidence AnglesSpatial Resolution
400 km13.58 GHz2.5–7.5° 40 m/200 m
Swath WidthLook DirectionBaseline lengthCover area
35 kmRight2.3 m ±42 degrees of latitudes
Table 2. Input parameters of theoretical model.
Frequency Incidence AnglesRMS Height Correlation LengthSoil MoistureCorrelation Function
13.58 GHz2, 5, and 8°0.125–3 cm interval 0.125 cm 10 cm10–40% interval 15% (cm3/cm3)Exponential function
Table 3. Error matrix for the classification results of Image A.
OLI LandOLI WaterTotal
InIRA Land728,79511,780740,575
InIRA Water24,822179,899204,721
Total753,617191,679945,296
Table 4. Error matrix for the classification results of Image B.
OLI LandOLI WaterTotal
InIRA Land439,09751,689490,786
InIRA Water26,354270,300296,654
Total465,451321,989787,440

