Article

Estimation of Rice Height and Biomass Using Multitemporal SAR Sentinel-1 for Camargue, Southern France

by
Emile Ndikumana
1,
Dinh Ho Tong Minh
1,*,
Hai Thu Dang Nguyen
1,2,
Nicolas Baghdadi
1,
Dominique Courault
3,
Laure Hossard
4 and
Ibrahim El Moussawi
1
1
UMR TETIS, IRSTEA, University of Montpellier, 34093 Montpellier, France
2
Department of Space and Aeronautics, University of Science and technology of Hanoi, Vietnam Academy of Science and Technology, 122100 Hanoi, Vietnam
3
UMR 1114 EMMAH, INRA, University of Avignon, 84914 Avignon, France
4
UMR 0951 INNOVATION, INRA, University of Montpellier, 34060 Montpellier, France
*
Author to whom correspondence should be addressed.
Remote Sens. 2018, 10(9), 1394; https://doi.org/10.3390/rs10091394
Submission received: 12 July 2018 / Revised: 16 August 2018 / Accepted: 29 August 2018 / Published: 1 September 2018

Abstract

:
The research and improvement of methods to be used for crop monitoring are currently major challenges, especially for radar images due to their speckle noise nature. The European Space Agency’s (ESA) Sentinel-1 constellation provides synthetic aperture radar (SAR) images coverage with a 6-day revisit period at a high spatial resolution of pixel spacing of 20 m. Sentinel-1 data are considerably useful, as they provide valuable information of the vegetation cover. The objective of this work is to study the capabilities of multitemporal radar images for rice height and dry biomass retrievals using Sentinel-1 data. To do this, we train Sentinel-1 data against ground measurements with classical machine learning techniques (Multiple Linear Regression (MLR), Support Vector Regression (SVR) and Random Forest (RF)) to estimate rice height and dry biomass. The study is carried out on a multitemporal Sentinel-1 dataset acquired from May 2017 to September 2017 over the Camargue region, southern France. The ground in-situ measurements were made in the same period to collect rice height and dry biomass over 11 rice fields. The images were processed in order to produce a radar stack in C-band including dual-polarization VV (Vertical receive and Vertical transmit) and VH (Vertical receive and Horizontal transmit) data. We found that non-parametric methods (SVR and RF) had a better performance over the parametric MLR method for rice biophysical parameter retrievals. The accuracy of rice height estimation showed that rice height retrieval was strongly correlated to the in-situ rice height from dual-polarization, in which Random Forest yielded the best performance with correlation coefficient R 2 = 0.92 and the root mean square error (RMSE) 16% (7.9 cm). In addition, we demonstrated that the correlation of Sentinel-1 signal to the biomass was also very high in VH polarization with R 2 = 0.9 and RMSE = 18% (162 g·m 2 ) (with Random Forest method). Such results indicate that the highly qualified Sentinel-1 radar data could be well exploited for rice biomass and height retrieval and they could be used for operational tasks.

Graphical Abstract

1. Introduction

Rice is one of the most important cereal grains and serves as a staple food resource for more than half of the world’s population. For this reason, rice consumption increases dramatically together with population raising, and the demand for rice is predicted to be strong [1,2]. International Food Policy Research Institute analyses show that the demand for rice is increasing by about 1.8% per year. It will be difficult to increase rice production to satisfy this demand because land and water resources become more scarce with increasing competition from fast-growing non-farming sectors [3]. Especially, rice crop is a heat and water-loving crop [4], then, sometimes the rice badly suffers from cold stress during the seedling stage when it is grown in winter environment [5]. Therefore, monitoring the global productivity of rice is one of the adequate solutions to meet the demand for rice.
Rice parameters (height, dry biomass, leaf area index, salinity, etc.) are primarily monitored through two approaches, including field measurements by farmers and model retrievals from remote sensing data. While the filed measurement is time-consuming, remote sensing is able to perform rice parameters measurement on a large scale without directly contacting the crop [6]. Spatial remote sensing provides the opportunity to have information on a regional scale with high spatial and temporal resolution. Data acquired from satellites provides a great tool for tracking temporal changes in soil and crop conditions, mapping their characteristics over large areas. There are two kinds of remote sensing techniques: one uses optical sensors and the other uses synthetic aperture radar data (SAR) sensors. In addition, the fusion of optical and SAR data can be exploited as well [7,8]. Optical sensors (e.g., UAV, multispectral, and hyperspectral data) are suited for monitoring agricultural areas [9,10,11]. For example, the joint analysis of time series of vegetation and water indices derived from these sensors, such as Normalized Difference Vegetation Index (NDVI), Enhanced Vegetation Index (EVI), and Normalized Difference Water Index (NDWI), can be used to estimate rice parameters [9,12]. However, a large cloud coverage can limit the use of optical sensors [13].
Unlike passive optical sensors, SAR systems are capable of producing high-quality images of the earth even in cloud cover conditions. Most rice fields are always found in cloudy cover conditions, and SAR sensors can work in these conditions, so it is more effective for monitoring rice fields than optical sensors [14]. Furthermore, for agriculture, SAR data can provide information on activities such as plowing, field preparation, planting, and the state of growth of the crops from germination to maturity stages. Recent studies have shown the high potentialities of using such data for crop monitoring [15,16]. Thus, the application of SAR data in agriculture is becoming more popular. In previous studies, many investigations have been carried out on monitoring of rice growing. Various of them are based on rice parameters estimation [17,18,19], the others are focused on the used water within the rice fields [20], and some of them are on soil penology and organic matters [21]. Besides several SAR data which were used to map and monitor rice such as RADARSAT-1/2 [22], ENVISAT ASAR [23], ERS-1/2 [24], Sentinel-1 data is one of them. The Sentinel-1 mission is based on a constellation of two satellites (A and B). Sentinel-1 as a C-band SAR imaging satellite constellation ensures the continuity of ERS and ENVISAT missions [25,26]. Sentinel-1 data are systematically acquired in terrain observation with progressive scan (TOPS) mode with a 6-day revisit period (We note that outside the European zones, it drops to 12 days.). Dense time series of open access Sentinel-1 data at high spatial resolution (20 m) offers new opportunities for monitoring agriculture [27]. In addition, Torres et al., [26] reported that C-band SAR data were particularly well suited for monitoring and mapping rice because of their abilities to acquire information on rice growing areas with frequent cloud cover and a remarkable increase in backscattering coefficients throughout the rice growth cycle. Ferrazzoli et al., [28] also showed that the sensitivity of C-band sensors to plant biomass depends on the type of crop.
In Camargue, the rice crop plays a crucial role for the hydrological balance [29]. This region is one of the main rice producers and suppliers in France [30]. Therefore, understanding and analyzing rice growth of Camargue is significant for agriculture in France. The aim of the paper is to analyze the capability of SAR Sentinel-1 data to assess the rice parameters in Camargue. Rice crop height is an important agronomic feature linked to plant type and yield potential. The rice plant height estimation, particularly, is considered a simple method for determining rice growth because this parameter greatly influences the yield potential. Rice biomass is regarded as an important indicator of ecological and management processes in the vegetation.
In the literature of remote sensing, various machine learning algorithms are available for regression [31,32,33,34]. In practice, the algorithms are selected based on the trade-off between the performances in terms of estimation of a given biophysical parameter, computation time and interpretability of the results [35]. Most of remote sensing works are based on classical algorithms, such as Multiple Linear Regression (MLR), Support Vector Regression (SVR) and Random Forest (RF) [36,37]. Although they have been introduced since the early 2000s, they still compete with other approaches in many applications. In this paper, classical machine learning methods (Multiple Linear Regression, Support Vector Regression and Random Forest) are applied in order to estimate rice height and dry biomass in the Camargue region.
This paper includes six sections. In Section 2, characteristics of the study site, weather, cultivation of Camargue area and the information of ground truth measurement are described. Section 3 presents the principle of three methods used to estimate rice parameters (Multiple Linear Regression, Support Vector Regression and Random Forest). The results are shown in Section 4. The discussions are presented in Section 5 and finally, the Section 6 involves the main conclusions of this paper.

2. Study Area

2.1. Camargue Study Site

Camargue is located in southern France; centered coordination is approximately at 43 32 N latitude and 4 30 E longitude. Among 110,000 ha of total area, 54,000 ha are used for agriculture and the rest is protected for nature conservation [30]. Placed between two branches of the Rhône and the Mediterranean Sea, Camargue region is a low-land containing alluvial deposits of the Rhone and the Mediterranean Sea. That is mainly characterized by the absence of important relief in which we distinguish two areas [38]. Starting from the north to south of Camargue, there are plots behind the Rhône river and from the south along the sea, there are much saltwater regions.
Agriculture is the main economic sector of the Camargue region although the semi-arid Mediterranean climate is disadvantageous for rice cultivation because Mediterranean climate is rainy in winter and dry in summer, then it is not easy for planting paddy rice in summer. Temperature and precipitation are important factors that affect directly crops cultivation, especially rice crops. The annual average temperature of this region is about 7 C (January) to 26 C (July). Besides that, precipitation also varies greatly during a year with less than 10 mm in July and 160 mm in September (due to short periods of heavy rain). Based on those features, in Camargue, there is one rice crop activity per year from May to September when the temperature and precipitation are the highest. Flooded rice cultivation allows the water needed for soil desalination and to introduce other crops such as wheat, sunflower, and fodder to be rotated. In the Camargue region, the rice crop has an important impact on the ecological, economic, and social equilibrium [29,39].

2.2. Rice Phenomena

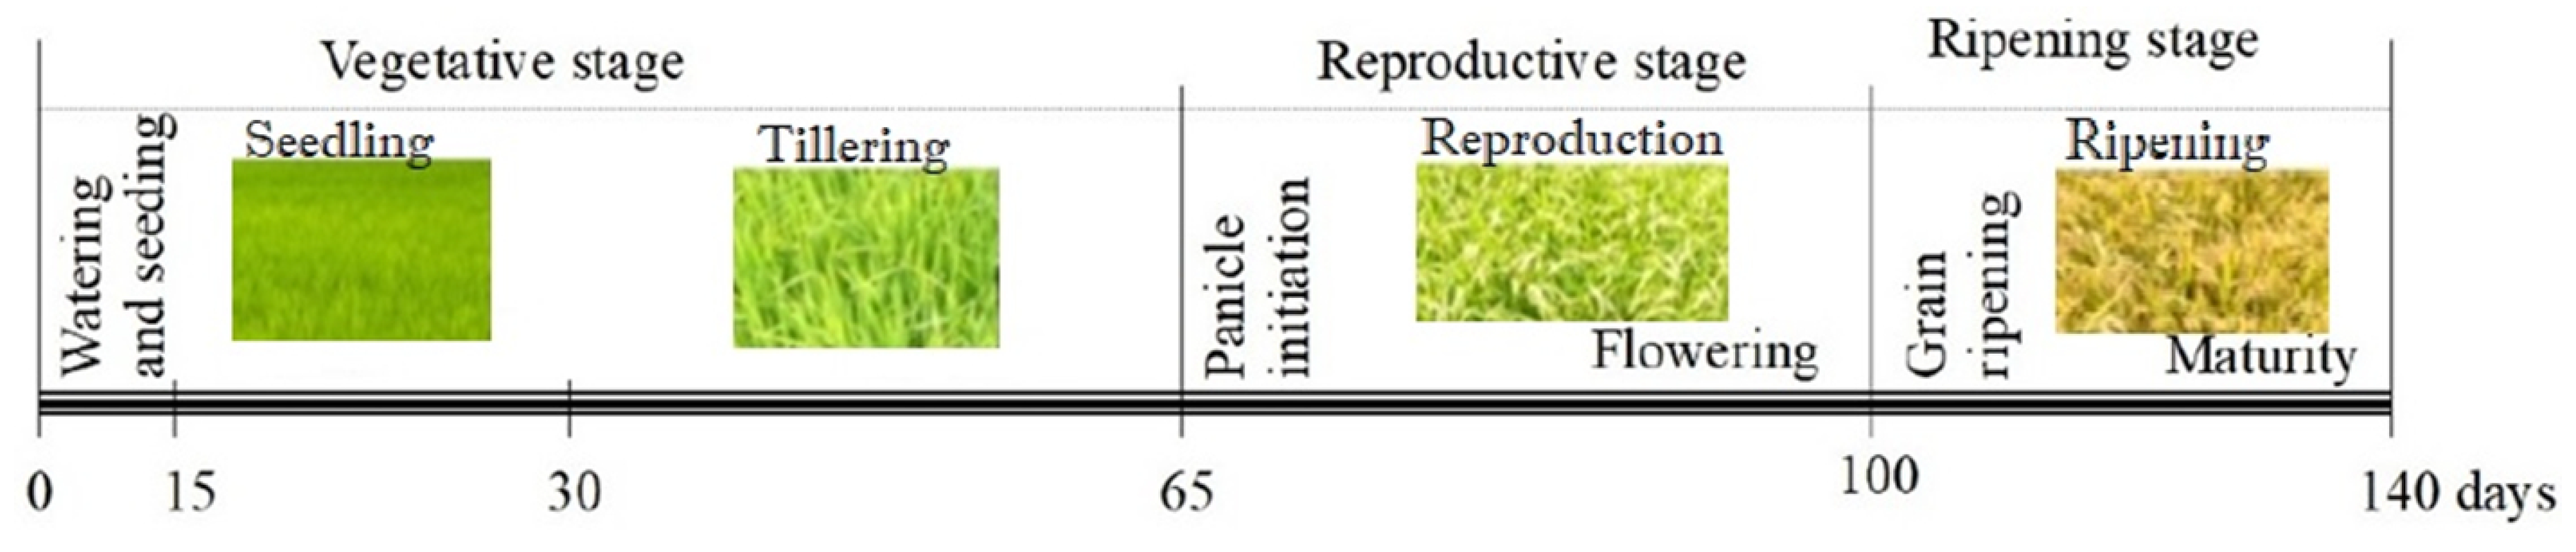
The temporal observation of rice growth is important for understanding the radar responses of rice plots at different stages of growth. Camargue has a single cropping season of rice; the agricultural calendar is shown in Table 1.
The rice crop in Camargue is an intensive type irrigated with direct seeding. Temperature and light are key factors in crop growth:
  • For levee, a minimum temperature of 12 C;
  • For flowering, a minimum temperature of 20 C.
There are three major periods of rice cultivation: the sowing period (starting according to the weather conditions from the end of April to middle May), the growth period (up to September) and the harvest period (end of September to the beginning of October).
In Camargue, the sowing date is from 24 April to 16 May, followed by a germination stage from May to June. At the germination stage, water is not evacuated. If the surface is bumpy, two risks are present: (1) either the water height is too high and the seedling dies; (2) the land is bare and the seedling germinates badly. Constant monitoring of water levels, which have a significant role as thermal regulators, should be carried out. Continuous water movement compensates the variations of air temperature. A high water depth protects the seedling in case of cooling. However, it is necessary to rapidly lower the level as soon as the ambient conditions become again favorable.
The growing period begins from the successful germination to the flowering/maturation stage. Figure 1 shows clearly the development of rice plants in Camargue.
Three essential factors play a role in the success of seedling emergence: water temperature, with an average above 15 C with the nocturnal minimum around 10 C; the constancy of the insulation; the fight against parasites: larvae or algae. After the emergence, the rice plot is dried up to 10 or 12 times. Drying can last a day or sometimes half a day. Temporary drying inhibits the development of parasites and activates the rice rooting. Between 25 July and 25 August comes the flowering period. The height of crops does not increase much at this stage. Flowering period requires a warm climate, without wind, without rain. After flowering comes the ripening period where the farmers begin to evaluate their future harvest at the end of August. The harvest stage occurs from the end of September to the beginning of October, all ripening rice crops are reaped. At the end of the harvest, two options are possible. For the first option, rice farmers normally have a long period enough to prepare their rice plots. In irrigated rice farming, as is the case in the Camargue, special attention is paid to leveling, using a laser-guided blade. The use of this equipment aims to obtain perfectly flat plots, in order to manage water precisely. This method is also used after harvest period between seasons for maintenance of irrigation canals (“waterways”). In Spring, once the last surface preparation is carried out to obtain a suitable seedbed, ditches are dug in the plots to facilitate their filling and emptying during cultivation, and then watering is done; we have a continuous cultural cycle. For the second option, farmers work very quickly to sown as early as autumn, usually with wheat which is the second crop in rice farms in Camargue.

2.3. Ground Data Measurement

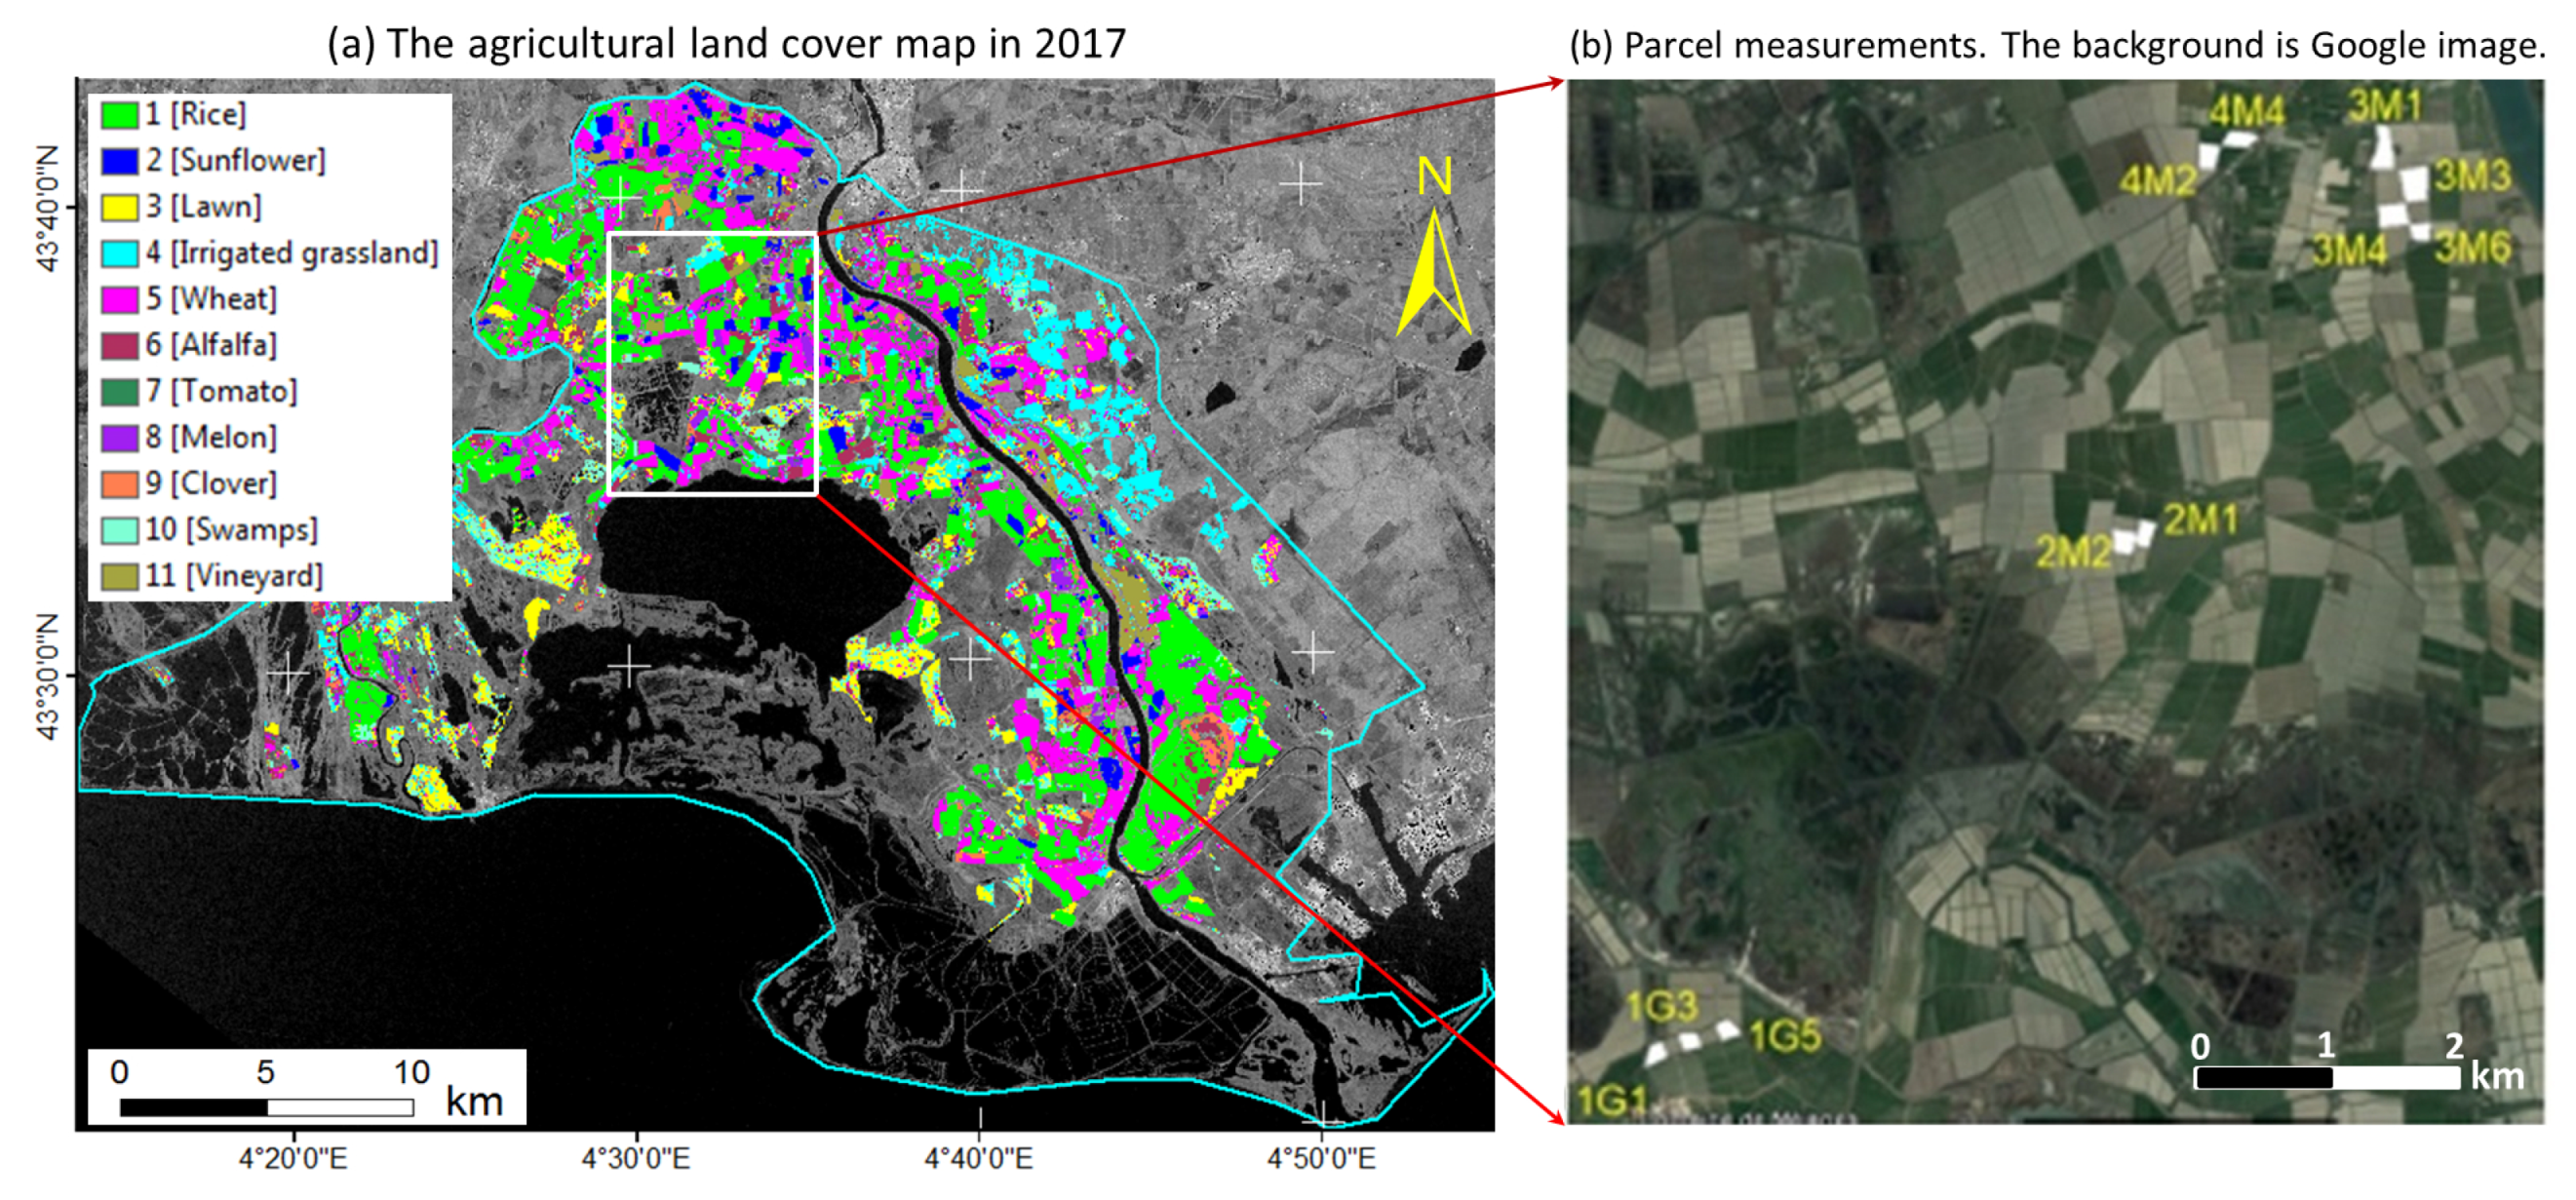
Ground truth measurements of rice parameters (rice height and rice biomass) were collected in eleven reference plots (Figure 2) which were about 2 to 6 hectares. A plot survey was carried out from May 2017 to September 2017 on the 11 rice reference plots selected to cover the variability encountered in both soils and agricultural practices. The reference plots were chosen in such a way that they could be represented the paddy rice fields in Camargue and they should not be adjacent parcels. The ground surveys were conducted based on the Sentinel-1 data acquisitions to measure rice height and biomass through the full growth rice cycle. In that respect, the following measurements were made every 12 days: 2 locations per plot for biomass assessment (1 m 2 for each location), 30 points per plot for crop height measurements. Figure 2 shows the position of ground surveys. The rice height has been taken on all the 11 plots. In contrast, rice biomass had been only taken on 1G1, 1G3, 2M1, 2M2, 3M1. The number of plots used to cut the biomass is reduced to five; we could not cut the biomass on all the plots otherwise it would be a waste and it would have had an impact on the production. The biomass was dried to have the dry biomass that is used in our analyses.
In addition, information such as the label, surface (in hectare), the sowing date, rice variety and harvest date are known for each plot and represented in Table 2.
Regarding the parameters displayed in 
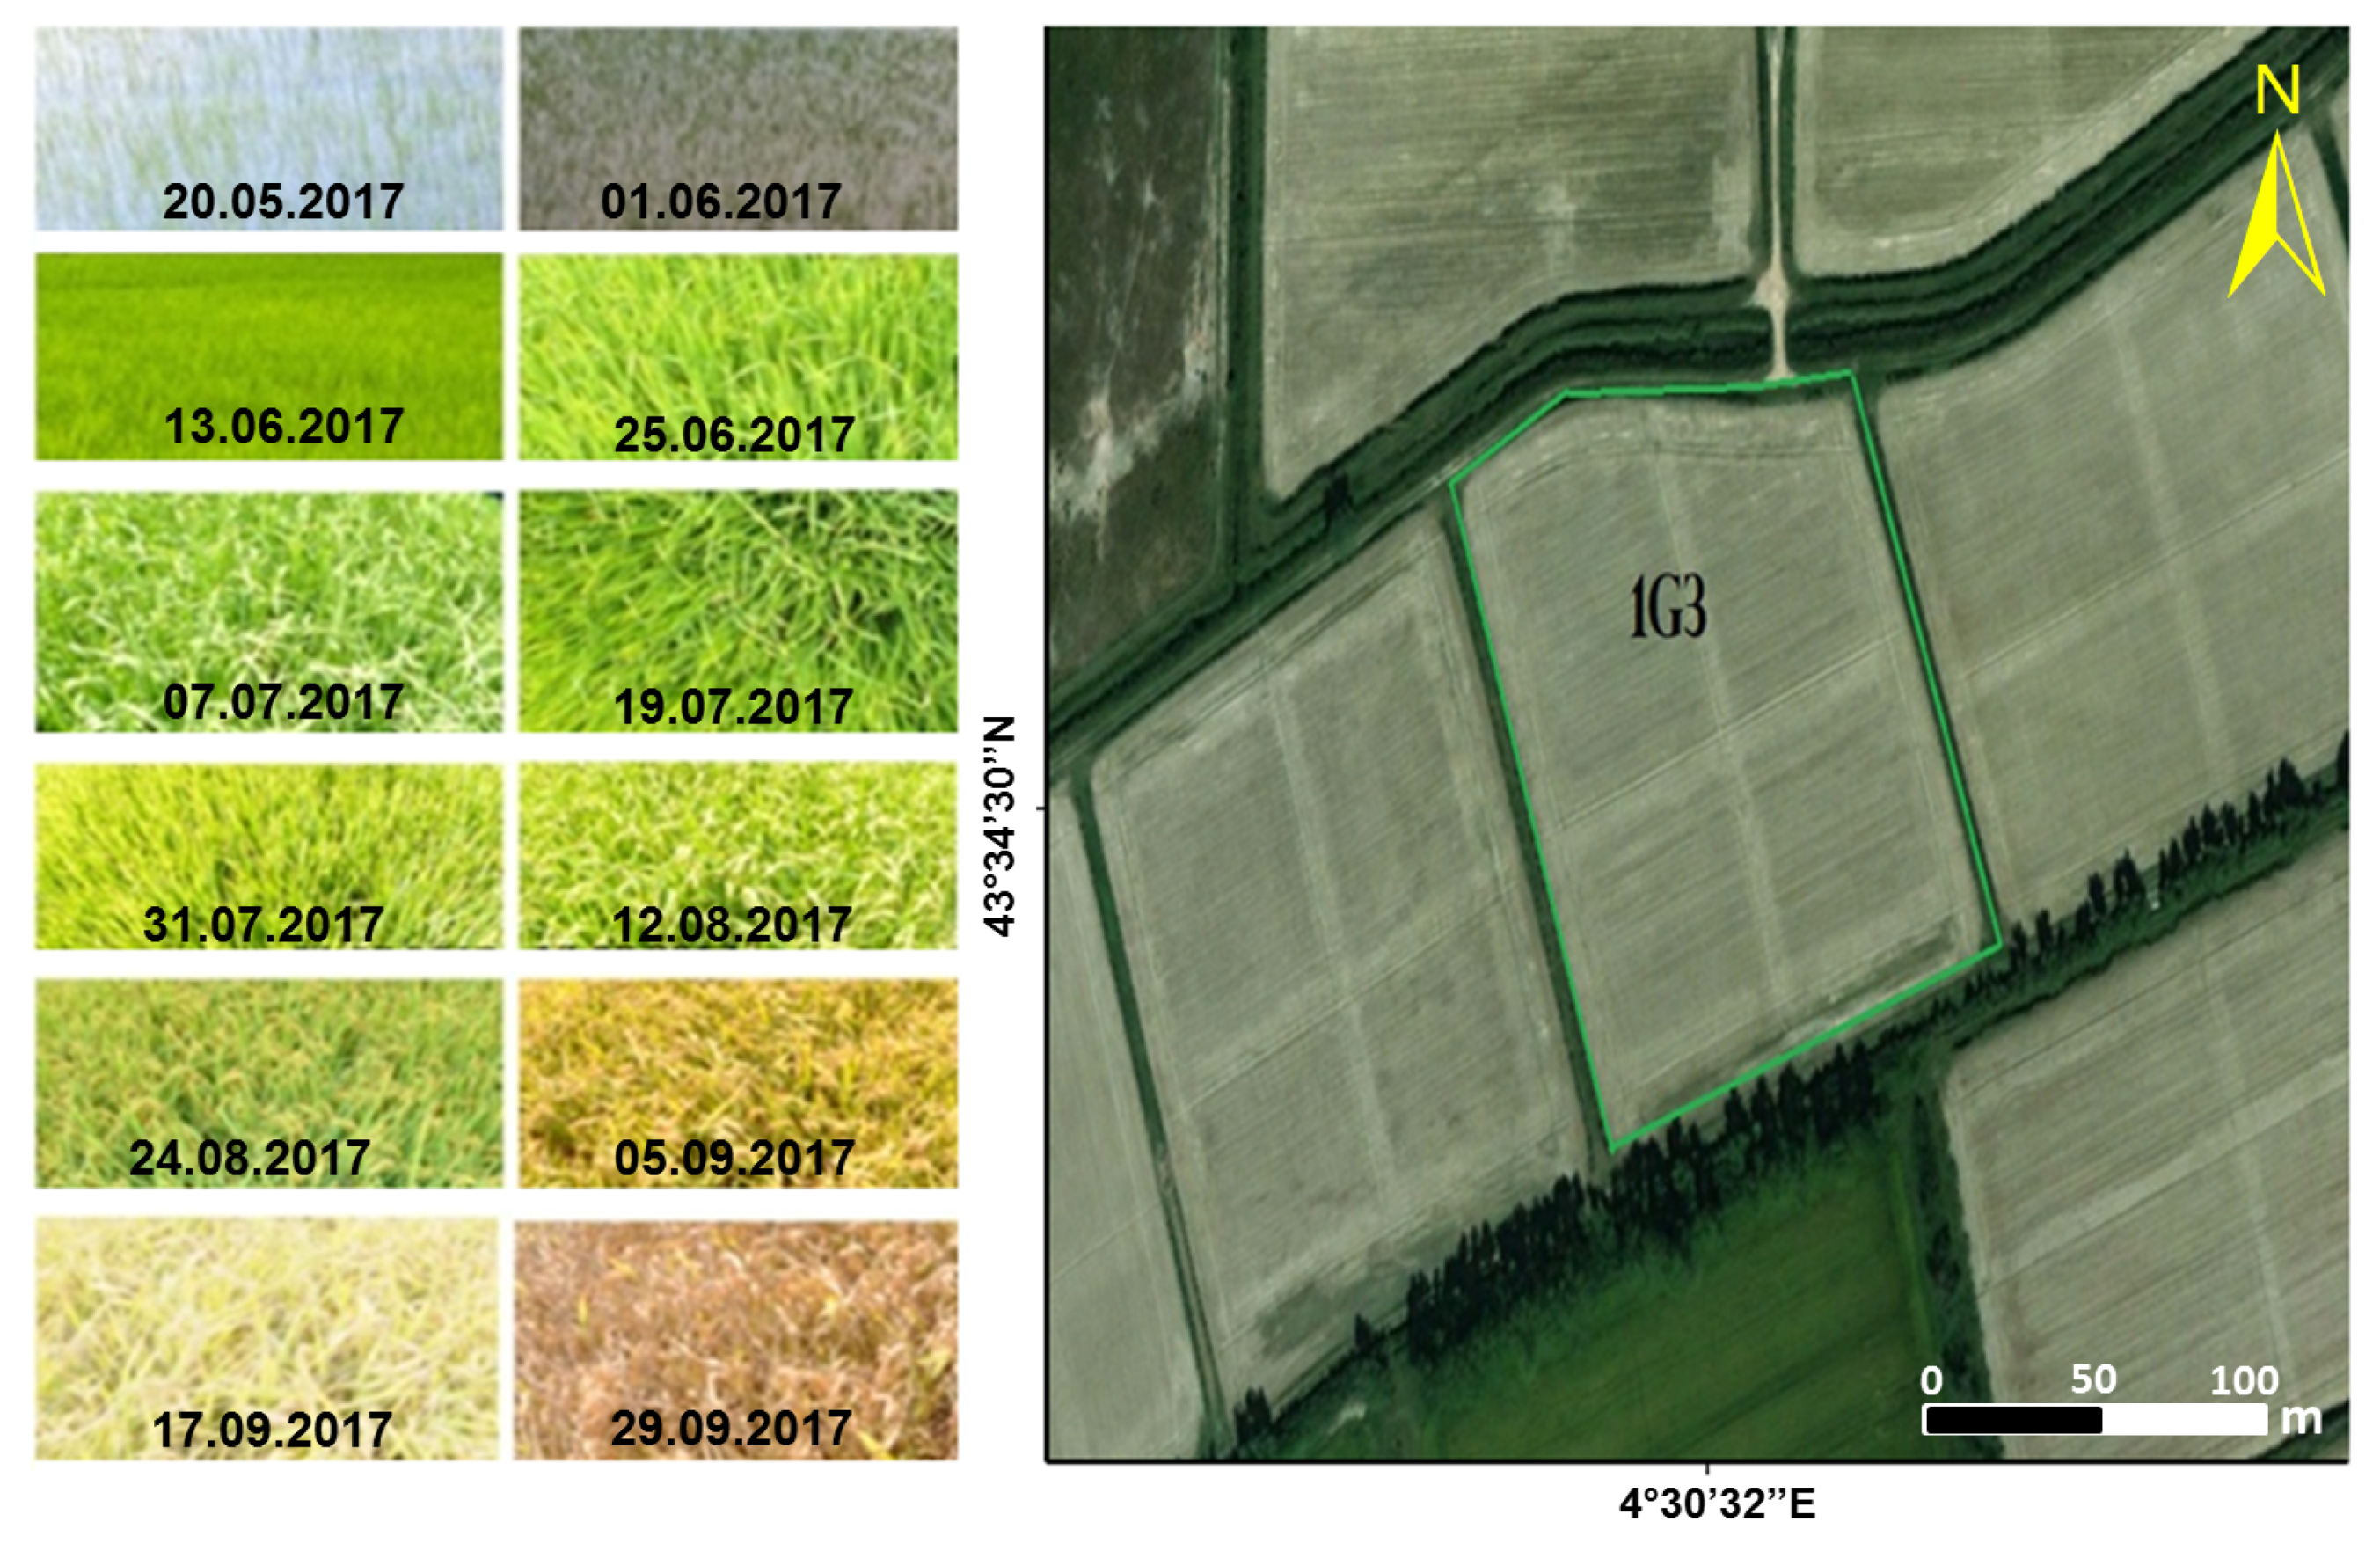
Table 2, the sowing date is not the same for all plots and the harvest date also is not at the same time. The variability observed is due to the local conditions at the time of sowing and also is due to the rice variety. The harvest period takes place between 29 September (DoY 272) and 14 October (DoY 287). After harvesting, the rice in Camargue is dried and preserved in the geographical area at a humidity level allowing its (good) conservation in silos whose temperature conditions are controlled. The ground measurements of rice height and rice biomass were collected at the same time with SAR Sentinel-1 images acquisition over reference plots. The Figure 3 shows one of eleven plots with its pictures that were taken during the ground survey.
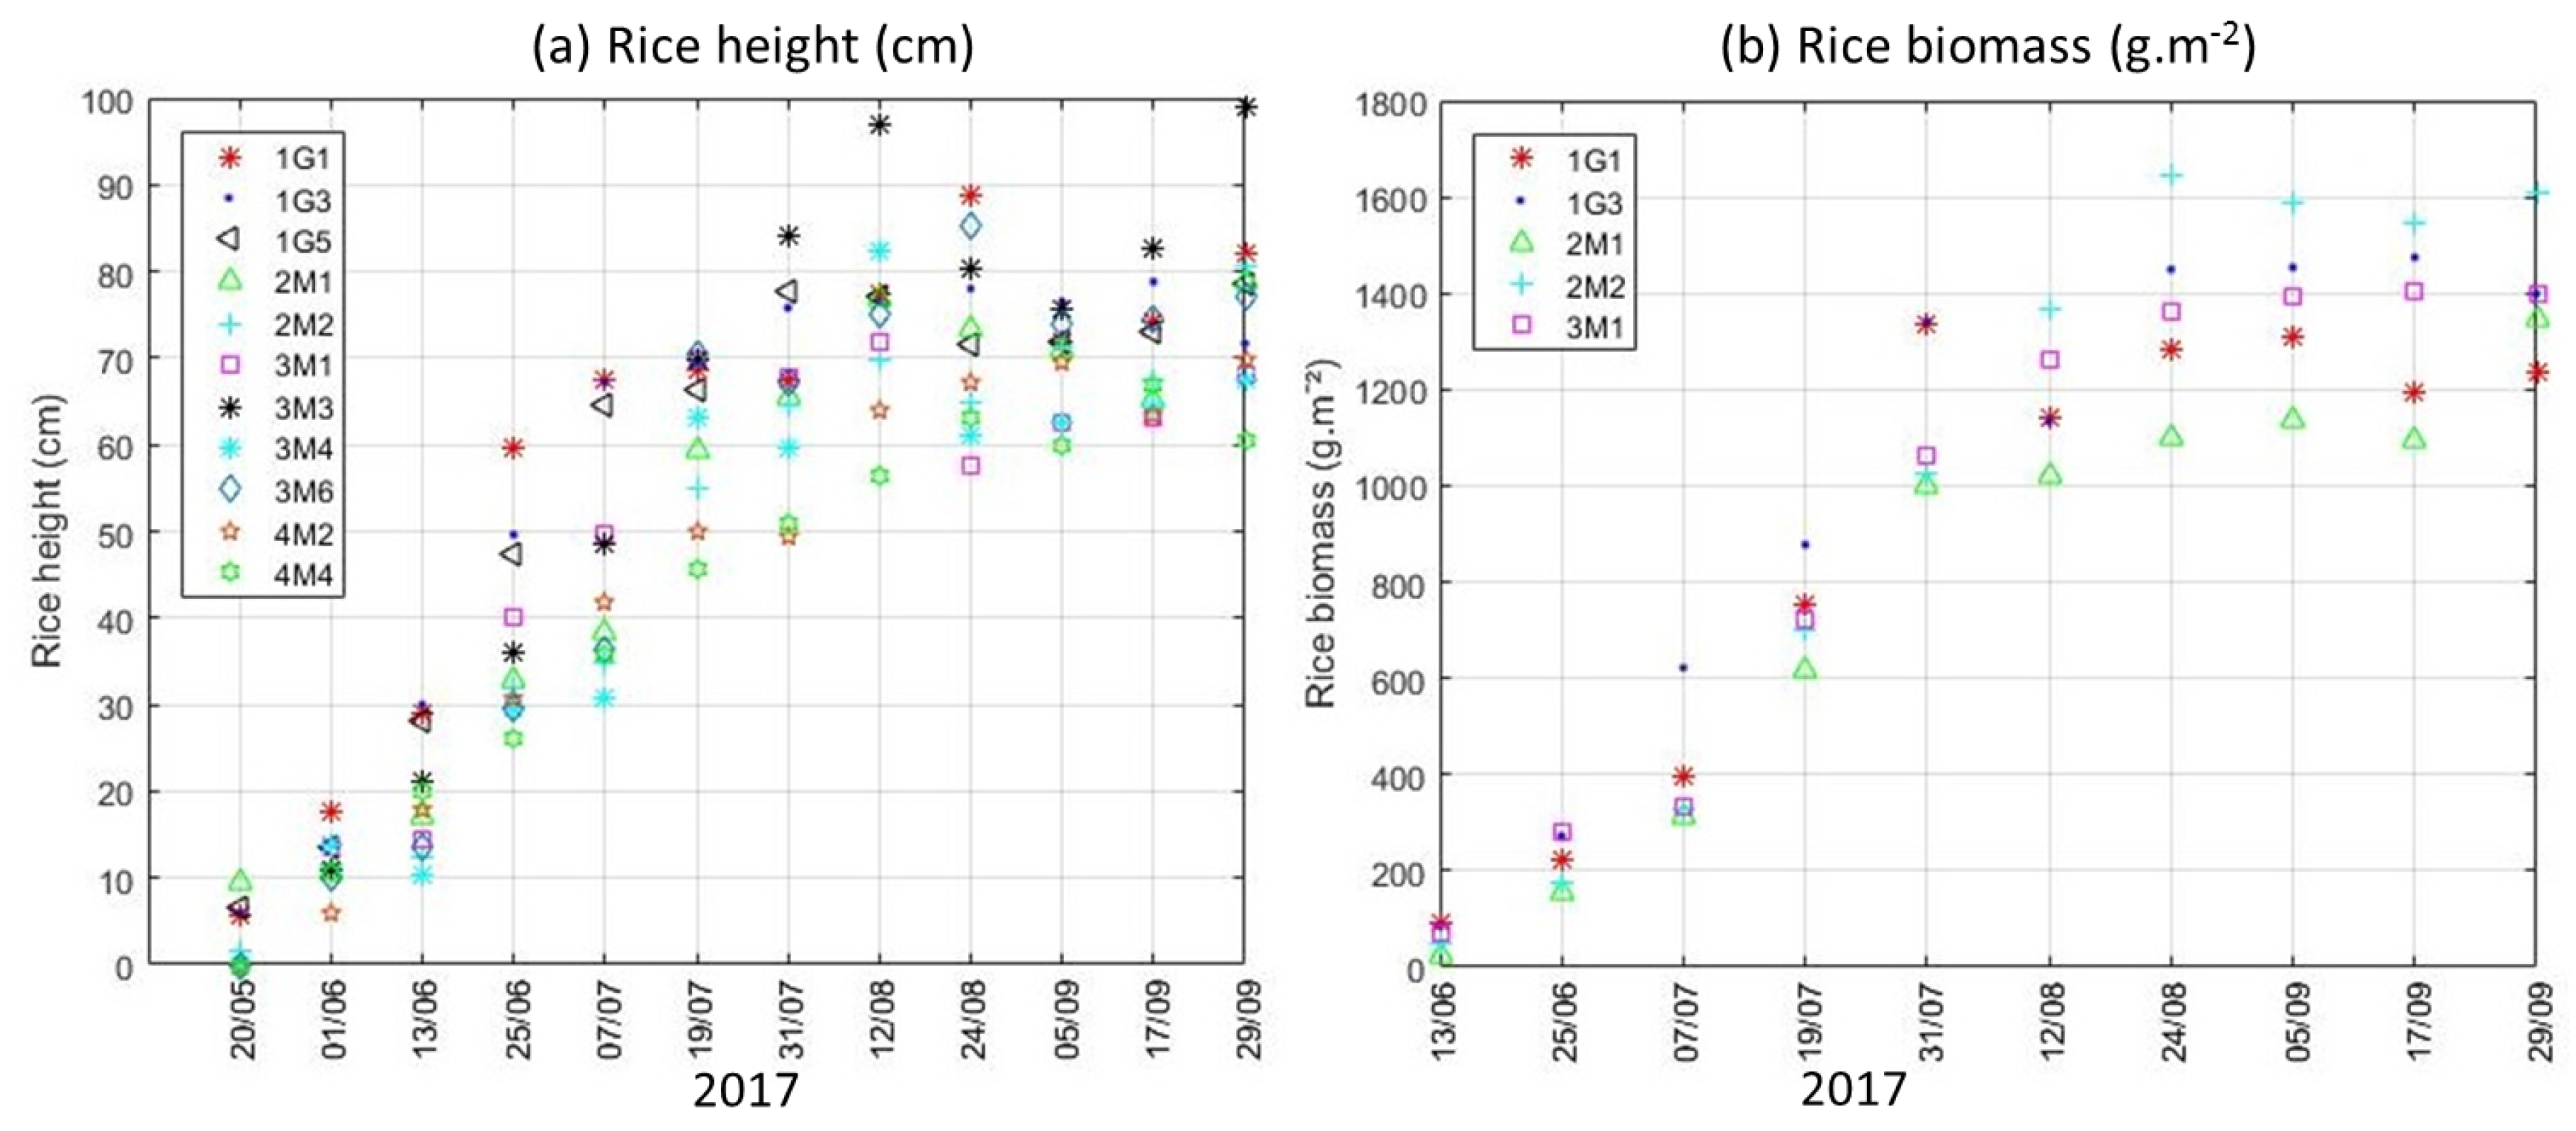
In summary, for rice height in-situ data, there are 132 measurements, whereas, for rice biomass, we only have 50 measurements.

2.4. SAR Data

The Sentinel-1 SAR data includes 25 TOPS mode acquisitions from May 2017 to September 2017, with 6 revisit days. This is dual-polarization (VV and VH) data, leading to 50 images in total. First of all, a reference image was selected and all images are coregistered to it by taking into account the TOPS acquisition [41]. Five-look (in range) intensity radar data are generated and radiometrically calibrated for antenna gain, range spreading loss, normalized reference area and the calibration constant using information from Sentinel-1 SAR header.
Reliable estimates using backscattering coefficients require that the estimated number of looks (ENL) is large. To increase the ENL, speckle filtering can be used with loss of spatial resolution. In this paper, we improve the time series SAR Sentinel-1 dataset by exploiting a temporal adaptive filtering to reduce speckle while keeping as much as possible the fine structures present in radar images [42].
Finally, all images are orthorectified into map coordinates. This can be done by simulating SAR image from the SRTM DEM 30 m and using it to do coregistration. The image pixel size of the final data is 20 m. The Sentinel-1 SAR data are processed by using the TomoSAR platform (i.e., a platform supports the entire processing from SAR, Interferometry, Polarimetry, to Tomography (so-called TomoSAR)) developed by Dinh Ho Tong Minh and Yen-Nhi Ngo [43]. In details, the full description of this SAR dataset can be found in [30].

3. Method

3.1. Multiple Linear Regressions

Multiple Linear regression (MLR) is one form of Linear Regression which is used to describe the variations of a dependent variable (which varies under the influence of other system parameters) associated with the variations of several independent variables (which varies without being influenced by the other system parameters) [31]. The truth data in use include in-situ measurements of rice height, rice biomass, Day after Sowing (DaS—which is counted from the first day when farmers sow in their plots), backscattering coefficients VV and VH polarizations. The purpose is that using the ground measurements to predict rice height and biomass values based on DaS with single polarization (VV or VH) and dual-polarization (VH and VV). Therefore, the application of MLR equation to estimate rice height and rice biomass in each polarization is different. For example, the equation below was used in case of dual-polarization:
b i o m a s s = x 0 + x 1 σ V H + x 2 σ V V + x 3 D a S
where σ V H and σ V V are the backscattering coefficients in the decibel unit, in VH and VV polarization, respectively; DaS stands for Day after Sowing. To estimate rice height, we substitute rice biomass by rice height in Equation (1). In VV polarization model, we just exclude the term σ V H in Equation (1). Similarly, in VH polarization model, we just exclude the term σ V V in Equation (1). We use the same input parameters for SVR and RF methods.

3.2. Support Vector Regressions

The Support Vector Machine Regression (SVR) is a non-parametric technique and non-linear regression method. This method is considered a non-parametric technique because it relies on kernel functions. SVR algorithms use kernel functions which take data as input and transform it into the required form [44]. The basic idea is to transform the input data into a higher dimensional feature space, where the problem can be solved in a linearized manner [35]. In the end, training the SVR involves solving a quadratic optimization problem. There are several kernels: linear, polynomial, sinusoidal and radial basis function (RBF) kernels. Although linear kernels can be computationally efficient, nonlinear kernels (e.g., RBF) have a better performance over linear kernels [34]. For RBF kernels, two parameters need to be tuned: (i) the sigma parameter (i.e., the width of the kernel function), and (ii) the complexity C parameter to control the trade-off between the maximization of the margin between the training error decision limit and the training data vectors. Both parameters are optimized in the estimation process to improve performance.

3.3. Random Forest

As SVR, the Random Forest (RF) method is also a non-parametric method used in vegetation parameters estimation. Random forest is an ensemble learning technique developed by Breiman [33] to improve the classification and regression trees method by combining a large set of decision trees [10]. The classical method of regression is based on the division of the data set according to their homogeneity. A decision tree is from top to bottom on a root node and consists of sharing the data into subsets that contain instances with similar values. In addition, each node of every tree is split based on another random subset of parameters. This randomization provides a certain level of robustness to outliers and overfitting [33]. The result is usually aggregated by taking the average of the predictions from all trees. RF relies on the number of trees and the number of parameters to be used at each node split [37]. To improve performance, both parameters need to be optimized in the estimation process.

3.4. Model Assessment

For the performance analysis of three methods (MLR, SVR, RF), we apply a five-cross-validation method ( K F o l d s = 5 ). In order to verify the effectiveness of three methods applied in Sentinel-1 data (VH, VV, VH and VV polarizations), the retrieved rice height and biomass are compared with ground truth measurements. The model assessments are validated through correlation coefficient ( R 2 ) and Root Mean Square Error (RMSE):
R M S E = 1 n Σ i = 1 n ( Y i X i ) 2
R 2 = Σ i = 1 n [ ( Y i Y i ¯ ) ( X i X i ¯ ) ] Σ i = 1 n ( Y i Y i ¯ ) 2 × Σ i = 1 n ( X i X i ¯ ) 2
where Y i and Y i ¯ are the estimated variables and their mean values, X i and X i ¯ are the ground truth measurement variables and their mean, n is the number of data. A good retrieval result contains a low RMSE value and a high correlation coefficient.
To select the best model among different machine learning methods, we also use Akaike’s Information Criterion (AIC) and Bayesian Information Criterion (BIC) [45].

4. Results

4.1. Experimental Settings

We evaluated rice parameters using Sentinel-1 data with standard machine learning approaches. The aim of these approaches is to use the ground measurements to train models (based on DaS with single polarization (VV or VH) and dual-polarization (VH and VV)) to predict rice height and biomass values. We note that using both VV and VH polarizations we are able to estimate DaS with the RMSE less than 3 days. There is any ways to combine VV and VH polarizations (e.g., VV+VH, VV-VH, VV/VH, etc). However, to avoid many model considerations and also to verify the helpfulness of combination VV and VH, we do a Principal Component Analysis (PCA) [46] to construct a new predictor that combines VH and VV. We keep the first and the second PCA components to run through MLR, SVR, RF methods.
For the MLR model, it does not require to chose the optimal parameters since they can be estimated directly. In contrast, for both RF and SVR models, to improve performance, it is important to tune the parameters which are optimized in the estimation process. In this paper, the parameters are defined by a grid search to get the best performance [37]. For both RF and SVR models, we found that the parameters were quite similar in both single and dual polarizations. For the SVR model, we use the RBF kernel with the complexity parameter of 50 and the gamma of 0.9 for rice biomass, whereas, for rice height, they equal to 0.7 and 60, respectively. For the RF model, we set the number of parameters to be used at each node split at 7 and the number of trees at 80 for both rice biomass and height estimations. For all three methods, we use the Matlab implementation provided by the Regression Learner.

4.2. Ground Measured Results

From all recorded measurements of rice height and biomass, the mean value of each plot was provided. Figure 4a presents the temporal variance of rice height versus the acquisition dates of Sentinel-1 data for all plots.
During the vegetative period (from May to July), rice height increases rapidly, and then small variation is observed during the reproductive phase (from July to September), while it stays constant in the ripening period. Rice height measurements show a high variability due to a quick growth of rice during the first three months (Figure 4a). The same observation is found for rice biomass, before the ripening period, it increases rapidly and during this stage, the biomass is stabilized (Figure 4b). The same trend was observed in [14,24,47].

4.3. Backscattering Coefficients According to Rice Parameters

Figure 5a shows the behavior of VV and VH backscattering coefficients during the entire rice growth. As expected, it can be observed that the VV backscatter values are higher than the VV polarization. In the vegetative stage (16 days to 65 days after sowing), the dynamic range of VV and VH backscatters is very high (about 7 dB). In the reproductive stage (65 days to 100 days), the VH backscatter tends to saturate, whereas the VV goes down. In the last ripening stage (after 100 days), both VH and VV backscatters tend to slightly decrease.
Figure 5b shows a scatter plot on VV and VH backscattering coefficients distribution together with their Pearson correlation coefficient R P according to vegetative, reproductive and ripening stages. Although they are highly correlated at each stage, if we put all together in a full cycle, the Pearson correlation is decreased to 0.52.
In Figure 5c,d, the behavior of VV and VH backscattering coefficients is similar with respect to both rice height and biomass. Both VH and VV backscatters increase strongly in the vegetative stage. On the other hand, in reproductive and ripening stages, while VH backscatter still slightly grows, the VV visibly decreases.

4.4. Rice Height Estimation

The relevance of three methods MLR, SVR and RF applied in Sentinel-1 data with (VH, VV, both VH and VV polarizations) was analyzed using RMSE and R 2 values. Table 3 and Table 4 report the regression results of rice height estimation with the three methods MLR, SVR, and RF.
The method used to estimate parameters is supposed to be efficient when its RMSE, AIC and BIC values are as small as possible. The RF method is better than the other methods: R 2 = 0.92 , RMSE = 16% (7.9 cm) (with the dual-polarization VV and VH model). For PCA (VV and VH) models, as comparison with the dual-polarization VV and VH cases, they are quite similar. In other words, VV and VH give complementary information in the estimations. Figure 6 shows the results of estimating the rice height by plotting the best configuration for each method.
As show in Figure 6, the correlations ( R 2 ) obtained by using MLR, SVR and RF are 0.8, 0.89, 0.92 respectively. MLR gives the biggest value of RMSE (12.2 cm—24%), followed by SVR with RMSE = 9.1 cm (18%) and RF with the minimum RMSE = 7.9 cm (16%).
Next, in Figure 7, the rice height retrieval respect to in-situ data during the cultured period is shown for example on two plots: 2M2 and 4M2. The continuous line presents the estimated height of rice, while the following small circles show the in-situ rice height measurements. Visibly, the correlation between the retrieved and in-situ rice height of the two parcels is good. The rice height retrieval and the in-situ rice height are increasing and close together as the result of rice growth.

4.5. Rice Biomass Estimation

Table 5 and Table 6 show all the results of rice biomass inversion performance of MLR, SVR, and RF. The best performance is obtained by the MLR method using dual-polarization VV and VH model: R 2 = 0.85 , RMSE = 206 g·m 2 (22%). For SVR and RF methods, the best performance is obtained by using the VH polarization model: R 2 = 0.87 , RMSE = 175 g·m 2 (19%) for the SVR method: R 2 = 0.9 , RMSE = 162 g·m 2 (18%) for the RF method, respectively.
Figure 8 presents the effectiveness of three methods to estimate rice biomass. The correlation coefficients R 2 are 0.85, 0.87, 0.90 for MLR, SVR and RF methods, respectively. In addition, the RMSE values are 206 g·m 2 ( 22 % ), 175 g·m 2 ( 19 % ), and 162 g·m 2 ( 18 % ), respectively.
As seen in Figure 9, for example, at two reference plots 1G3 and 3M1, the scatter plots between retrieved and in-situ rice biomass indicate the same behavior along the growth stage with continuous line for rice biomass retrieval and circles for in-situ rice biomass.

5. Discussion

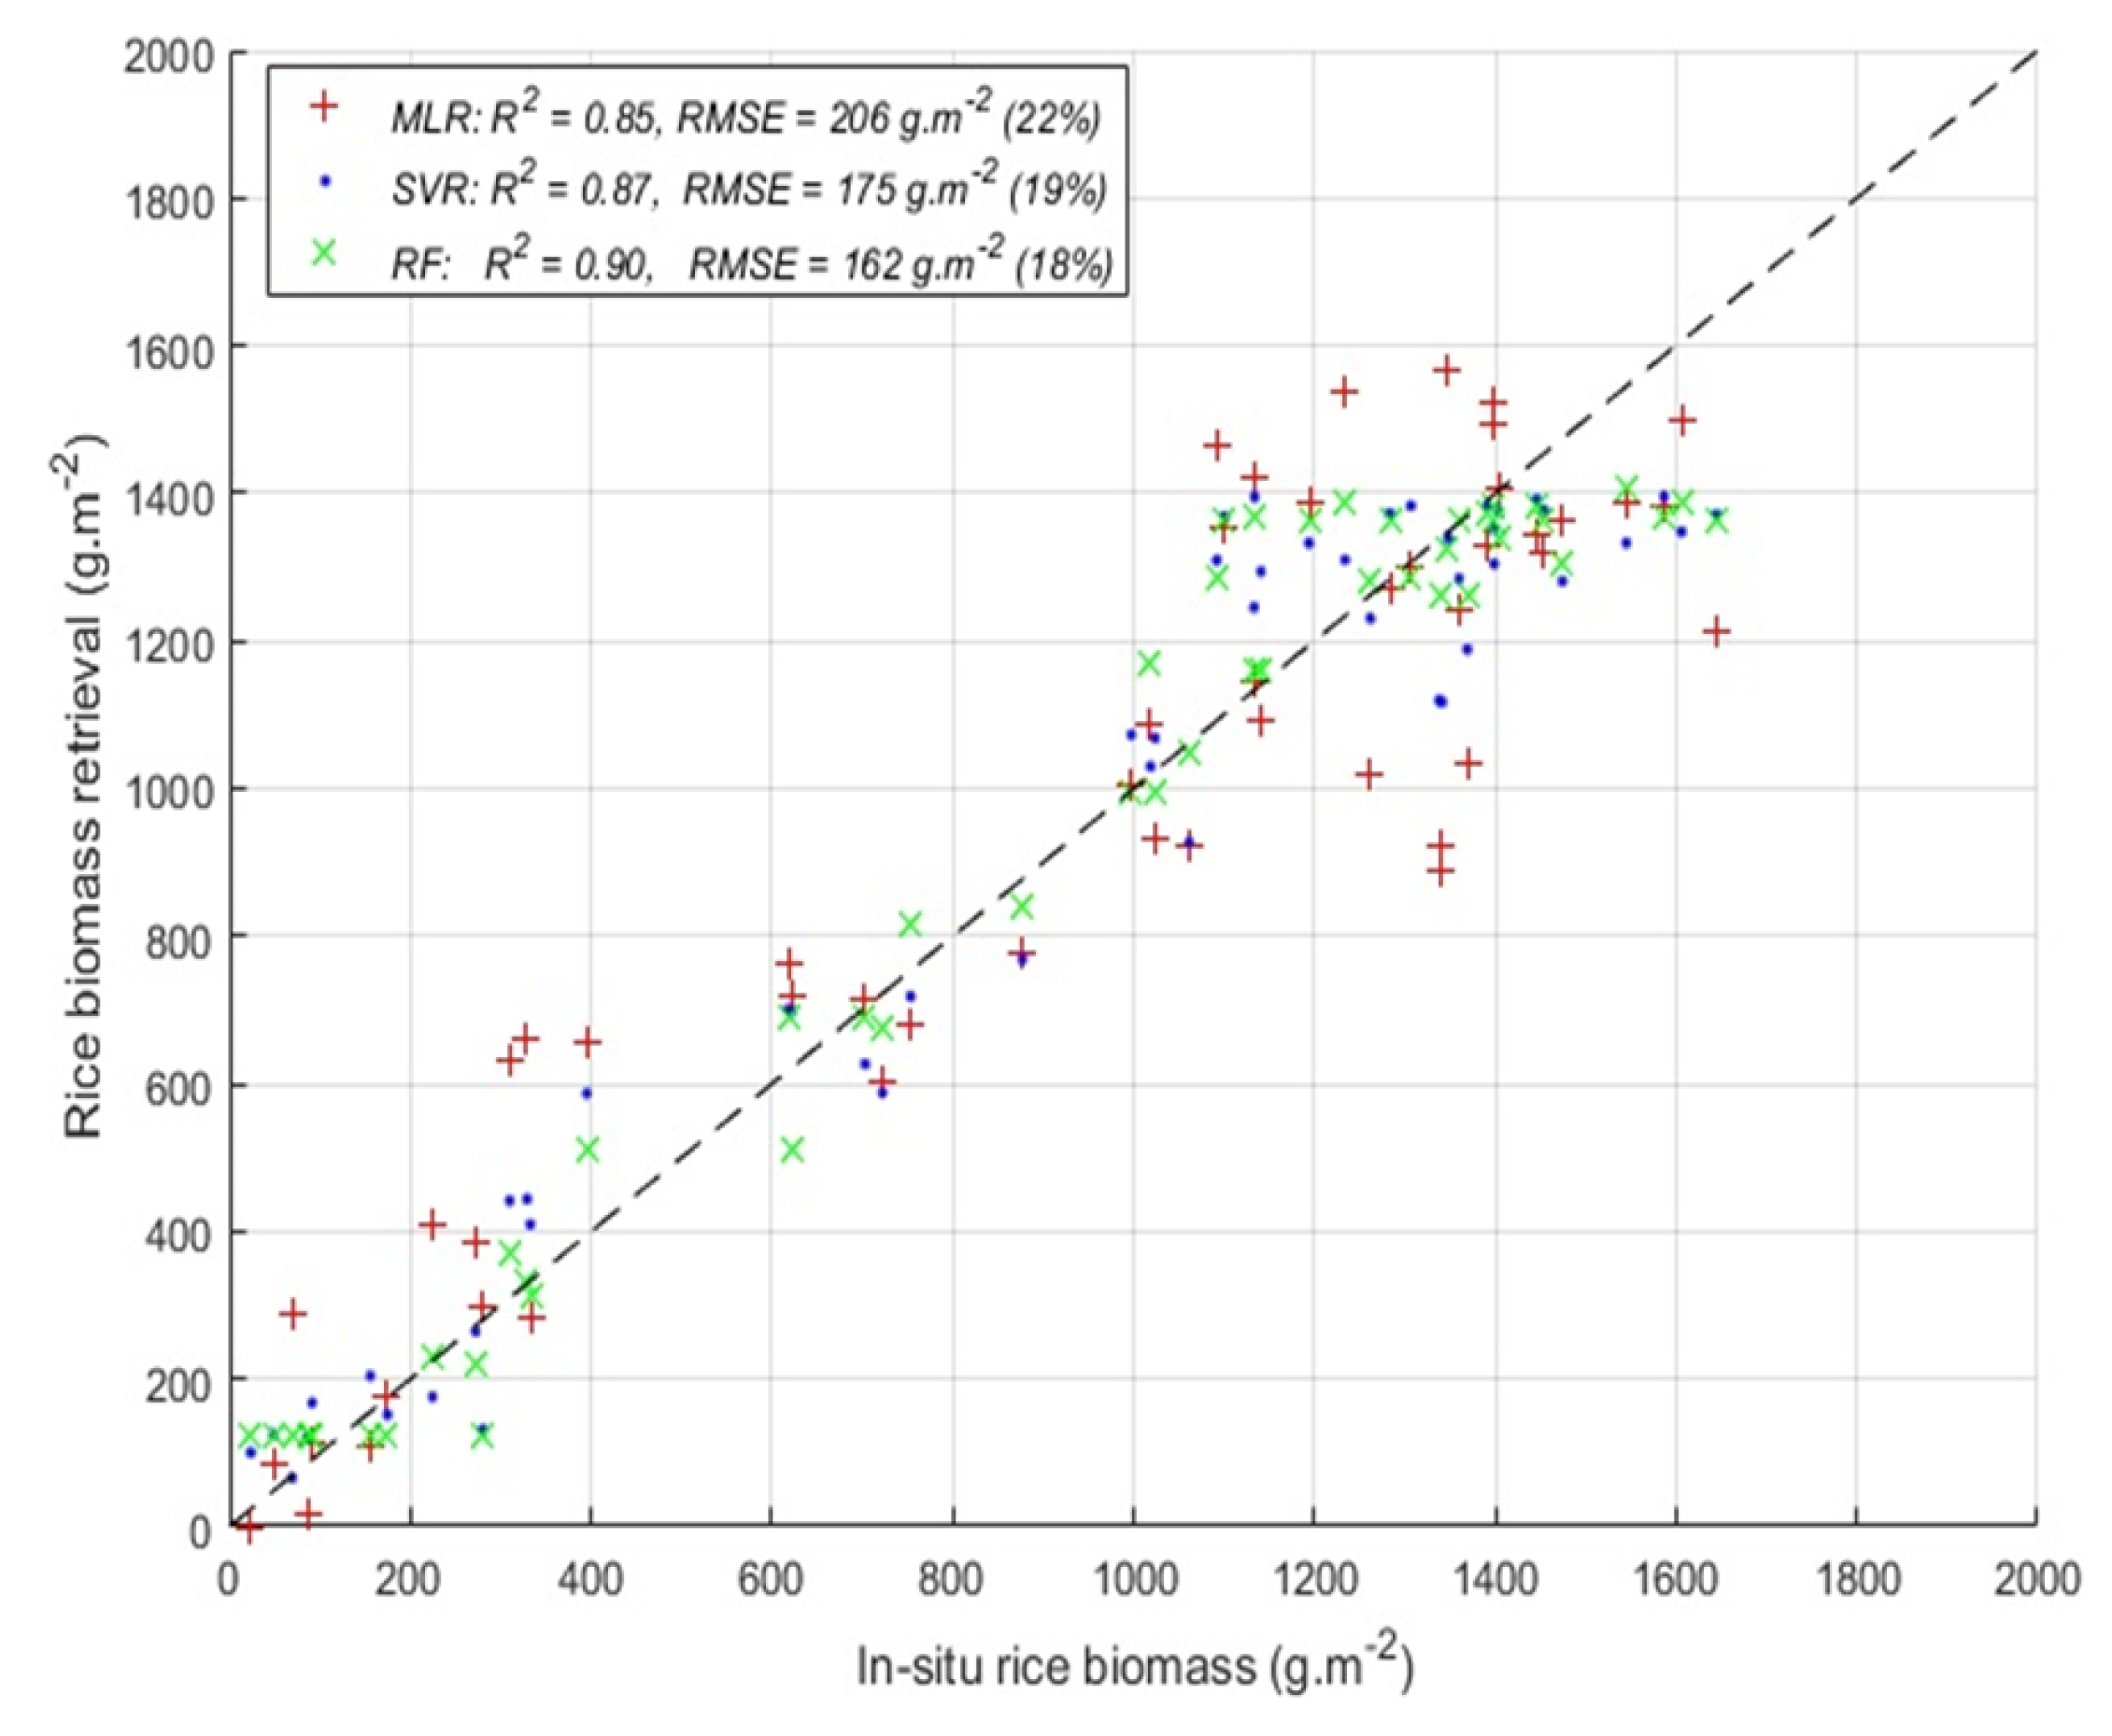
In this paper, we show that the Sentinel-1 can be used to estimate rice height and biomass in Camargue with a high accuracy. The dynamics in rice height and biomass can be observed by the backscatter behaviors in each of the two polarizations (VV and VH). Good results can be obtained by using classical approaches (MLR, SVR, and RF). The validated metric indicates good performance, in which the correlation coefficient R 2 was greater than 0.8. We show that there is a better performance using non-parametric methods (SVR and RF) over the parametric MLR method. Thus, these demonstrated results confirm the great potential of Sentinel-1 data for rice height and biomass retrievals.
First of all, even with the traditional approaches, we show that good retrieved performance could be yielded with Sentinel-1 SAR data. This is not straightforward due to the speckle noise nature in radar images. Good performance can be explained by the fact that 6 days time series Sentinel-1 SAR data allows not only a good follow-up of the rice growth but also mostly noise-free dataset, thanks to the speckle adaptive filtering. In addition, for rice biophysical parameter estimations, the Day after Sowing information, which can be retrieved directly from Sentinel-1 data within the accuracy of 3 days (our estimation), allows us to mitigate the potential problem on the radar signal saturation. This situation is different from forest applications, where the forest age is challenged to retrieval. For example, for forest biomass estimations, many works have to use prior knowledge (e.g., Landsat-derived tree cover [48]) or advanced techniques (e.g., SAR tomography [49,50]) to mitigate the radar signal saturated problem. Finally, we note that outside the European zones, there is a limitation for Sentinel-1 data since the revisit period will be 12 days. However, it should be emphasized that, nowadays, the Sentinel-1 constellation is the only system which can provide free and global coverage radar data. Therefore, it is a good candidate for operational rice monitoring tasks.
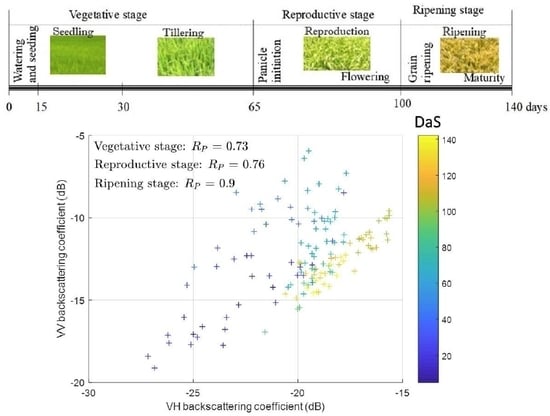
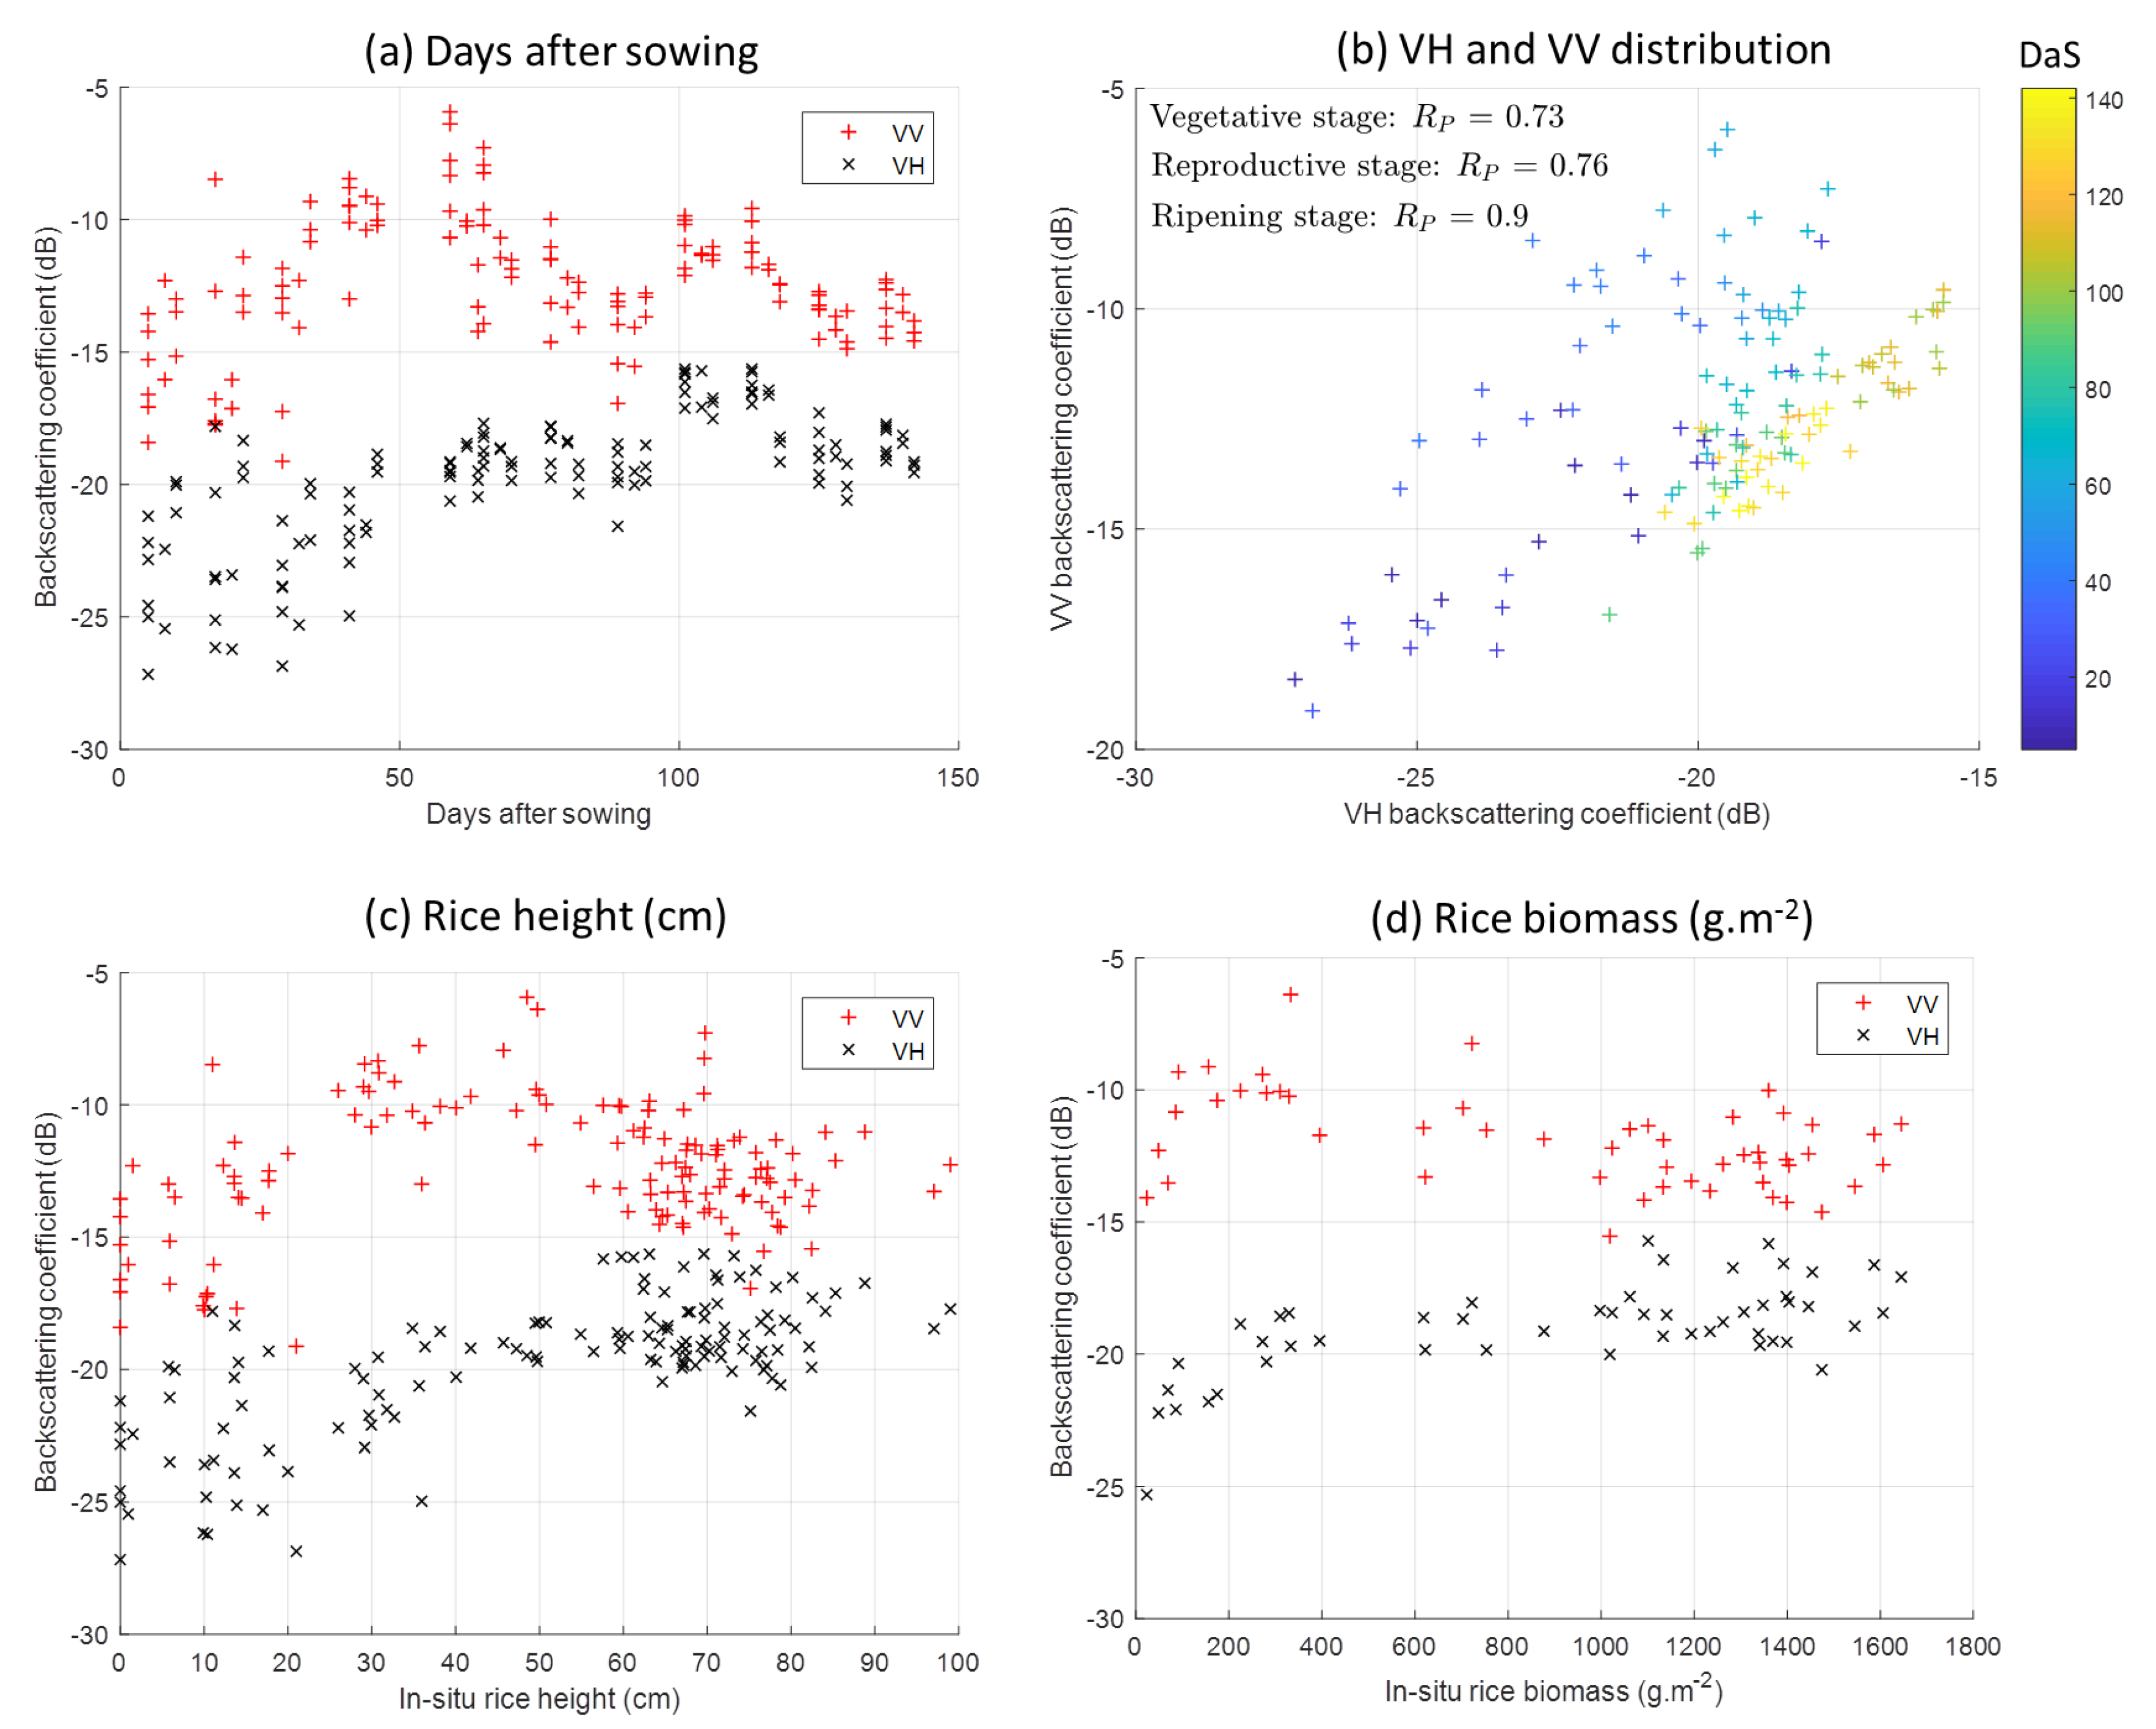
Using in-situ measurements at Camargue, we show that radar backscattering coefficients are sensitive to rice biophysical parameters and have a strong correlation with rice height and biomass. This observation is consistent with reports from the literature [14,51] due to the sensitivity of radar signals to rice structures. The backscatter of VH and VV polarizations can be separated into two main parts. In the first part, the VV and VH increase with the rice growth until 50 cm height (See Figure 5c). At this stage, the main backscattering mechanism is contributed by the interaction between the stem and the underlying water surface (e.g., double bounce). In the second part (where rice grows from 50 cm to 100 cm (maturity)), although the VV goes down, the VH is still slightly increased. Indeed, at this stage, the backscattering mechanisms are contributed not only by the double bounce interaction but also from the volume stem directly. Beyond 50 cm, the double bounce phenomenon can be reduced, and the stem and leaves of the rice are not remained vertical. While they lead to the power decrease of the VV backscatter, the VH signal is increased due to its sensitivity to random volume backscattering. Similar interactions were also reported by Lopez-Sanchez et al. [52]. The same trend of backscattering coefficients versus rice biomass is observed. When rice biomass reaches around 800 g·m 2 (See Figure 5d), this is the period when the rice stem is no longer vertical and the leaves have already deviated from the stem. Interestingly, it is worth pointing out that there is a jump in both VV and VH backscatter at 100 DaS days (See Figure 5a). This is mainly because there is a rapid transition from always irrigated rice fields at the reproductive stage to no longer irrigated status at the ripening stage.
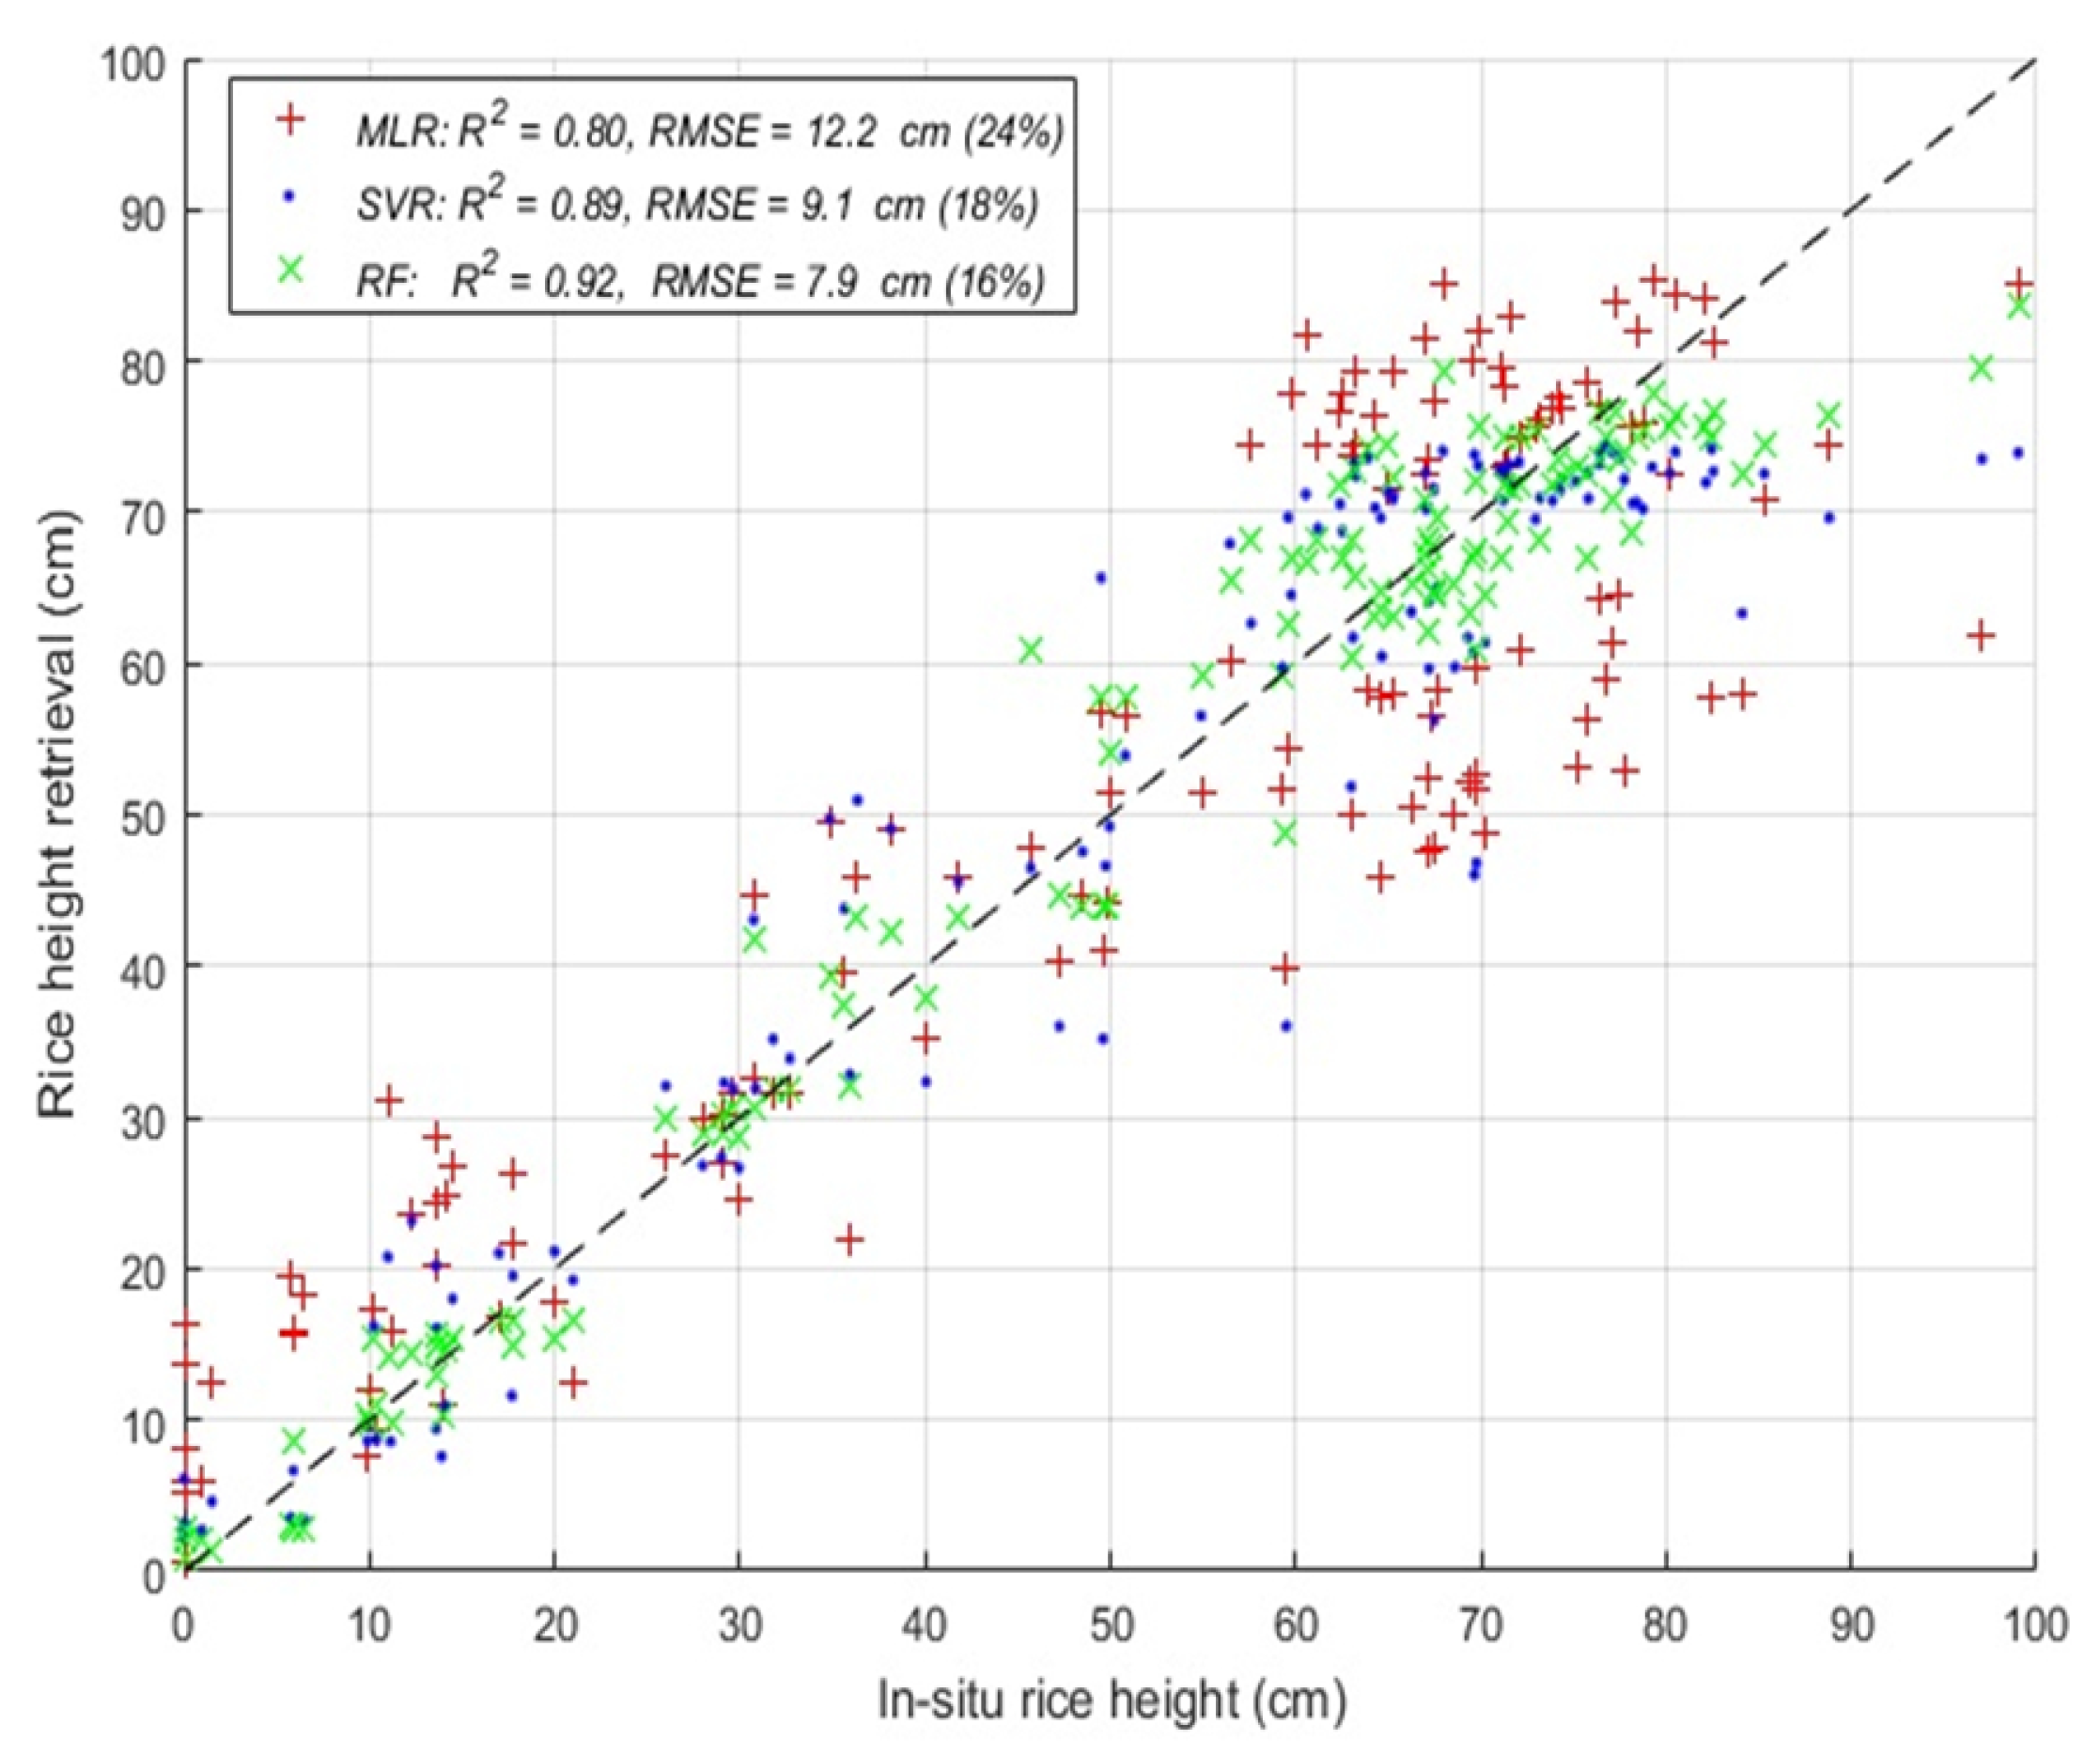
We can observe that non-parametric methods (SVR and RF) have better performance over the parametric MLR method for estimating rice parameters (See Table 3 and Table 5). Between the SVR and RF models, the RF method obtains slightly better results than the SVR. With the RF method, the correlation coefficient R 2 and RMSE were 0.92 and 16 % for rice height, 0.90 and 18 % for rice dry biomass. For rice height, all methods (MLR, SVR, and RF) yield the best performances with the dual-polarization VV and VH model. For rice biomass, we observe that the combination of VH and VV polarizations does not bring to the good result as a single VH polarization in SVR and RF methods. This can be explained by the fact that the VH backscattering is mainly from the depolarizing part represents a small proportion of biomass, but it is highly correlated with the total biomass [48]. The RMSE was 16% (7.9 cm) for rice height, which is better than the result (13.3 cm) reported in the recent literature [53]. For rice biomass, the RMSE was 18% (162 g·m 2 ), which is better than the recent results (RMSE = 170.49 g·m 2 ) reported by Jing et al. [54], who used an Artificial Neural Network (ANN) inversion method on the C-band RADARSAT data. Last but not least, our rice biomass estimation (162 g·m 2 ) is much better than the performance (200 g·m 2 ) from L-band ALOS/PALSAR data [55].
In parallel with machine learning algorithms, there is also another approach to estimate rice parameters. This is physical model-based inversion (such as Karam Model [56], Water Cloud Model [57], etc.). However, physical models are complicated and related to certain rice growth models, which require a wide area for the experiment station to measure model parameters. These limitations of physical model-based inversion methods make sense to work on machine learning methods [36,37]. We demonstrated in this paper that the non-parametric methods (SVR and RF) had a good performance in estimating the rice biophysical parameters.
Finally, among agricultural practices in the Camargue region, the rice crop plays a crucial role in the cropping systems. This is mainly because the rice irrigation allows the leaching of salt and consequently leads to the introduction of other species (e.g., wheat, sunflower, etc) into the rotation of crops [39]. However, the rice areas tend to decrease from 16,000 ha in 2011 ([29]) to 10,627 ha ([30]) in 2017. The downward trend of the rice extent can lead to a negative impact on the sustainable agricultural development. Future studies should be considered the remote sensing assimilation, such as Sentinel-1 radar for rice height and biomass as our demonstration, in crop models to better follow farming practices, estimate rice production and provide strategies for the sustainable agricultural development.

6. Conclusions

In this work, we studied the potential of Sentinel-1 remote sensing data for rice height and dry biomass estimations. We proposed to use three classical machine learning approaches to predict rice parameters from Sentinel-1 data, which were applied in the Camargue region.
We demonstrated that good regression performance could be yielded with Sentinel-1 data even with the classical approaches (MLR, SVR, and SVR). We found that non-parametric methods (SVR and RF) had better performance over the parametric MLR method for estimating rice parameters. Between the SVR and RF models, the RF method obtains slightly better results than the SVR. Correlation coefficient R 2 and RMSE were 0.90 and 18 % (162 g·m 2 ) for rice dry biomass, 0.92 and 16 % (7.9 cm) for rice height, which indicated a high accuracy of Sentinel-1 SAR retrieval. In other words, we demonstrated that Sentinel-1 remote sensing data could be an alternative and reliable approach to monitor regional rice height and estimate dry biomass, compared with direct field measurements. Future work on the Camargue region could be focused on exploiting Sentinel-1 data to improve crop models to better estimate rice production yields in order tobe able to propose strategies for sustainable agricultural development.
In the context of the Copernicus program, there are two missions: radar Sentinel-1 and optical Sentinel-2. In future research, the data combination from the two satellites will be a necessity as it will be possible to carry out large-scale missions. Radar and optical data can be complementary to each other because they offer different perspectives on the Earth’s surface providing different information content according to their specificity [7,8,58]. Both types of data can also be merged to provide information from multiple sources and to provide improved results for decision making [59].

Author Contributions

E.N. and D.H.T.M. developed the main idea that led to this paper. E.N., D.N.H.T. and I.E.M. analyzed SAR data for rice parameters estimations and their descriptions. E.N. collected the reference data and was the main author of the paper. INRA has provide the main contacts with farmers on the Camargue area. All authors read and approved the final manuscript.

Funding

This research received no external funding.

Acknowledgments

This work was supported by Centre National d’Etudes Spatiales. We thank the government of Burundi for funding the PhD research of Emile Ndikumana. The authors were grateful to Xavier Guillot and Pierre Megias for the authorisation of accessing their rice parcels.

Conflicts of Interest

The authors declare no conflict of interest.

References

  1. Van Nguyen, N.; Ferrero, A. Meeting the challenges of global rice production. Paddy Water Environ. 2006, 4, 1–9. [Google Scholar] [CrossRef]
  2. Seck, P.A.; Diagne, A.; Mohanty, S.; Wopereis, M.C. Crops that feed the world 7: Rice. Food Secur. 2012, 4, 7–24. [Google Scholar] [CrossRef]
  3. Hossain, M. Rice supply and demand in Asia: A socioeconomic and biophysical analysis. In Applications of Systems Approaches at the Farm and Regional Levels; Springer: Berlin, Germany, 1997; Volume 1, pp. 263–279. [Google Scholar]
  4. Shao, Y.; Fan, X.; Liu, H.; Xiao, J.; Ross, S.; Brisco, B.; Brown, R.; Staples, G. Rice monitoring and production estimation using multitemporal RADARSAT. Remote Sens. Environ. 2001, 76, 310–325. [Google Scholar] [CrossRef]
  5. Singh, B.K.; Singh, A.K.; Meetei, N.; Mukherjee, A.; Mandal, N. QTL Mapping for Cold Tolerance at the Seedling Stage in Rice. Int. J. Bio-Resour. Stress Manag. 2016, 7. [Google Scholar] [CrossRef]
  6. Jayawardhana, W.; Chathurange, V. Extraction of agricultural phenological parameters of Sri Lanka using MODIS, NDVI time series data. Procedia Food Sci. 2016, 6, 235–241. [Google Scholar] [CrossRef]
  7. Campos-Taberner, M.; Garcia-Haro, F.J.; Camps-Valls, G.; Grau-Muedra, G.; Nutini, F.; Busetto, L.; Katsantonis, D.; Stavrakoudis, D.; Minakou, C.; Gatti, L.; et al. Exploitation of SAR and optical Sentinel data to detect rice crop and estimate seasonal dynamics of leaf area index. Remote Sens. 2017, 9, 248. [Google Scholar] [CrossRef]
  8. Ferrant, S.; Selles, A.; Le Page, M.; Herrault, P.A.; Pelletier, C.; Al-Bitar, A.; Mermoz, S.; Gascoin, S.; Bouvet, A.; Saqalli, M.; et al. Detection of irrigated crops from Sentinel-1 and Sentinel-2 data to estimate seasonal groundwater use in South India. Remote Sens. 2017, 9, 1119. [Google Scholar] [CrossRef]
  9. Xiao, X.; Boles, S.; Frolking, S.; Li, C.; Babu, J.Y.; Salas, W.; Moore, B. Mapping paddy rice agriculture in South and Southeast Asia using multi-temporal MODIS images. Remote Sens. Environ. 2006, 100, 95–113. [Google Scholar] [CrossRef]
  10. Mutanga, O.; Adam, E.; Cho, M.A. High density biomass estimation for wetland vegetation using WorldView-2 imagery and random forest regression algorithm. Int. J. Appl. Earth Obs. Geoinf. 2012, 18, 399–406. [Google Scholar] [CrossRef]
  11. Wang, F.M.; Huang, J.F.; Wang, X.Z. Identification of optimal hyperspectral bands for estimation of rice biophysical parameters. J. Integr. Plant Biol. 2008, 50 3, 291–299. [Google Scholar] [CrossRef]
  12. Xiao, X.; Boles, S.; Liu, J.; Zhuang, D.; Frolking, S.; Li, C.; Salas, W.; Moore, B. Mapping paddy rice agriculture in southern China using multi-temporal MODIS images. Remote Sens. Environ. 2005, 95, 480–492. [Google Scholar] [CrossRef]
  13. Drusch, M.; Bello, U.D.; Carlier, S.; Colin, O.; Fernandez, V.; Gascon, F.; Hoersch, B.; Isola, C.; Laberinti, P.; Martimort, P.; et al. Sentinel-2 ESA Optical High-Resolution Mission for GMES Operational Services. Remote Sens. Environ. 2012, 120, 25–36. [Google Scholar] [CrossRef]
  14. Le Toan, T.; Ribbes, F.; Wang, L.F.; Floury, N.; Ding, K.H.; Kong, J.A.; Fujita, M.; Kurosu, T. Rice crop mapping and monitoring using ERS-1 data based on experiment and modeling results. IEEE Trans. Geosci. Remote Sens. 1997, 35, 41–56. [Google Scholar] [CrossRef]
  15. Li, S.; Ni, P.; Cui, G.; He, P.; Liu, H.; Li, L.; Liang, Z. Estimation of rice biophysical parameters using multitemporal RADARSAT-2 images. In IOP Conference Series: Earth and Environmental Science; IOP Publishing: Bristol, UK, 2016; Volume 34, p. 012019. [Google Scholar]
  16. Silvestro, P.C.; Pignatti, S.; Yang, H.; Yang, G.; Pascucci, S.; Castaldi, F.; Casa, R. Sensitivity analysis of the Aquacrop and SAFYE crop models for the assessment of water limited winter wheat yield in regional scale applications. PLoS ONE 2017, 12, e0187485. [Google Scholar] [CrossRef] [PubMed]
  17. Rossi, C.; Erten, E. Paddy-rice monitoring using TanDEM-X. IEEE Trans. Geosci. Remote Sens. 2015, 53, 900–910. [Google Scholar] [CrossRef]
  18. Yuzugullu, O.; Erten, E.; Hajnsek, I. Estimation of rice crop height from X-and C-band PolSAR by metamodel-based optimization. IEEE J. Sel. Top. Appl. Earth Obs. Remote Sens. 2017, 10, 194–204. [Google Scholar] [CrossRef]
  19. Inoue, Y.; Sakaiya, E.; Wang, C. Capability of C-band backscattering coefficients from high-resolution satellite SAR sensors to assess biophysical variables in paddy rice. Remote Sens. Environ. 2014, 140, 257–266. [Google Scholar] [CrossRef]
  20. Mazza, G.; Agnelli, A.E.; Orasen, G.; Gennaro, M.; Valè, G.; Lagomarsino, A. Reduction of Global Warming Potential from rice under alternate wetting and drying practice in a sandy soil of northern Italy. Ital. J. Agrometeorol.-Riv. Ital. Agrometeorol. 2016, 21, 35–44. [Google Scholar]
  21. Ge, T.; Li, B.; Zhu, Z.; Hu, Y.; Yuan, H.; Dorodnikov, M.; Jones, D.L.; Wu, J.; Kuzyakov, Y. Rice rhizodeposition and its utilization by microbial groups depends on N fertilization. Biol. Fertil. Soils 2017, 53, 37–48. [Google Scholar] [CrossRef]
  22. Li, K.; Brisco, B.; Yun, S.; Touzi, R. Polarimetric decomposition with RADARSAT-2 for rice mapping and monitoring. Can. J. Remote Sens. 2012, 38, 169–179. [Google Scholar] [CrossRef]
  23. Chen, J.; Lin, H.; Pei, Z. Application of ENVISAT ASAR data in mapping rice crop growth in Southern China. IEEE Geosci. Remote Sens. Lett. 2007, 4, 431–435. [Google Scholar] [CrossRef]
  24. Kurosu, T.; Fujita, M.; Chiba, K. Monitoring of rice crop growth from space using the ERS-1 C-band SAR. IEEE Trans. Geosci. Remote Sens. 1995, 33, 1092–1096. [Google Scholar] [CrossRef]
  25. Snoeij, P.; Attema, E.; Davidson, M.; Duesmann, B.; Floury, N.; Levrini, G.; Rommen, B.; Rosich, B. The Sentinel-1 radar mission: Status and performance. In Proceedings of the IEEE International Radar Conference-Surveillance for a Safer World (RADAR 2009), Bordeaux, France, 12–16 October 2009; pp. 1–6. [Google Scholar]
  26. Torres, R.; Snoeij, P.; Geudtner, D.; Bibby, D.; Davidson, M.; Attema, E.; Potin, P.; Rommen, B.; Floury, N.; Brown, M.; et al. GMES Sentinel-1 mission. Remote Sens. Environ. 2012, 120, 9–24. [Google Scholar] [CrossRef]
  27. Torbick, N.; Chowdhury, D.; Salas, W.; Qi, J. Monitoring rice agriculture across myanmar using time series Sentinel-1 assisted by Landsat-8 and PALSAR-2. Remote Sens. 2017, 9, 119. [Google Scholar] [CrossRef]
  28. Ferrazzoli, P.; Paloscia, S.; Pampaloni, P.; Schiavon, G.; Sigismondi, S.; Solimini, D. The potential of multifrequency polarimetric SAR in assessing agricultural and arboreous biomass. IEEE Trans. Geosci. Remote Sens. 1997, 35, 5–17. [Google Scholar] [CrossRef]
  29. Delmotte, S.; Tittonell, P.; Mouret, J.C.; Hammond, R.; Lopez-Ridaura, S. On farm assessment of rice yield variability and productivity gaps between organic and conventional cropping systems under Mediterranean climate. Eur. J. Agron. 2011, 35, 223–236. [Google Scholar] [CrossRef]
  30. Ndikumana, E.; Ho Tong Minh, D.; Baghdadi, N.; Courault, D.; Hossard, L. Deep Recurrent Neural Network for Agricultural Classification using multitemporal SAR Sentinel-1 for Camargue, France. Remote Sens. 2018, 10, 1217. [Google Scholar] [CrossRef]
  31. Bernstein, D.S. Matrix Mathematics: Theory, Facts, and Formulas with Application to Linear Systems Theory; Princeton University Press: Princeton, NJ, USA, 2005; Volume 41. [Google Scholar]
  32. Rasmussen, C.E.; Williams, C.K.I. Gaussian Processes for Machine Learning; MIT Press: Cambridge, MA, USA, 2006. [Google Scholar]
  33. Breiman, L. Random forests. Mach. Learn. 2001, 45, 5–32. [Google Scholar] [CrossRef]
  34. Huang, T.; Kecman, V.; Kopriva, I. Kernel Based Algorithms for Mining Huge Data Sets: Supervised, Semi-Supervised, and Unsupervised Learning; Springer: Berlin, Germany, 2006. [Google Scholar]
  35. Kotsiantis, S.B.; Zaharakis, I.D.; Pintelas, P.E. Machine learning: A review of classification and combining techniques. Artif. Intell. Rev. 2006, 26, 159–190. [Google Scholar] [CrossRef]
  36. Neumann, M.; Saatchi, S.S.; Ulander, L.M.; Fransson, J.E. Assessing performance of L-and P-band polarimetric interferometric SAR data in estimating boreal forest above-ground biomass. IEEE Trans. Geosci. Remote Sens. 2012, 50, 714–726. [Google Scholar] [CrossRef]
  37. Vafaei, S.; Soosani, J.; Adeli, K.; Fadaei, H.; Naghavi, H.; Pham, T.D.; Tien Bui, D. Improving accuracy estimation of forest aboveground biomass based on incorporation of ALOS-2 PALSAR-2 and sentinel-2A imagery and machine learning: a case study of the Hyrcanian forest area (Iran). Remote Sens. 2018, 10, 172. [Google Scholar] [CrossRef]
  38. Bassene, J.B.; Quiedeville, S.; Chabrol, D.; Lançon, F.; Moustier, P. Organisation en réseau et durabilité systémique de deux filières alimentaires (riz biologique et petit épeautre en France). Actes Des 2014, 8, 24. [Google Scholar]
  39. Mouret, J.C. Etude de l’Agrosystème Rizicole en Camargue dans ses Relations Avec le Milieu et le Système Cultural: Aspects Particuliers de la Fertilité. Ph.D. Thesis, Montpellier 2 University, Montpellier, France, 1988. [Google Scholar]
  40. Beau, J. La culture du riz en Camargue, aspects techniques et commerciaux actuels. Méditerranée 1975, 22, 53–68. [Google Scholar] [CrossRef] [Green Version]
  41. Prats-Iraola, P.; Scheiber, R.; Marotti, L.; Wollstadt, S.; Reigber, A. TOPS Interferometry With TerraSAR-X. IEEE Trans. Geosci. Remote Sens. 2012, 50, 3179–3188. [Google Scholar] [CrossRef] [Green Version]
  42. Quegan, S.; Yu, J.J. Filtering of multichannel SAR images. IEEE Trans. Geosci. Remote Sens. 2001, 39, 2373–2379. [Google Scholar] [CrossRef]
  43. Ho Tong Minh, D.; Ngo, Y.N. Tomosar platform supports for Sentinel-1 tops persistent scatterers interferometry. In Proceedings of the 2017 IEEE International Geoscience and Remote Sensing Symposium (IGARSS), Fort Worth, TX, USA, 23–28 July 2017; pp. 1680–1683. [Google Scholar]
  44. Fan, R.E.; Chen, P.H.; Lin, C.J. Working set selection using second order information for training support vector machines. J. Mach. Learn. Res. 2005, 6, 1889–1918. [Google Scholar]
  45. Chakrabarti, A.; Ghosh, J.K. AIC, BIC and Recent Advances in Model Selection. In Philosophy of Statistics: Handbook of the Philosophy of Science; Bandyopadhyay, P.S., Forster, M.R., Eds.; North-Holland: Amsterdam, The Netherlands, 2011; Volume 7, pp. 583–605. [Google Scholar] [CrossRef]
  46. Jolliffe, I.T. Principal Component Analysis, 2nd ed.; Springer: Berlin, Germany, 2002. [Google Scholar]
  47. Wu, F.; Wang, C.; Zhang, H.; Zhang, B.; Tang, Y. Rice crop monitoring in South China with RADARSAT-2 quad-polarization SAR data. IEEE Geosci. Remote Sens. Lett. 2011, 8, 196–200. [Google Scholar] [CrossRef]
  48. Ho Tong Minh, D.; Ndikumana, E.; Vieilledent, G.; McKey, D.; Baghdadi, N. Potential value of combining ALOS PALSAR and Landsat-derived tree cover data for forest biomass retrieval in Madagascar. Remote Sens. Environ. 2018, 213, 206–214. [Google Scholar] [CrossRef]
  49. Ho Tong Minh, D.; Le Toan, T.; Rocca, F.; Tebaldini, S.; Mariotti d’Alessandro, M.; Villard, L. Relating P-band Synthetic Aperture Radar Tomography to Tropical Forest Biomass. IEEE Trans. Geosci. Remote Sens. 2014, 52, 967–979. [Google Scholar] [CrossRef]
  50. Ho Tong Minh, D.; Le Toan, T.; Rocca, F.; Tebaldini, S.; Villard, L.; Réjou-Méchain, M.; Phillips, O.L.; Feldpausch, T.R.; Dubois-Fernandez, P.; Scipal, K.; et al. SAR tomography for the retrieval of forest biomass and height: Cross-validation at two tropical forest sites in French Guiana. Remote Sens. Environ. 2016, 175, 138–147. [Google Scholar] [CrossRef] [Green Version]
  51. Jia, M.; Tong, L.; Zhang, Y.; Chen, Y. Rice biomass estimation using radar backscattering data at S-band. IEEE J. Sel. Top. Appl. Earth Obs. Remote Sens. 2014, 7, 469–479. [Google Scholar] [CrossRef]
  52. Lopez-Sanchez, J.M.; Ballester-Berman, J.D.; Hajnsek, I. First results of rice monitoring practices in Spain by means of time series of TerraSAR-X dual-pol images. IEEE J. Sel. Top. Appl. Earth Obs. Remote Sens. 2011, 4, 412–422. [Google Scholar] [CrossRef]
  53. Zhang, Y.; Liu, X.; Su, S.; Wang, C. Retrieving canopy height and density of paddy rice from Radarsat-2 images with a canopy scattering model. Int. J. Appl. Earth Obs. Geoinf. 2014, 28, 170–180. [Google Scholar] [CrossRef]
  54. Jing, Z.; Zhang, Y.; Wang, K.; Shi, R. Retrieving rice yield and biomass from Radarsat-2 SAR data with artificial neural network (ANN). In Remote Sensing and Modeling of Ecosystems for Sustainability X; International Society for Optics and Photonics: San Diego, California, USA, 2013; Volume 8869, p. 88690X. [Google Scholar]
  55. Zhang, Y.; Huang, H.; Chen, X.; Wu, J.; Wang, C. Mapping paddy rice biomass using ALOS/PALSAR imagery. In Proceedings of the 2008 International Workshop on Education Technology and Training & 2008 International Workshop on Geoscience and Remote Sensing, Shanghai, China, 21–22 December 2008; Volume 2, pp. 207–210. [Google Scholar]
  56. Karam, M.A.; Fung, A.K.; Antar, Y.M. Electromagnetic wave scattering from some vegetation samples. IEEE Trans. Geosci. Remote Sens. 1988, 26, 799–808. [Google Scholar] [CrossRef]
  57. Graham, A.; Harris, R. Extracting biophysical parameters from remotely sensed radar data: A review of the water cloud model. Prog. Phys. Geogr. 2003, 27, 217–229. [Google Scholar] [CrossRef]
  58. Irwin, K.; Beaulne, D.; Braun, A.; Fotopoulos, G. Fusion of SAR, Optical Imagery and Airborne LiDAR for Surface Water Detection. Remote Sens. 2017, 9, 890. [Google Scholar] [CrossRef]
  59. Hall, D. Mathematical Techniques in Multisensor Data Fusion; Artech House Inc.: Norwood, OH, USA, 1992. [Google Scholar]
Figure 1. Rice crop growth calendar in Camargue.
Remotesensing 10 01394 g001
Figure 2. Camargue study area. (a) The agricultural land cover map in 2017 [30]. The green color indicates the rice extent of the Camargue region. (b) The zoom version of the white polygons represents the location of reference plots where measurements were made at every 12 days from May to September 2017.
Remotesensing 10 01394 g002
Figure 3. The reference plot 1G3 is marked in the figure (coordinates of central point 43 34 30 N, 4 30 32 E) together with its photos at different dates.
Remotesensing 10 01394 g003
Figure 4. Temporal variation of the rice height and biomass versus to acquisition dates of Sentinel-1 data.
Remotesensing 10 01394 g004
Figure 5. Sentinel-1 backscattering coefficients according to (a) Days after sowing; (b) VV and VH distribution; (c) Rice height; (d) Rice biomass.
Remotesensing 10 01394 g005
Figure 6. Rice height estimation using MLR, SVR and RF methods. In this figure, the configurations that provide the best results are considered (with dual-polarization VV and VH model).
Remotesensing 10 01394 g006
Figure 7. Rice height retrieval and in-situ measurements at two reference plots 2M2 and 4M2.
Remotesensing 10 01394 g007
Figure 8. Rice biomass estimation using MLR, SVR and RF methods. In this figure, only the configurations that provide the best results are considered (with dual-polarization VV and VH model for MLR, and with VH model for SVR and RF).
Remotesensing 10 01394 g008
Figure 9. Rice biomass retrieval and in-situ measurements at two reference plots 1G3 and 3M1.
Remotesensing 10 01394 g009
Table 1. Agricultural calendar and rice cycle in Camargue [40].
Nature of Work and Vegetative CycleExecutive Date
StubbleOctober to November
Land preparationMarch to April
Use of fertilizers and herbicidesMiddle April
Watering and seeding25 April to 16 May
Lifting and soddingMay to June
Post-emergence herbicideJune to July
Earing-floweringJuly to August
Maturation, harvest15–20 September to October
Table 2. Description of reference plots in Camargue.
Plot IdentityArea (ha)Sowing DateRice VarietyHarvest Date (DoY)
1G1 2.4 10 May 2017Ronaldo09 October 2017 (282)
1G3 2.14 10 May 2017Ronaldo09 October 2017 (282)
1G5 2.03 10 May 2017Ronaldo09 October 2017 (282)
2M1 3.5 12 May 2017Eurosis29 September 2017 (272)
2M2312 May 2017Eurosis29 September 2017 (272)
3M1615 May 2017Ronaldo11 October 2017 (284)
3M3515 May 2017Opale11 October 2017 (284)
3M4415 May 2017Ronaldo14 October 2017 (287)
3M6 2.5 15 May 2017Ronaldo14 October 2017 (287)
4M2 3.5 15 May 2017Brio10 October 2017 (283)
4M4 3.5 15 May 2017Brio09 October 2017 (282)
Table 3. Rice height estimation using MLR, SVR and RF methods with 5 folds cross-validation. Best results are in bold.
VVVHVH and VVPCA (VH and VV)
Methods R 2 RMSE (cm) R 2 RMSE (cm) R 2 RMSE (cm) R 2 RMSE (cm)
MLR0.7912.50.7912.30.8012.20.7912.4
SVR0.8710.30.8810.20.899.10.899.2
RF0.908.40.888.90.927.90.918.2
Table 4. AIC and BIC for rice height estimation. The smallest values are in bold.
AICBIC
MethodsVVVHVV and VHPCA (VH and VV)VVVHVV and VHPCA (VH and VV)
MLR295.6293.7294.8296.7295.9294.1295.3297.1
SVR273.4272.3261.2262.4273.8272.6261.7262.9
RF250.0256.6245.0249.2250.4257.0245.5249.7
Table 5. Rice biomass estimation from five folds of cross-validation. The best results are in bold.
VVVHVH and VVPCA (VH and VV)
Methods R 2 RMSE (g·m 2 ) R 2 RMSE (g·m 2 ) R 2 RMSE (g·m 2 ) R 2 RMSE (g·m 2 )
MLR0.812300.812160.852060.83213
SVR0.861780.871750.862070.86193
RF0.901670.901620.881770.89174
Table 6. AIC and BIC for rice biomass estimation. The smallest values are in bold.
AICBIC
MethodsVVVHVV and VHPCA (VH and VV)VVVHVV and VHPCA (VH and VV)
MLR242.2239.4239.4240.8241.3238.5238.2239.6
SVR231.0230.3241.6236.6230.1229.4240.4235.4
RF228.3227.0232.8232.1227.4226.0231.6230.9

