Impact of Radiance Data Assimilation on the Prediction of Heavy Rainfall in RMAPS: A Case Study


1
Institute of Urban Meteorology, China Meteorological Administration, Beijing 100089, China
2
State Key Laboratory of Remote Sensing Science, Institute of Remote Sensing and Digital Earth, Chinese Academy of Sciences, Beijing 100101, China
3
Joint Center for Global Change Studies (JCGCS), Beijing 100875, China
*
Author to whom correspondence should be addressed.
Remote Sens. 2018, 10(9), 1380; https://doi.org/10.3390/rs10091380
Submission received: 20 July 2018
/
Revised: 19 August 2018
/
Accepted: 23 August 2018
/
Published: 30 August 2018
(This article belongs to the Special Issue Remote Sensing of Precipitation)
Abstract
:Herein, a case study on the impact of assimilating satellite radiance observation data into the rapid-refresh multi-scale analysis and prediction system (RMAPS) is presented. This case study targeted the 48 h period from 19–20 July 2016, which was characterized by the passage of a low pressure system that produced heavy rainfall over North China. Two experiments were performed and 24 h forecasts were produced every 3 h. The results indicated that the forecast prior to the satellite radiance data assimilation could not accurately predict heavy rainfall events over Beijing and the surrounding area. The assimilation of satellite radiance data from the advanced microwave sounding unit-A (AMSU-A) and microwave humidity sounding (MHS) improved the skills of the quantitative precipitation forecast to a certain extent. In comparison with the control experiment that only assimilated conventional observations, the experiment with the integrated satellite radiance data improved the rainfall forecast accuracy for 6 h accumulated precipitation after about 6 h, especially for rainfall amounts that were greater than 25 mm. The average rainfall score was improved by 14.2% for the 25 mm threshold and by 35.8% for 50 mm of rainfall. The results also indicated a positive impact of assimilating satellite radiances, which was primarily reflected by the improved performance of quantitative precipitation forecasting and higher spatial correlation in the forecast range of 6–12 h. Satellite radiance observations provided certain valuable information that was related to the temperature profile, which increased the scope of the prediction of heavy rainfall and led to an improvement in the rainfall scoring in the RMAPS. The inclusion of satellite radiance observations was found to have a small but beneficial impact on the prediction of heavy rainfall events as it relates to our case study conditions. These findings suggest that the assimilation of satellite radiance data in the RMAPS can provide an overall improvement in heavy rainfall forecasting.
1. Introduction
Heavy rainfall events represent a significant area of concern among the scientific community due to their dramatic social, economic, and ecological impacts. Local heavy rainfall is generally a short-range mesoscale weather process, which makes it difficult to accurately predict the evolution and development of these mesoscale weather systems that lead to heavy rainfall events. Although over the last several decades significant improvements have been made in short-range forecasting, the accurate prediction and quantification of heavy rainfall events still remains a challenge [1]. Local heavy rainfall forecasting is greatly dependent on the accuracy of the initial conditions that are considered in numerical weather prediction (NWP) models [2]. With the development of remote sensing technologies, satellite observations have played a significant role in the improvement of numerical forecasting techniques by providing a more accurate estimation of the initial conditions. Thus, the assimilation of satellite observations into the operational NWP system has emerged as an important method for improving quantitative precipitation forecasting.
There are two basic approaches for assimilating information that has been obtained from satellites into a data assimilation system [3]. During the initial phase of development, the primary method of satellite data assimilation is to incorporate conventional retrieval from satellite measurements into the system. This method is one possible and effective way, especially for variables that are related to precipitation, such as cloud-top pressure, rain rate, and total column water vapor. Assimilating these retrieved data provides valuable insight into cloud-affected observations in the system, which can improve the hydrometeor process and cloud properties in the analysis and forecast atmosphere fields [4]. However, certain additional prior information and restrictive assumptions are generally required in the conversion process [5]. They can also bring some retrieval problems, which have been discussed previously [4,5,6,7,8]. The second approach is to assimilate the satellite radiances directly into the data assimilation system. This approach requires a non-linear observation operator to transform model variables into radiances, where the observation operator is expressed mathematically by a forward radiative transfer equation that is used to calculate radiance from model-state vertical profiles. Currently, the assimilation of satellite radiances is largely performed under clear-sky conditions, especially for infrared sounder data. Direct assimilation of cloud-affected radiances is very difficult due to limited understanding of the vertical structure of cloud parameters and uncertainties that are associated with nonlinearity of the moist physics process [4,9]. Wang et al. compared the assimilations of radiance and three-layered precipitable water from the Advanced Himawari Imager (AHI) [10], with results indicating a similar or comparable overall impact on precipitation forecasting. Theoretically, satellite radiance assimilation is superior to the retrieval assimilation [3,7] because the errors of the radiance observations are much simpler and more justified in direct radiance assimilation than in retrieval assimilation.
Radiances from various satellite instruments have been assimilated directly in most NWP models using variational data assimilation schemes [5,11,12,13,14]. These satellite radiances have shown a significant improvement in the forecasting accuracy of numerical models with better representations of mesoscale features [15,16]. A number of studies have demonstrated the value of satellite radiance observations in precipitation forecasting. Xu et al. assessed the impact of radiance observations from the Advanced Television and Infrared Observation Satellite Operational Vertical Sounder (ATOVS) on precipitation forecasts in Southwest Asia, with results revealing a reduction in the precipitation forecast errors for most locations within the 24 h hindcasts [17]. Zou and Qin reported that the assimilation of the imager channel radiances from Geostationary Operational Environmental Satellites-11 and -12 (GOES-11 and GOES-12) resulted in a significant positive impact on coastal quantitative precipitation forecasting (QPF) that was performed near the northern region of the Gulf of Mexico [18,19]. Zou also studied the impact of assimilating satellite microwave humidity sounding data with a newly added cloud detection algorithm for a coastal precipitation event [20], wherein the precipitation threat scores were increased by more than 50% after 3–6 h of model forecasting for 3 h rainfall thresholds exceeding 1.0 mm. Singh et al. analyzed the impact of assimilating radiances that were obtained from the Indian National Satellite-3D (INSAT-3D) on short-range weather forecasts [21], where the results demonstrated the ability of temperature and water vapor sensitive radiances to improve not only the temperature and moisture fields, but also the wind fields. Sagita et al. examined the influence of the satellite radiance data assimilation on the prediction of two days of heavy rainfall in the Java region [22]. The results indicated that the satellite radiance data assimilation displayed a higher QPF accuracy than that of surface observation data assimilation. Wang et al. [23] investigated the impact of Himawari-8’s AHI on severe rainstorm, which occurred over North China during 18–21 July 2016, and the assimilation of AHI radiances from water vapor channels was found to have a clear positive impact on rainfall forecasting accuracy for the first 6 h of lead time. Previous studies have reported the positive impact of satellite radiance data assimilation on the accuracy of NWP models, especially for quantitative precipitation forecasts.
This study aimed to examine the impact of the ingestion and assimilation of satellite radiance data along with conventional observations on the accuracy of heavy rainfall simulations in the rapid-refresh multi-scale analysis and prediction system (RMAPS). The rainfall event that was the subject of this study occurred over North China during 19–20 July 2016. It was one of the heaviest rainfalls in the past 60 years and caused major damage in and around Beijing [23]. The upper-level low pressure center slowly moved eastward, while the southwesterly flow intensified under the influence of peripheral flow around a subtropical high in the middle and lower levels, which produced persistent precipitation over North China. We focused on the influence of assimilating radiances data from the Advanced Microwave Sounding Unit-A (AMSU-A) and Microwave Humidity Sounding (MHS) on RMAPS heavy rainfall forecasting. The rest of this paper is organized as follows: Section 2 describes the RMAPS, satellite radiance observations, the observed data, and strategy for verification that was used in this study; Section 3 details the experimental design and the quality control of the satellite radiance data; the study results are presented and discussed in Section 4, and the conclusions are presented in Section 5.
2. Materials and Methods
2.1. Model Description
RMAPS is a rapid-refresh multi-scale analysis and prediction system that is based on version 3.8.1 of the Weather Research and Forecasting (WRF) model and WRF Data Assimilation (WRFDA) [12,24]. It was developed by the Institute of Urban Meteorology from the China Meteorological Administration in collaboration with the National Center for Atmospheric Research (NCAR) and has run operationally at the Beijing Meteorological Bureau since 2015. The RMAPS configuration includes Thompson double moment microphysics, ACM2 PBL, RRTMG short and long wave schemes, and 50 vertical computational layers. The land use data that was used in the RMAPS have been reprocessed, which has a higher accuracy and finer classification for urban areas. For the data assimilation system, considerable conventional and radar observations have been included. The background error covariance is domain-dependent, which has been generated based on forecasts over a period of one month in the summer using the NMC (National Meteorological Center) method [25].
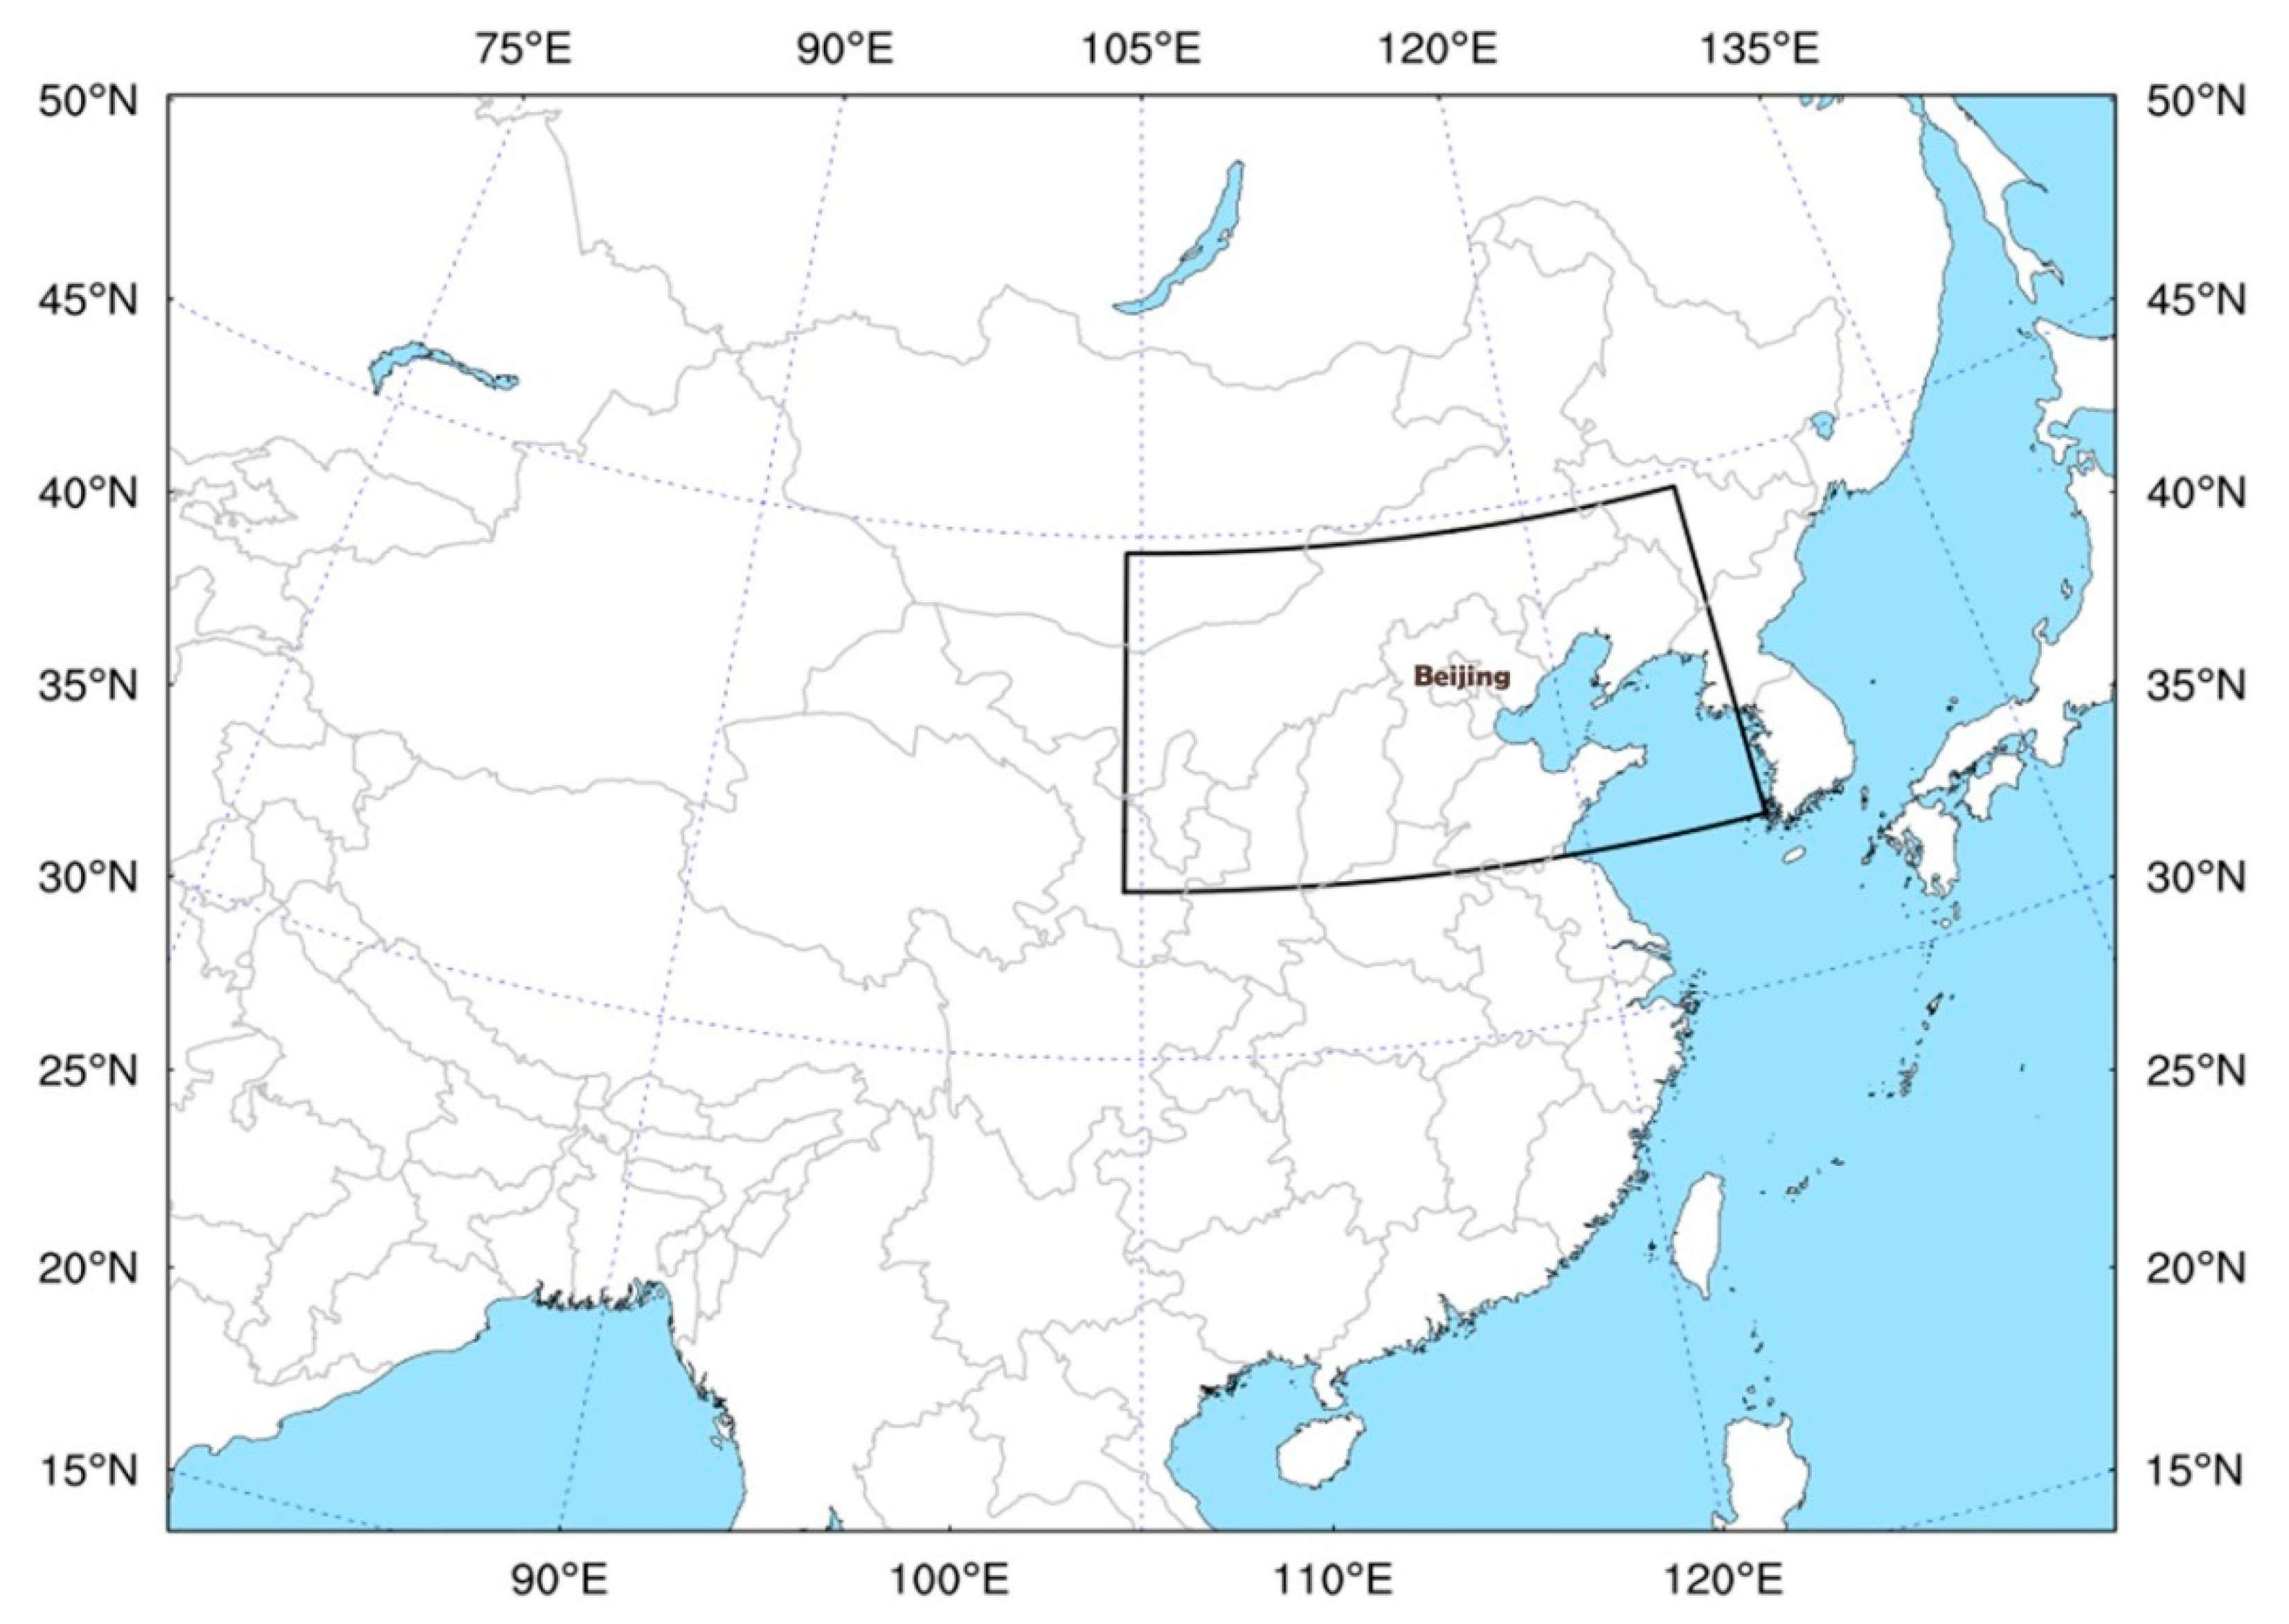
Two nested domains are configured in the RMAPS, as shown in Figure 1. The 9-km horizontal resolution domain covers all of China, with 649 × 500 grid points. The black box represents a 3 km horizontal resolution domain that is primarily centered in North China, with 550 × 424 grid points. The 3-dimension variational (3DVar) technique was used for the analysis component in the RMAPS. Most conventional observation types are assimilated in both domains, including SYNOP (conventional grounded-based), METAR (airport ground-based), SHIP (ship observation), BUOY (oceanographic buoy), AMDAR (aircraft), RAOB (sounding), PILOT (pilot balloon system), and GPSZTD (ground-based GPS zenith total delay) observations. In addition to conventional data, radial velocity and reflectivity from radar observations were also assimilated in the 3 km horizontal resolution domain. Surface and atmospheric fields as initial conditions from the European Centre for Medium-Range Weather Forecasts were introduced once in a day in the RMAPS at 1800 UTC and 6 h spin-up run to 0000 UTC. From 0000 UTC, the RMAPS was able to produce 3 h updated analyses and 0–24 h forecasts serving the North China and Beijing area.
2.2. Satellite Radiance Observations
The satellite radiance observations that were used in this study were obtained from AMSU-A and MHS instruments that were mounted on polar orbiting satellites NOAA18/19 and METOP-A/B. Both the instruments can provide passive measurements of the radiation that was emitted from the earth’s surface and throughout the atmosphere. AMSU-A has an instantaneous field-of-view of 3.3° at half-power points with a nominal spatial resolution of 48 km at nadir. It has 15 measurement channels, including 4 channels (1, 2, 3, and 15) that measure in the “window” spectral regions, which receive energy primarily from the surface and the boundary layer. Remaining channels are “temperature sounding” channels, which can be used to derive atmospheric temperature profiles [26]. MHS has an instantaneous field-of-view of 1.1° at the half-power points, and the spatial resolution at nadir is nominally 16 km. It has a total of 5 channels, of which 2 channels (1 and 2) measure in the “window” spectral regions. Channels 3, 4, and 5 are “humidity sounding” channels which provide atmospheric humidity profiles.
Additionally, the satellite radiance data that were used in this study were taken from NCAR, which underwent substantial preprocessing by the National Environmental Satellite, Data, and Information Service before being made available to users, including statistical limb adjustment and surface emissivity corrections in the microwave channels.
2.3. Verification Data
Two types of precipitation data were used for verification in this study. First, ground observations from automatic weather stations (AWS) were used to provide a reliable surface precipitation amount with high temporal frequency using rain gauges [27,28,29]. To match the gridded forecasts to point observation locations, the forecast value at P was assigned the value at the nearest grid point for comparison. Another type of precipitation data was derived from the Climate Prediction Center Morphing (CMORPH) products, which uses global precipitation estimates of satellite retrieved precipitation that is merged with hourly precipitation from ground AWS in China. The CMORPH precipitation is the gridded data with 0.1° × 0.1° horizontal resolution. Several studies have evaluated the quality and accuracy of CMORPH precipitation [27,30,31], and it has been found that it can capture the precipitation process very well with a more reasonable precipitation amount and spatial distribution. In this study, the CMORPH data were interpolated to the forecast grid for comparison through simple inverse distance weighting.
Additionally, conventional vertical observations were also used for comparison and evaluation. In the vertical, if forecasts and observations were at the same vertical level, then they were paired as is. If any discrepancy existed between the vertical levels, then the forecasts were interpolated to the level of the observation in natural log of pressure coordinates.
2.4. Verification Strategy
In this study, several standard verification statistics were used for evaluating the heavy rainfall forecasts, including bias score (BIAS), critical success index (CSI, or Threat Score), equitable threat score (ETS, or Gilbert Skill Score), probability of detection (POD), and false alarm ration (FAR).
Consider a set of forecasts that can only have two alternatives of yes and no. The relationship between the forecasts and the observed events can be described through a four-cell contingency table (Table 1). a (hits) is the number of positive (yes) forecasts that correspond to an occurrence of the observed event; b (false alarms) is the number of positive forecasts that were not accompanied by an observed event; c (miss) is the number of negative (no) forecasts that had an occurrence of the observed event; and d is the number of negative forecasts that did not have any associated events. Then, BIAS indicates whether the forecast system had a tendency to under-forecast (BIAS < 1) or over-forecast (BIAS > 1) events. CSI can be considered as the accuracy when correct negatives have been removed from consideration. ETS measures the fraction of the observed and/or forecast events that were correctly predicted, adjusted for hits that were associated with random chance. POD is the percent of events that were correctly forecast. The FAR index explains the inaccuracy of the forecast to exclude non-event cases. These statistical criteria, as listed in Table 2, mainly investigate the consistency of the precipitation forecast based on observations [28,32,33].
In addition, the Pearson correlation and mean error (ME) were also employed to quantitatively evaluate the agreement of the spatial distributions between the forecasts and observations [28,34], where and represent the th data points from forecasts and observations, respectively, and and are the means of the and fields, respectively.
3. Assimilation Experiments
3.1. Experimental Design
This work is based on the operational 3D-Var settings of the RMAPS. To evaluate the impact of assimilating satellite radiance observations for the severe rainfall event over North China during 19–20 July 2016, two parallel experiments were configured. The first experiment (”CTRL”) assimilated conventional observations in domain 1 with a horizontal resolution of 9 km. Observations that were taken within 1.5 h of each analysis time were assimilated every 3 h. All of the observations were assumed to be valid at the time of analysis for each experiment. In addition to the conventional data, radial velocity and reflectivity from radar observations were also assimilated in domain 2 with a horizontal resolution of 3 km. The second experiment (“DA_RAD”) assimilated the same conventional observations as CTRL in domain 1 along with the satellite radiance data that were obtained from AMSU-A and MHS. The radiance data were assimilated in RMAPS through the community radiative transfer model (CRTM) that was incorporated within the WRFDA [24,35]. Satellite radiance observations within 1.5 h of each analysis time were also taken for assimilation every 3 h in the system. For both experiments, two partially-cycling analysis/forecast runs were conducted at an interval of 24 h. Each partially-cycling run began at 1800 UTC, which was 6 h earlier than the synoptic times (0000 UTC next day), and then 3 h analysis updates and 24 h cycling forecasts were obtained using the previous cycle’s characteristics as the background.
3.2. Data Quality Control
One of the most important aspects of this type of data assimilation is the monitoring of the observation quality in which the data are being assimilated. Various errors that are associated with satellite radiance data need to be treated correctly, such as cloud and precipitation simulation errors, systematic bias, and random errors of observations arising from the errors in numerical models and instruments. In this study, a series of quality control procedures were performed based on those that were available for assimilation systems that use satellite radiance data, including observation error statistics, limb adjustment, cloud detection, data thinning (with 120 km), and variational bias correction.
Figure 2 shows the brightness temperatures of channel 6 in AMSU-A and channel 3 in MHS from the satellite NOAA18 at the analysis time of 0000 UTC 20 July 2016. The coverage of all of the observations before quality control is shown in Figure 2a,b, which includes dense data. After all of the quality control procedures were performed, the number of retained observations was 751 for AMSU-A and 697 for MHS, as shown in Figure 2c,d, respectively. The proportions of data that were used which were really ingested in the data assimilation system was greatly reduced.
4. Results and Discussion
In this section, the results of assimilation experiments using RMAPS are described for the heavy rainfall that occurred over North China during 19–20 July 2016. The description of the figures and the discussions of the results are included in this section.
4.1. Results
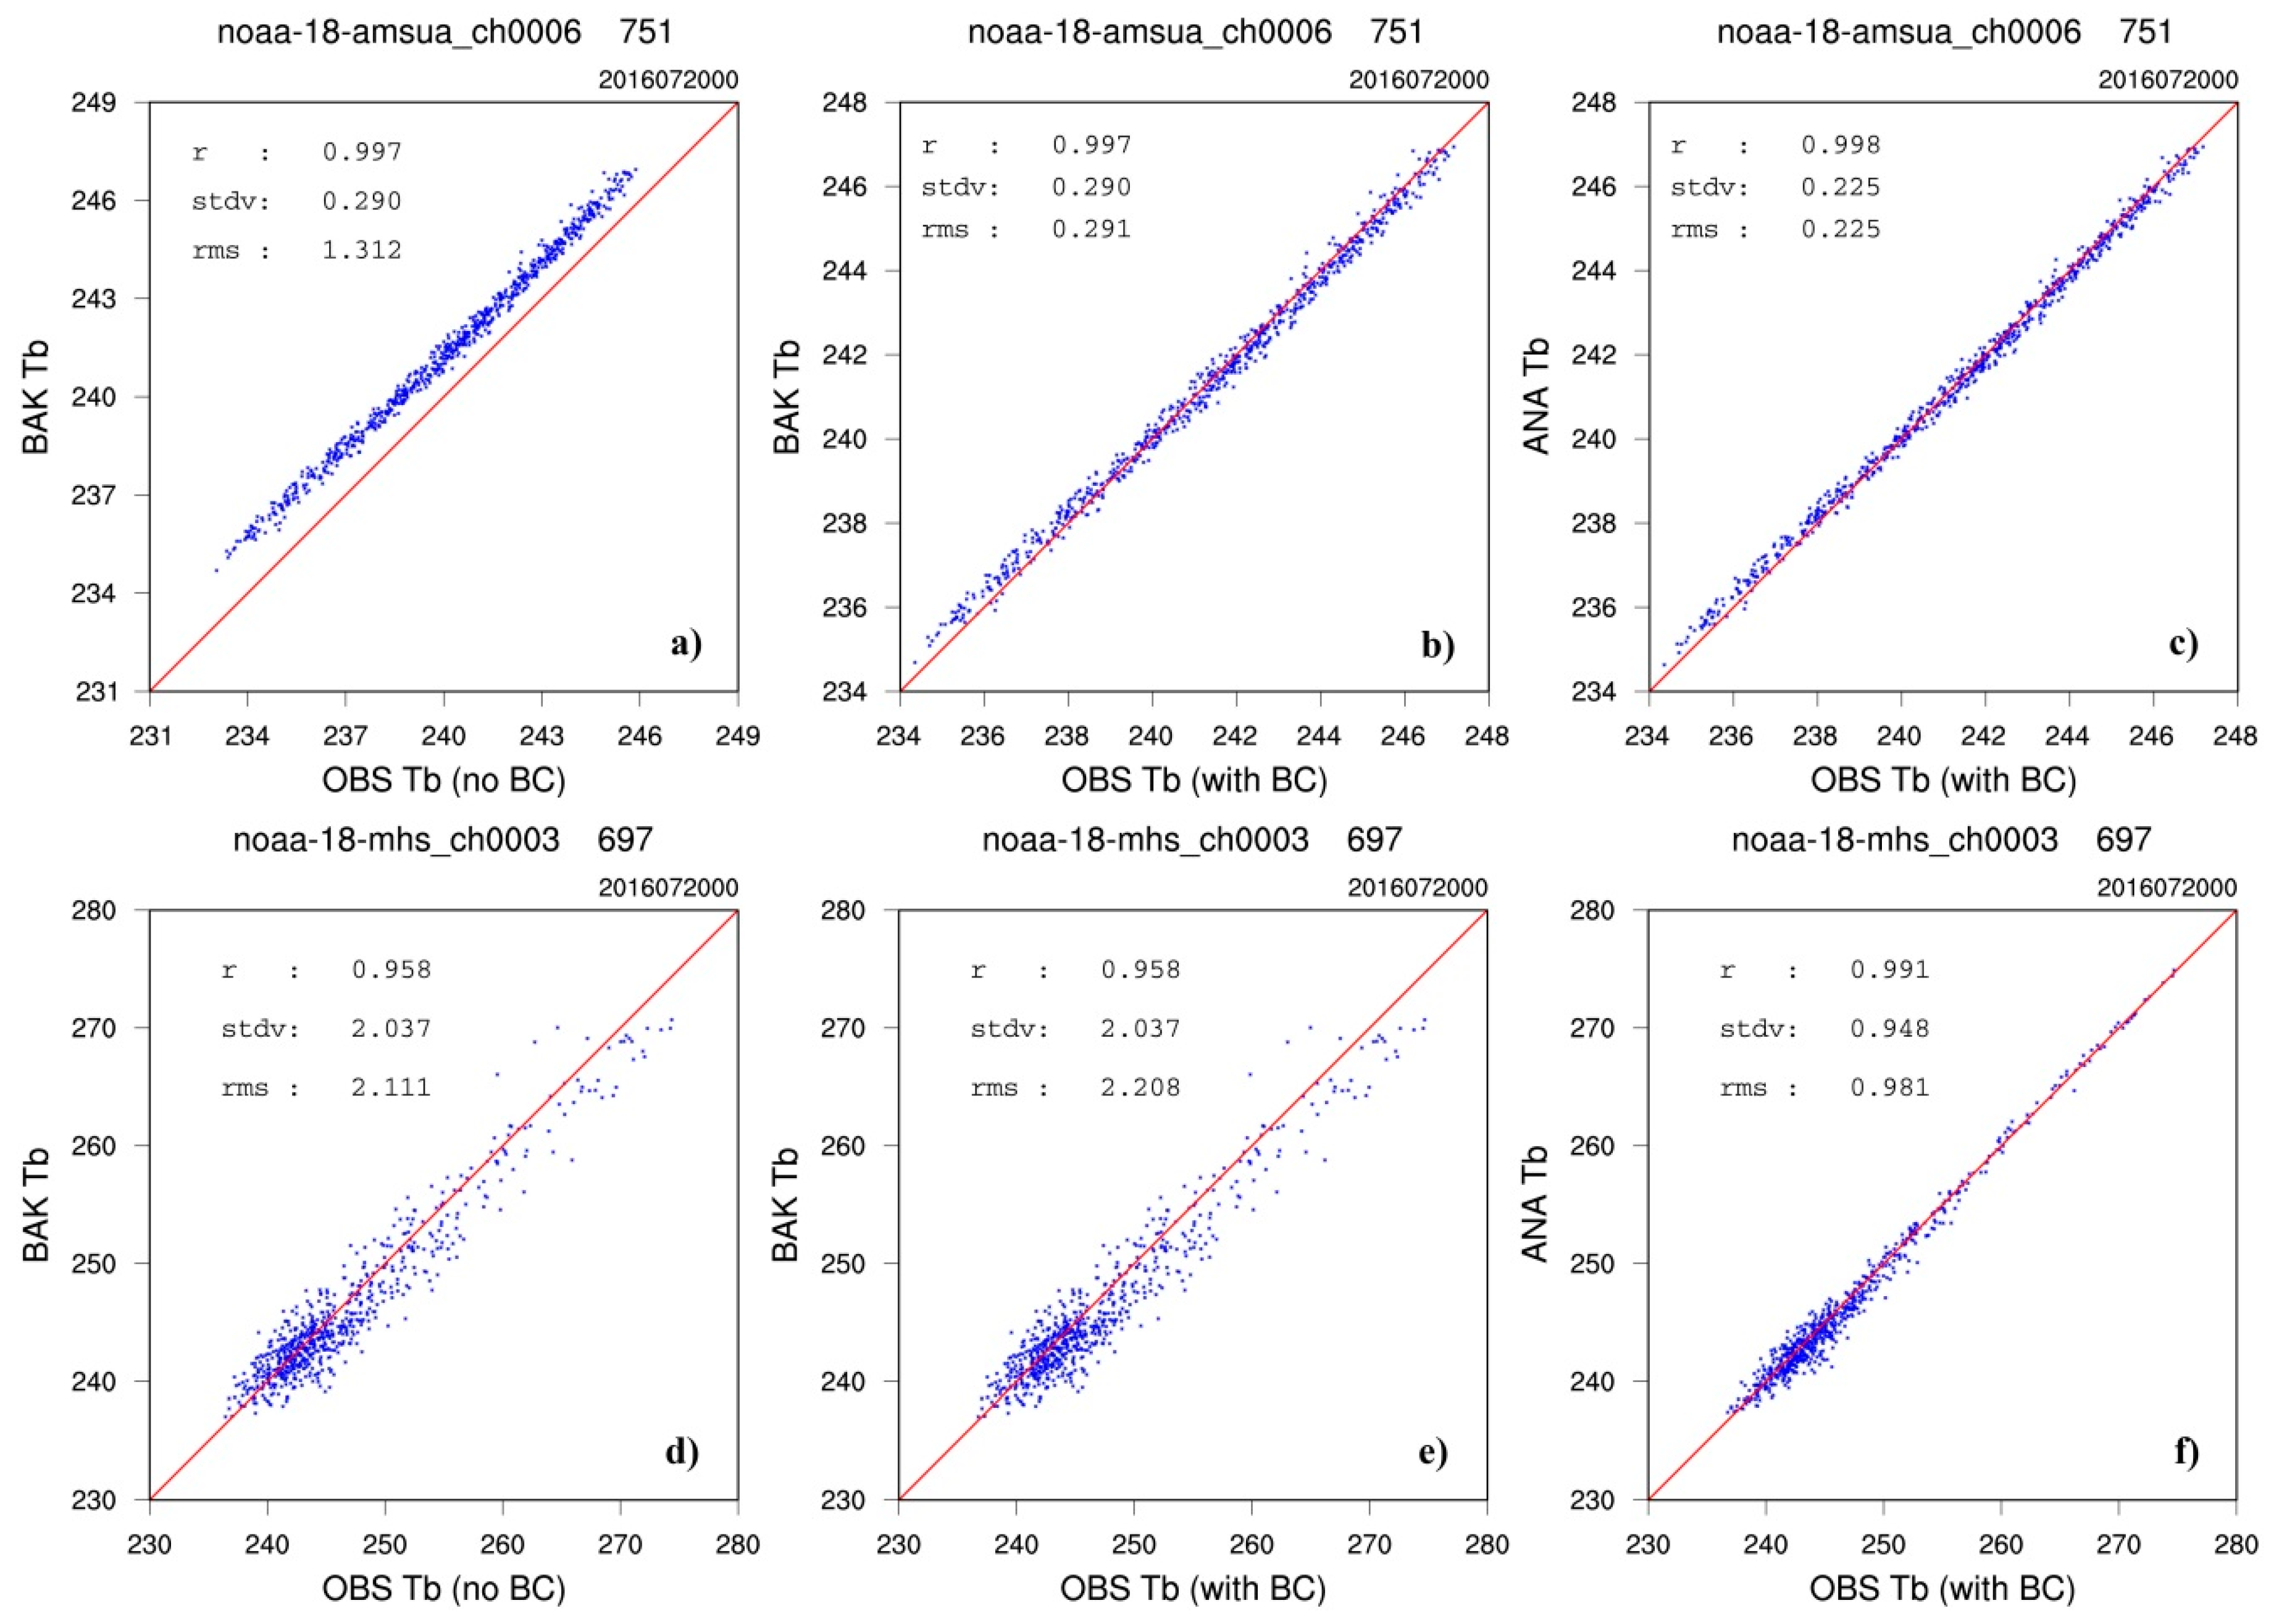
Radiance bias correction is crucial for properly assimilating satellite radiance data. Figure 3 shows the scatter plots of the observed (OBS) versus CRTM-calculated brightness temperatures for channel 6 of AMSU-A and channel 3 of MHS from NOAA18 at the analysis time 0000 UTC 20 July 2016. It can be seen that the root-mean-square error (RMSE) of background (BAK) with bias correction (BC) decreased from 1.312 to 0.291 (by about 78%) in comparison with the bias before correction (no BC) for channel 6 of AMSU-A. The RMSE of analysis (ANA) with radiance data assimilation was further reduced to 0.225 and the standard deviation (STDV) was also reduced from 0.290 to 0.225. The BAK RMSE with BC for channel 3 of MHS slightly increased. In comparison with the statistics of BAK after BC, the RMSE and STDV of ANA were reduced by approximately 55.6% and 53.5%, respectively. The correlation coefficients between the simulated brightness temperatures and the observations were both more than 0.995 for BAK and ANA of AMSU-A, which were higher than the corresponding values of MHS.
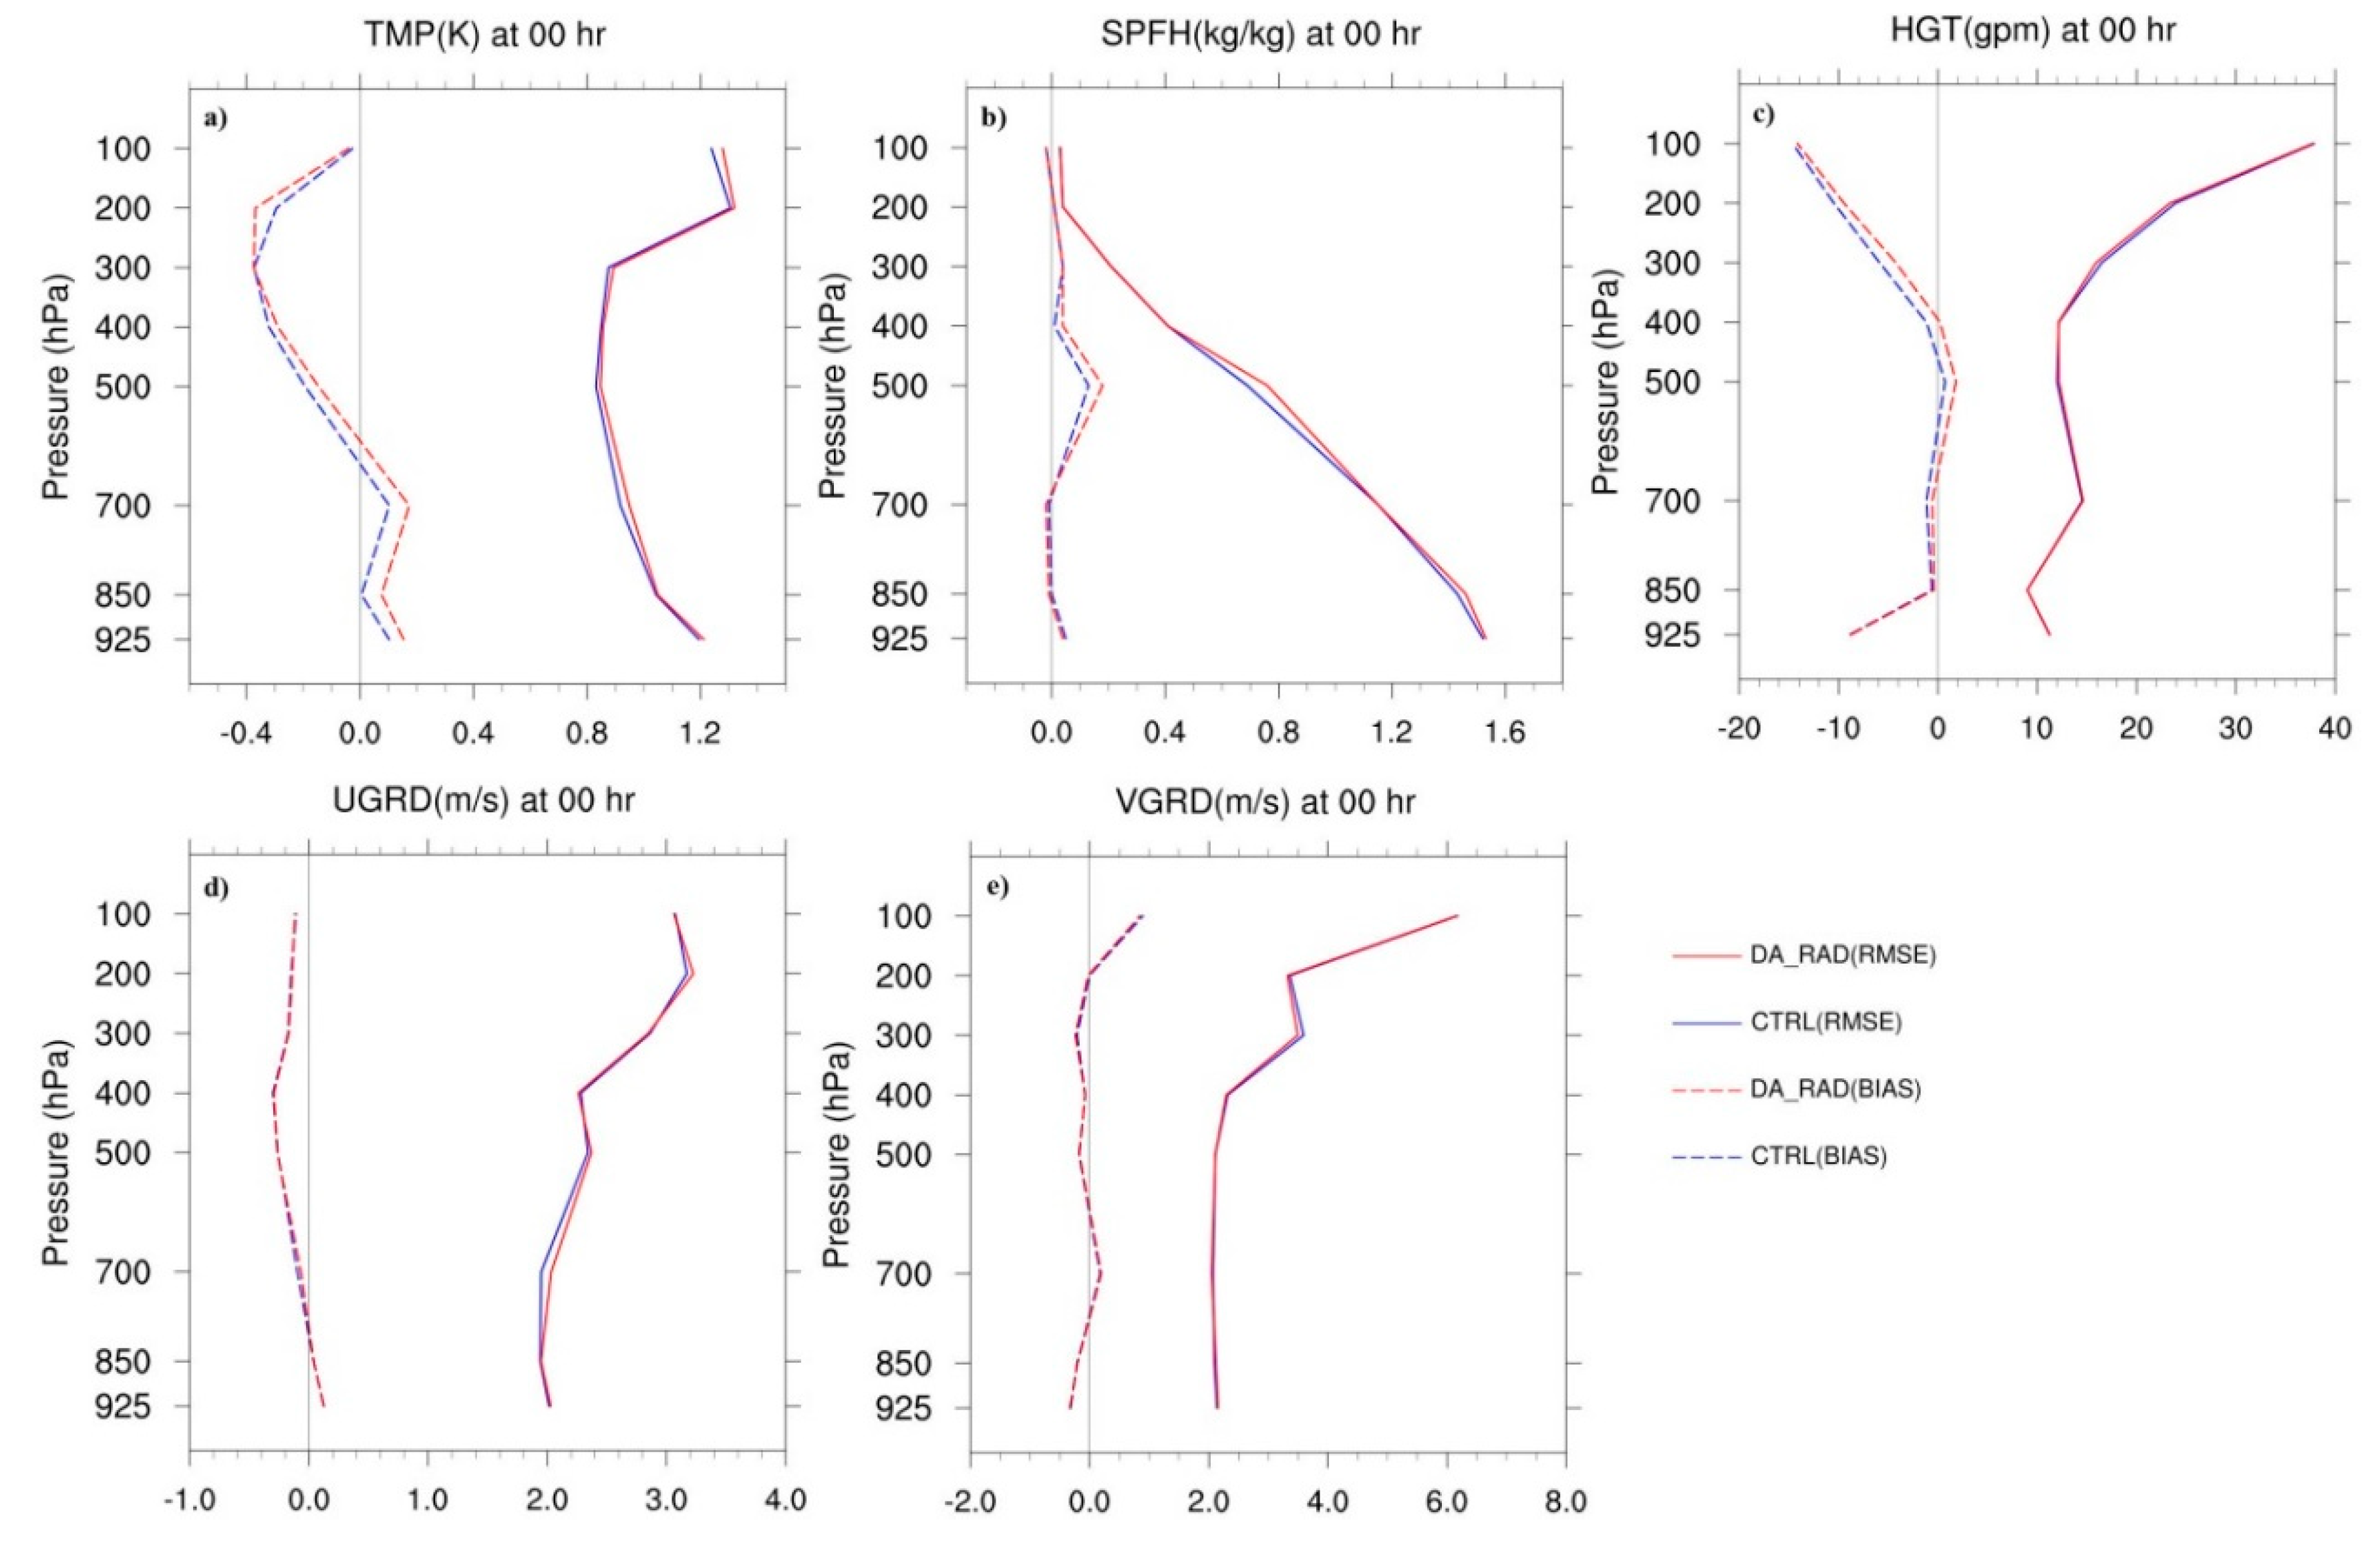
Figure 4 shows the vertical profiles of average bias (BIAS) and root-mean-square error (RMSE) at the analysis time 0000 UTC against conventional observations for temperature (TMP), specific humidity (SPFH), geopotential height (HGT), zonal (UGRD), and meridional (VGRD) wind. For temperature, the BIAS of the DA_RAD was smaller than that of the CTRL between 300 hPa and 600 hPa, however it increased in the upper and lower levels. For humidity, the BIAS and RMSE of DA_RAD were not reduced in comparison with the CTRL and even increased in the middle levels. For geopotential height, DA_RAD obtained a smaller BIAS in the upper and lower levels. For wind fields, the assimilation of satellite radiances had a little impact, with only a slight decrease found for BIAS at 700 hPa and at 300 hPa for RMSE. The assimilation of radiances reduced the bias of temperature in the middle levels, however it increased the bias and RMSE of the moisture fields. Radiance assimilation also showed an indirect positive impact on the geopotential height fields through multivariate correlations, however it showed little impact on wind fields.
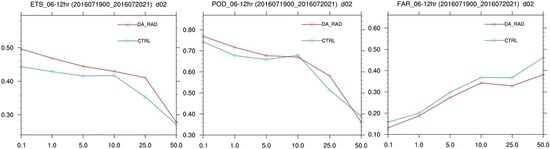
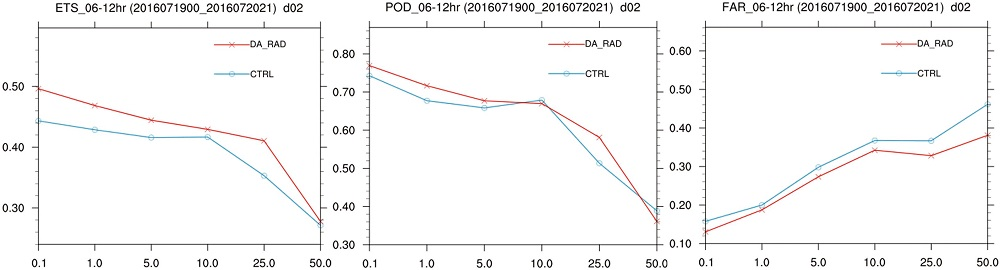
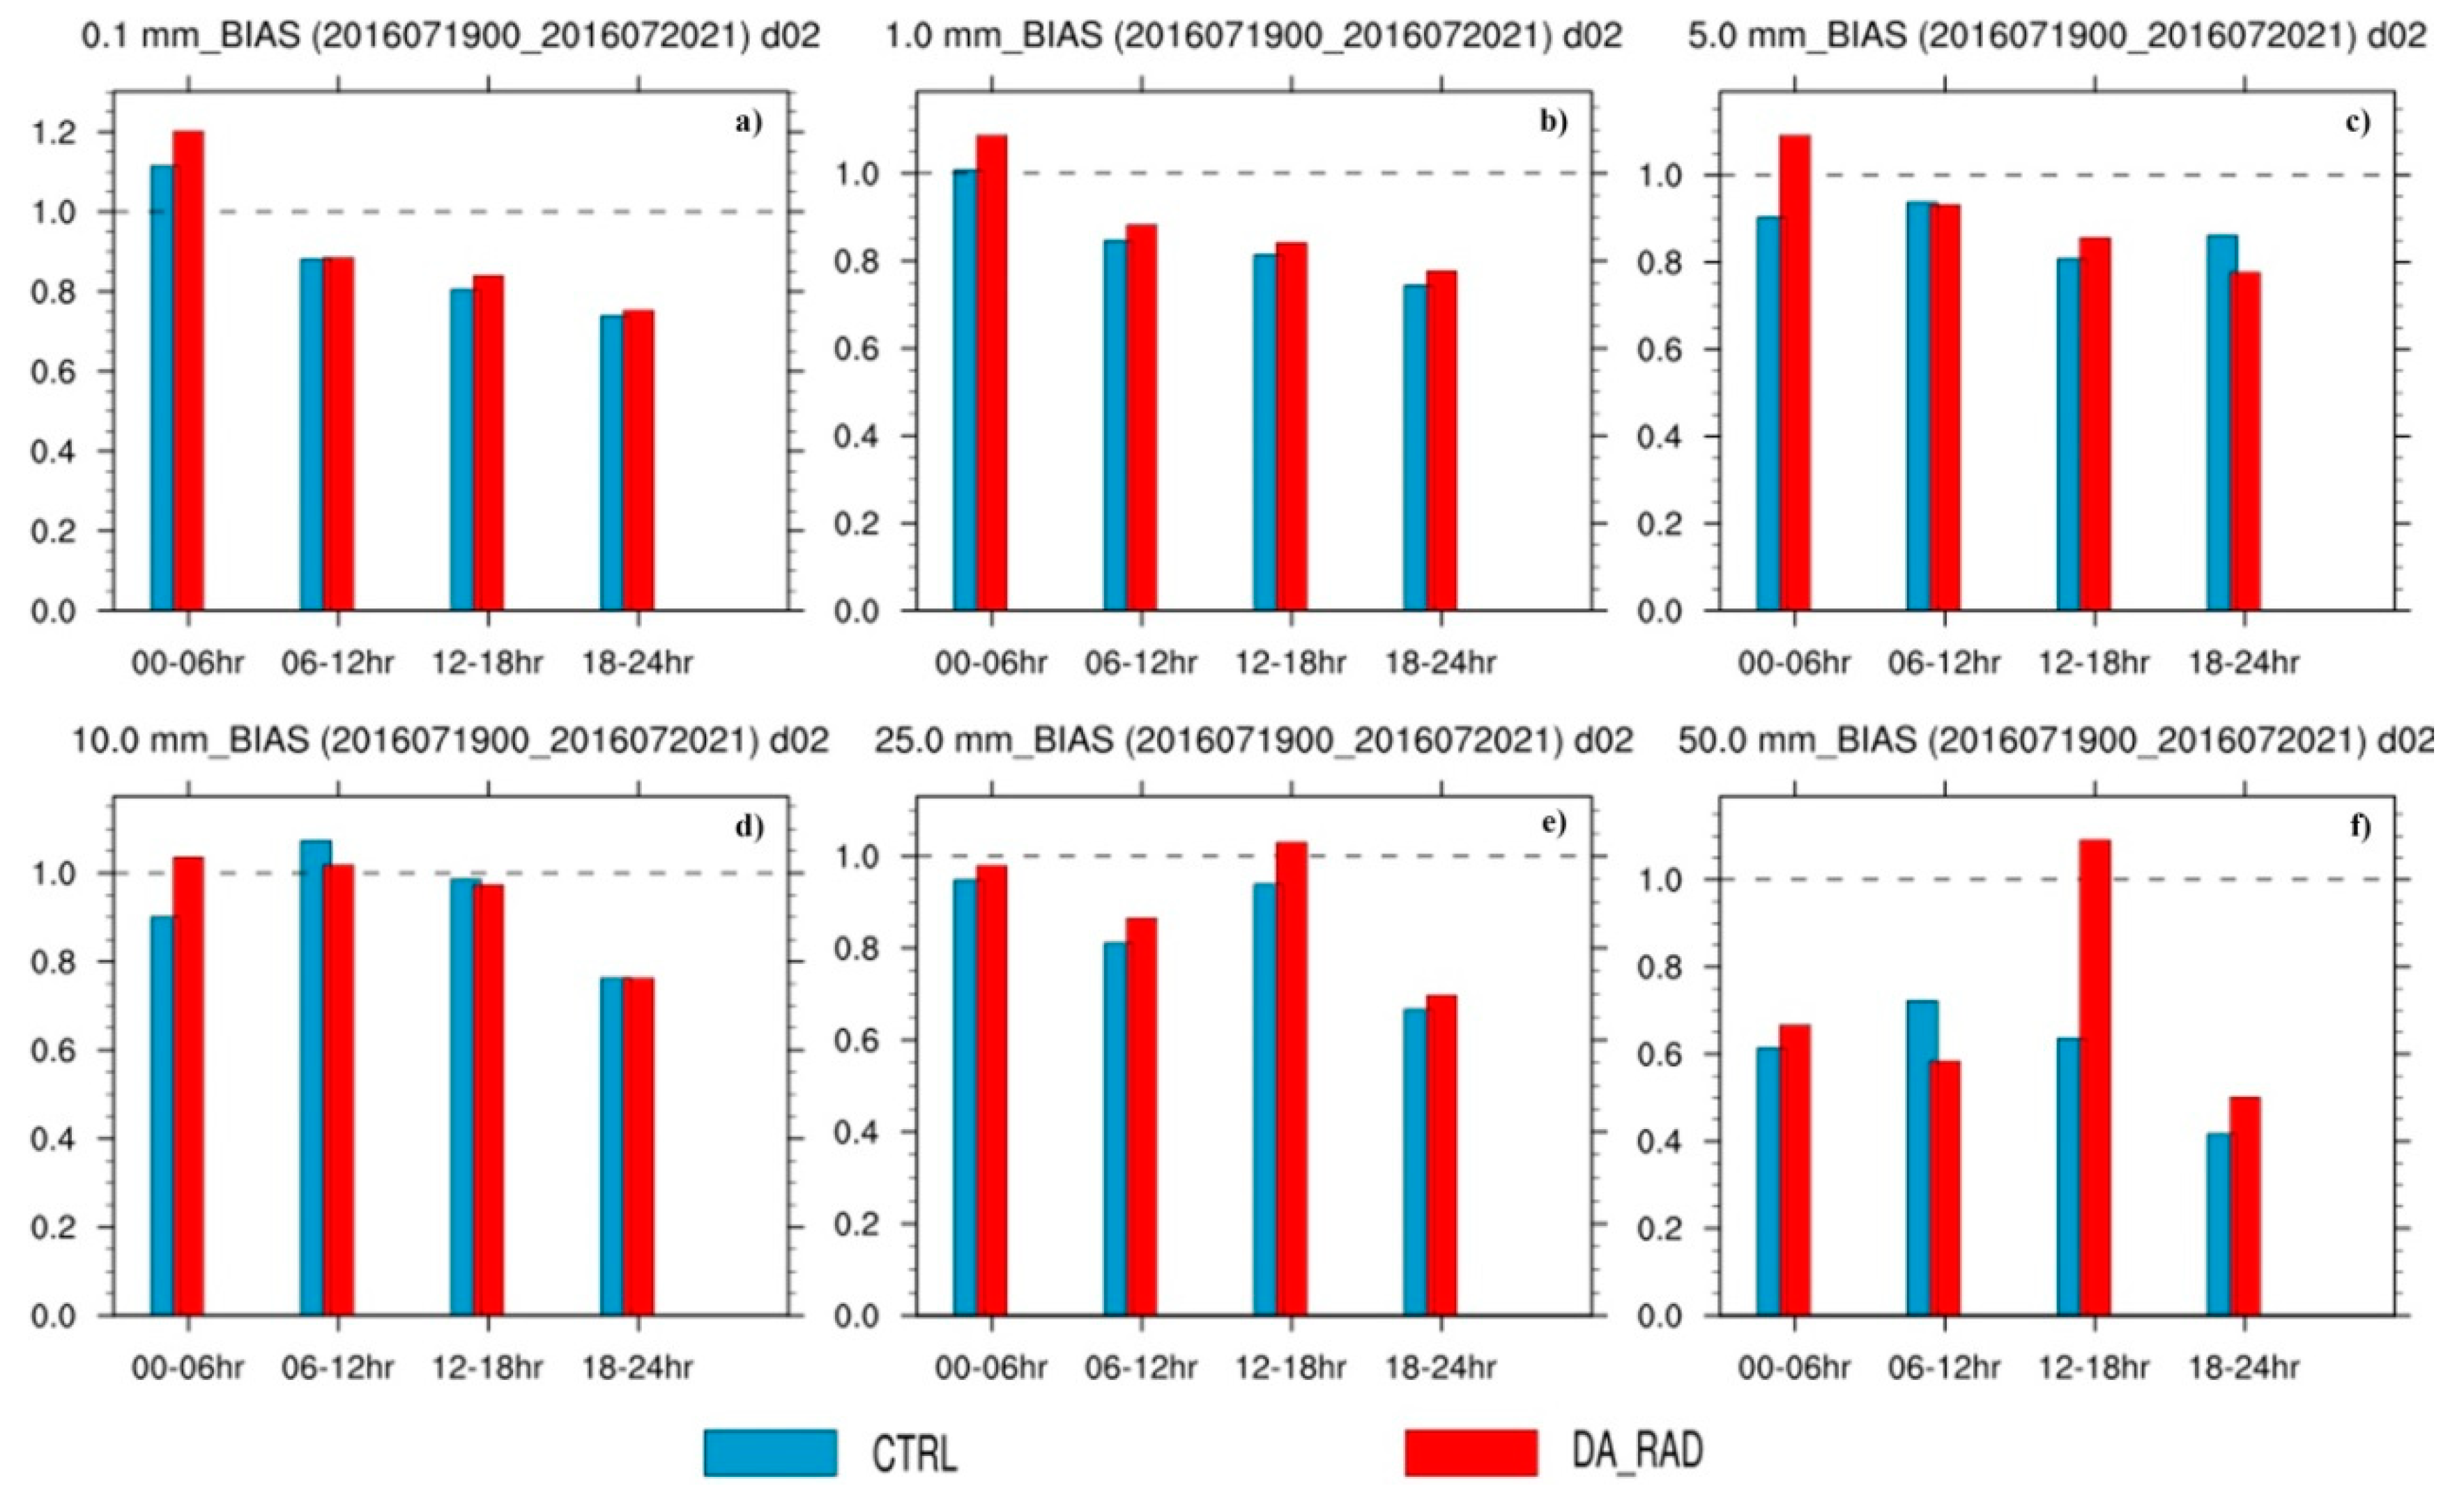
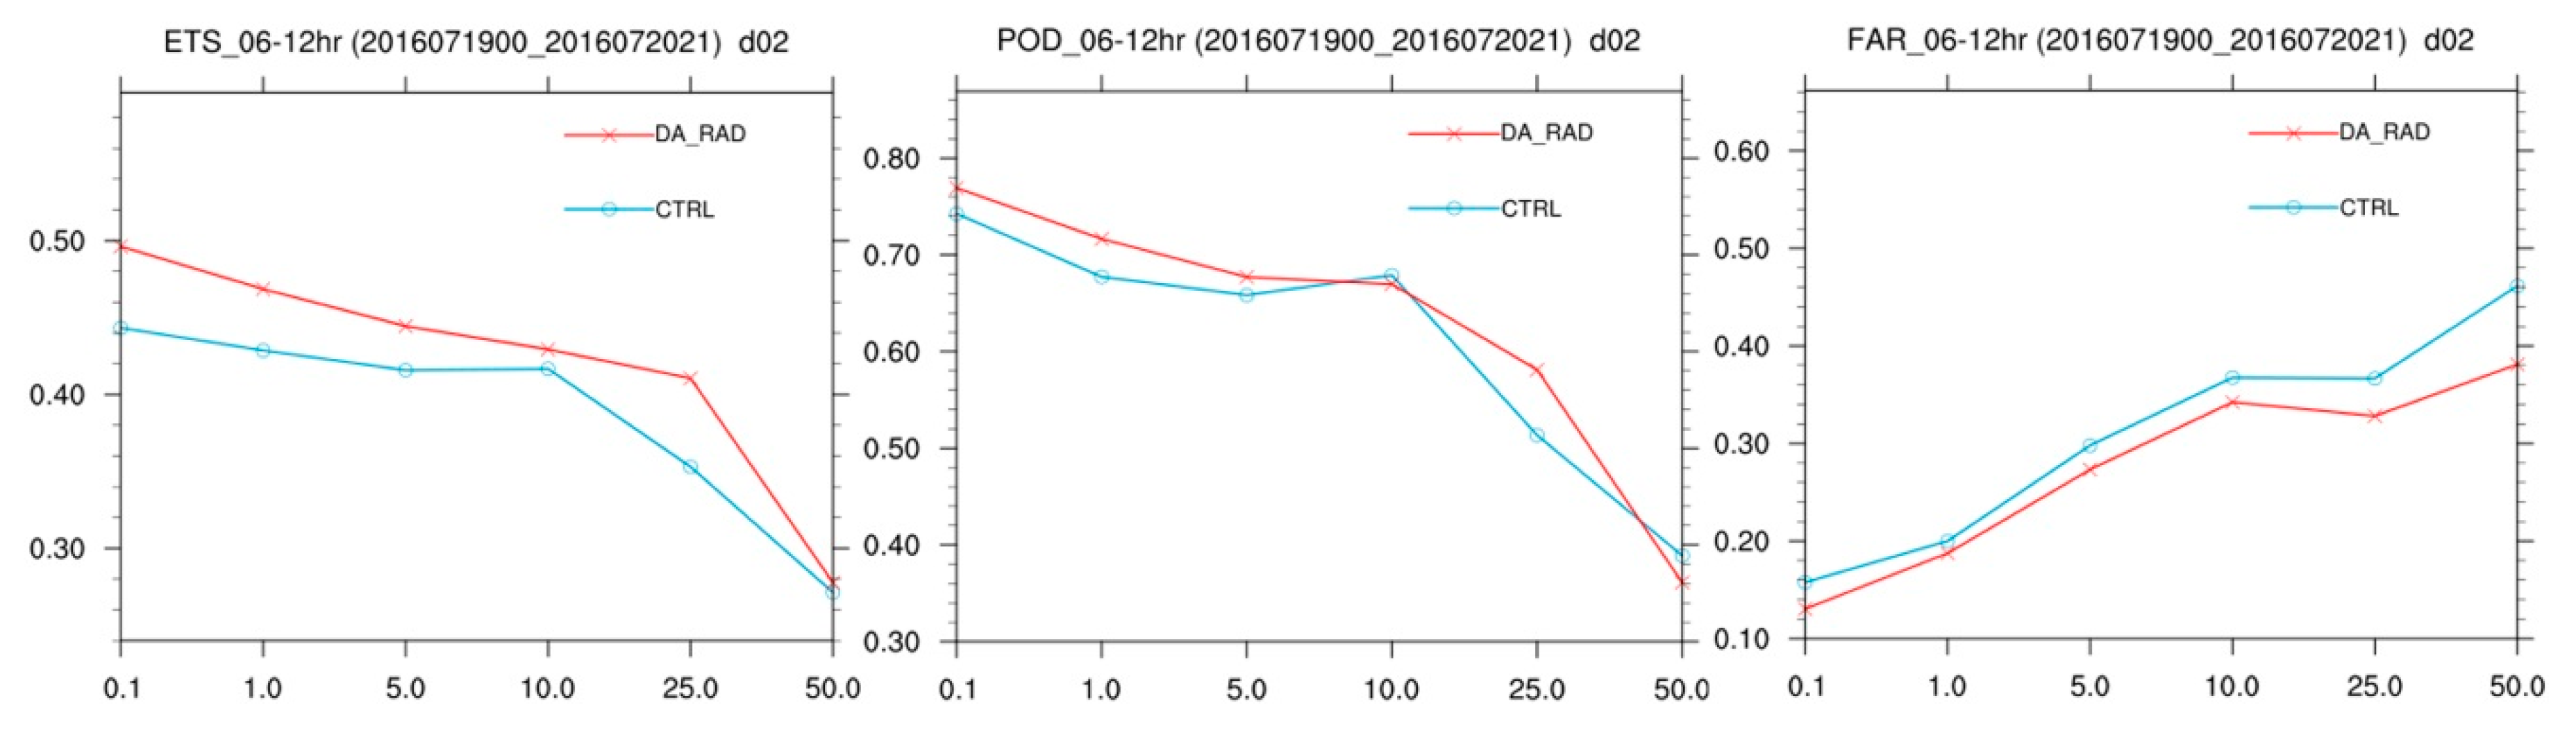
Rainfall observations from ground stations were used to verify the rainfall forecasts. The area of rainfall forecast verification was the domain of 3-km horizontal resolution over North China, as shown in Figure 1. The rainfall scores were aggregated over sixteen 24 h forecasts during the experimental period. Figure 5 shows the CSI scores of the rainfall forecasts for 6 h of accumulated precipitation with six different thresholds, i.e., 0.1, 1, 5, 10, 25, and 50 mm. Below the threshold of 25 mm after 6 h, the rainfall scores of the experiment DA_RAD were higher than that for the CTRL. In comparison with the CTRL, the average CSI score has been improved by 14.2% in DA_RAD for the threshold of 25 mm after 6 h. For the threshold of 50 mm, the average rainfall score of the DA_RAD displayed an improvement of 35.8% for the first 18 h forecast range, with a substantial increase appearing over the 12–18 h forecast range. In addition, the CSI scores of the DA_RAD were better than the CTRL during the 6–18 h period for all of the thresholds. Figure 6 gives the corresponding BIAS scores for the six thresholds, and the BIASs of DA_RAD were all above 1.0 but below the threshold of 10 mm for the first 6 h, which is indicative of an over-prediction. In comparison with the CTRL, the BIASs of the DA_RAD were closer to 1.0 for the threshold of 25 mm, which indicates an improvement for the under-prediction in the CTRL forecast. For the threshold of 50 mm, the BIAS value displayed an obvious increase over the 12–18 h period in the DA_RAD, which was much closer to 1.0 than the CTRL. The ETS, POD, and FAR indices provided more details for the accumulated rainfall over the 6–12 h of the forecasts, as shown in Figure 7. The results suggest that the ETS of the DA_RAD was higher than that of the CTRL for all of the thresholds. As the PODs indicated, the fraction of events that are correctly forecast in the DA_RAD was greater for all of the thresholds except for 10 mm in comparison with the CTRL. Meanwhile, the fraction of false alarms in the DA_RAD was less than that of the CTRL, as the FARs indicated.
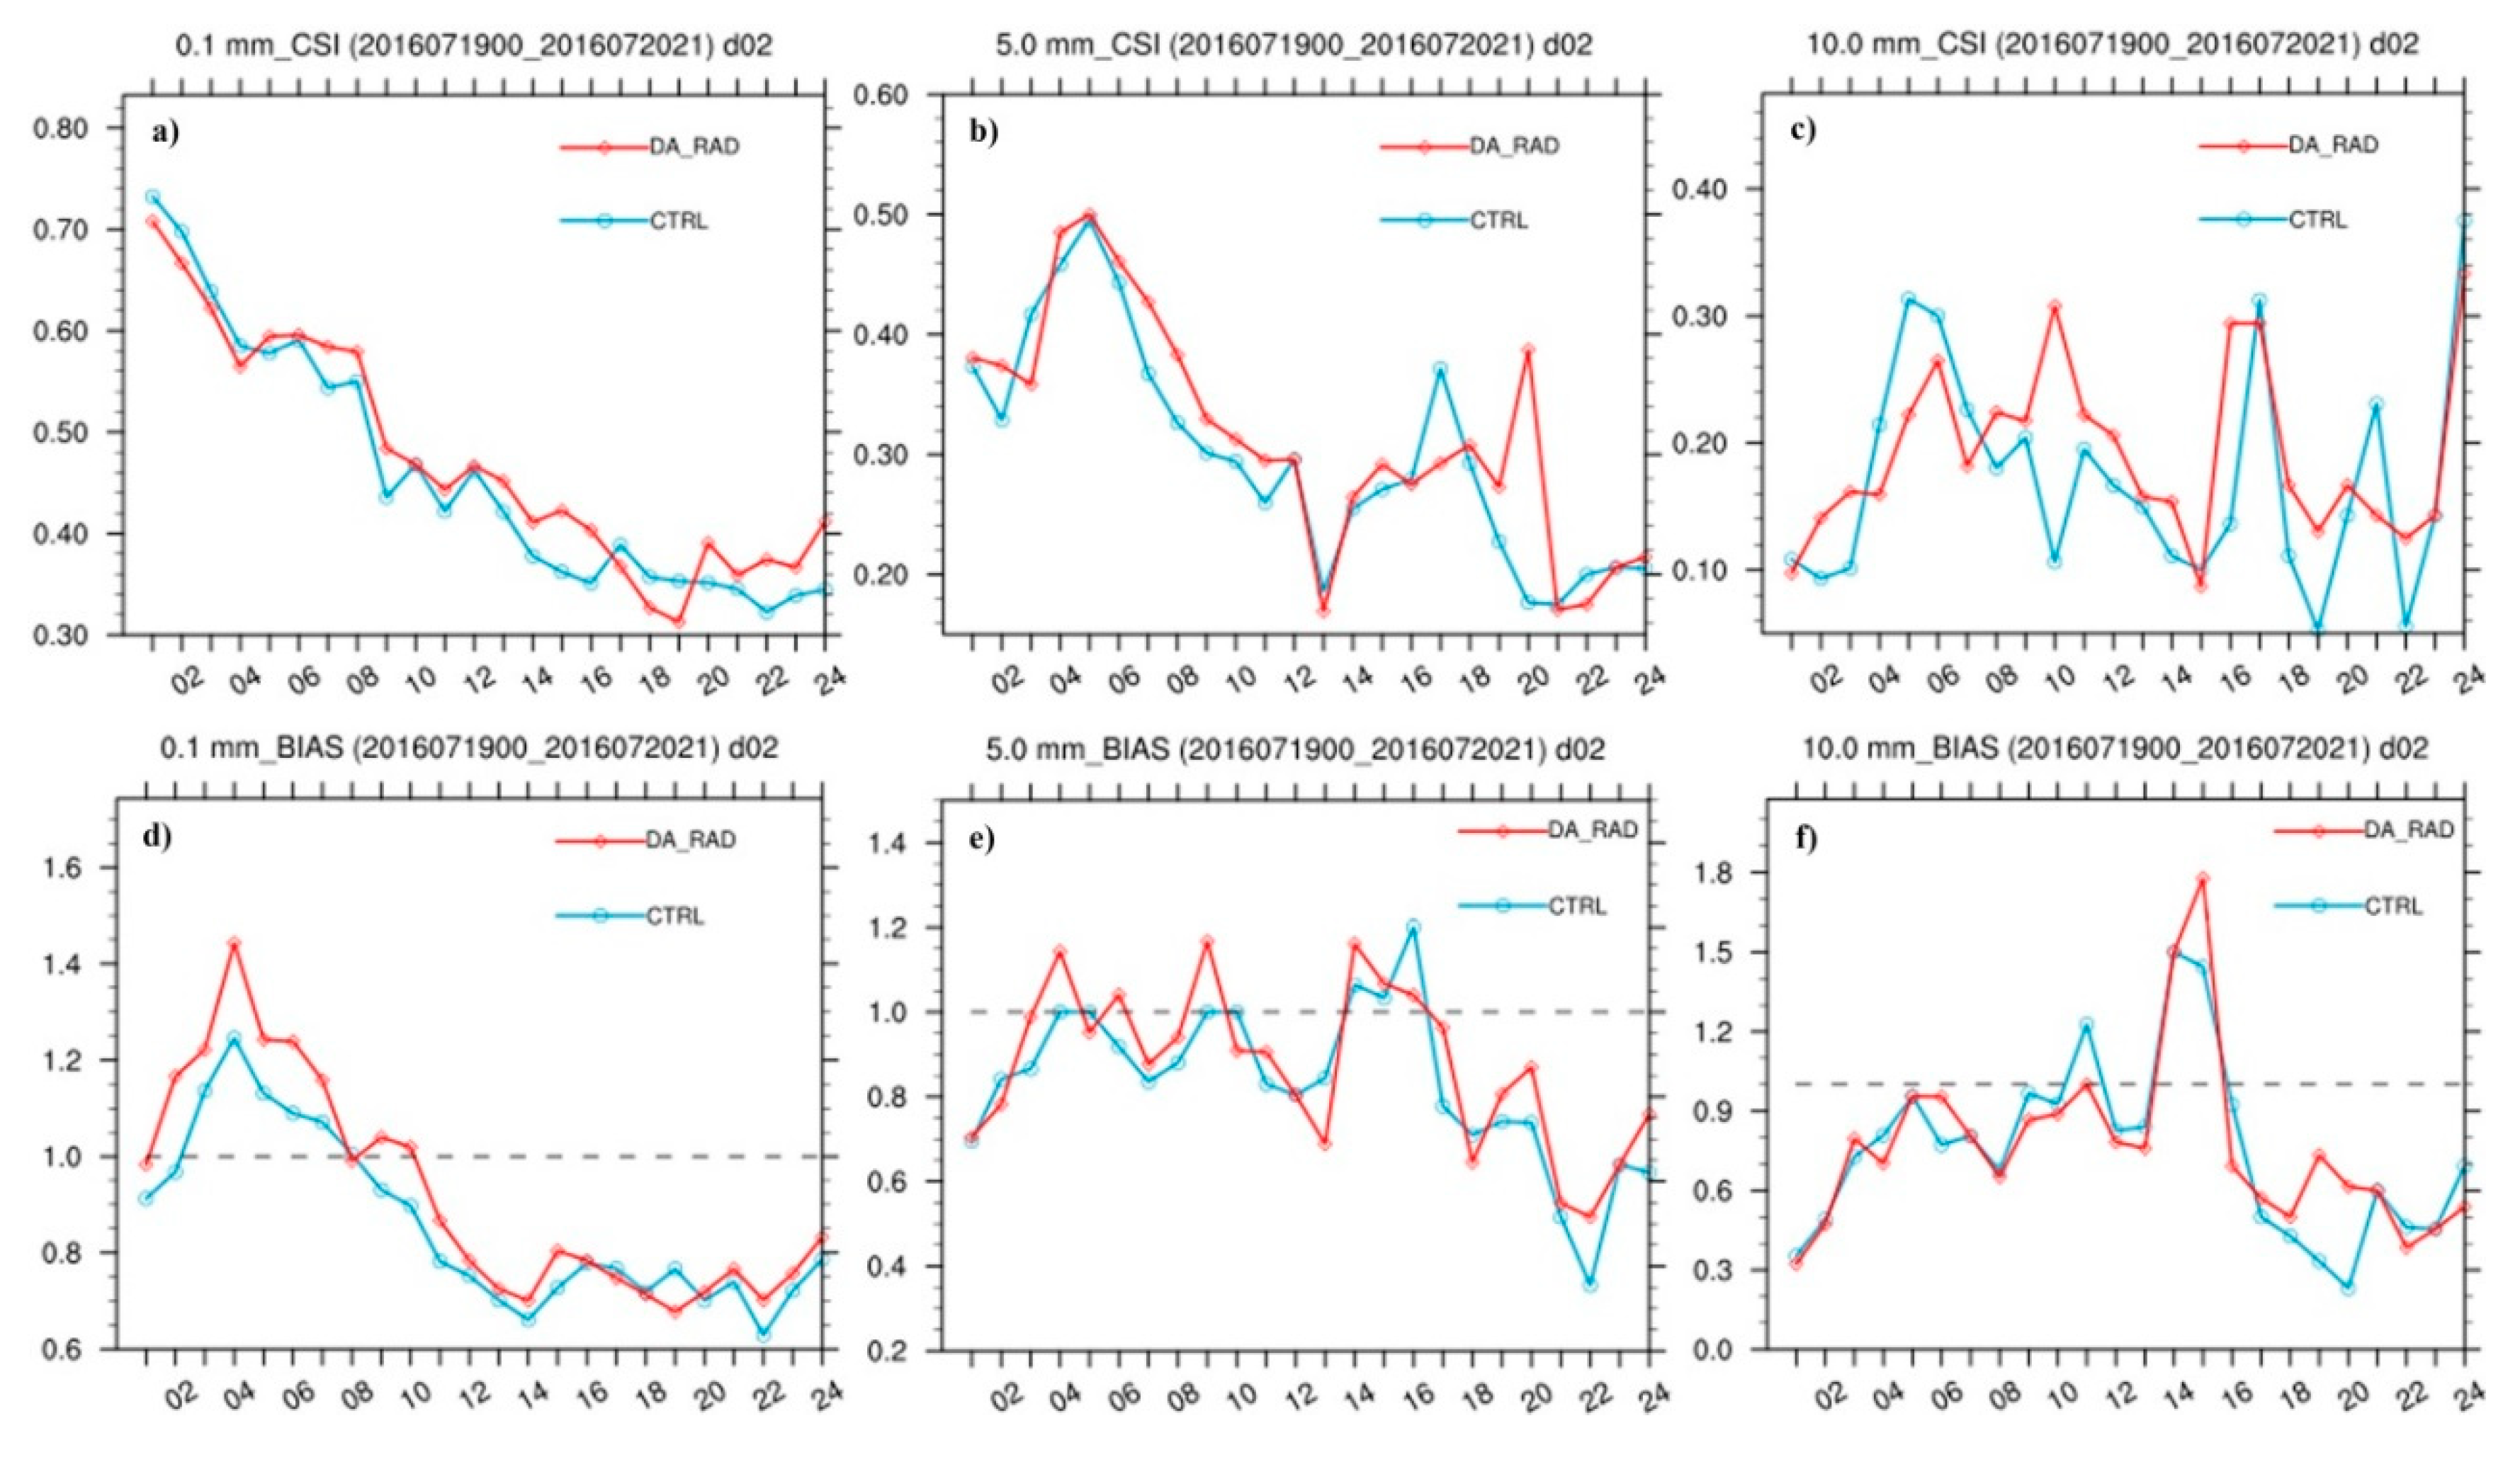
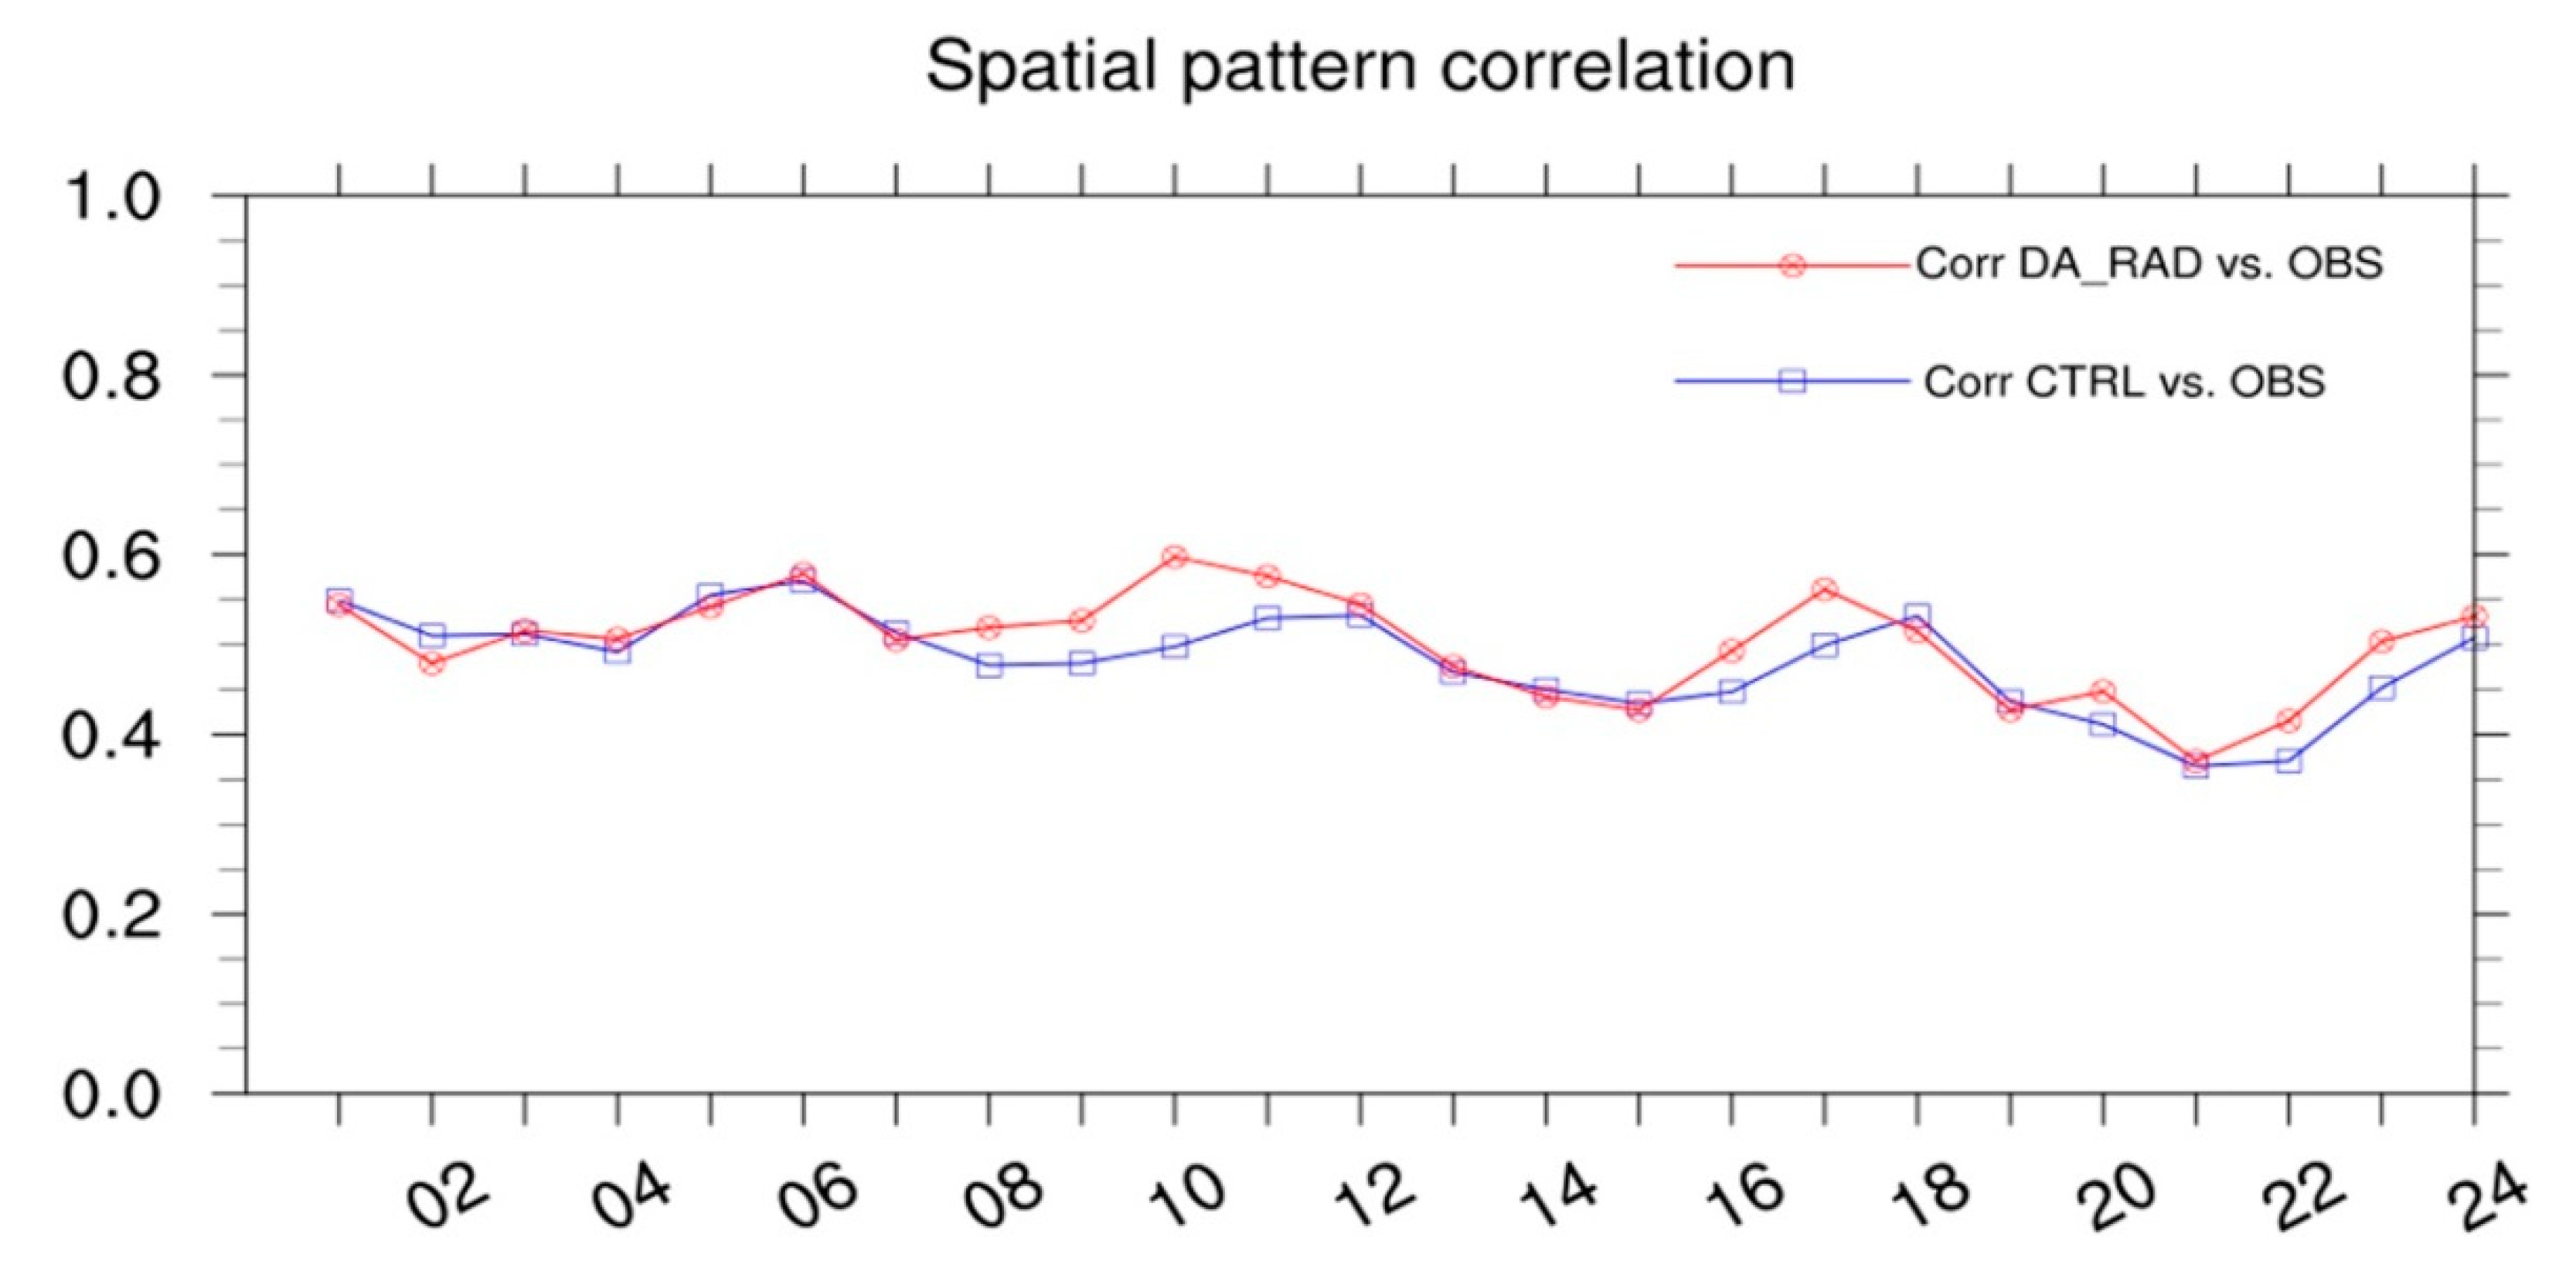
Figure 8 presents the rainfall forecast scores CSI and BIAS for hourly accumulated precipitation with thresholds of 0.1, 5, and 10 mm. The CSI scores of the experiment DA_RAD were slightly higher than the CTRL between 6 and 16 h for the threshold of 0.1 mm. The rainfall in the CTRL was underestimated between 8 and 16 h, which was improved in the DA_RAD. For the threshold of 5 mm, there was an improvement in the CSI scores of the DA_RAD between 6 and 12 h in comparison with that of the CTR. For the 10 mm threshold, the rainfall scores of the DA_RAD were better than the CTRL between 8 and 14 h. The BIAS score differences between the two experiments were small before 12 h for the 5 and 10 mm thresholds. There was a positive impact of assimilating satellite radiances, reflected mainly on the rainfall forecast during the 6–12 h period. Based on the precipitation products of CMORPH, Figure 9 gives the spatial correlation of hourly precipitation between the forecasts and observations from 0000 UTC to 2400 UTC on 20 July 2016. It can be seen that the spatial correlation of precipitation from the DA_RAD forecast was higher than that of the CTRL most of the time after 6 h, especially over the period of 6–12 h.
4.2. Discussion
The results suggest that assimilating satellite radiance observations improved the rainfall score to a certain extent for the 19–20 July 2016 severe rainfall event over North China. For the 6 h accumulated precipitation, the rainfall scores of the DA_RAD experiment were better than the CTRL below the threshold of 25 mm after a 6 h run. For the threshold of 50 mm, the average rainfall score of the DA_RAD was substantially improved by 35.8% for the first 18 h, with most of that improvement associated with the period from 12 to 18 h. In addition, a positive impact of assimilating satellite radiance data on the rainfall scores was primarily found in the forecast range from 6 to 12 h.
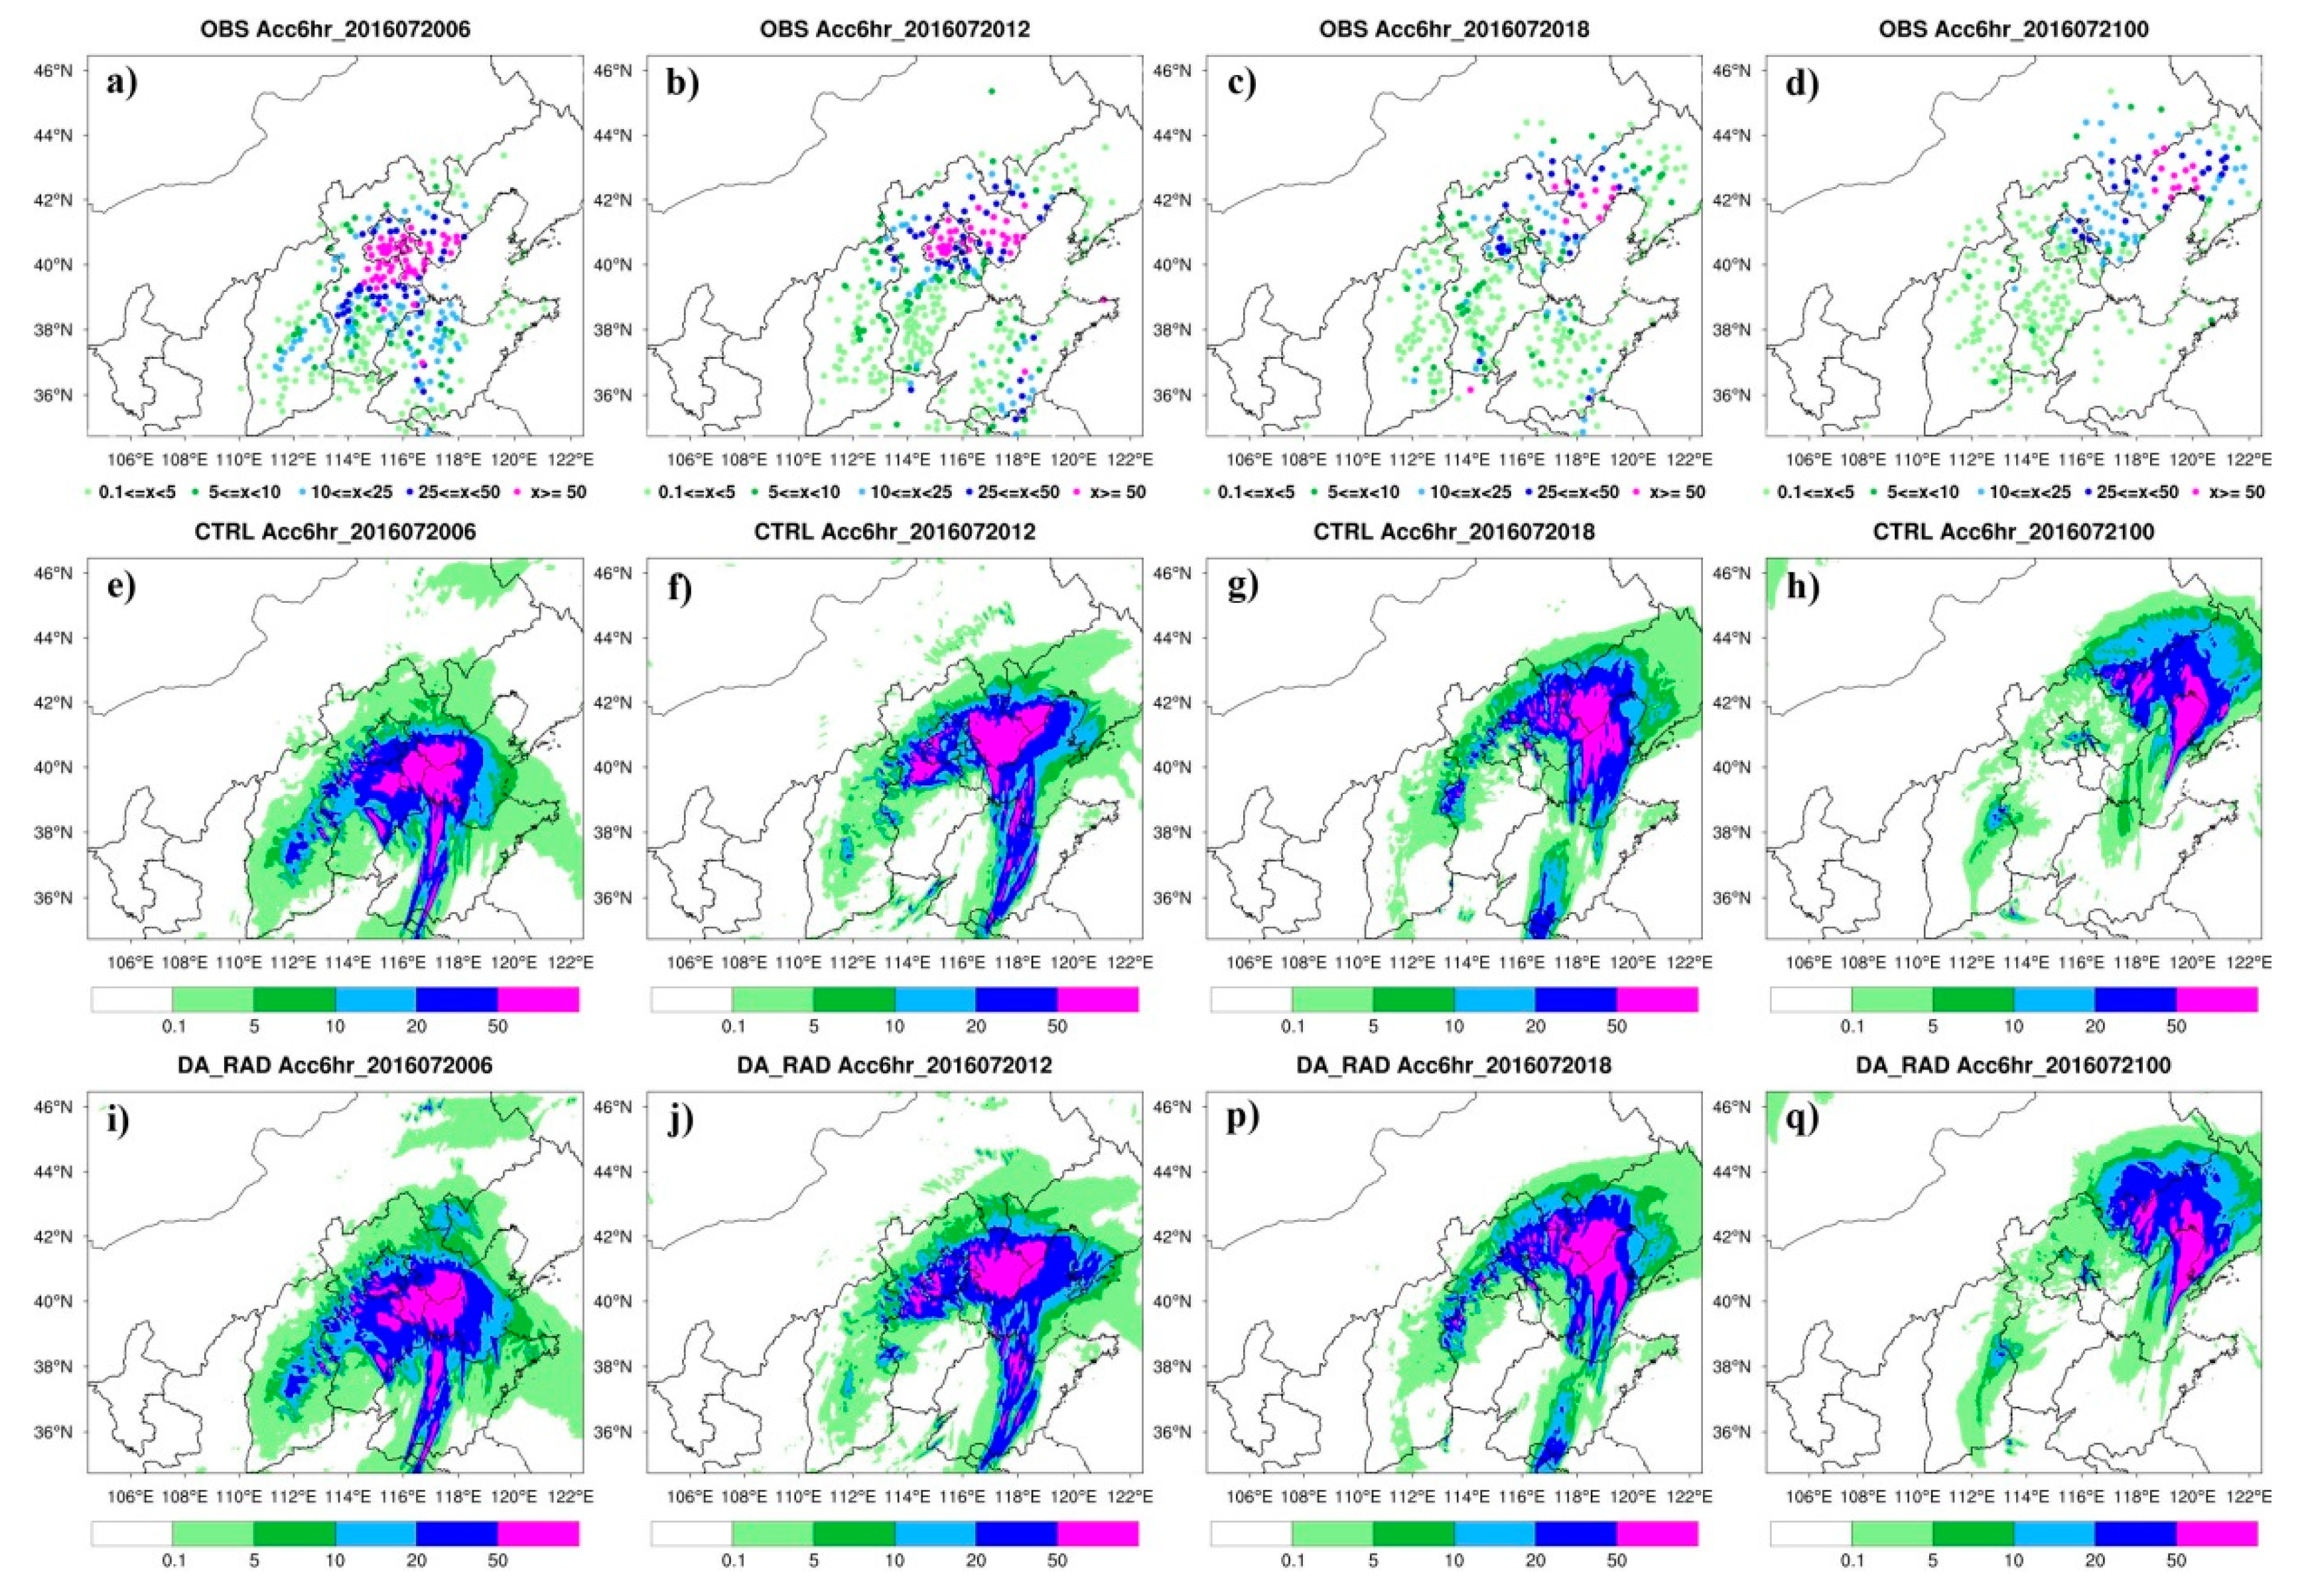
To further investigate and explain the results of forecast rainfall scores, Figure 10 gives the spatial distribution patterns of 6 h accumulated precipitation on 20 July 2016. The first line displays the location distributions and 6 h accumulated rainfall observations of the ground stations, which are used for the score skills. The spatial distributions of 6 h of accumulated precipitation from the CTRL and the DA_RAD forecasts are presented in the second and third lines, respectively. The heavy rainfall that was based on observations was primarily located in the south and southeast of Beijing for the first 6 h, whereas the high rainfall from the CTRL forecast primarily appeared southeast of Beijing. The spatial distribution pattern from the DA_RAD forecast was similar to the CTRL, however the scope of rainfall above 10 mm and the rainfall intensity south of Beijing increased. From 6–12 h, the high rainfall observations were concentrated in and to the east of Beijing, whereas the center of strong rainfall moved east of Beijing for both CTRL and DA_RAD. In comparison with CTRL, the scope of rainfall between 20 and 50 mm in the forecast of DA_RAD increased and slightly decreased above 50 mm. It was consistent with the BIAS scores that were presented in Figure 6. For 12–18 h, the center of heavy rainfall was located toward the northeast of Beijing for both the CTRL and the DA_RAD forecasts, which displayed a good agreement with the rainfall observations.
The forecast from the DA_RAD increased the scope of rainfall above 50 mm which hardly covered all of the corresponding observations, leading to an obvious increase in the CSI score in comparison with that of the CTRL. The heavy rainfall continued to move toward east and weakened after 18 h in both CTRL and DA_RAD experiments, which covered parts of the sea. During this period, the rainfall observations above 50 mm were mainly located in the northeast and the rainfall score was greatly influenced by the spatial distribution and the number of observation sites. Although satellite radiance data were shown to increase the heavy rainfall forecast score over a relatively data-rich area, the spatial distribution pattern and the location of strong rainfall changed slightly.
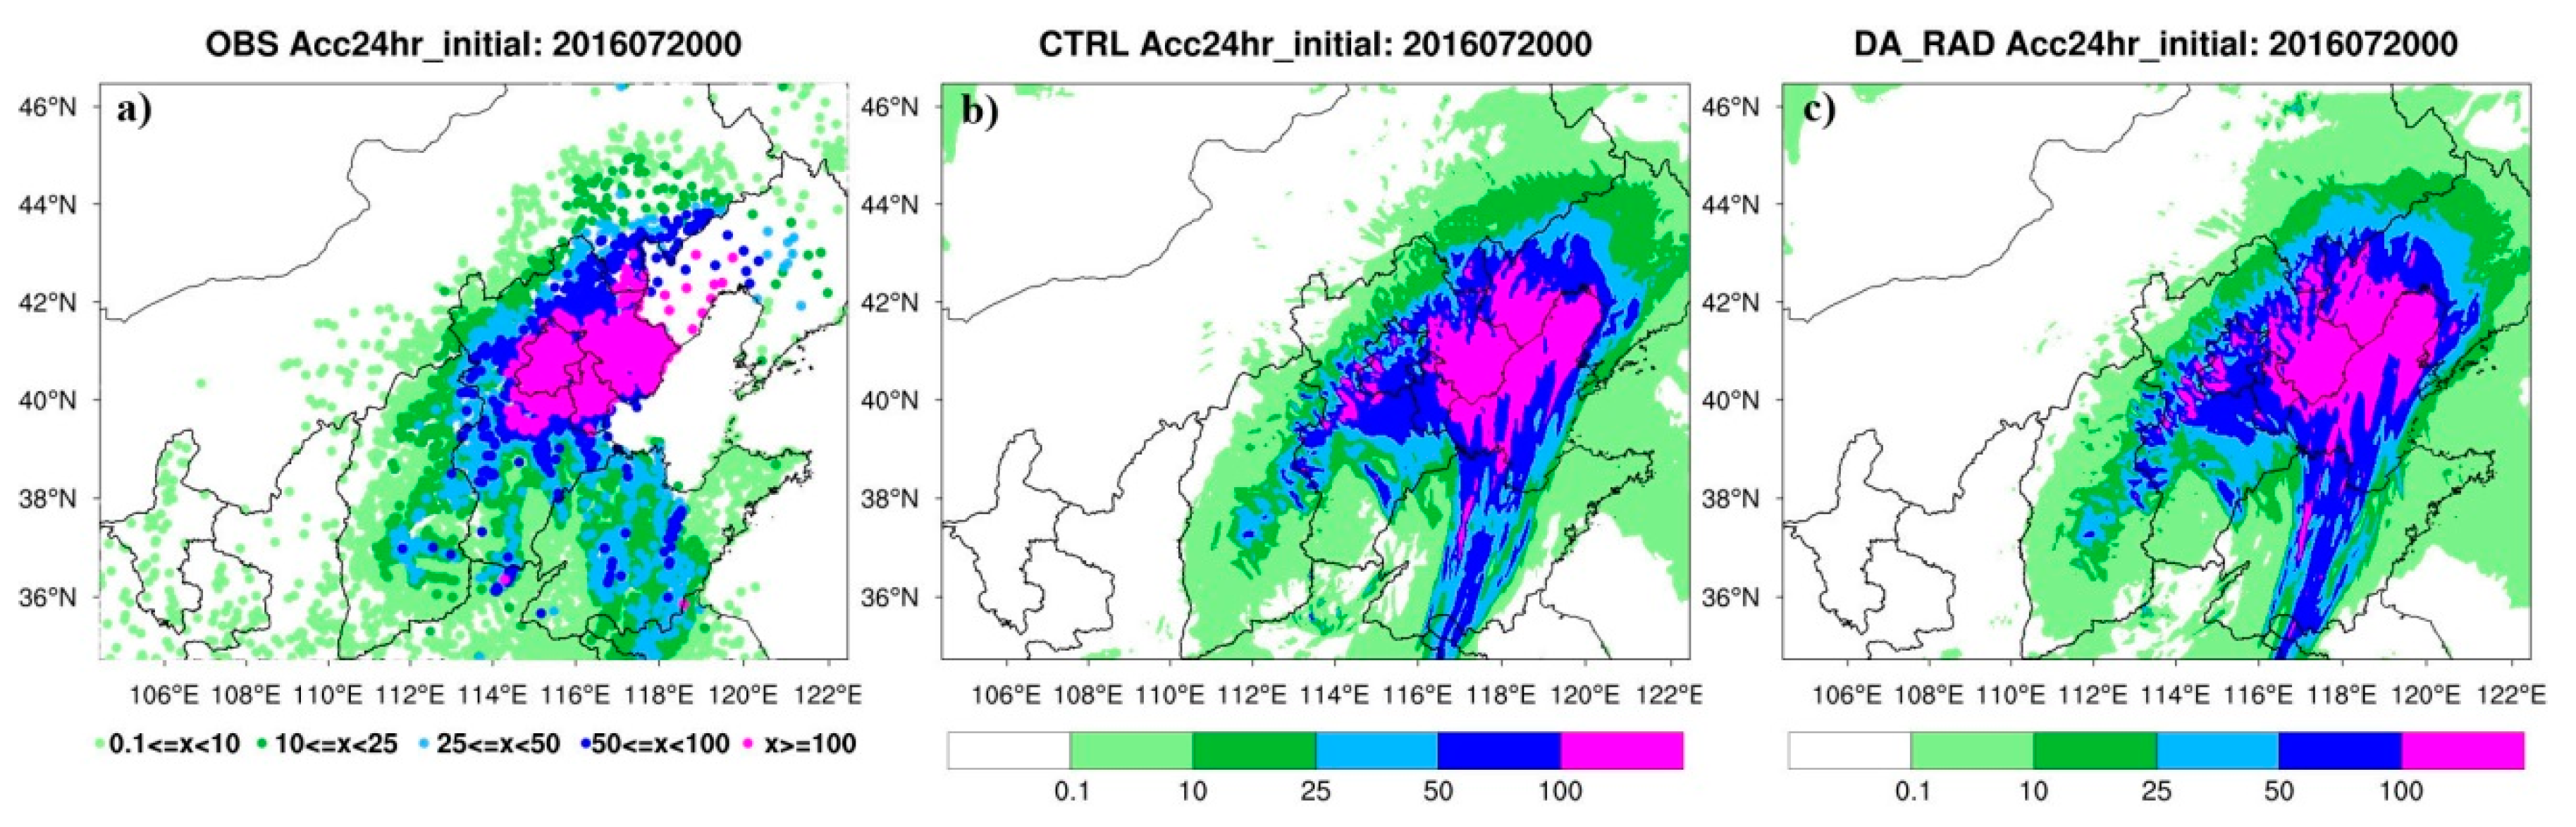
Figure 11 shows the spatial distribution patterns of 24 h of accumulated precipitation on 20 July 2016 for observations and forecasts of the CTRL and the DA_RAD. An obvious difference in the location of heavy rainfall was found between forecasts and observations. The rainfall observations above 100 mm mainly covered Beijing and the area toward the northeast. For the CTRL experiment, the heavy rainfall above 100 mm was located in the east and northeast of Beijing, which did not cover the Beijing area. Assimilation of satellite radiance data in the DA_RAD increased the scope of heavy rainfall, however the spatial distribution pattern of heavy rainfall was similar to that of the CTRL. Based on the precipitation products of CMORPH, Figure 12 gives the spatial distribution of the ME index between the forecasts and observations for hourly precipitation over the domain of 3-k horizontal resolution. ME spatial variability shows that the forecasts from DA_RAD and CTRL were both under-forecasted during the rainfall event, however the under-forecasted area in DA_RAD was smaller than that in the CTRL.
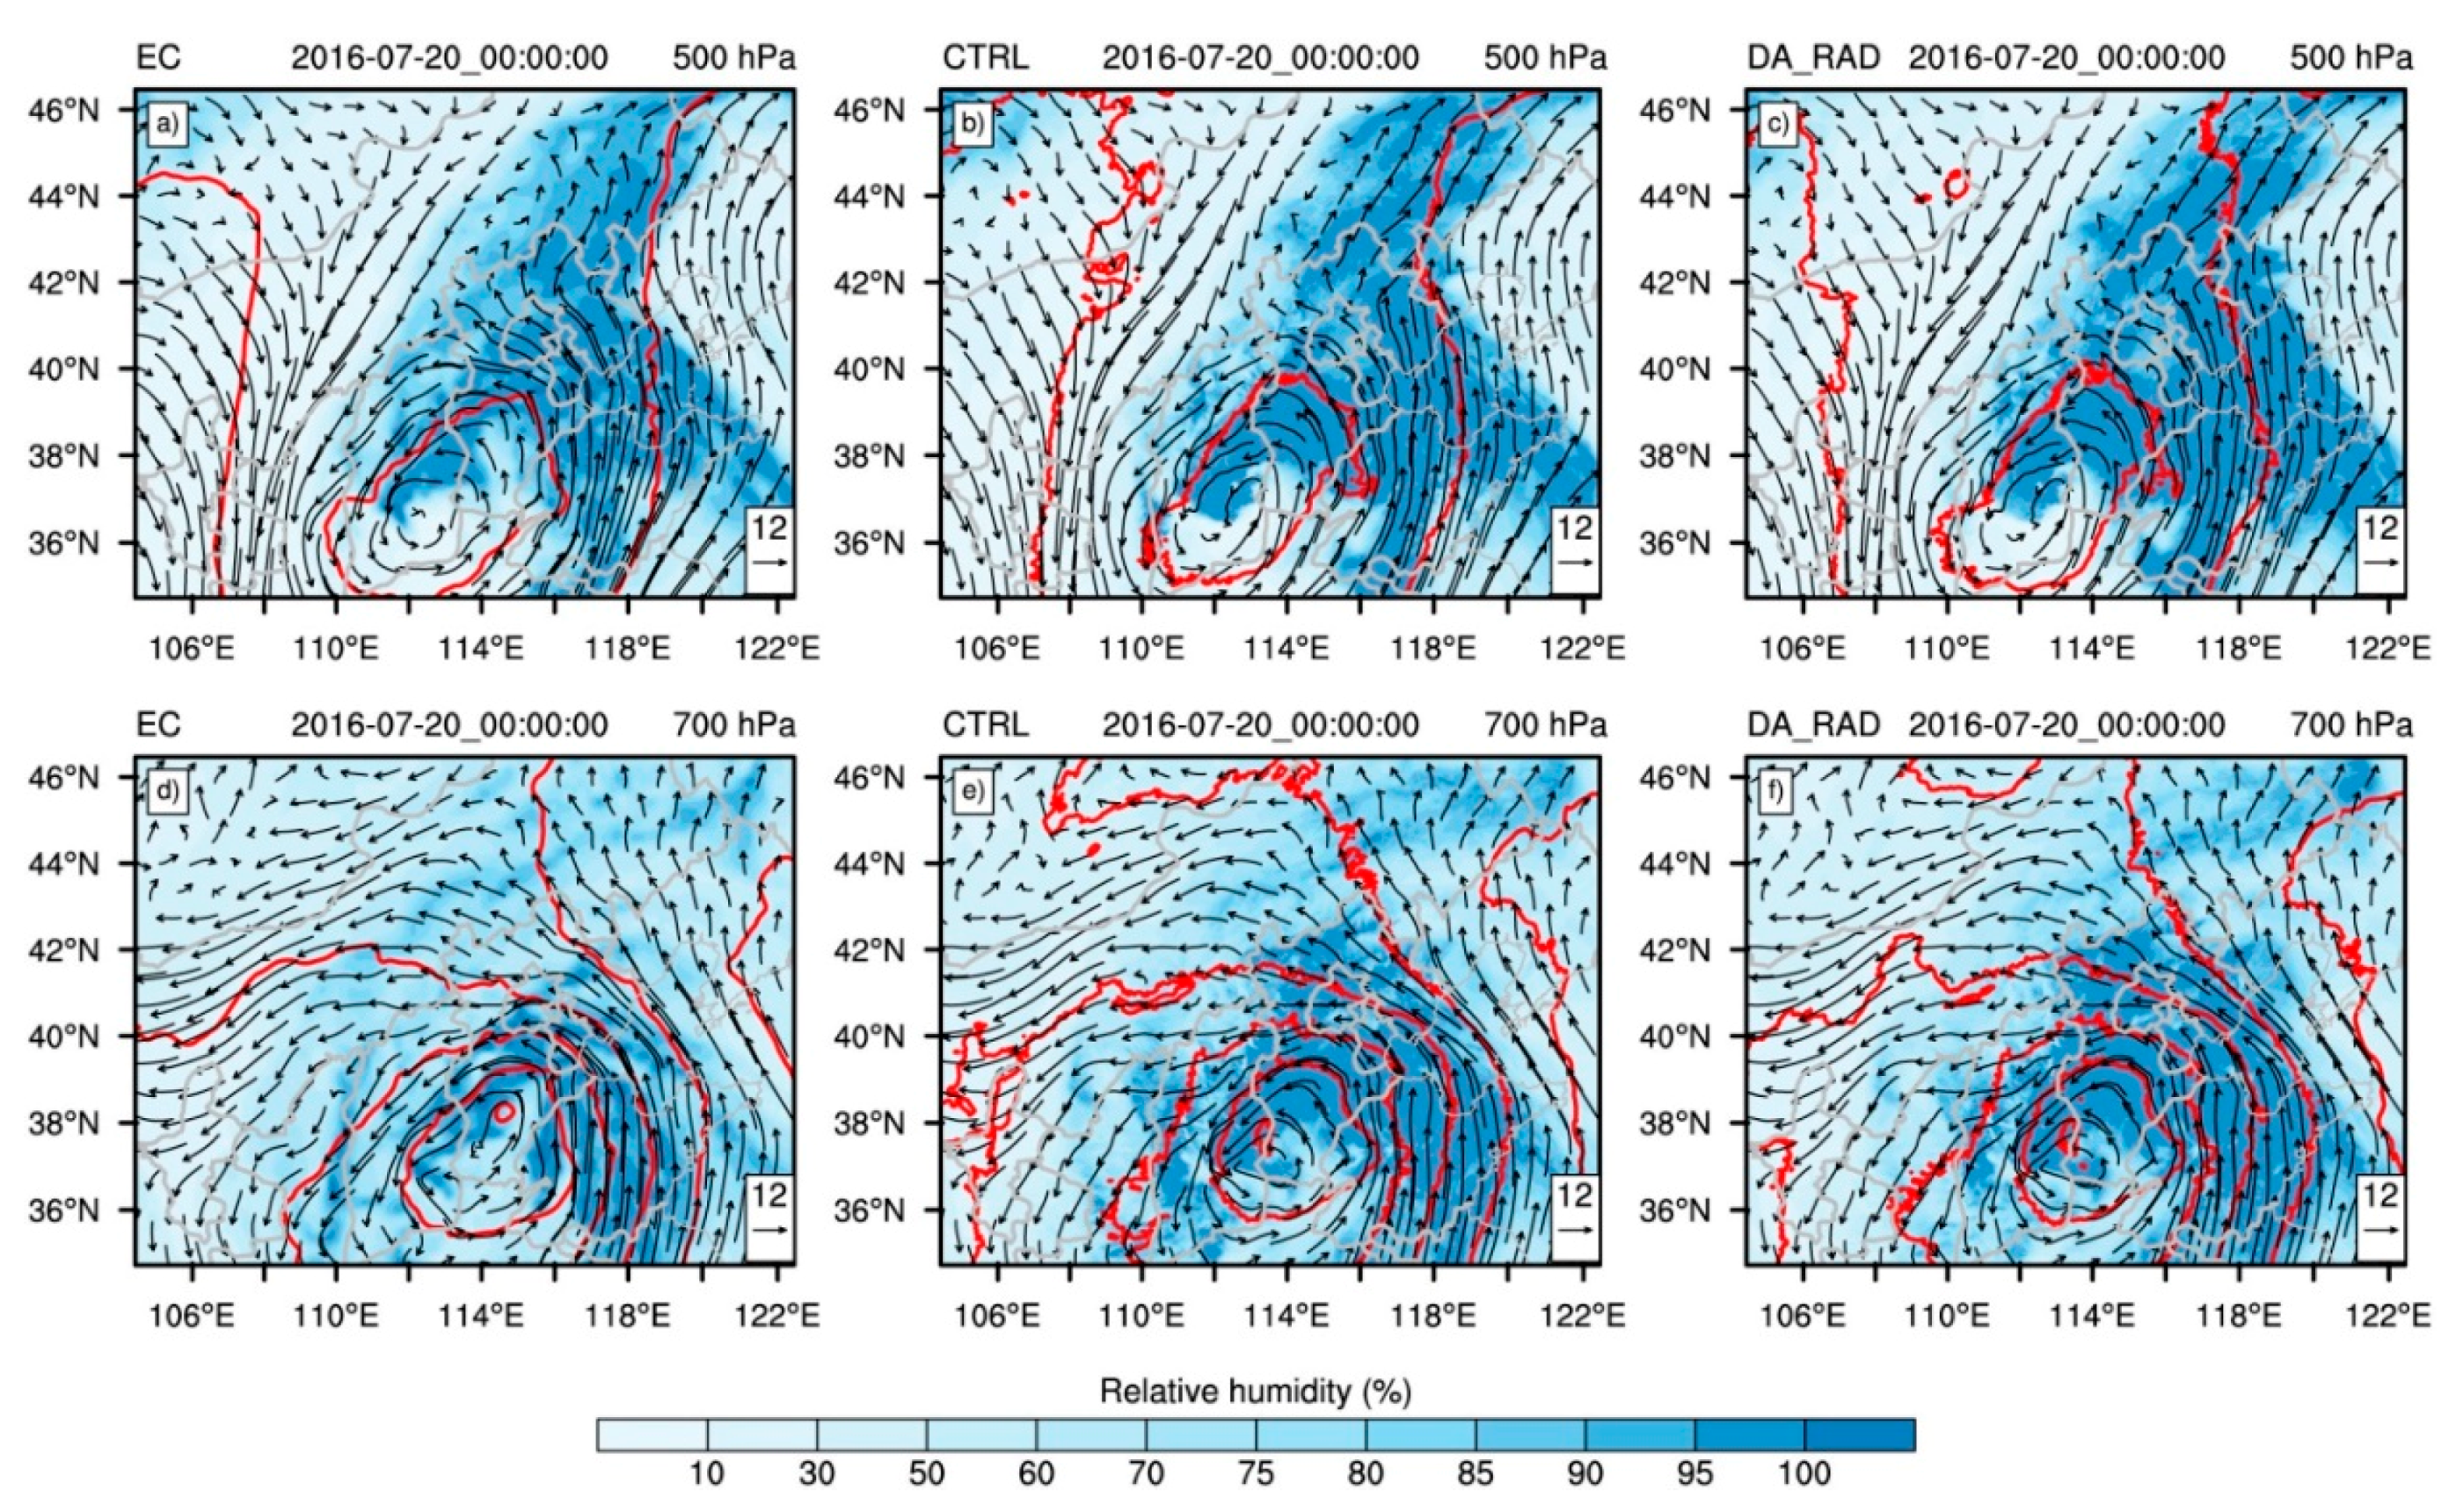
The wind, humidity, and geopotential height fields for 500 and 700 hPa at 0000 UTC on 20 July 2016 are shown in Figure 13. The atmospheric analysis fields from the European Centre for Medium-Range Weather Forecasts (EC) have been used for comparison. For 500 hPa, a low-pressure system in the southwest–northeast direction can be found from the atmospheric fields of EC. There was a similar low-pressure system in both the CTRL and the DA_RAD, however the direction changed a small amount and the humidity in the center of the low pressure increased, which directly influenced the subsequent evolution of the low-pressure system. Assimilation of satellite radiance data also increased the humidity in the eastern part of the low-pressure system in comparison with that of CTRL. For 700 hPa, the center of low pressure was located towards the south of Beijing in the EC’s atmospheric fields. In the CTRL forecast, the center of the low pressure was towards the southwest of Beijing and the high humidity was mainly concentrated in the northeast of the low-pressure system, leading to heavy rainfall towards the east and northeast of Beijing during the next 24 h. Similarly, the humidity in the east of the low pressure increased with satellite radiance data, however there was no change in the position of the low-pressure center. Consequently, the forecast from the DA_RAD experiment had a similar spatial distribution pattern of heavy rainfall to that of the CTRL, however it had a positive impact on the rainfall scores to some extent.
5. Conclusions
RMAPS is an operational NWP based on the WRF and WRFDA model with special configurations mainly for North China. In this study, the impacts of assimilating satellite radiance observations on the accuracy of heavy rainfall forecasts were evaluated using RMAPS. The rainfall event that was selected for this study occurred in North China over the 19–20 July 2016. Two assimilation experiments were conducted and 24 h forecasts were produced every 3 h. The CTRL experiment, which assimilated only conventional data, had the same setting as the operational running of the RMAPS. The DA_RAD experiment assimilated the satellite radiance data from the AMSU-A and MHS along with the conventional observations in the RMAPS. The accuracy and performance of quantitative precipitation forecasts from the two experiments were compared and investigated against the observations. The main conclusions are summarized as follows:
(1) Assimilating satellite radiance data in the RMAPS reduced the temperature bias in the middle levels for the 19–20 July 2016 rainfall event that occurred over North China. It also improved the forecast accuracy of 6 h of accumulated precipitation after 6 h of forecasting, especially for the threshold of above 25 mm. The average CSI rainfall score -was improved by 14.2% for the 25 mm threshold and by 35.8% for the 50 mm threshold.
(2) Satellite radiances assimilation had a positive impact on QPF in the forecast range of 6–12 h. For hourly precipitation, satellite radiances increased the CSI scores below the 10 mm threshold during the period of 6–12 h. For the 6 h accumulated precipitation, the correct forecast rate increased with satellite radiances that were associated with higher ETS and POD indices, and the false alarm ratio decreased with low FAR values.
(3) Satellite radiance assimilation in the RMAPS increased the spatial distribution correlation of heavy rainfall after 6 h of forecasting, especially for the period from 6 to 12 h. Over Beijing, the under-forecasted area decreased with satellite radiances, which was associated with the better ME performance index.
(4) The spatial distribution of heavy rainfall from the CTRL and the DA_RAD followed a similar pattern, where the center of high rainfall shifted to the northeast. In comparison with the EC’s atmospheric fields, a shift of the low pressure center can also be found at different pressure levels at analysis time, which directly influenced the subsequent development of the heavy rainfall system. Satellite radiances from AMSU-A and MHS provided some valuable information for the temperature profile that increased the scope of the heavy rainfall, leading to an improvement of the rainfall scores. Nevertheless, satellite radiance observations did not improve the shift in the low pressure center’s position, resulting in a similar spatial distribution pattern of heavy rainfall in both the CTRL and the DA_RAD.
Based on the results of this case study, satellite radiance data assimilation in the system of RMAPS had a positive impact on the quantitative precipitation forecast accuracy for heavy rainfall, especially from 6 to 12 h. Further research on the forecasting of precipitation is essential to effectively evaluate the impact of assimilating radiance data in the RMAPS, which will be a primary focus in our future work.
Author Contributions
Y.X. wrote the paper; J.S. supervised the study and reviewed the manuscript; S.F. supervised and reviewed the manuscript; M.C., Y.D., and D.J. reviewed the manuscript.
Funding
This research was funded by Beijing Science & Technology Commission (Grant No. Z161100001116098).
Acknowledgments
This study is supported by the Beijing Science & Technology Commission (Grant No. Z161100001116098), the National Key Research and Development Plan (Grant No. 2016YFE0117300), the Key Research Program of Frontier Sciences, CAS (QYZDY-SSW-DQC011), the National Key Research, and the Development Program of China (Grant No. 2017YFB0504105).
Conflicts of Interest
The authors declare no conflict of interest.
References
- Peng, S.Q.; Zou, X. Impact on short-range precipitation forecasts from assimilation of ground-based GPS zenith total delay and rain gauge precipitation observations. J. Meteorol. Soc. Jpn. 2004, 82, 491–506. [Google Scholar] [CrossRef]
- Chandrasekar, A. The impact of assimilation of AMSU data for the prediction of a tropical cyclone over India using a mesoscale model. Int. J. Remote Sens. 2006, 27, 4621–4653. [Google Scholar]
- Xu, J.; Rugg, S.; Horner, M.; Byerle, L. Application of ATOVS Radiance with ARW WRF/GSI Data Assimilation System in the Prediction of Hurricane Katrina. Open Atmos. Sci. J. 2009, 3, 13–28. [Google Scholar] [CrossRef]
- Li, J.; Wang, P.; Han, H.; Li, J.; Zheng, J. On the assimilation of satellite sounder data in cloudy skies in numerical weather prediction models. J. Meteorol. Res. 2016, 30, 169–182. [Google Scholar] [CrossRef]
- Derber, J.C.; Wu, W.S. The use of TOVS cloud-cleared radiances in the NCEP SSI analysis system. Mon. Weather Rev. 1998, 126, 2287–2299. [Google Scholar] [CrossRef]
- Mcnally, A.P.; Derber, J.C.; Wu, W.; Katz, B.B. The use of TOVS level-lb radiances in the NCEP SSI analysis system. Q. J. R. Meteorol. Soc. 2000, 126, 689–724. [Google Scholar] [CrossRef]
- Baker, N.L.; Hogan, T.F.; Campbell, W.F.; Pauley, R.L.; Swadley, S.D. The Impact of AMSU-A Radiance Assimilation in the US Navy’s Operational Global Atmospheric Prediction System (NOGAPS); Naval Research Lab Monterey CA Marine Meteorology Div: Monterey, CA, USA, 2005. [Google Scholar]
- Rodgers, C.D. Inverse Methods for Atmospheric Sounding: Theory and Practice; World Scientific: Singapore, 2000. [Google Scholar]
- Errico, R.M.; Bauer, P.; Mahfouf, J.F. Issues regarding the assimilation of cloud and precipitation data. J. Atmos. Sci. 2009, 65, 3785–3798. [Google Scholar] [CrossRef]
- Wang, P.; Li, J.; Lu, B.; Schmit, T.J.; Lu, J.; Lee, Y.-K.; Li, J.; Liu, Z. Impact of moisture information from advaned Himawari imger measurements on heavy precipitation forecasts in a regional NWP model. J. Geophys. Res. Atmos. 2018, 123, 6022–6038. [Google Scholar] [CrossRef]
- McNally, A.P.; Watts, P.D.; Smith, J.A.; Engelen, R.; Kelly, G.A.; Thépaut, J.N.; Matricardi, M. The assimilation of AIRS radiance data at ECMWF. Q. J. R. Meteorol. Soc. 2006, 132, 935–957. [Google Scholar] [CrossRef] [Green Version]
- Barker, D.; Huang, X.Y.; Liu, Z.; Auligné, T.; Zhang, X.; Rugg, S.; Ajjaji, R.; Bourgeois, A.; Bray, J.; Chen, Y.; et al. The weather research and forecasting model’s community variational/ensemble data assimilation system: WRFDA. Bull. Am. Meteorol. Soc. 2012, 93, 831–843. [Google Scholar] [CrossRef]
- Buehner, M.; Caya, A.; Carrieres, T.; Pogson, L. Assimilation of SSMIS and ASCAT data and the replacement of highly uncertain estimates in the Environment Canada Regional Ice Prediction System. Q. J. R. Meteorol. Soc. 2016, 142, 562–573. [Google Scholar] [CrossRef]
- Kazumori, M. Satellite radiance assimilation in the JMA operational mesoscale 4DVAR system. Mon. Weather Rev. 2014, 142, 1361–1381. [Google Scholar] [CrossRef]
- Bauer, P.; Geer, A.J.; Lopez, P.; Salmond, D. Direct 4D-Var assimilation of all-sky radiance. Part I: Implementation. Q. J. R. Meteorol. Soc. 2010, 136, 1868–1885. [Google Scholar] [CrossRef]
- Liu, Z.Q.; Schwartz, C.S.; Snyder, C.; Ha, S.Y. Impact of assimilating AMSU-A radiances on forecasts of 2008 Atlantic tropical cyclones initialized with a limited-area ensemble kalman filter. Mon. Weather Rev. 2012, 140, 4017–4034. [Google Scholar] [CrossRef]
- Xu, J.J.; Powell, A.M. Dynamical downscaling precipitation over Southwest Asia: Impacts of radiance data assimilation on the forecasts of the WRF-ARW model. Atmos. Res. 2012, 111, 90–103. [Google Scholar] [CrossRef]
- Zou, X.; Qin, Z.; Weng, F. Improved coastal precipitation forecasts with direct assimilation of GOES-11/12 imager radiances. Mon. Weather Rev. 2011, 139, 3711–3729. [Google Scholar] [CrossRef]
- Qin, Z.; Zou, X.; Weng, F. Evaluating added benefits of assimilating GOES Imager radiance data in GSI for coastal QPFs. Mon. Weather Rev. 2013, 141, 75–92. [Google Scholar] [CrossRef]
- Zou, X.; Qin, Z.; Weng, F. Improved Quantitative Precipitation Forecasts by MHS Radiance Data Assimilation with a Newly Added Cloud Detection Algorithm. Mon. Weather Rev. 2013, 141, 3203–3221. [Google Scholar] [CrossRef]
- Singh, R.; Ojha, S.P.; Kishtawal, C.M.; Pal, P.K.; Kiran Kumar, A.S. Impact of the assimilation of INSAT-3D radiances on short-range weather forecasts. Q. J. R. Meteorol. Soc. 2016, 142, 120–131. [Google Scholar] [CrossRef]
- Sagita, N.; Hidayati, R.; Hidayat, R.; Gustari, I. Satellite radiance data assimilation for rainfall prediction in Java Region. IOP Conf. Ser. Earth Environ. Sci. 2017, 54. [Google Scholar] [CrossRef]
- Wang, Y.; Liu, Z.; Yang, S.; Min, J.; Chen, L.; Chen, Y.; Zhang, T. Added value of assimilating Himawari-8 AHI water vapor radiances on analyses and forecasts for “7.19” severe storm over north China. J. Geophys. Res. Atmos. 2018, 123, 3374–3394. [Google Scholar] [CrossRef]
- Skamarock, W.C.; Klemp, J.B.; Dudhia, J.; Gill, D.O.; Barker, D.M.; Duda, M.G.; Huang, X.Y.; Wang, W.; Powers, J.G. A Description of the Advanced Research WRF Version 3; NCAR Technical Note NCAR/TN/u2013475; Mesoscale and Microscale Meteorology Division: Boulder, CO, USA, 2008. [Google Scholar]
- Parrish, D.F.; Derber, J.C. The National Meteorological Center’s spectral statistical interpo-lation analysis system. Mon. Weather Rev. 1992, 120, 1747–1763. [Google Scholar] [CrossRef]
- Amstrup, B. Impact of ATOVS AMSU-A Radiance Data in the DMI-HIRLAM 3D-Var Analysis and Forecasting System; Danish Meteorological Institute: Copenhagen, Denmark, 2001. [Google Scholar]
- Xie, P.; Arkin, P.A. Analyses of global monthly precipitation using gauge observations, satellite estimates, and numerical model predictions. J. Clim. 1996, 9, 840–858. [Google Scholar] [CrossRef]
- Omranian, E.; Sharif, H.O.; Tavakoly, A.A. How well can Global Precipitation Measurement (GPM) capture Hurricanes? Case study: Hurricane Harvey. Remote Sens. 2018, 10, 1150. [Google Scholar] [CrossRef]
- Omranian, E.; Sharif, H.O. Evaluation of the Global Precipitation Measurement (GPM) satellite rainfall products over the Lower Colorado River Basin, Texas. JAWRA J. Am. Water Resour. Assoc. 2018. [Google Scholar] [CrossRef]
- Joyce, R.J.; Janowiak, J.E.; Arkin, P.A.; Xie, P.P. CMORPH: A method that produces global precipitation estimates from passive microwave and infrared data at high spatial and temporal resolution. J. Hydrometeorol. 2004, 5, 487–503. [Google Scholar] [CrossRef]
- Shen, Y.; Pan, Y.; Yu, J.J.; Zhao, P.; Zhou, Z.J. Quality assessment of hourly merged precipitation product over China. Trans. Atmos. Sci. 2013, 36, 37–46. [Google Scholar]
- Casati, B.; Wilson, L.J.; Stephenson, D.B.; Nurmi, P.; Ghelli, A.; Pocernich, M.; Damrath, U.; Ebert, E.E.; Brown, B.G.; Mason, S. Forecast verification: Current status and future directions. Meteorol. Appl. 2008, 15, 3–18. [Google Scholar] [CrossRef]
- Schaffer, J.T. The critical success index as an indicator of warning skill. Weather Forecast. 1990, 5, 570–575. [Google Scholar] [CrossRef]
- Walsh, K.; Mcgregor, J. An assessment of simulations of climate variability over Australia with a limited area model. Int. J. Climatol. 1997, 17, 201–223. [Google Scholar] [CrossRef]
- Weng, F.; Han, Y.; Delst, P.V.; Liu, Q.; Kleespies, T.; Yan, B.; Marshall, J.L. JCSDA Community Radiative Transfer Model (CRTM)—Version 1; NOAA Technical Report NESDIS 122; American Geophysical Union: Washington, DC, USA, 2005. [Google Scholar]
Figure 1.
Two nested domains in the RMAPS (Rapid-Refresh Multi-Scale Analysis and Prediction system). The outside box is a 9 km horizontal resolution domain, the inside black box represents a 3-km horizontal resolution domain that is centered in Beijing.
Figure 1.
Two nested domains in the RMAPS (Rapid-Refresh Multi-Scale Analysis and Prediction system). The outside box is a 9 km horizontal resolution domain, the inside black box represents a 3-km horizontal resolution domain that is centered in Beijing.

Figure 2.
The brightness temperatures (K) of channel 6 in AMSU-A (Advanced Microwave Sounding Unit-A) and channel 3 in MHS (Microwave Humidity Sounding) from the satellite NOAA18 at the analysis time of 0000 UTC 20 July 2016. (a,c) show the coverages of channel 6 in AMSU-A before and after quality control, and (b,d) show the coverages of channel 3 in MHS before and after quality control.
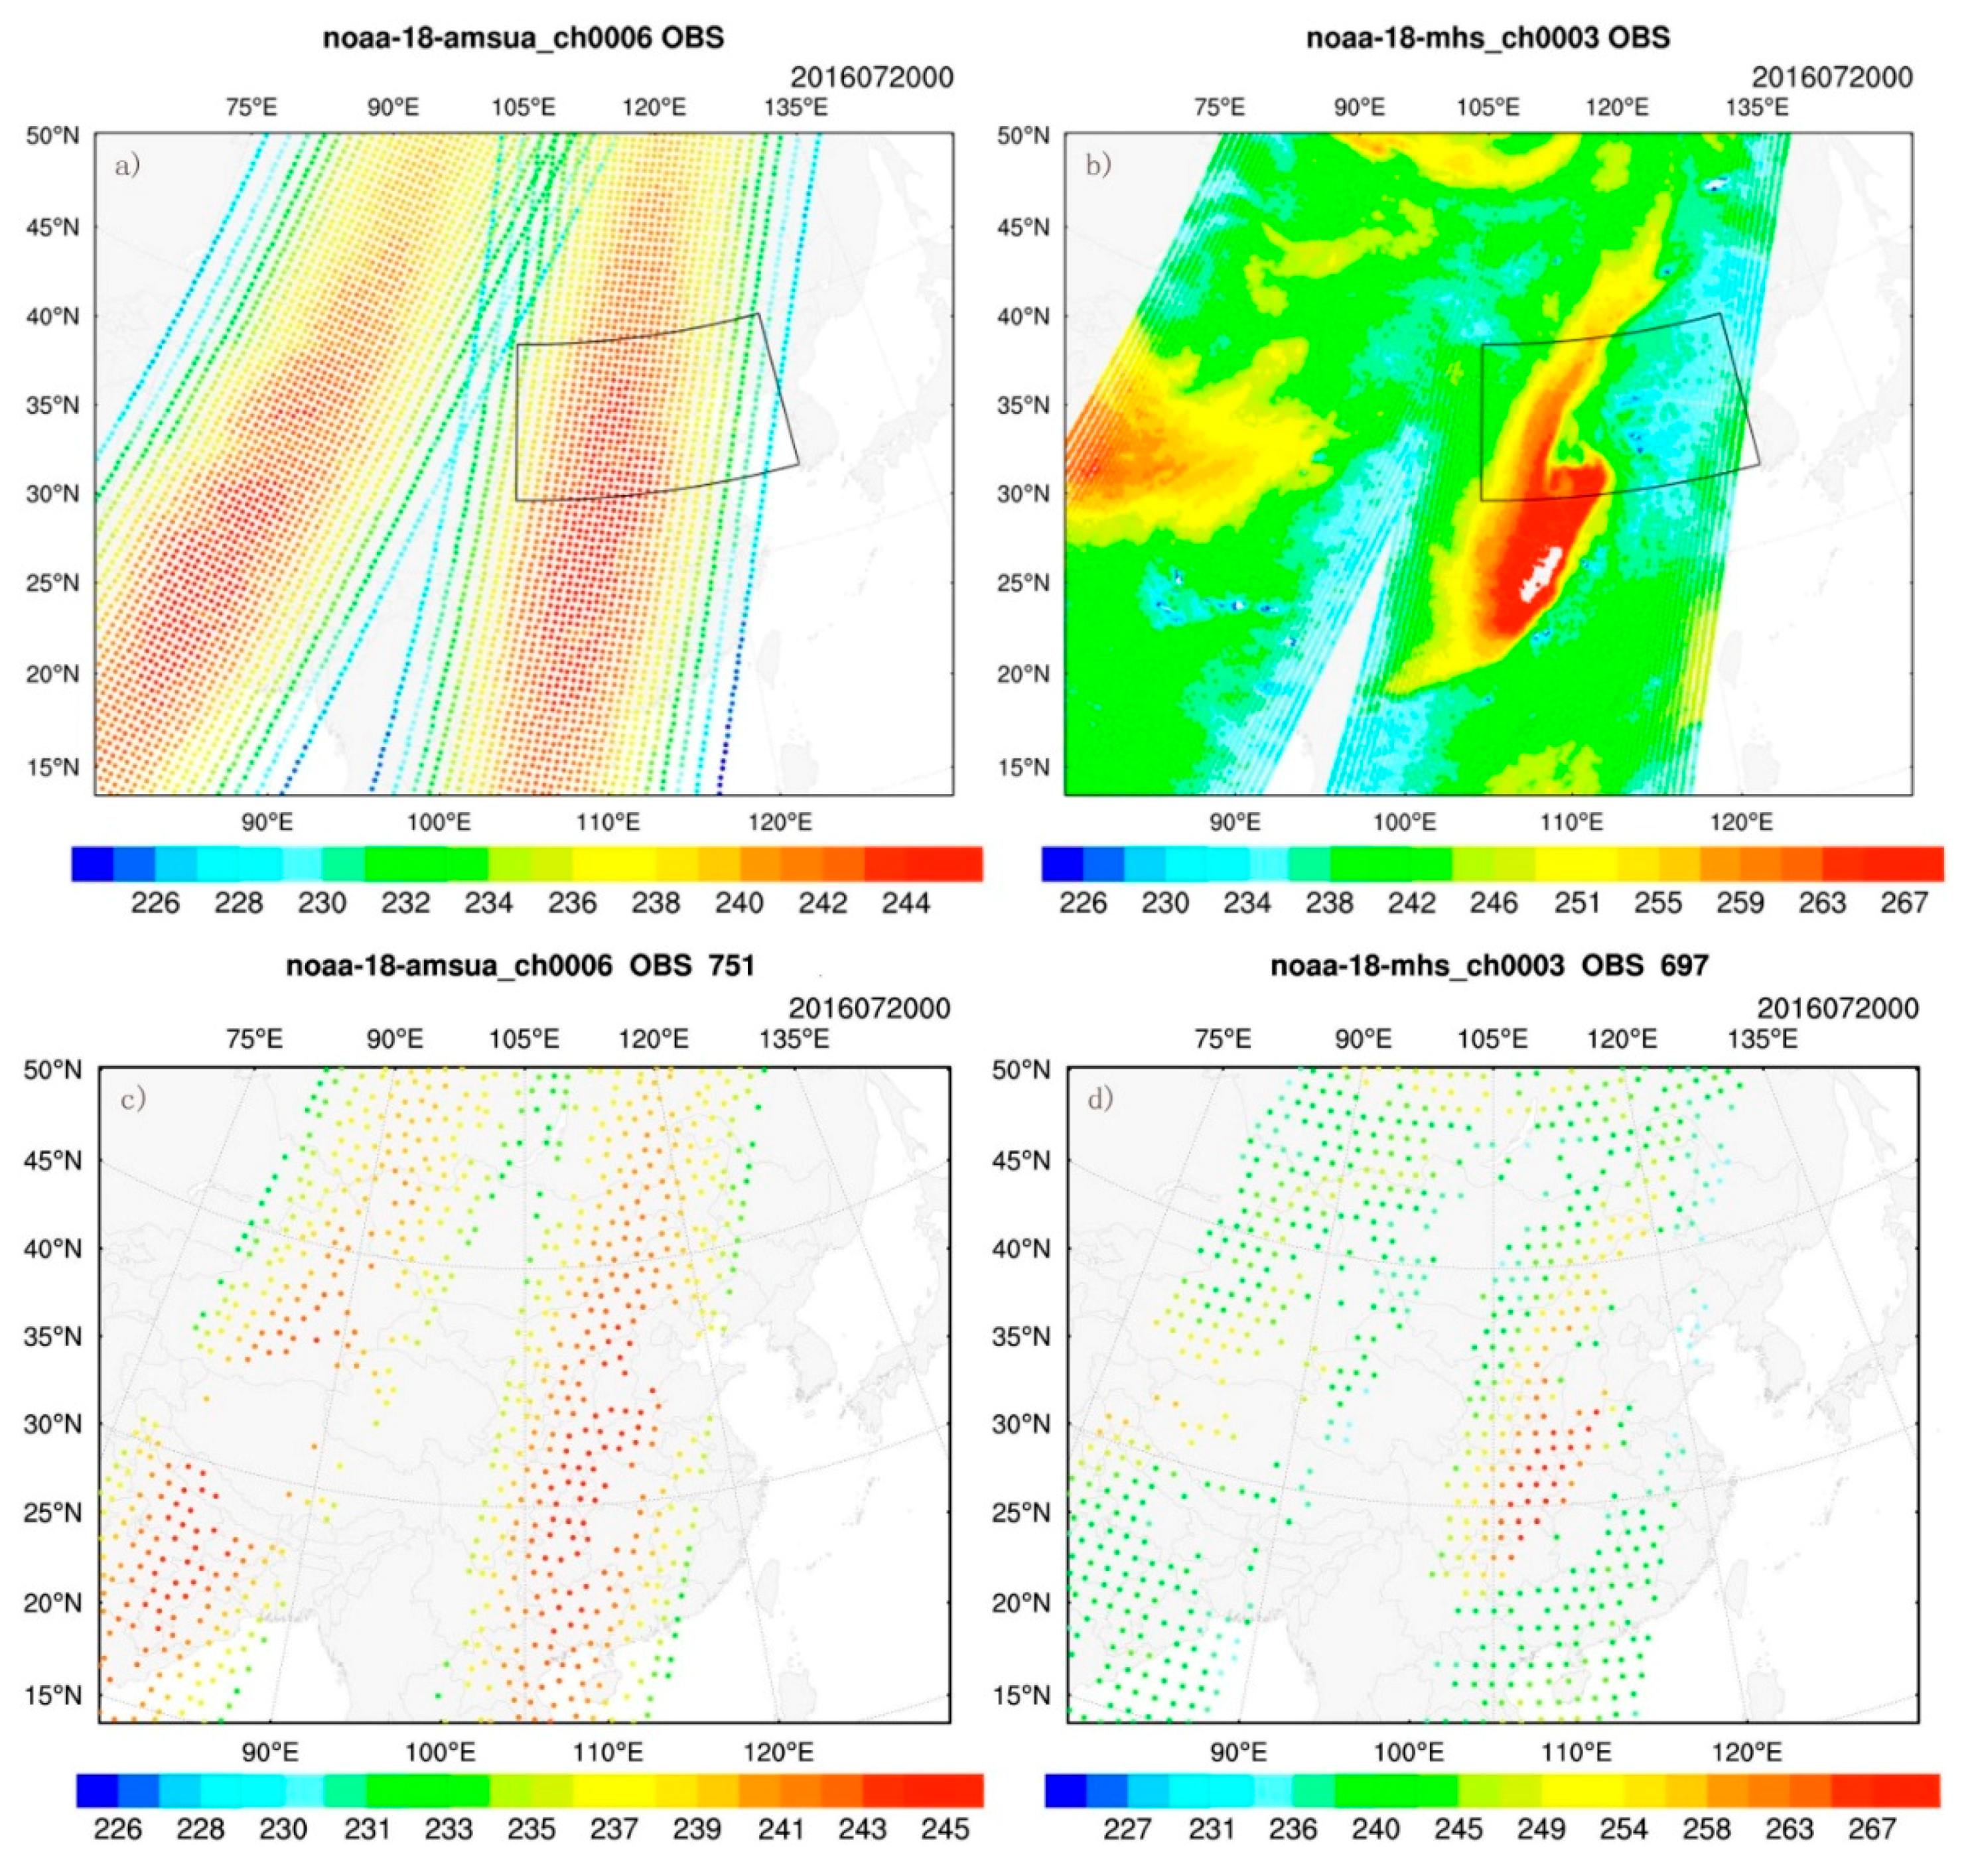
Figure 3.
The scatter plots of the observed (OBS) versus CRTM-calculated brightness temperatures (K) for channel 6 of AMSU-A (the first line) and channel 3 of MHS (the second line) from NOAA18 at the analysis time 0000 UTC 20 July 2016. (a,d): BAK (background) versus OBS without bias correction (no BC), (b,e): BAK versus OBS with bias correction (with BC), and (c,f): ANA (analysis) versus OBS with bias correction (with BC).

Figure 4.
The vertical profiles of average BIAS and RMSE (Root-Mean-Square Error) at analysis time 0000 UTC against conventional observations for (a) temperature (TMP), (b) specific humidity (SPFH), (c) geopotential height (HGT), (d) zonal (UGRD), and (e) meridional (VGRD) wind.
Figure 4.
The vertical profiles of average BIAS and RMSE (Root-Mean-Square Error) at analysis time 0000 UTC against conventional observations for (a) temperature (TMP), (b) specific humidity (SPFH), (c) geopotential height (HGT), (d) zonal (UGRD), and (e) meridional (VGRD) wind.

Figure 5.
The CSI scores of the rainfall forecasts for 6 h of accumulated precipitation for the six different thresholds of (a) 0.1 mm, (b) 1 mm, (c) 5 mm, (d) 10 mm, (e) 25 mm, and (f) 50 mm.
Figure 5.
The CSI scores of the rainfall forecasts for 6 h of accumulated precipitation for the six different thresholds of (a) 0.1 mm, (b) 1 mm, (c) 5 mm, (d) 10 mm, (e) 25 mm, and (f) 50 mm.
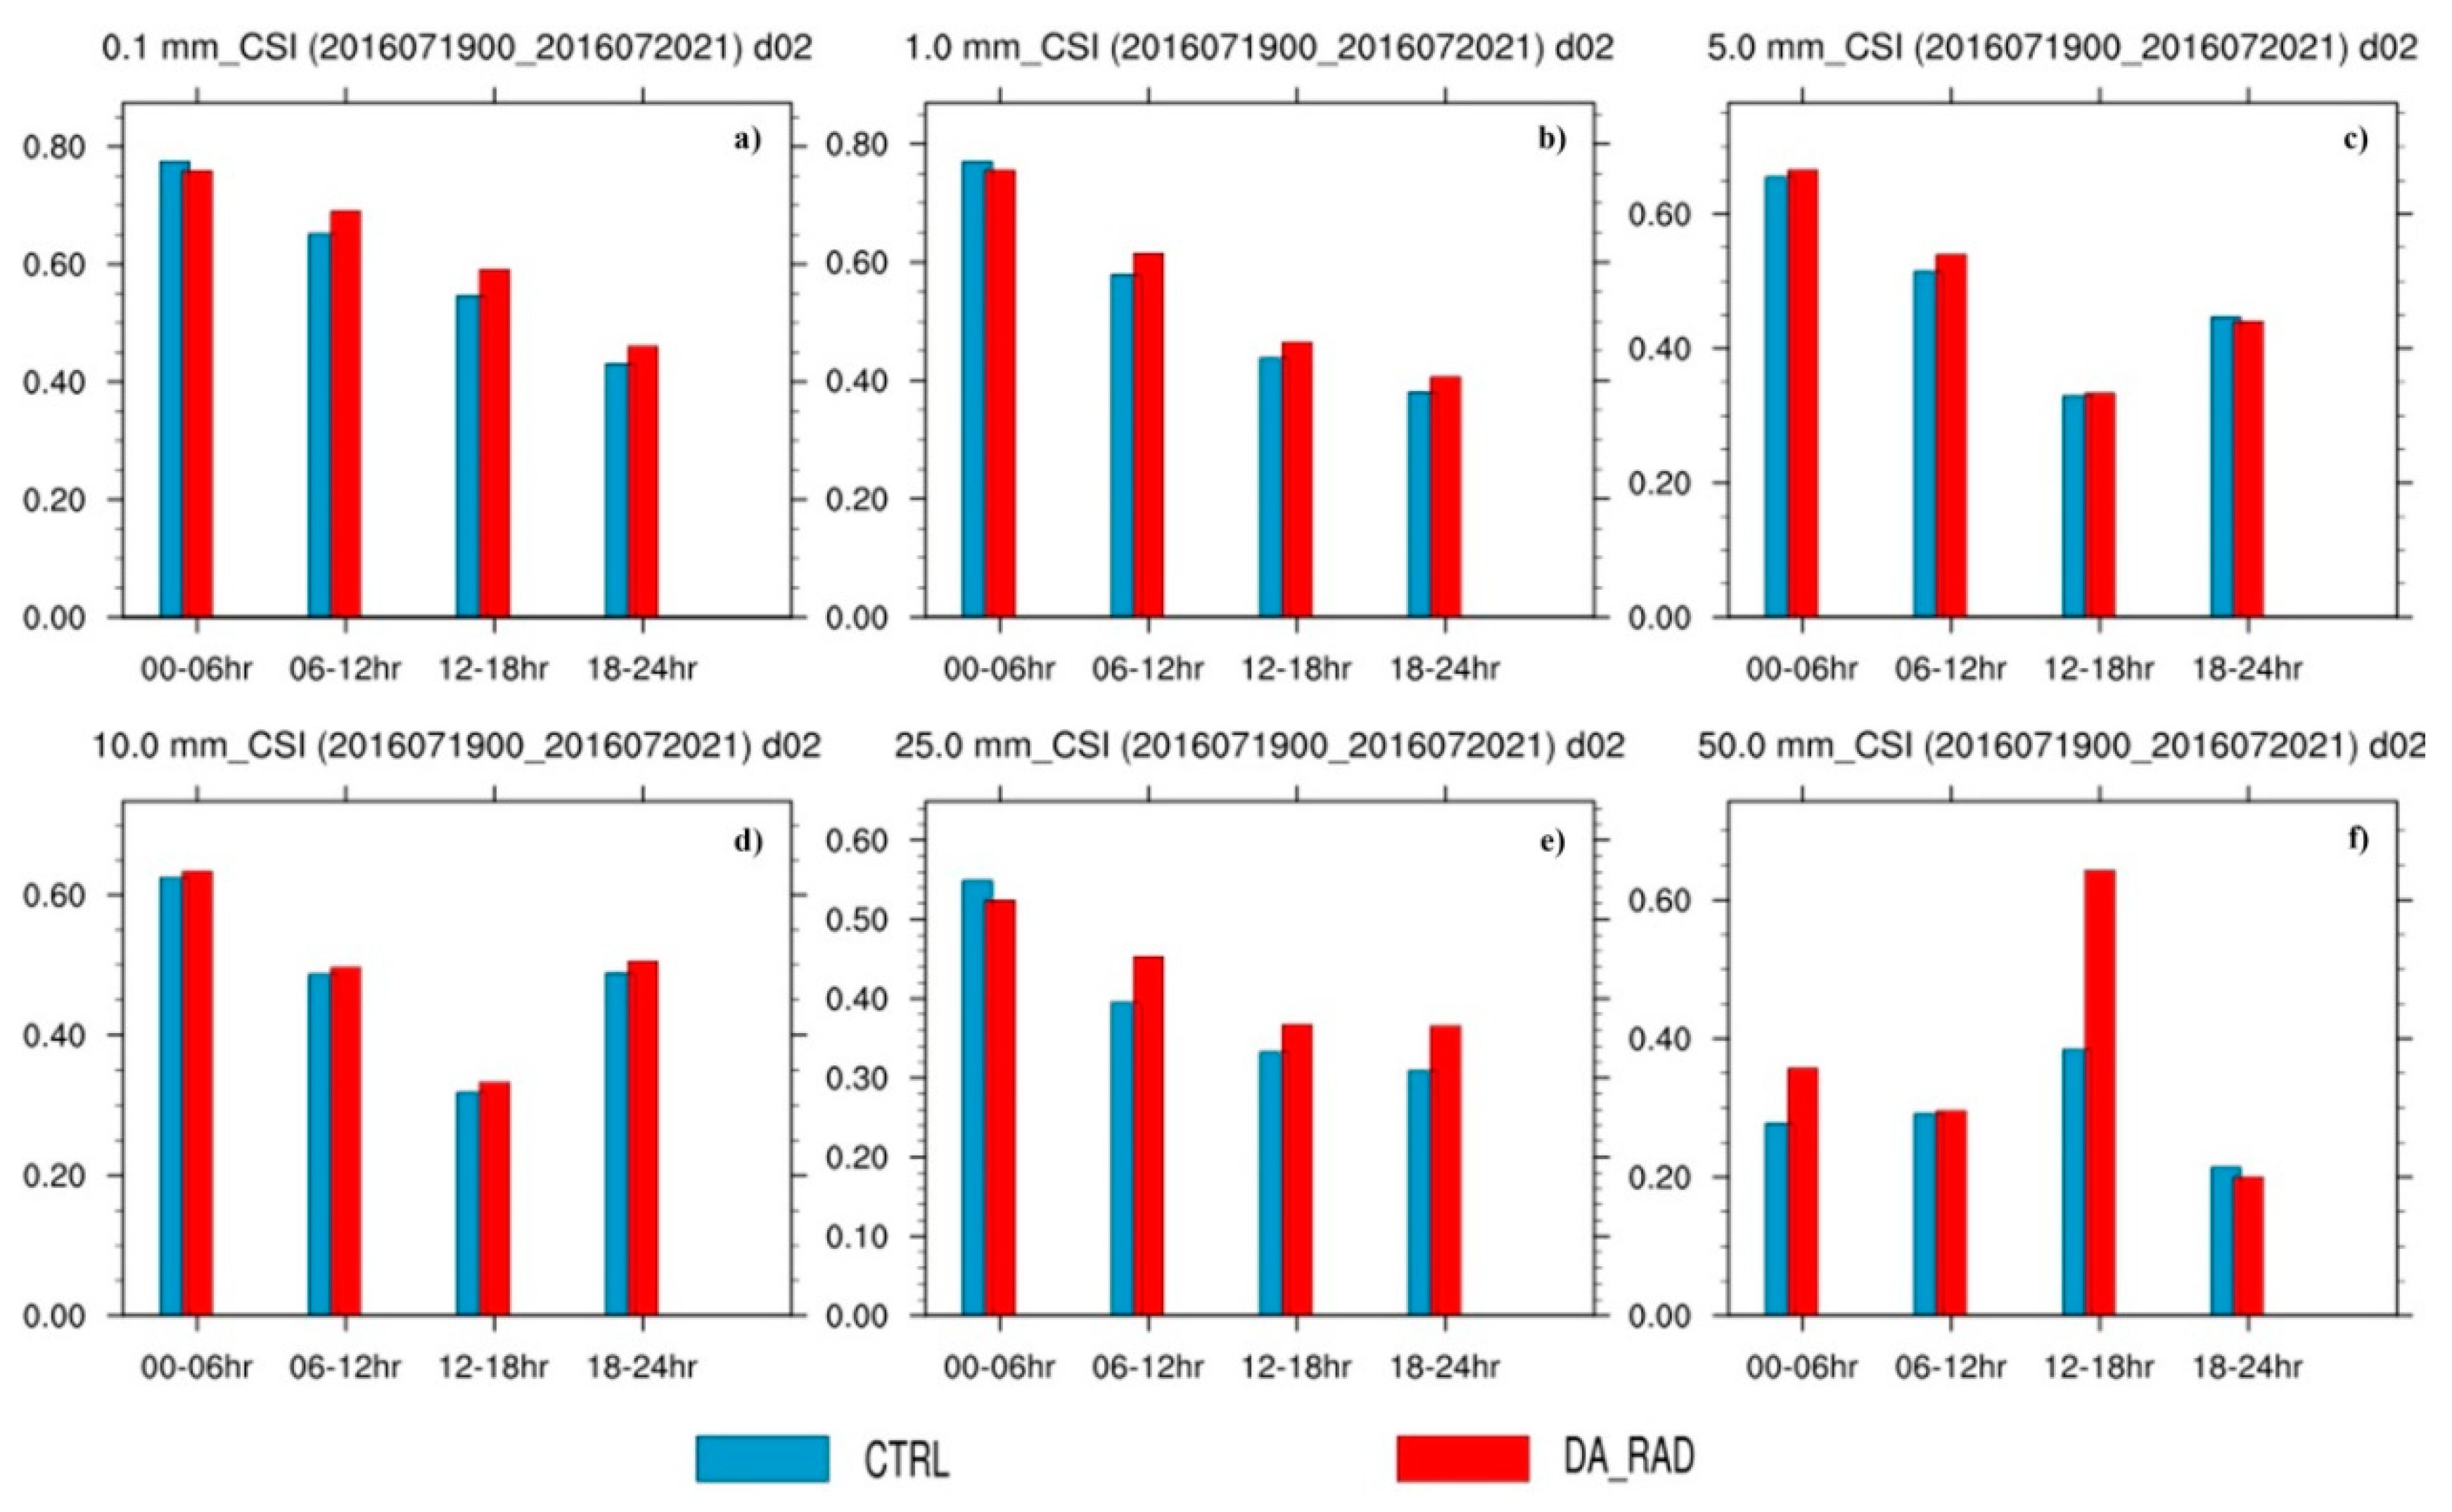
Figure 6.
The BIAS scores of the rainfall forecasts for 6 h of accumulated precipitation for the six different thresholds of (a) 0.1 mm, (b) 1 mm, (c) 5 mm, (d) 10 mm, (e) 25 mm, and (f) 50 mm.
Figure 6.
The BIAS scores of the rainfall forecasts for 6 h of accumulated precipitation for the six different thresholds of (a) 0.1 mm, (b) 1 mm, (c) 5 mm, (d) 10 mm, (e) 25 mm, and (f) 50 mm.

Figure 7.
The ETS, POD, and FAR statistical indices for the accumulated rainfall over the 6–12 h period of the forecasts.
Figure 7.
The ETS, POD, and FAR statistical indices for the accumulated rainfall over the 6–12 h period of the forecasts.

Figure 8.
The CSI (the first line) and BIAS (the second line) scores for hourly accumulated precipitation for the thresholds of (a,d) 0.1 mm, (b,e) 5 mm, and (c,f) 10 mm.
Figure 8.
The CSI (the first line) and BIAS (the second line) scores for hourly accumulated precipitation for the thresholds of (a,d) 0.1 mm, (b,e) 5 mm, and (c,f) 10 mm.

Figure 9.
Spatial correlation (Corr) of hourly precipitation between forecasts and observations (OBS) from 0000 UTC to 2400 UTC 20 July 2016 over the domain of 3 km horizontal resolution.
Figure 9.
Spatial correlation (Corr) of hourly precipitation between forecasts and observations (OBS) from 0000 UTC to 2400 UTC 20 July 2016 over the domain of 3 km horizontal resolution.

Figure 10.
The spatial distribution patterns of 6 h of accumulated precipitation on 20 July 2016. (a–d) are for observations at 06, 12, 18, and 24 h; (e–h) are for the CTRL forecast at 06, 12, 18, and 24 h; and (i,j), (p,q) are for the DA_RAD forecast at 06, 12, 18, and 24 h.
Figure 10.
The spatial distribution patterns of 6 h of accumulated precipitation on 20 July 2016. (a–d) are for observations at 06, 12, 18, and 24 h; (e–h) are for the CTRL forecast at 06, 12, 18, and 24 h; and (i,j), (p,q) are for the DA_RAD forecast at 06, 12, 18, and 24 h.

Figure 11.
The spatial distribution patterns of 24 h of accumulated precipitation on 20 July 2016. (a) is for observations, (b) is for the CTRL forecast, and (c) is for the DA_RAD forecast.
Figure 11.
The spatial distribution patterns of 24 h of accumulated precipitation on 20 July 2016. (a) is for observations, (b) is for the CTRL forecast, and (c) is for the DA_RAD forecast.

Figure 12.
The spatial distribution of the ME (Mean Error) index between forecasts and observations for hourly precipitation over the domain of 3 km horizontal resolution.
Figure 12.
The spatial distribution of the ME (Mean Error) index between forecasts and observations for hourly precipitation over the domain of 3 km horizontal resolution.
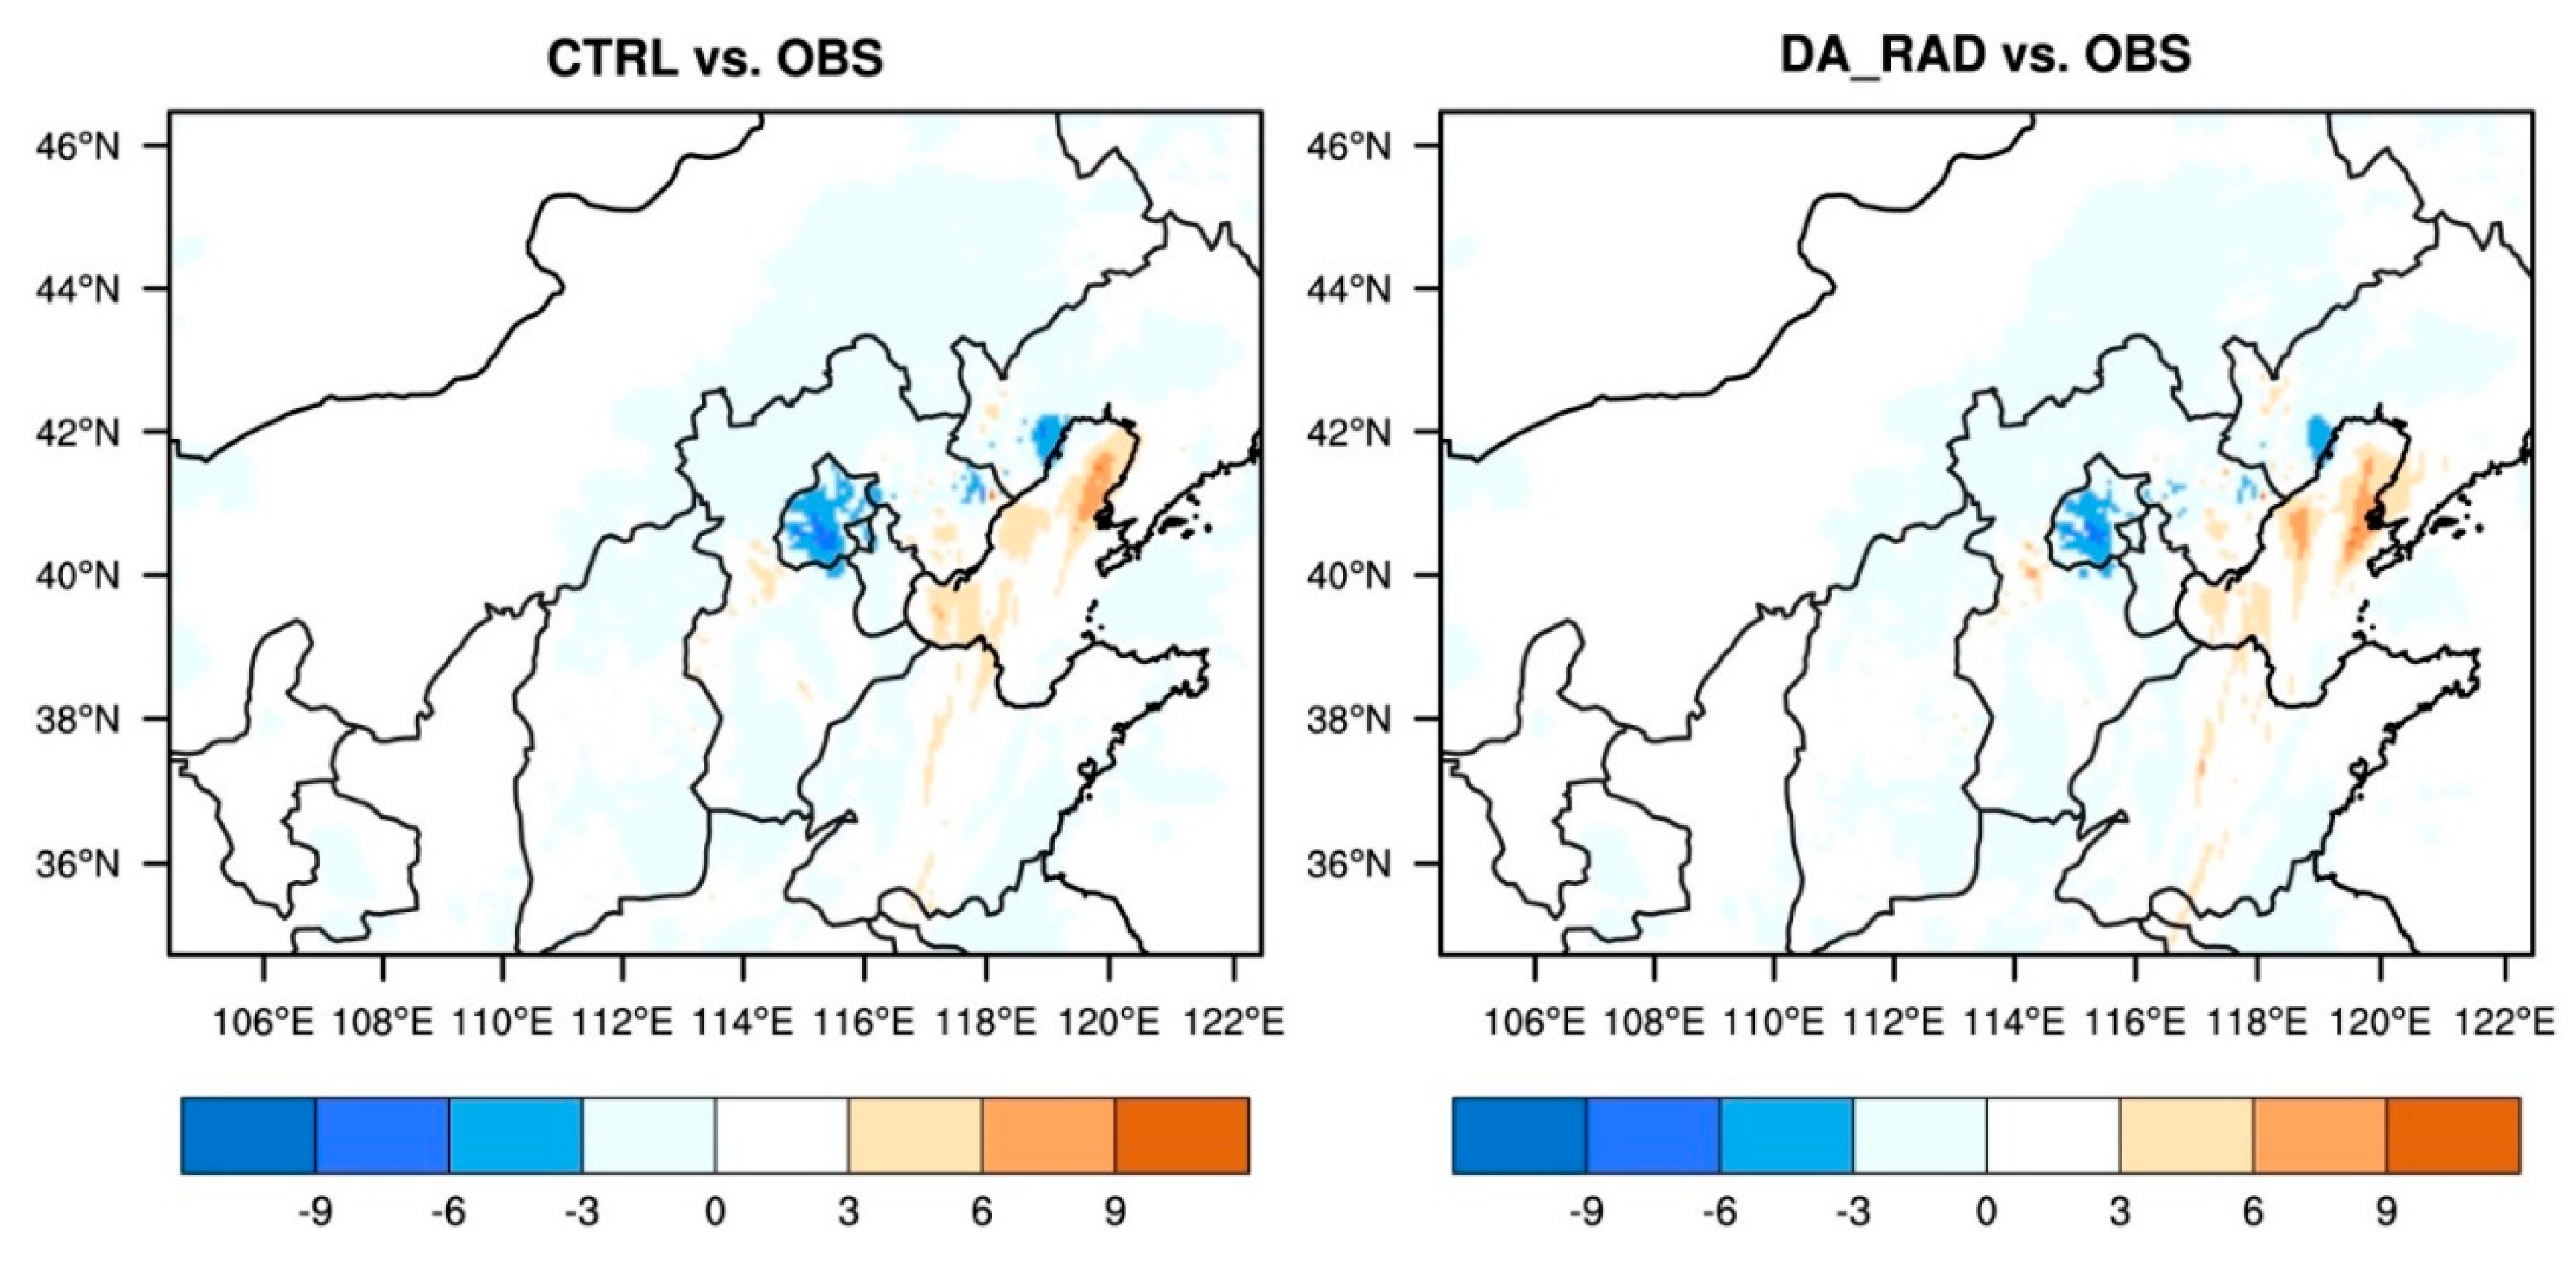
Figure 13.
The fields of wind, humidity, and geopotential height for 500 hPa (the first line) and 700 hPa (the second line) at 0000 UTC 20 July 2016. (a,d) are from EC, (b,e) are from the CTRL forecast, and (c,f) are from the DA_RAD forecast.
Figure 13.
The fields of wind, humidity, and geopotential height for 500 hPa (the first line) and 700 hPa (the second line) at 0000 UTC 20 July 2016. (a,d) are from EC, (b,e) are from the CTRL forecast, and (c,f) are from the DA_RAD forecast.


Table 1.
Four-cell contingency table.
| Observed Events | |||
|---|---|---|---|
| yes | no | ||
| Forecasts | yes | a | b |
| no | c | d | |
Table 2.
Statistical performance measures used in evaluation and comparison.
| Index | Formula | Range | Perfect Value |
|---|---|---|---|
| Bias (BIAS) | 0~+∞ | 1 | |
| Critical Success Index (CSI) | 0~1 | 1 | |
| Equitable Threat Score (ETS) | −1/3~1 | 1 | |
| Probability of Detection (POD) | 0~1 | 1 | |
| False Alarm Ration (FAR) | 0~1 | 0 |
, where N = .
© 2018 by the authors. Licensee MDPI, Basel, Switzerland. This article is an open access article distributed under the terms and conditions of the Creative Commons Attribution (CC BY) license (http://creativecommons.org/licenses/by/4.0/).
Share and Cite
MDPI and ACS Style
Xie, Y.; Shi, J.; Fan, S.; Chen, M.; Dou, Y.; Ji, D. Impact of Radiance Data Assimilation on the Prediction of Heavy Rainfall in RMAPS: A Case Study. Remote Sens. 2018, 10, 1380. https://doi.org/10.3390/rs10091380
AMA Style
Xie Y, Shi J, Fan S, Chen M, Dou Y, Ji D. Impact of Radiance Data Assimilation on the Prediction of Heavy Rainfall in RMAPS: A Case Study. Remote Sensing. 2018; 10(9):1380. https://doi.org/10.3390/rs10091380
Chicago/Turabian StyleXie, Yanhui, Jiancheng Shi, Shuiyong Fan, Min Chen, Youjun Dou, and Dabin Ji. 2018. "Impact of Radiance Data Assimilation on the Prediction of Heavy Rainfall in RMAPS: A Case Study" Remote Sensing 10, no. 9: 1380. https://doi.org/10.3390/rs10091380
Note that from the first issue of 2016, this journal uses article numbers instead of page numbers. See further details here.