Analysis of Landsat-8 OLI Imagery for Estimating Exposed Bedrock Fractions in Typical Karst Regions of Southwest China Using a Karst Bare-Rock Index


Abstract
1. Introduction
2. Materials and Methods
2.1. Study Area
2.2. Landsat-8 Data and Preprocessing
2.3. Auxiliary Data and Accuracy Assessment
2.4. The Karst Bare-Rock Index (KBRI)
2.5. Comparison with Related Indices
2.6. A Linear Regression Model
3. Results
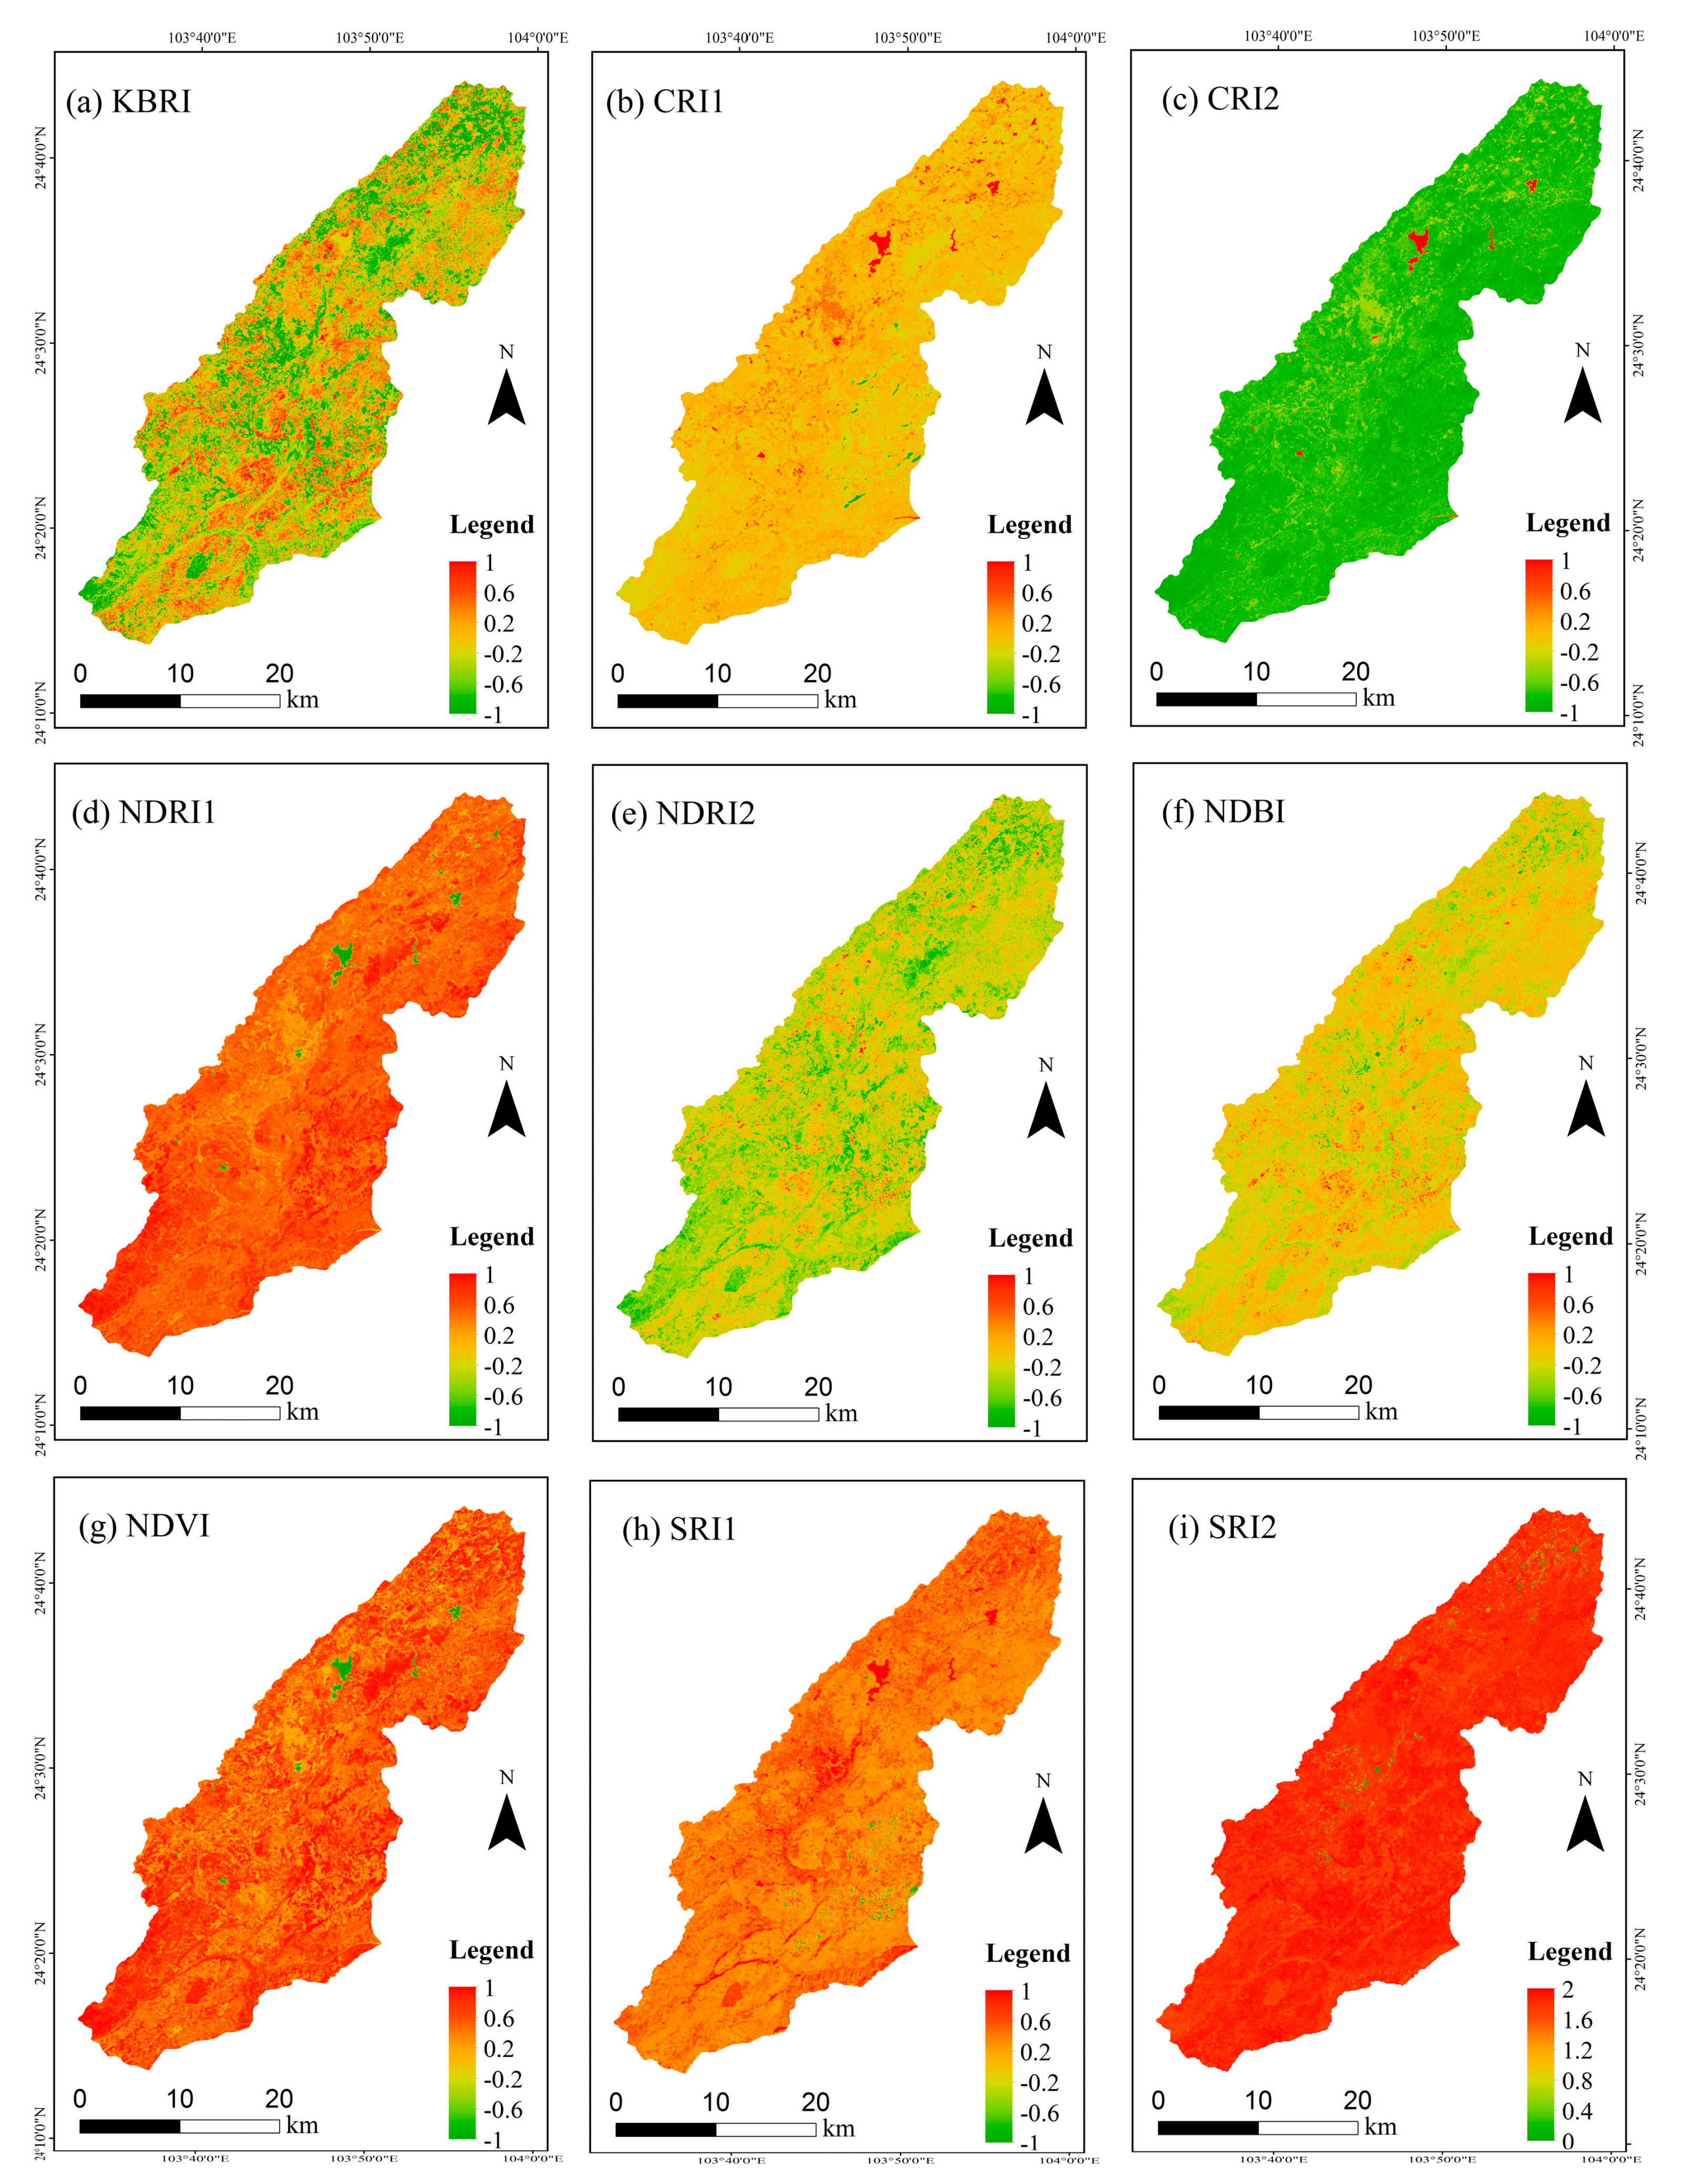
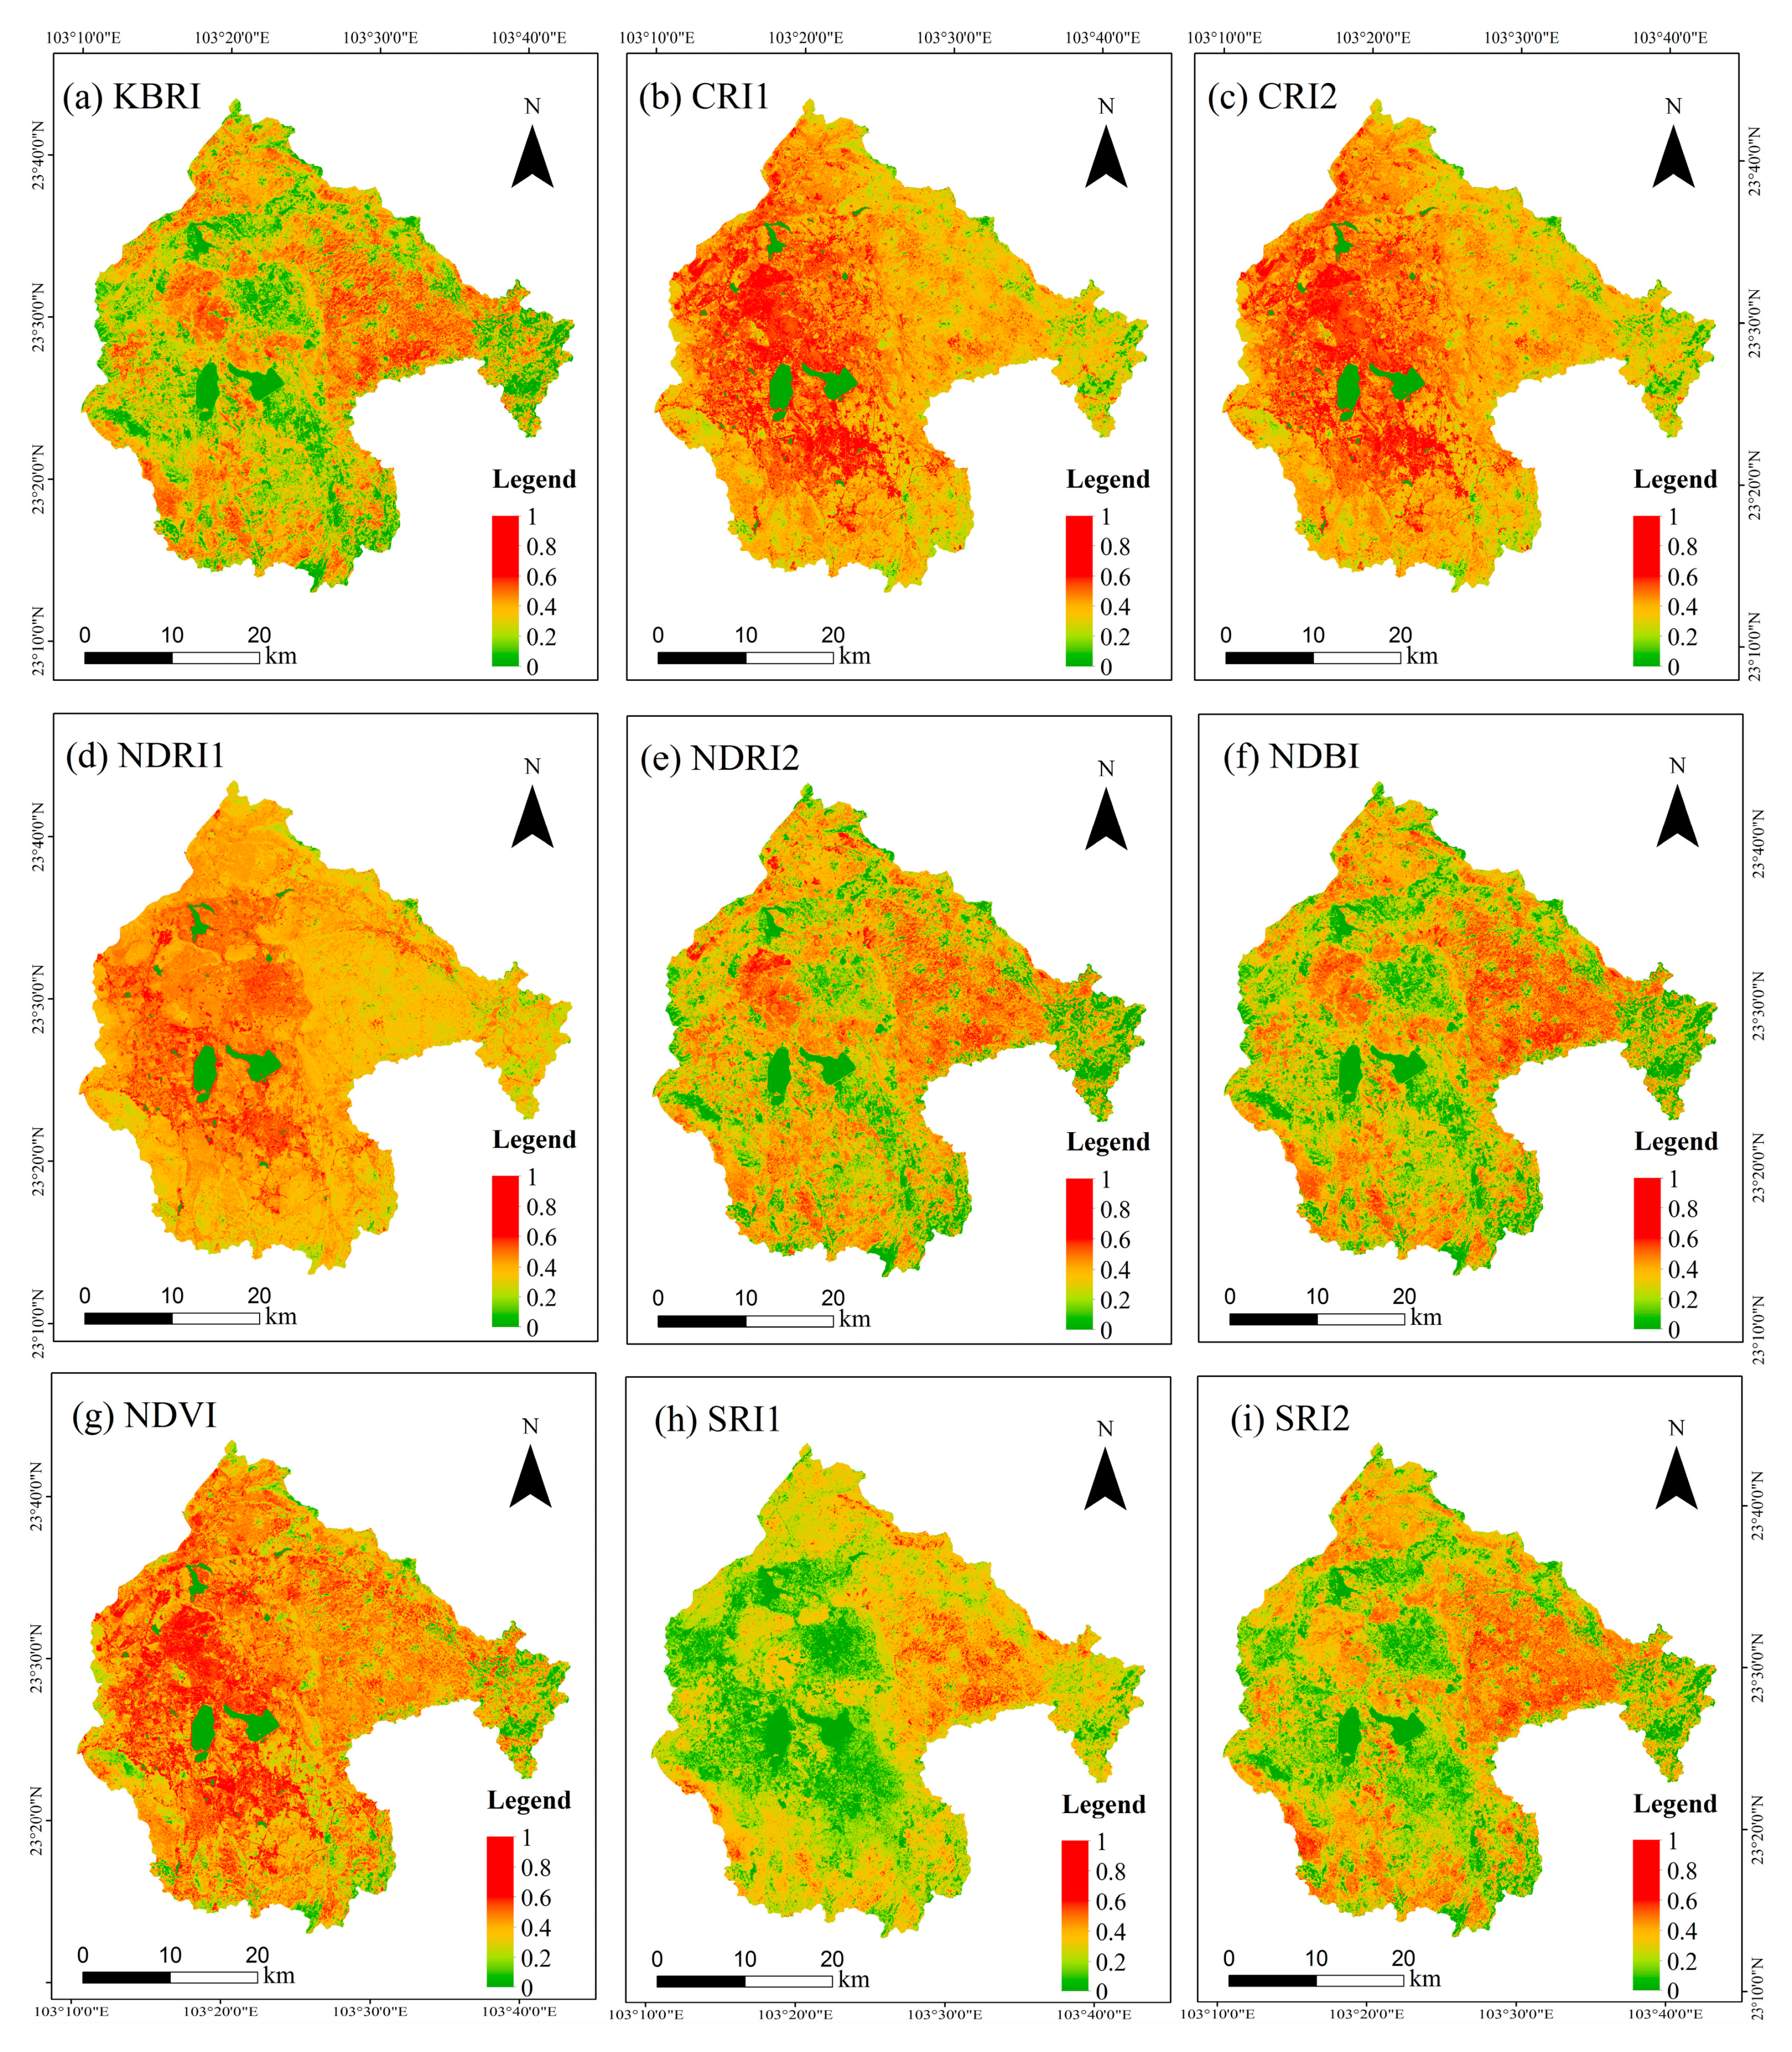
3.1. Index Images
3.2. Mapping of EBF in Xiaojiang Watershed
3.3. An Independent Validation
4. Discussion
Study Limitations
5. Conclusions
Author Contributions
Funding
Acknowledgments
Conflicts of Interest
References
- Yuan, D.X. Progress in the study on karst processes and carbon cycle. Adv. Earth Sci. 1999, 14, 425–432. [Google Scholar]
- Wang, S.J.; Liu, Q.M.; Zhang, D.F. Karst rocky desertification in southwestern China: Geomorphology, landuse, impact and rehabilitation. Land Degrad. Dev. 2004, 15, 115–121. [Google Scholar] [CrossRef]
- Yuan, D.X. Rock desertification in the subtropical karst of south China. Z. Geomorphol. 1997, 108, 81–90. [Google Scholar]
- Yue, Y.; Zhang, B.; Wang, K.; Liu, B.; Li, R.; Jiao, Q.; Yang, Q.; Zhang, M. Spectral indices for estimating ecological indicators of karst rocky desertification. Int. J. Remote Sens. 2010, 31, 2115–2122. [Google Scholar] [CrossRef]
- Jiang, Z.; Lian, Y.; Qin, X. Rocky desertification in southwest china: Impacts, causes, and restoration. Earth Sci. Rev. 2014, 132, 1–12. [Google Scholar] [CrossRef]
- Wang, S.J. Concept deduction and its connotation of karst rocky desertification. Carsologica Sin. 2002, 21, 101–105. [Google Scholar]
- Yue, Y.M.; Wang, K.L.; Liu, B.; Li, R.; Zhang, B.; Chen, H.S.; Zhang, M.Y. Development of new remote sensing methods for mapping green vegetation and exposed bedrock fractions within heterogeneous landscapes. Int. J. Remote Sens. 2013, 34, 5136–5153. [Google Scholar] [CrossRef]
- Zhang, X.; Shang, K.; Cen, Y.; Shuai, T.; Sun, Y. Estimating ecological indicators of karst rocky desertification by linear spectral unmixing method. Int. J. Appl. Earth Obs. Geoinf. 2014, 31, 86–94. [Google Scholar] [CrossRef]
- Xu, E.Q.; Zhang, H.Q.; Li, M.X. Object-based mapping of karst rocky desertification using a support vector machine. Land Degrad. Dev. 2015, 26, 158–167. [Google Scholar] [CrossRef]
- Carlson, T.N.; Ripley, D.A. On the relation between NDVI, fractional vegetation cover, and leaf area index. Remote Sens. Environ. 1997, 62, 241–252. [Google Scholar] [CrossRef]
- Jiménezmuñoz, J.C.; Sobrino, J.A.; Plaza, A.; Guanter, L.; Moreno, J.; Martínez, P. Comparison between fractional vegetation cover retrievals from vegetation indices and spectral mixture analysis: Case study of PROBA/CHRIS data over an agricultural area. Sensors 2009, 9, 768–793. [Google Scholar] [CrossRef] [PubMed]
- Jiapaer, G.; Chen, X.; Bao, A. A comparison of methods for estimating fractional vegetation cover in arid regions. Agric. For. Meteorol. 2011, 151, 1698–1710. [Google Scholar] [CrossRef]
- Li, S.; Wu, H. Mapping karst rocky desertification using landsat 8 images. Remote Sens. Lett. 2015, 6, 657–666. [Google Scholar] [CrossRef]
- Tong, X.; Wang, K.; Yue, Y.; Brandt, M.; Liu, B.; Zhang, C.; Liao, C.; Fensholt, R. Quantifying the effectiveness of ecological restoration projects on long-term vegetation dynamics in the karst regions of southwest China. Int. J. Appl. Earth Obs. Geoinf. 2017, 54, 105–113. [Google Scholar] [CrossRef]
- Wang, S.J.; Li, Y.B. Problems and development trends about researches on karst rocky desertification. Adv. Earth Sci. 2007, 22, 573–582. [Google Scholar]
- Nemani, R.R.; Keeling, C.D.; Hashimoto, H.; Jolly, W.M.; Piper, S.C.; Tucker, C.J.; Myneni, R.B.; Running, S.W. Climate-driven increases in global terrestrial net primary production from 1982 to 1999. Science 2003, 300, 1560–1563. [Google Scholar] [CrossRef] [PubMed]
- Huang, Q.; Cai, Y. Mapping karst rock in southwest China. Mt. Res. Dev. 2009, 29, 14–20. [Google Scholar] [CrossRef]
- Xie, X.; Du, P.; Xia, J.; Luo, J. Spectral indices for estimating exposed carbonate rock fraction in karst areas of southwest China. IEEE Geosci. Remote Sens. Lett. 2015, 12, 1988–1992. [Google Scholar] [CrossRef]
- Zhang, C.; Qi, X.; Wang, K.; Zhang, M.; Yue, Y. The application of geospatial techniques in monitoring karst vegetation recovery in southwest China: A review. Prog. Phys. Geogr. 2017, 41, 450–477. [Google Scholar] [CrossRef]
- Zhang, Z.; Ouyang, Z.; Xiao, Y.; Xiao, Y.; Xu, W. Using principal component analysis and annual seasonal trend analysis to assess karst rocky desertification in southwestern China. Environ. Monit. Assess. 2017, 189, 269. [Google Scholar] [CrossRef] [PubMed]
- Huete, A.; Miura, T.; Gao, X. Land cover conversion and degradation analyses through coupled soil-plant biophysical parameters derived from hyperspectral EO-1 Hyperion. IEEE Trans. Geosci. Remote Sens. 2003, 41, 1268–1276. [Google Scholar] [CrossRef]
- Pu, R.; Peng, G.; Michishita, R.; Sasagawa, T. Spectral mixture analysis for mapping abundance of urban surface components from the Terra/ASTER data. Remote Sens. Environ. 2008, 112, 939–954. [Google Scholar] [CrossRef]
- Sun, G.; Chen, X.; Ren, J.; Zhang, A.; Jia, X. Stratified spectral mixture analysis of medium resolution imagery for impervious surface mapping. Int. J. Appl. Earth Obs. Geoinf. 2017, 60, 38–48. [Google Scholar] [CrossRef]
- Yue, Y.; Wang, K.; Zhang, B.; Liu, B.; Chen, H.; Zhang, M. Uncertainty of remotely sensed extraction of information of karst rocky desertification. Adv. Earth Sci. 2011, 26, 266–274. [Google Scholar]
- Adams, J.B.; Smith, M.O.; Johnson, P.E. Spectral mixture modeling: A new analysis of rock and soil types at the Viking Lander I site. J. Geophys. Res.-Atmos. 1986, 91, 8098–8112. [Google Scholar] [CrossRef]
- Keshava, N.; Mustard, J.F. Spectral unmixing. IEEE Signal Process. Mag. 2002, 19, 44–57. [Google Scholar] [CrossRef]
- Price, J.C. How unique are spectral signatures? Remote Sens. Environ. 1994, 49, 181–186. [Google Scholar] [CrossRef]
- Chang, C.I. Hyperspectral Imaging: Techniques for Spectral Detection and Classification; Plenum Publishing Co.: New York, NY, USA, 2003. [Google Scholar]
- Zhang, B. Advancement of hyperspectral image processing and information extraction. J. Remote Sens. 2016, 20, 1062–1090. [Google Scholar] [CrossRef]
- Wang, Y.; Yuan, D.X.; Yang, S.Y. Effective exploitation model of karst water in Xiaojiang basin, Luxi county, Yunnan. Carsologica Sin. 2005, 24, 305–311. [Google Scholar]
- Qin, X.M.; Jiang, Z.C.; He, B.H.; Lao, W.K.; Li, Y.Q.; Zhao, Y.; Lan, F.N. Current status and treatment of rocky desertification in key eastern areas of the Nandong subterranean river system. Carsologica Sin. 2014, 33, 456–463. [Google Scholar] [CrossRef]
- Jiang, Y.J.; Li, L.L.; Groves, C.; Yuan, D.X.; Kambesis, P. Relationships between rocky desertification and spatial pattern of land use in typical karst area, southwest China. Environ. Earth Sci. 2009, 59, 881–890. [Google Scholar] [CrossRef]
- Zhang, H.K.; Roy, D.P.; Yan, L.; Li, Z.; Huang, H.; Vermote, E.; Skakun, S.; Roger, J.C. Characterization of Sentinel-2a and Landsat-8 top of atmosphere, surface, and nadir brdf adjusted reflectance and NDVI differences. Remote Sens. Environ. 2018. [Google Scholar] [CrossRef]
- Tian, H.; Wu, M.; Wang, L.; Niu, Z. Mapping early, middle and late rice extent using Sentinel-1A and Landsat-8 data in the Poyang Lake Plain, China. Sensors 2018, 18, 185. [Google Scholar] [CrossRef] [PubMed]
- Dao, P.; Liou, Y.A. Object-based flood mapping and affected rice field estimation with Landsat 8 OLI and MODIS data. Remote Sens. 2015, 7, 5077–5097. [Google Scholar] [CrossRef]
- Chai, T.; Draxler, R.R. Root mean square error (RMSE) or mean absolute error (MAE)?—Arguments against avoiding RMSE in the literature. Geosci. Model Dev. 2014, 7, 1247–1250. [Google Scholar] [CrossRef]
- Mentaschi, L.; Besio, G.; Cassola, F.; Mazzino, A. Problems in RMSE-based wave model validations. Ocean Model. 2013, 72, 53–58. [Google Scholar] [CrossRef]
- De Myttenaere, A.; Golden, B.; Le Grand, B.; Rossi, F. Mean absolute percentage error for regression models. Neurocomputing 2016, 192, 38–48. [Google Scholar] [CrossRef]
- Tian, H.; Li, W.; Wu, M.; Huang, N.; Li, G.; Li, X.; Niu, Z. Dynamic monitoring of the largest freshwater lake in China using a new water index derived from high spatiotemporal resolution Sentinel-1A data. Remote Sens. 2017, 9, 521. [Google Scholar] [CrossRef]
- Yang, Q.Y.; Ma, Z.L.; Jiang, Z.C.; Luo, W.Q.; Xie, Y.Q. Restoration of missing information of mountain shadow on remote sensing images in peak cluster karst area based on kriging. Remote Sens. Land Resour. 2012, 32, 112–116. [Google Scholar] [CrossRef]
- Assyakur, A.R.; Adnyana, I.W.S.; Arthana, I.W.; Nuarsa, I.W. Enhanced built-up and bareness index (EBBI) for mapping built-up and bare land in an urban area. Remote Sens. 2012, 4, 2957–2970. [Google Scholar] [CrossRef]
- Zha, Y.; Gao, J.; Ni, S. Use of normalized difference built-up index in automatically mapping urban areas from TM imagery. Int. J. Remote Sens. 2003, 24, 583–594. [Google Scholar] [CrossRef]
- Tong, X.; Wang, K.; Brandt, M.; Yue, Y.; Liao, C.; Fensholt, R. Assessing future vegetation trends and restoration prospects in the karst regions of southwest China. Remote Sens. 2016, 8, 357. [Google Scholar] [CrossRef]
- Hill, J.; Mégier, J.; Mehl, W. Land degradation, soil erosion and desertification monitoring in mediterranean ecosystems. Remote Sens. Rev. 1995, 12, 107–130. [Google Scholar] [CrossRef]
- Armston, J.D.; Denham, R.J.; Danaher, T.J.; Scarth, P.F.; Moffiet, T.N. Prediction and validation of foliage projective cover from Landsat-5 TM and Landsat-7 ETM+ imagery. J. Appl. Remote Sens. 2009, 3, 33540. [Google Scholar] [CrossRef]
- Kim, M.K.; Daigle, J.J. Detecting vegetation cover change on the summit of cadillac mountain using multi-temporal remote sensing datasets: 1979, 2001, and 2007. Environ. Monit. Assess. 2011, 180, 63–75. [Google Scholar] [CrossRef] [PubMed]
- Bai, X.Y.; Wang, S.J.; Xiong, K.N. Assessing spatial-temporal evolution processes of karst rocky desertification land: Indications for restoration strategies. Land Degrad. Dev. 2013, 24, 47–56. [Google Scholar] [CrossRef]
- Huete, A.R. A soil-adjusted vegetation index (SAVI). Remote Sens. Environ. 1988, 25, 295–309. [Google Scholar] [CrossRef]
- Li, H.; Wang, C.; Zhong, C.; Su, A.; Xiong, C.; Wang, J.; Liu, J. Mapping urban bare land automatically from landsat imagery with a simple index. Remote Sens. 2017, 9, 249. [Google Scholar] [CrossRef]
- Haboudane, D.; Miller, J.R.; Pattey, E.; Zarco-Tejada, P.J.; Strachan, I.B. Hyperspectral vegetation indices and novel algorithms for predicting green lai of crop canopies: Modeling and validation in the context of precision agriculture. Remote Sens. Environ. 2004, 90, 337–352. [Google Scholar] [CrossRef]
- Meer, F.V.D. Analysis of spectral absorption features in hyperspectral imagery. Int. J. Appl. Earth Obs. Geoinf. 2004, 5, 55–68. [Google Scholar] [CrossRef]
- Younis, M.T.; Gilabert, M.A.; Melia, J.; Bastida, J. Weathering process effects on spectral reflectance of rocks in a semi-arid environment. Int. J. Remote Sens. 1997, 18, 3361–3377. [Google Scholar] [CrossRef]
- Hou, W.; Gao, J.; Wu, S.; Dai, E. Interannual variations in growing-season NDVI and its correlation with climate variables in the southwestern karst region of China. Remote Sens. 2015, 7, 11105–11124. [Google Scholar] [CrossRef]
- Pekkarinen, A. A method for the segmentation of very high spatial resolution images of forested landscapes. Int. J. Remote Sens. 2002, 23, 2817–2836. [Google Scholar] [CrossRef]
- Xu, E.; Zhang, H.; Li, M. Mining spatial information to investigate the evolution of karst rocky desertification and its human driving forces in Changshun, China. Sci. Total Environ. 2013, 458–460, 419–426. [Google Scholar] [CrossRef] [PubMed]
- Jing, J.; Wang, Y. Evolution characteristics of karst rocky desertification in Guangxi based on MODIS NDVI. Res. Soil Water Conserv. 2015, 22, 123–135. [Google Scholar]
- Ying, B.; Xiao, S.Z.; Xiong, K.N.; Cheng, Q.W.; Luo, J.S. Comparative studies of the distribution characteristics of rocky desertification and land use/land cover classes in typical areas of Guizhou province, China. Environ. Earth Sci. 2014, 71, 631–645. [Google Scholar] [CrossRef]
- Qi, X.; Wang, K.; Zhang, C. Effectiveness of ecological restoration projects in a karst region of southwest China assessed using vegetation succession mapping. Ecol. Eng. 2013, 54, 245–253. [Google Scholar] [CrossRef]
- Padarian, J.; Minasny, B.; Mcbratney, A.B. Using Google’s Cloud-Based Platform for Digital Soil Mapping; Pergamon Press, Inc.: Oxford, UK, 2015; pp. 80–88. [Google Scholar]
- Lillesand, T.M.; Kiefer, R.W.; Chipman, J.W. Remote Sensing and Image Interpretation, 5th ed.; Wiley: New York, NY, USA, 2004; p. 146. ISBN 0471152277. [Google Scholar]
- Lu, D.; Weng, Q. A survey of image classification methods and techniques for improving classification performance. Int. J. Remote Sens. 2007, 28, 823–870. [Google Scholar] [CrossRef]
- Zhang, Z.; Clercq, E.D.; Ou, X.K.; Wulf, R.D.; Verbeke, L. Mapping dominant vegetation communities at meili snow mountain, Yunnan province, China using satellite imagery and plant community data. Geocarto Int. 2008, 23, 135–153. [Google Scholar] [CrossRef]
- Weiss, D.J.; Walsh, S.J. Remote sensing of mountain environments. Geogr. Compass 2009, 3, 1–21. [Google Scholar] [CrossRef]


| Acquisition Date | Scene ID | Path | Row | Sun Azimuth (°) | Sun Elevation (°) | Cloud Amount (%) |
|---|---|---|---|---|---|---|
| 9 January 2017 | LC81290432017009LGN01 | 129 | 43 | 150.58 | 37.48 | 0.61 |
| 14 March 2017 | LC81290442017073LGN00 | 129 | 44 | 132.15 | 54.14 | 0.14 |
| Indices | Xiaojiang | Nandong | ||||||
|---|---|---|---|---|---|---|---|---|
| Root Mean Square Error (RMSE) (%) | Mean Absolute Error (MAE) (%) | Root Mean Absolute Percentage Error (RMAPE) (%) | Coefficient of Determination (R2) | RMSE (%) | MAE (%) | RMAPE (%) | R2 | |
| KBRI | 5.59 | 4.63 | 13.59 | 0.72 | 8.62 | 7.01 | 5.93 | 0.70 |
| CRI1 | 7.92 | 6.12 | 26.04 | 0.43 | 19.55 | 15.42 | 52.19 | 0.13 |
| CRI2 | 7.94 | 6.20 | 24.99 | 0.43 | 18.21 | 14.46 | 50.89 | 0.15 |
| NDRI1 | 10.05 | 7.45 | 33.60 | 0.09 | 14.74 | 10.85 | 37.20 | 0.00 |
| NDRI2 | 5.90 | 4.77 | 14.87 | 0.68 | 11.44 | 8.57 | 33.03 | 0.45 |
| NDBI | 5.86 | 4.85 | 12.31 | 0.69 | 11.11 | 8.16 | 32.66 | 0.43 |
| NDVI | 7.82 | 5.99 | 26.15 | 0.45 | 15.59 | 11.87 | 38.13 | 0.16 |
| SRI1 | 11.24 | 8.57 | 35.51 | 0.18 | 13.91 | 11.04 | 8.81 | 0.26 |
| SRI2 | 39.44 | 38.46 | 59.06 | 0.51 | 10.62 | 8.47 | 6.43 | 0.40 |
| Region | EBF Level | <5% | 5–15% | 15–30% | 30–50% | >50% |
|---|---|---|---|---|---|---|
| Xiaojiang | Proportion (%) | 29.73 | 14.91 | 26.99 | 26.77 | 1.59 |
| Area (km2) | 299.84 | 150.35 | 272.21 | 269.92 | 16.06 | |
| Nandong | Proportion (%) | 10.82 | 9.84 | 24.18 | 44.42 | 10.75 |
| Area (km2) | 174.94 | 159.06 | 390.94 | 718.34 | 173.84 |
© 2018 by the authors. Licensee MDPI, Basel, Switzerland. This article is an open access article distributed under the terms and conditions of the Creative Commons Attribution (CC BY) license (http://creativecommons.org/licenses/by/4.0/).
Share and Cite
Pei, J.; Wang, L.; Huang, N.; Geng, J.; Cao, J.; Niu, Z. Analysis of Landsat-8 OLI Imagery for Estimating Exposed Bedrock Fractions in Typical Karst Regions of Southwest China Using a Karst Bare-Rock Index. Remote Sens. 2018, 10, 1321. https://doi.org/10.3390/rs10091321
Pei J, Wang L, Huang N, Geng J, Cao J, Niu Z. Analysis of Landsat-8 OLI Imagery for Estimating Exposed Bedrock Fractions in Typical Karst Regions of Southwest China Using a Karst Bare-Rock Index. Remote Sensing. 2018; 10(9):1321. https://doi.org/10.3390/rs10091321
Chicago/Turabian StylePei, Jie, Li Wang, Ni Huang, Jing Geng, Jianhua Cao, and Zheng Niu. 2018. "Analysis of Landsat-8 OLI Imagery for Estimating Exposed Bedrock Fractions in Typical Karst Regions of Southwest China Using a Karst Bare-Rock Index" Remote Sensing 10, no. 9: 1321. https://doi.org/10.3390/rs10091321
APA StylePei, J., Wang, L., Huang, N., Geng, J., Cao, J., & Niu, Z. (2018). Analysis of Landsat-8 OLI Imagery for Estimating Exposed Bedrock Fractions in Typical Karst Regions of Southwest China Using a Karst Bare-Rock Index. Remote Sensing, 10(9), 1321. https://doi.org/10.3390/rs10091321