Improvement in Surface Solar Irradiance Estimation Using HRV/MSG Data

 ,
,  ,
,  , ,
, ,  ,
,  , , and
Abstract
:
1. Introduction
2. Data and Methods
3. Methodology
4. Results and Discussion
5. Conclusions
Author Contributions
Funding
Conflicts of Interest
References
- Roupioz, L.; Jia, L.; Nerry, F.; Menenti, M. Estimation of daily solar radiation budget at kilometer resolution over the Tibetan Plateau by integrating MODIS data products and a DEM. Remote Sens. 2016, 8, 504. [Google Scholar] [CrossRef]
- Castelli, M.; Stöckli, R.; Zardi, D.; Tetzlaff, A.; Wagner, J.E.; Belluardo, G.; Zebisch, M.; Petitta, M. The HelioMont method for assessing solar irradiance over complex terrain: Validation and improvements. Remote Sens. Environ. 2014, 152, 603–613. [Google Scholar] [CrossRef]
- BWielicki, B.; Cess, R.D.; King, M.D.; Randall, D.A.; Harrison, E.F. Mission to planet Earth: Role of clouds and radiation in climate. Bull. Am. Meteorol. Soc. 1995, 76, 2125–2153. [Google Scholar] [CrossRef]
- Iqbal, M. An Introduction to Solar Radiation; Academic Press: Cambridge, MA, USA, 1983. [Google Scholar]
- Perez, R.; Seals, R.; Zelenka, A. Comparing satellite remote sensing and ground network measurements for the production of site/time specific irradiance data. Sol. Energy 1997, 60, 89–96. [Google Scholar] [CrossRef]
- Zelenka, A.; Czeplak, G.; D’Agostino, V.; Josefson, W.; Maxwell, E.; Perez, R. Techniques for Supplementing Solar Radiation Network Data; International Energy Agency: Paris, France, 1992. [Google Scholar]
- Mueller, R.; Behrendt, T.; Hammer, A.; Kemper, A. A New Algorithm for the Satellite-Based Retrieval of Solar Surface Irradiance in Spectral Bands. Remote Sens. 2012, 4, 622–647. [Google Scholar] [CrossRef] [Green Version]
- Deneke, H.M.; Feijt, A.J.; Roebeling, R.A. Estimating surface solar irradiance from METEOSAT SEVIRI-derived cloud properties. Remote Sens. Environ. 2008, 112, 3131–3141. [Google Scholar] [CrossRef]
- Qu, Z.; Gschwind, B.; Lefèvre, M.; Wald, L. Improving HelioClim-3 estimates of surface solar irradiance using the McClear clear-sky model and recent advances in atmosphere composition. Atmos. Meas. Tech. 2014, 7, 3927–3933. [Google Scholar] [CrossRef] [Green Version]
- Journée, M.; Bertrand, C. Improving the spatio-temporal distribution of surface solar radiation data by merging ground and satellite measurement. Remote Sens. Environ. 2010, 114, 2692–2704. [Google Scholar] [CrossRef]
- Xia, S.; Mestas-Nuñez, A.M.; Xie, H.; Vega, R. An Evaluation of Satellite Estimates of Solar Surface Irradiance Using Ground Observations in San Antonio, Texas, USA. Remote Sens. 2017, 9, 1268. [Google Scholar] [CrossRef]
- Antonanzas-Torres, F.; Martínez de Pisón, F.J.; Antonanzas, J.; Perpiñán, O. Downscaling of global solar irradiation in complex areas in R. J. Renew. Sustain. Energy 2014, 6, 063105. [Google Scholar] [CrossRef]
- Bessafi, M.; Oree, V.; Khoodaruth, A.; Jumaux, G.; Bonnardot, F.; Jeanty, P.; Delsaut, M.; Chabriat, J.-P.; Dauhoo, M.Z. Downscaling solar irradiance using DEM-based model in young volcanic islands with rugged topography. Renew. Energy 2018, 126, 584–593. [Google Scholar] [CrossRef]
- Journée, M.; Bertrand, C. Geostatistical merging of ground-based and satellite-derived data of surface solar radiation. Adv. Sci. Res. 2011, 6, 1–5. [Google Scholar] [CrossRef] [Green Version]
- Wang, H.M.; Pinker, R.T. Shortwave radiative fluxes from MODIS: Model development and implementation. J. Geophys. Res. 2009, 114. [Google Scholar] [CrossRef] [Green Version]
- Huang, G.; Liu, S.; Liang, S. Estimation of net surface shortwave radiation from MODIS data. Int. J. Remote Sens. 2012, 33, 804–825. [Google Scholar] [CrossRef]
- Sun, Z.; Liu, J.; Zeng, X.; Liang, H. Parameterization of instan-taneous global horizontal irradiance: Cloudy-sky component. J. Geophys. Res. 2012, 117. [Google Scholar] [CrossRef]
- Mueller, R.; Matsoukas, C.; Gratzki, A.; Behr, H.; Hollmann, R. The CM–SAF operational scheme for the satellite based retrieval of solar surface irradiance–A LUT based eigenvector hybrid approach. Remote Sens. Environ. 2009, 113, 1012–1024. [Google Scholar] [CrossRef]
- Geraldi, E.; Romano, F.; Ricciardelli, E. An Advanced Model for the Estimation of the Surface Solar Irradiance Under All Atmospheric Conditions Using MSG/SEVIRI Data. IEEE Trans. Geosci. Remote Sens. 2012, 50, 2934–2953. [Google Scholar] [CrossRef]
- Lu, N.; Liu, R.; Liu, J.; Liang, S. An algorithm for estimating downward shortwave radiation from GMS 5 visible imagery and its evaluation over China. J. Geophys. Res. 2010, 115. [Google Scholar] [CrossRef] [Green Version]
- Huang, G.; Ma, M.; Liang, S.; Liu, S.; Li, X. A LUT-based approach to estimate surface solar irradiance by combining MODIS and MTSAT data. J. Geophys. Res. 2011, 116. [Google Scholar] [CrossRef] [Green Version]
- Zhang, H.; Huang, C.; Yu, S.; Li, L.; Xin, X.; Liu, Q. A Lookup-Table-Based Approach to Estimating Surface Solar Irradiance from Geostationary and Polar-Orbiting Satellite Data. Remote Sens. 2018, 10, 411. [Google Scholar] [CrossRef]
- Hammer, A.; Heinemann, D.; Hoyer, C.; Lorenz, E.; Muller, R.; Beyer, H.G. Solar energy assessment using remote sensing technologies. Remote Sens. Environ. 2003, 86, 423–432. [Google Scholar] [CrossRef] [Green Version]
- Rigollier, C.; Lefèvre, M.; Wald, L. The method Heliosat-2 for deriving shortwave solar radiation from satellite images. Sol. Energy 2004, 77, 159–169. [Google Scholar] [CrossRef] [Green Version]
- Posselt, R.; Mueller, R.; Stöckli, R.; Trentmann, J. Remote sensing of solar surface radiation for climate monitoring—The CM-SAF retrieval in international comparison. Remote Sens. Environ. 2012, 118, 186–198. [Google Scholar] [CrossRef]
- Linares-Rodriguez, A.; Ruiz-Arias, J.A.; Pozo-Vazquez, D.; Tovar-Pescador, J. An artificial neural network ensemble model for estimating global solar radiation from Meteosat satellite images. Energy 2013, 61, 636–645. [Google Scholar] [CrossRef]
- Antonanzas-Torres, F.; Urraca, R.; Antonanzas, J.; Fernandez-Ceniceros, J.; Martinez-de-Pison, F.J. Generation of daily global solar irradiation with support vector machines for regression. Energy Convers. Manag. 2015, 96, 277–286. [Google Scholar] [CrossRef]
- Zou, L.; Wang, L.; Lin, A.; Zhu, H.; Peng, Y.; Zhao, Z. Estimation of global solar radiation using an artificial neural network based on an interpolation technique in southeast China. J. Atmos. Sol. Terr. Phys. 2016, 146, 110–122. [Google Scholar] [CrossRef]
- Tang, W.; Qin, J.; Yang, K.; Liu, S.; Lu, N.; Niu, X. Retrieving high-resolution surface solar radiation with cloud parameters derived by combining MODIS and MTSAT data. Atmos. Chem. Phys. 2016, 16, 2543–2557. [Google Scholar] [CrossRef] [Green Version]
- Romano, F.; Cimini, D.; Nilo, S.T.; Di Paola, F.; Ricciardelli, E.; Ripepi, E.; Viggiano, M. The Role of Emissivity in the Detection of Arctic Night Clouds. Remote Sens. 2017, 9, 406. [Google Scholar] [CrossRef]
- Ricciardelli, E.; Romano, F.; Cuomo, V. Physical and statistical approaches for cloud identification usingMeteosat Second Generation-Spinning Enhanced Visible and Infrared Imager Data. Remote Sens. Environ. 2008, 112, 2741–2760. [Google Scholar] [CrossRef]
- Reuter, M.; Thomas, W.; Albert, P.; Lockhoff, M.; Weber, R.; Karlsson, K.G.; Fischer, J. The CM-SAF and FUB Cloud Detection Schemes for SEVIRI: Validation with Synoptic Data and Initial Comparison with MODIS and CALIPSO. J. Appl. Meteorol. Climatol. 2009, 48, 301–316. [Google Scholar] [CrossRef]
- Derrien, M.; Le Gléau, H. MSG/SEVIRI cloud mask type from SAFNWC. Int. J. Remote Sens. 2005, 26, 4707–4732. [Google Scholar] [CrossRef]
- Bley, S.; Deneke, H. A Threshold-based cloud mask for the high-resolution visible channel of Meteosat second generation SEVIRI. Atmos. Meas. Tech. 2013, 6, 2713–2723. [Google Scholar] [CrossRef]
- Ackerman, S.A.; Strabala, K.I.; Menzel, W.P.; Frey, R.A.; Moeller, C.C.; Gumley, L.E. Discriminating clear sky from clouds with MODIS. J. Geophys. Res. 1998, 103, 132–141. [Google Scholar] [CrossRef]
- Hocking, J.; Francis, P.N.; Saunders, R. Cloud detection in Meteosat Second Generation imagery at the Met Office. Meteorol. Appl. 2011, 18, 307–323. [Google Scholar] [CrossRef]
- Amato, U.; Antoniadis, A.; Cuomo, V.; Cutillo, L.; Franzese, M.; Murino, L.; Serio, C. Statistical cloud detection from SEVIRI multispectral images. Remote Sens. Environ. 2008, 112, 750–766. [Google Scholar] [CrossRef]
- Asmala, A.; Shaun, Q. Cloud masking for remotely sensed data using spectral and principal components analysis. ETASR Eng. Technol. Appl. Sci. Res. 2012, 2, 221–225. [Google Scholar]
- Nair, M.S.; Lakshmanan, R.; Wilscy, M.; Tatavarti, R. Fuzzy logic-based automatic contrast enhancement of satellite images of ocean. Signal Image Video Process. 2011, 5, 69–80. [Google Scholar] [CrossRef]
- Bose, A.; Mali, K. Fuzzy-based artificial bee colony optimization for gray image segmentation. Signal Image Video Proc. 2016, 10, 1089–1096. [Google Scholar] [CrossRef]
- Boulifa, M.; Adane, A.; Rezagui, A.; Ameur, Z. Estimate of the Global Solar Radiation by Cloudy Sky Using HRV Images. Energy Proc. 2015, 74, 1079–1089. [Google Scholar] [CrossRef]
- Bouchouicha, K.; Razagui, A.; Bachari, N.E.I.; Aoun, N. Estimation of Hourly Global Solar Radiation Using MSG-HRV images. Int. J. Appl. Environ. Sci. 2016, 11, 351–368, ISSN 0973-6077. Available online: https://www.ripublication.com/ijaes16/ijaesv11n2_01.pdf (accessed on 27 July 2018).
- Hammer, A.; Kühnert, J.; Weinreich, K.; Lorenz, E. Short-Term Forecasting of Surface Solar Irradiance Based on Meteosat-SEVIRI Data Using a Nighttime Cloud Index. Remote Sens. 2015, 7, 9070–9090. [Google Scholar] [CrossRef] [Green Version]
- Schmetz, J.; Pili, P.; Tjemkes, S.; Just, D.; Kerkmann, J.; Rota, S.; Ratier, A. An Introduction to Meteosat second generation (MSG). Bull. Am. Meteorol. Soc. 2002, 83, 977–992. [Google Scholar] [CrossRef]
- Gallucci, D.; Romano, F.; Cersosimo, A.; Cimini, D.; Di Paola, F.; Gentile, S.; Geraldi, E.; Larosa, S.; Nilo, S.T.; Ricciardelli, E.; et al. Nowcasting Surface Solar Irradiance with AMESIS via Motion Vector Fields of MSG-SEVIRI Data. Remote Sens. 2018, 10, 845. [Google Scholar] [CrossRef]
- Steinacker, R.; Haberli, C.; Pottschacher, W. A transparent method for the analysis quality evaluation of irregularly distributed noisy observational data. J. Appl. Meteorol. 2000, 12, 2303–2316. [Google Scholar] [CrossRef]
- Lussana, C.; Uboldi, F.; Salvati, M.R. A spatial consistency test for surface observations from mesoscale meteorological networks. Q. J. R. Meteorol. Soc. 2010, 136, 1075–1088. [Google Scholar] [CrossRef] [Green Version]
- Romano, F.; Ricciardelli, E.; Cimini, D.; Di Paola, F.; Viggiano, M. Dust Detection and Optical Depth Retrieval Using MSG-SEVIRI Data. Atmosphere 2013, 4, 35–47. [Google Scholar] [CrossRef]
- Ricciardell, E.; Cimini, D.; Di Paola, F.; Romano, F.; Viggiano, M.A. A statistical approach for rain intensity differentiation using Meteosat Second Generation-Spinning enhanced visible and infrared imager observations. Hidrol. Earth Syst. Sci. 2014, 18, 2559–2576. [Google Scholar] [CrossRef] [Green Version]
- Mace, G.G.; Zhang, Q. The CloudSat radar-lidar geometrical profile product (RL-GeoProf): Updates, improvements, and selected results. J. Geophys. Res. Atmos. 2014, 119. [Google Scholar] [CrossRef]
- Hanson, C.; Mueller, J. Status of the SEVIRI Level 1.5 Data. In Proceedings of the Second MSG RAO Workshop (ESA SP-582, November 2004), Salzburg, Austria, 9–10 September 2004; Available online: http://earth.esa.int/workshops/msg_rao_2004/papers/4_hanson.pdf (accessed on 24 June 2018).
- Dürr, B.; Zelenka, A. Deriving surface global irradiance over the Alpine region from Meteosat Second Generation by supplementing the HELIOSAT method. Int. J. Remote Sens. 2009, 30, 5821–5841. [Google Scholar] [CrossRef]
- Nilo, S.T.; Romano, F.; Cermak, J.; Cimini, D.; Ricciardelli, E.; Cersosimo, A.; Di Paola, F.; Gallucci, D.; Gentile, S.; Geraldi, E.; et al. Fog Detection Based on Meteosat Second Generation-Spinning Enhanced Visible and InfraRed Imager High Resolution Visible Channel. Remote Sens. 2018, 10, 541. [Google Scholar] [CrossRef]
- Krijger, J.M.; van Weele, M.; Aben, I.; Frey, R. Technical Note: The effect of sensor resolution on the number of cloud-free observations from space. Atmos. Chem. Phys. 2007, 7, 2881–2891. [Google Scholar] [CrossRef] [Green Version]


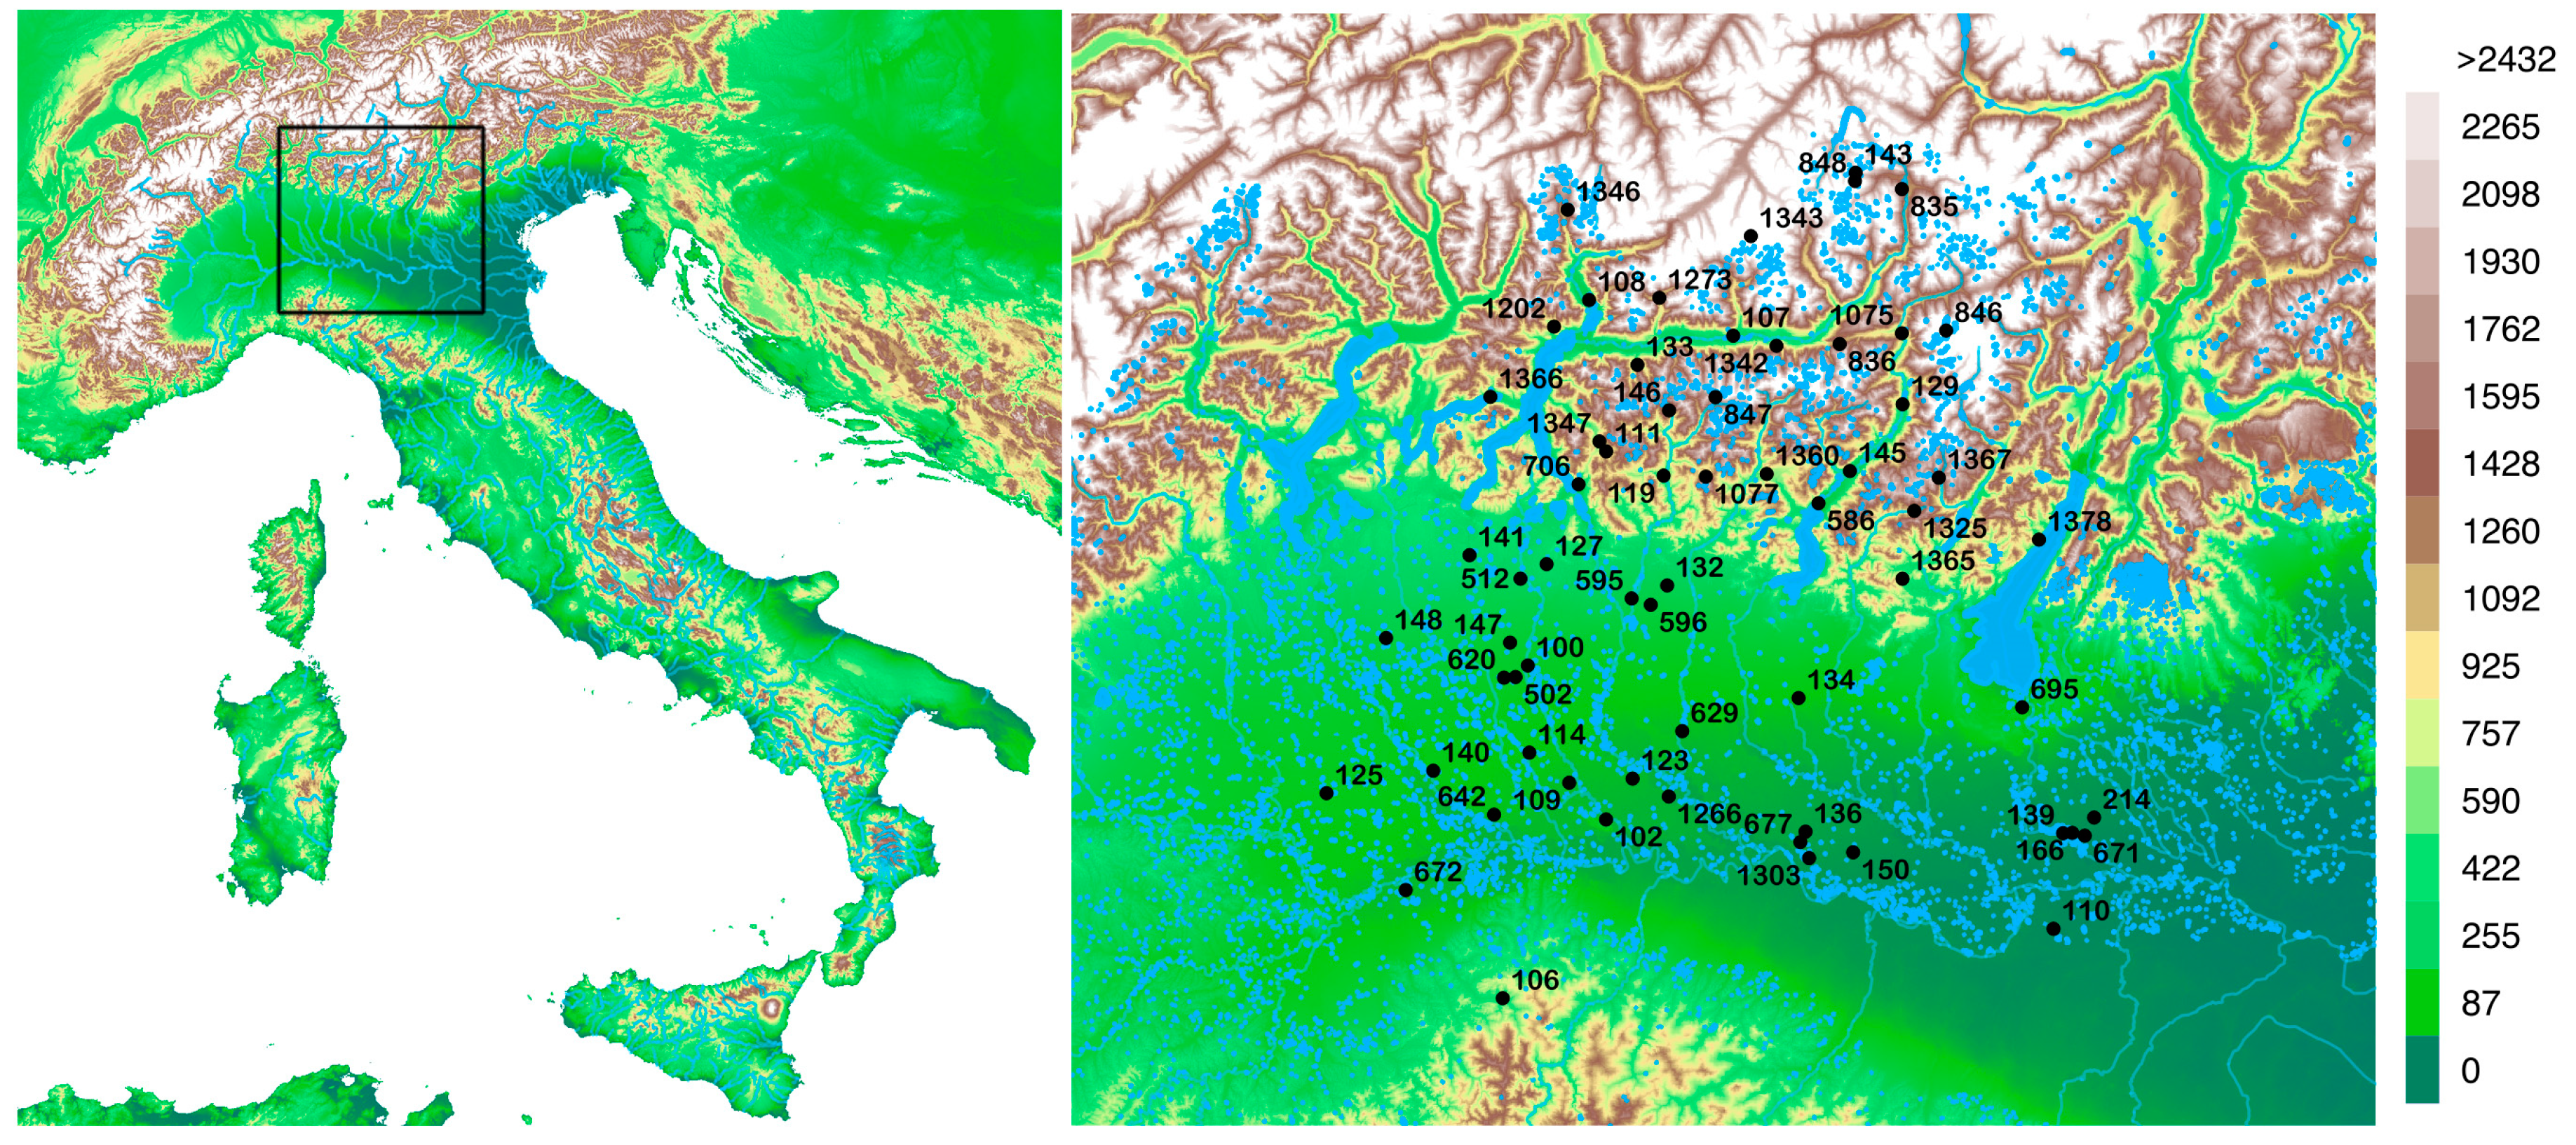
| ID_Station | Latitude | Longitude | Altitude (m) | ID_Station | Latitude | Longitude | Altitude (m) |
|---|---|---|---|---|---|---|---|
| 132 | 45.659851 | 19.659089 | 211 | 1347 | 45.950001 | 9.4600000 | 1713 |
| 146 | 46.013573 | 9.6624260 | 1824 | 110 | 44.963810 | 10.767801 | 22 |
| 595 | 45.633198 | 9.5564108 | 190 | 139 | 45.156864 | 10.797858 | 19 |
| 586 | 45.826481 | 10.097358 | 192 | 214 | 45.187836 | 10.887401 | 15 |
| 847 | 46.040707 | 9.7975283 | 1954 | 148 | 45.547844 | 8.8476763 | 182 |
| 1360 | 45.885708 | 9.9469538 | 564 | 166 | 45.157330 | 10.824207 | 25 |
| 119 | 45.881668 | 9.6473770 | 700 | 695 | 45.412109 | 10.683630 | 113 |
| 129 | 46.025890 | 10.342786 | 362 | 671 | 45.151348 | 10.860067 | 22 |
| 596 | 45.620644 | 9.6118517 | 182 | 100 | 45.496109 | 9.2578459 | 120 |
| 1077 | 45.880001 | 9.7700005 | 1138 | 102 | 45.186337 | 9.4865770 | 140 |
| 1325 | 45.810440 | 10.375551 | 1068 | 140 | 45.281292 | 8.9889202 | 100 |
| 1365 | 45.673401 | 10.340300 | 911 | 147 | 45.541992 | 9.2059374 | 142 |
| 1367 | 45.877102 | 10.447216 | 775 | 502 | 45.472557 | 9.2226477 | 122 |
| 134 | 45.433056 | 10.039325 | 93 | 620 | 45.470985 | 9.1894445 | 122 |
| 145 | 45.891499 | 10.188790 | 222 | 106 | 44.823254 | 9.1953688 | 500 |
| 846 | 46.174320 | 10.471110 | 2108 | 114 | 45.320095 | 9.2646246 | 88 |
| 1075 | 46.169319 | 10.341660 | 659 | 125 | 45.232506 | 8.6830683 | 106 |
| 1366 | 46.038010 | 9.1413231 | 291 | 512 | 45.671303 | 9.2342949 | 250 |
| 1378 | 45.750465 | 10.736627 | 291 | 642 | 45.194016 | 9.1649857 | 77 |
| 136 | 45.162968 | 10.059123 | 44 | 672 | 45.039421 | 8.9145050 | 74 |
| 141 | 45.717659 | 9.0858936 | 310 | 133 | 46.105179 | 9.5694208 | 800 |
| 150 | 45.121067 | 10.195482 | 39 | 143 | 46.493744 | 10.207782 | 2320 |
| 629 | 45.365639 | 9.7042618 | 79 | 848 | 46.477097 | 10.205837 | 2660 |
| 677 | 45.141880 | 10.044145 | 43 | 836 | 46.147926 | 10.159731 | 1950 |
| 1202 | 46.181168 | 9.3250074 | 980 | 1343 | 46.366001 | 9.8999996 | 3032 |
| 1303 | 45.109543 | 10.069242 | 36 | 1346 | 46.417400 | 9.3619003 | 1880 |
| 109 | 45.260002 | 9.3799944 | 60 | 107 | 46.164913 | 9.8488007 | 307 |
| 111 | 45.930000 | 9.4799995 | 1234 | 108 | 46.235424 | 9.4269791 | 206 |
| 123 | 45.269161 | 9.5620594 | 67 | 835 | 46.460434 | 10.343612 | 43 |
| 127 | 45.701279 | 9.3094740 | 360 | 1273 | 46.240761 | 9.6324825 | 1191 |
| 706 | 45.233459 | 9.4002743 | 272 | 1342 | 46.144493 | 9.9752855 | 2440 |
| 1266 | 45.233459 | 9.6662951 | 65 |
| Year | Month | Days |
|---|---|---|
| 2017 | June | 10 to 30 |
| 2017 | October | 1 to 20 |
| 2018 | March | 10 to 30 |
| N | CORR | MBE (W/m2) | RMSE (W/m2) | MAE (W/m2) | MAPE | |
|---|---|---|---|---|---|---|
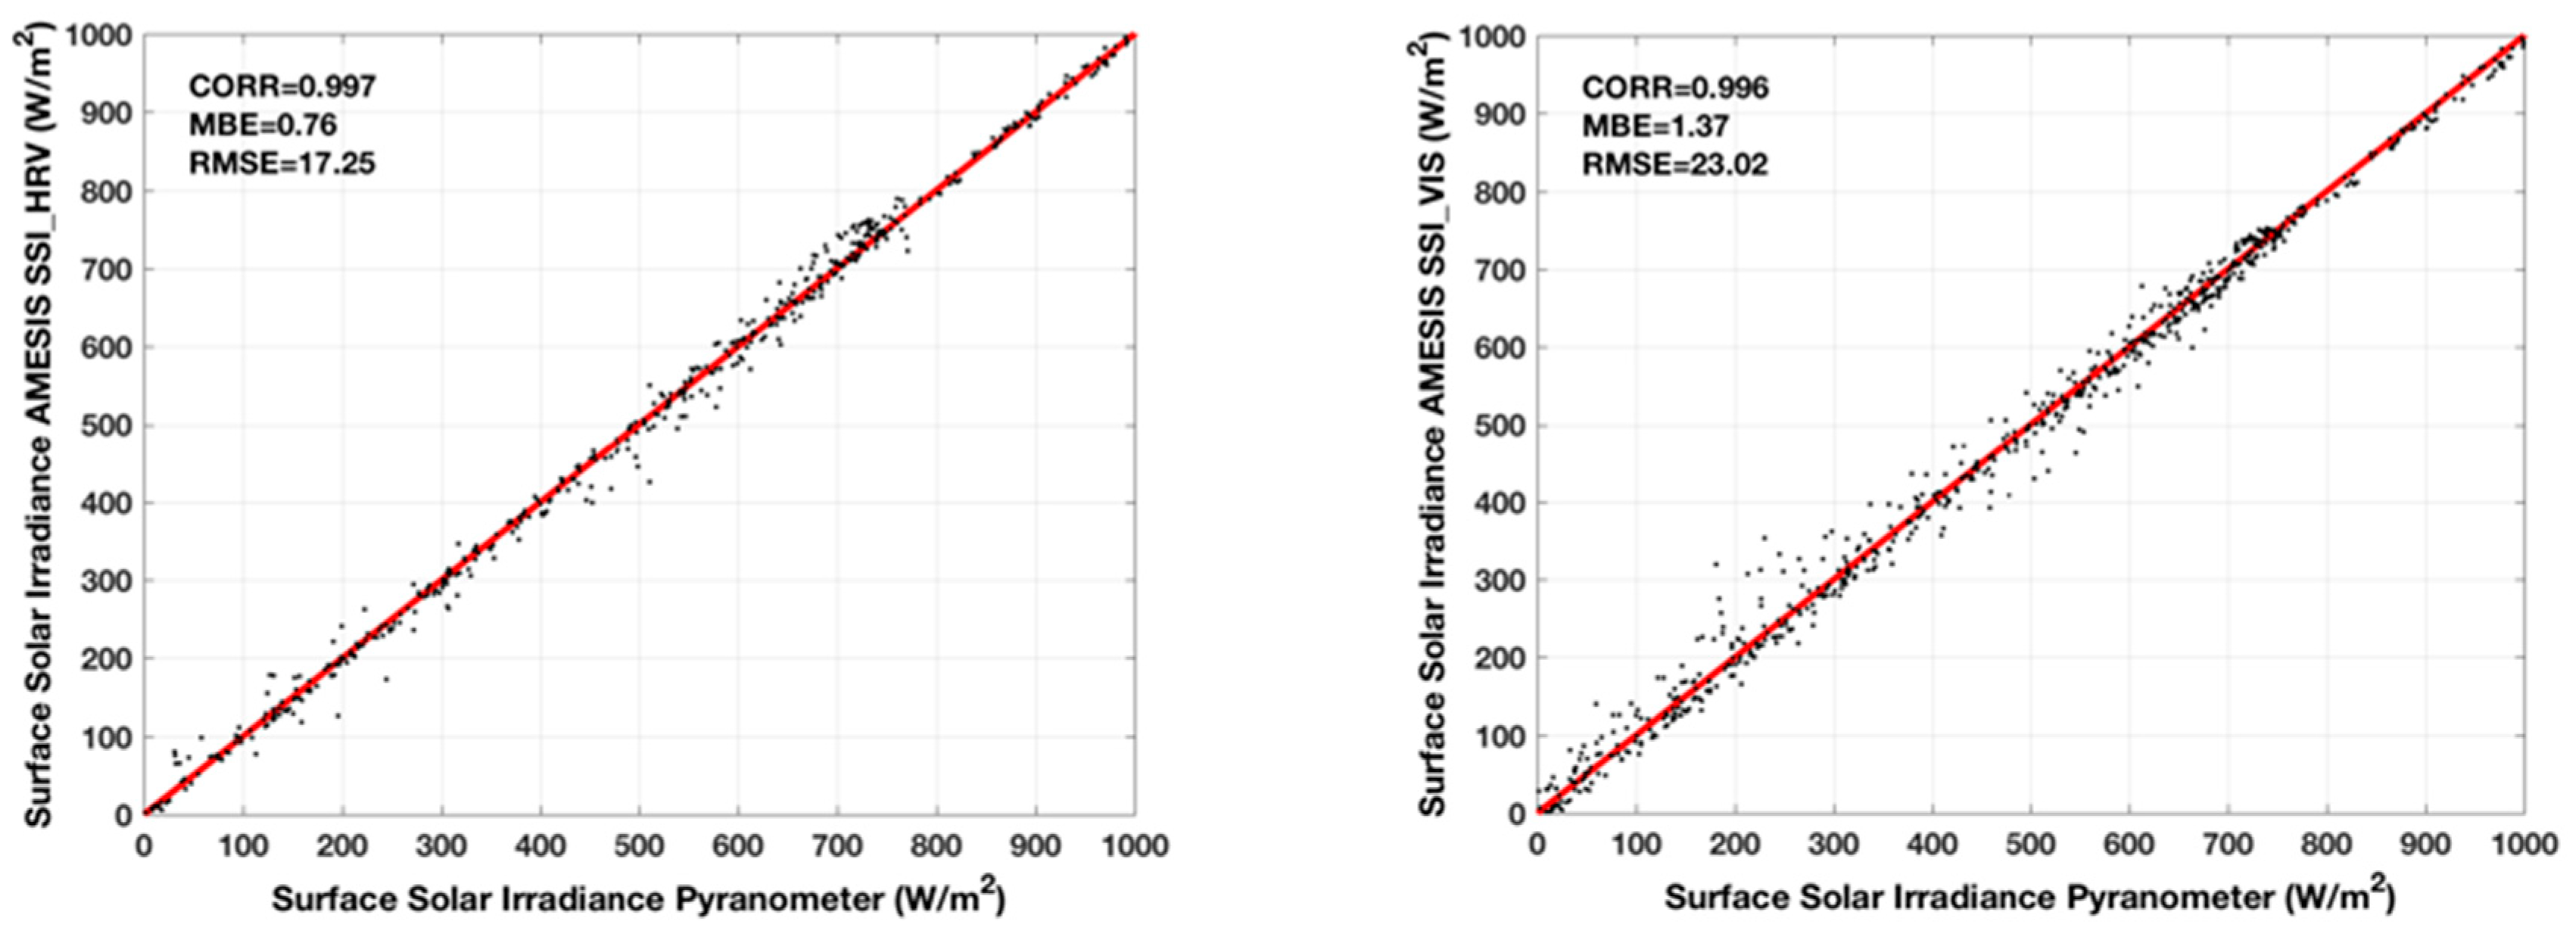
| Clear | 653 | 0.996 | 1.37 | 23.02 | 16.12 | 10.46 |
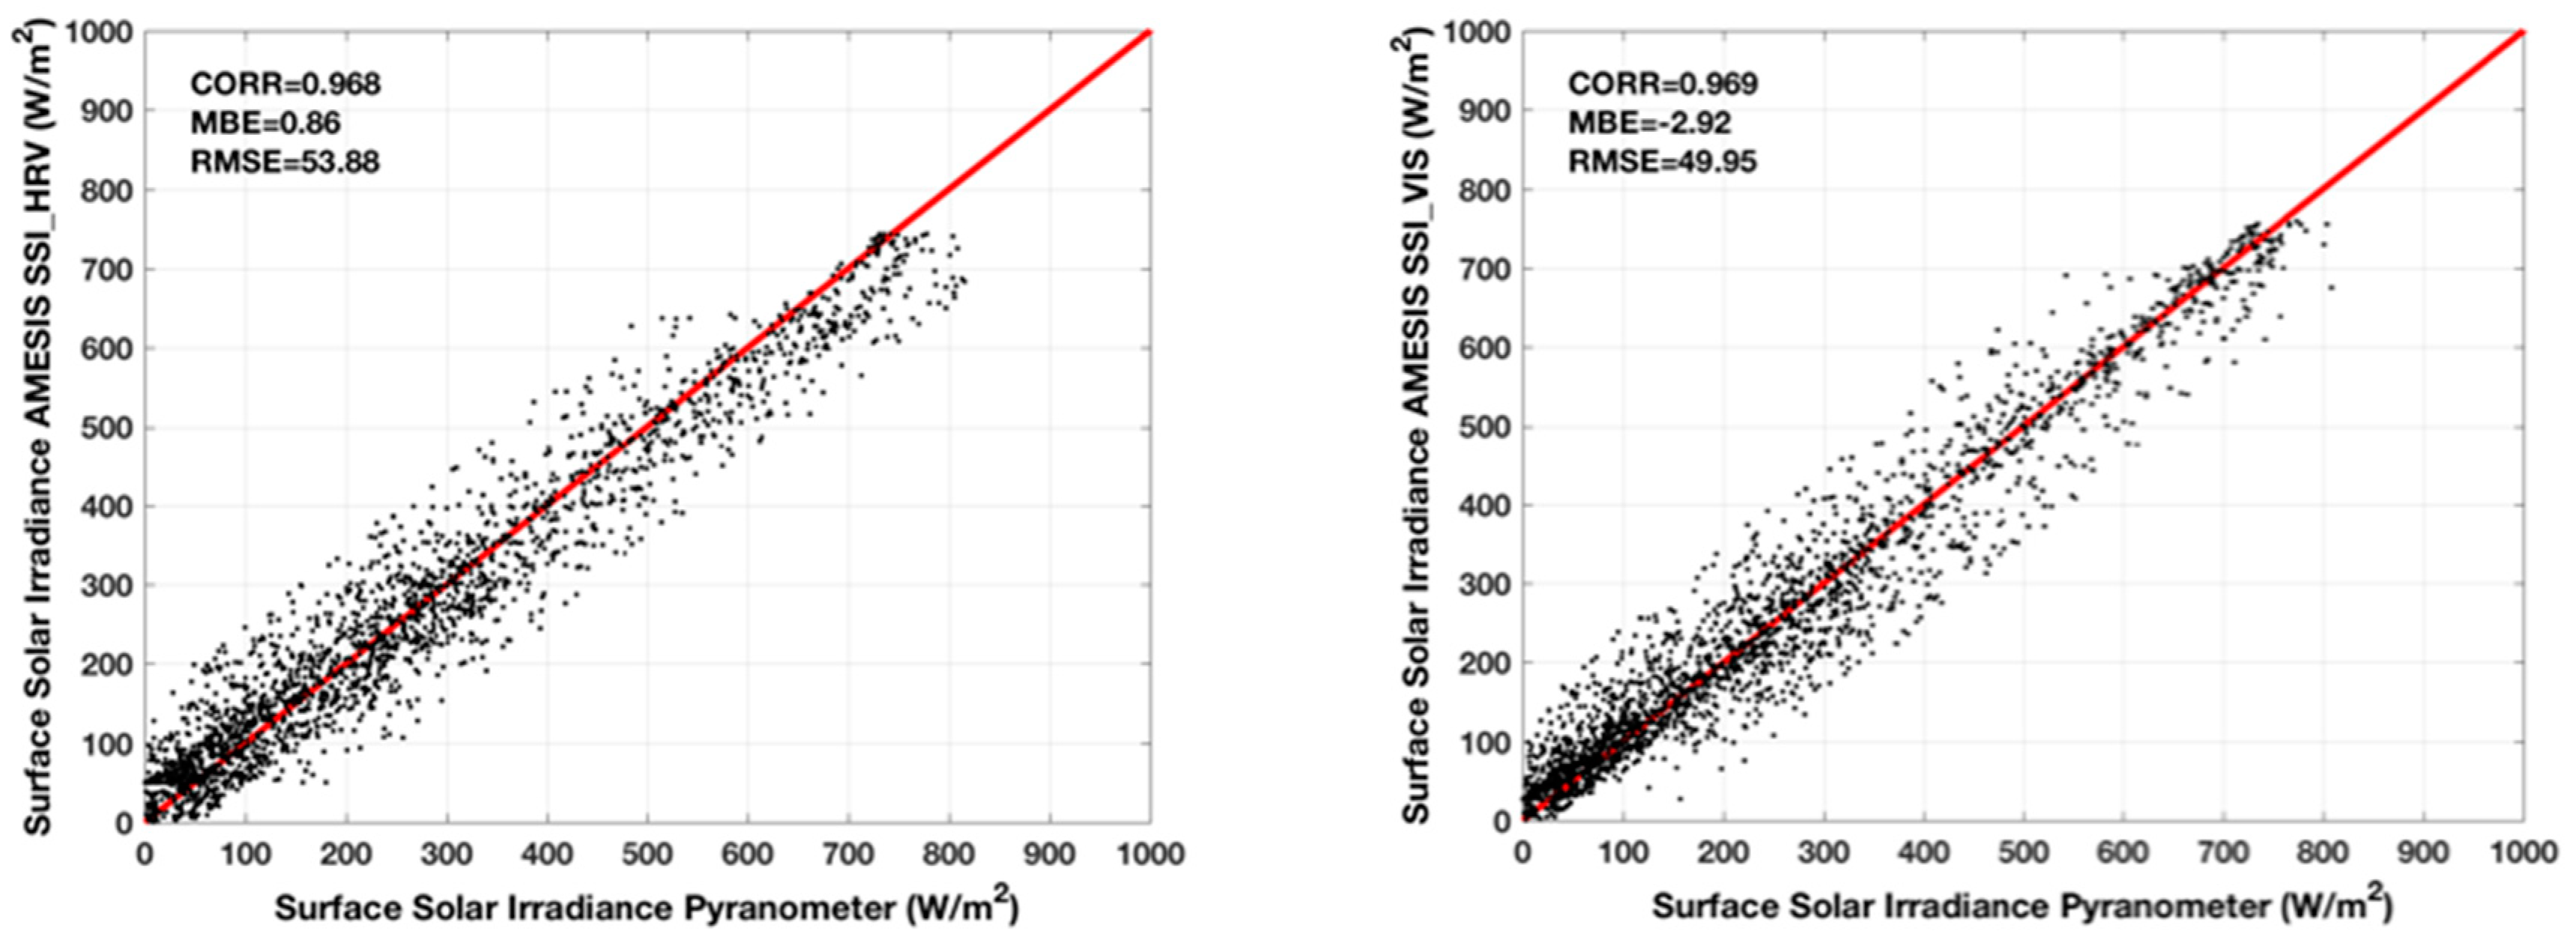
| Cloudy | 4564 | 0.969 | −2.92 | 49.95 | 36.47 | 24.31 |
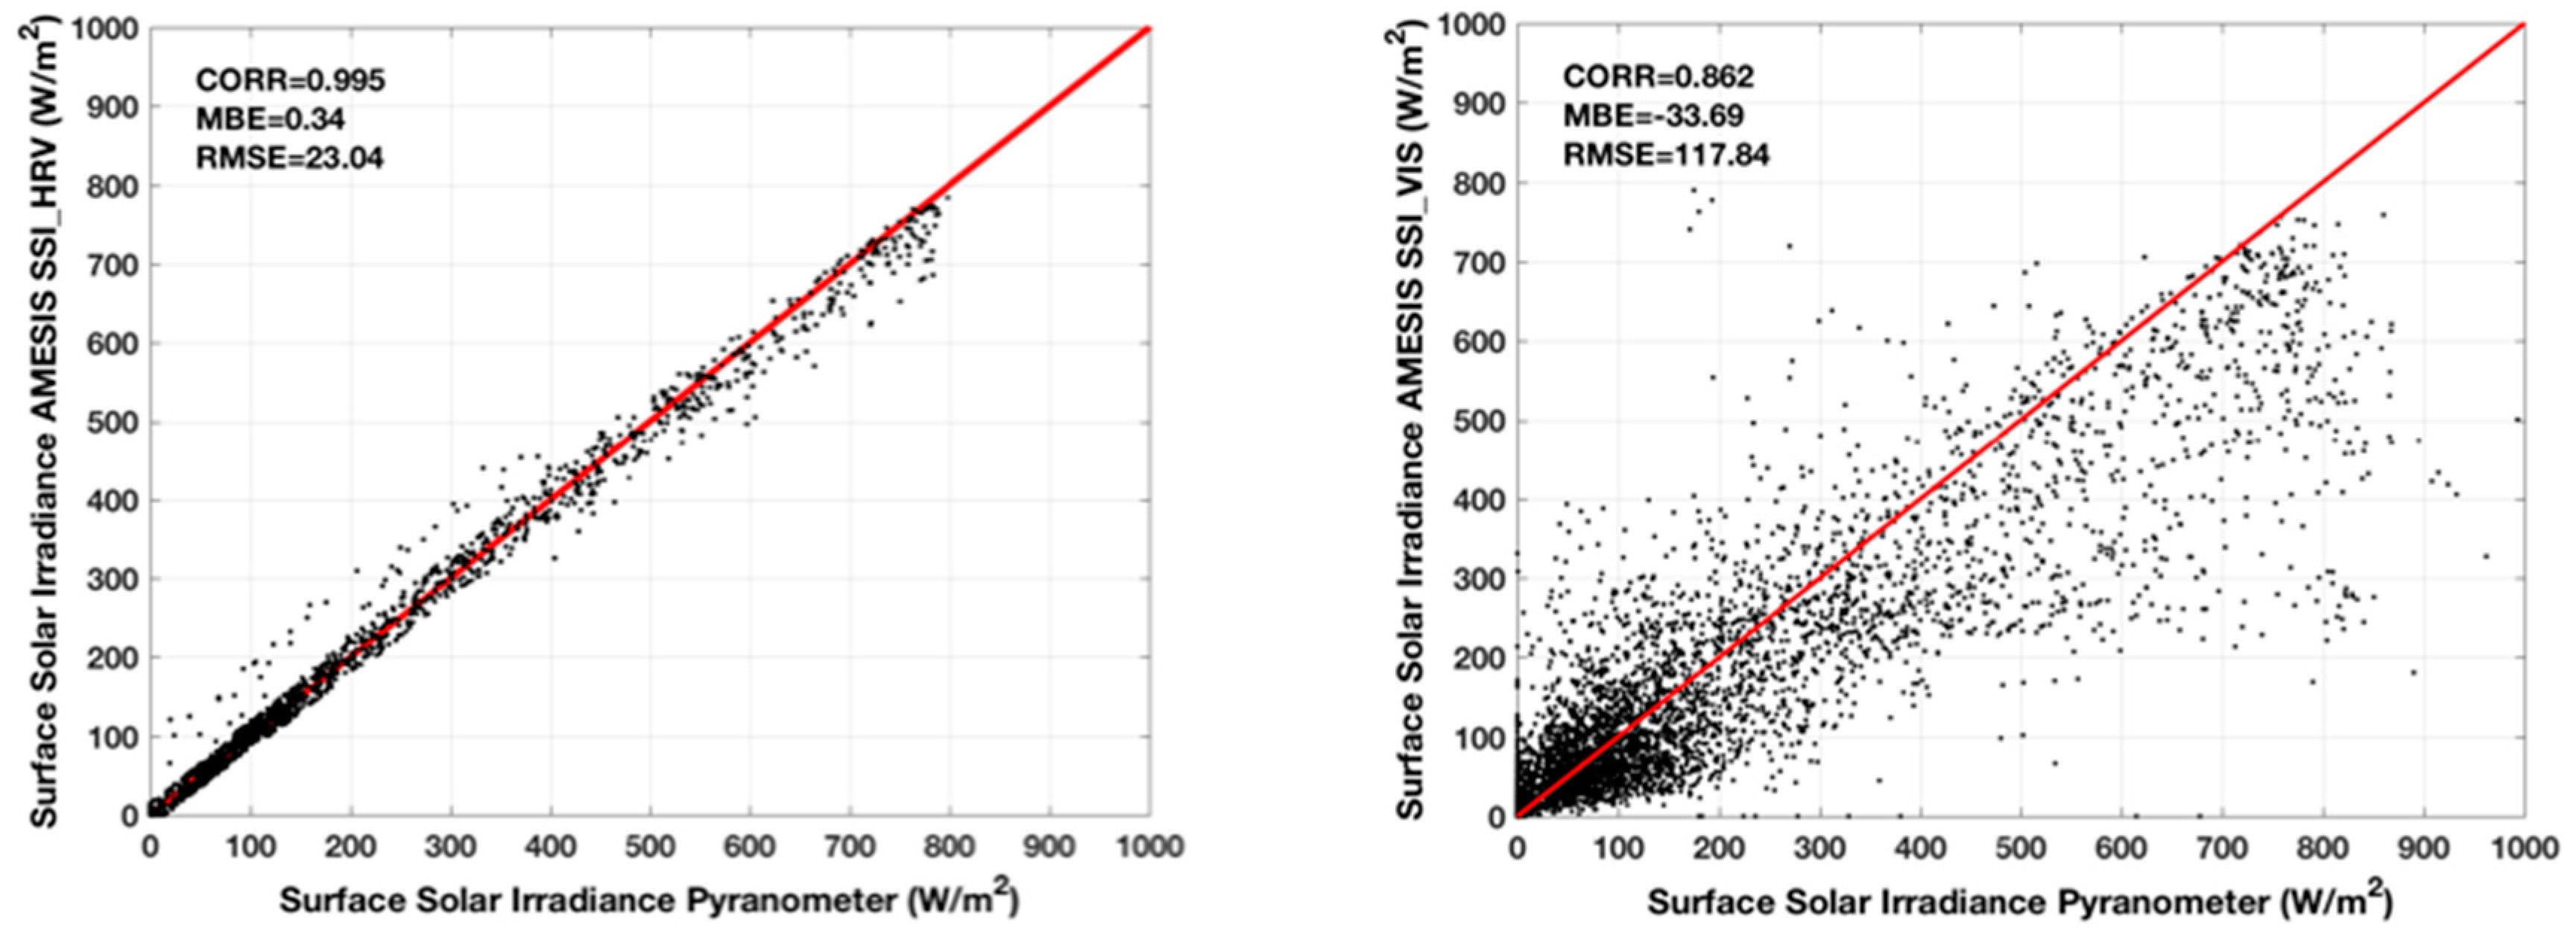
| Partially cloudy | 4028 | 0.862 | −33.69 | 117.84 | 76.84 | 112.13 |
| N | CORR | MBE (W/m2) | RMSE (W/m2) | MAE (W/m2) | MAPE | |
|---|---|---|---|---|---|---|
| Clear | 474 | 0.997 | 0.76 | 17.25 | 11.79 | 4.93 |
| Cloudy | 4558 | 0.968 | 0.86 | 53.88 | 41.91 | 33.07 |
| Partially cloudy | 4143 | 0.995 | 0.34 | 23.04 | 15.44 | 12.37 |
© 2018 by the authors. Licensee MDPI, Basel, Switzerland. This article is an open access article distributed under the terms and conditions of the Creative Commons Attribution (CC BY) license (http://creativecommons.org/licenses/by/4.0/).
Share and Cite
Romano, F.; Cimini, D.; Cersosimo, A.; Di Paola, F.; Gallucci, D.; Gentile, S.; Geraldi, E.; Larosa, S.; T. Nilo, S.; Ricciardelli, E.; et al. Improvement in Surface Solar Irradiance Estimation Using HRV/MSG Data. Remote Sens. 2018, 10, 1288. https://doi.org/10.3390/rs10081288
Romano F, Cimini D, Cersosimo A, Di Paola F, Gallucci D, Gentile S, Geraldi E, Larosa S, T. Nilo S, Ricciardelli E, et al. Improvement in Surface Solar Irradiance Estimation Using HRV/MSG Data. Remote Sensing. 2018; 10(8):1288. https://doi.org/10.3390/rs10081288
Chicago/Turabian StyleRomano, Filomena, Domenico Cimini, Angela Cersosimo, Francesco Di Paola, Donatello Gallucci, Sabrina Gentile, Edoardo Geraldi, Salvatore Larosa, Saverio T. Nilo, Elisabetta Ricciardelli, and et al. 2018. "Improvement in Surface Solar Irradiance Estimation Using HRV/MSG Data" Remote Sensing 10, no. 8: 1288. https://doi.org/10.3390/rs10081288