Article

Influence of Snow on the Magnitude and Seasonal Variation of the Clumping Index Retrieved from MODIS BRDF Products

1
State Key Laboratory of Remote Sensing Science, Jointly Sponsored by Beijing Normal University and Institute of Remote Sensing and Digital Earth of Chinese Academy of Sciences, Beijing 100875, China
2
College of Water Sciences, Beijing Normal University, Beijing 100875, China
3
Beijing Engineering Research Center for Global Land Remote Sensing Products, Institute of Remote Sensing Science and Engineering, Faculty of Geographical Science, Beijing Normal University, Beijing 100875, China
4
College of Urban and Environmental Sciences, Tianjin Normal University, Tianjin 300387, China
*
Author to whom correspondence should be addressed.
Remote Sens. 2018, 10(8), 1194; https://doi.org/10.3390/rs10081194
Submission received: 30 June 2018 / Revised: 20 July 2018 / Accepted: 24 July 2018 / Published: 30 July 2018
(This article belongs to the Section Remote Sensing in Agriculture and Vegetation)

Abstract

:
The foliage Clumping Index (CI) is an important vegetation structure parameter that allows for the accurate separation of sunlit and shaded leaves in a canopy. The CI and its seasonality are critical for global Leaf Area Index (LAI) estimating and ecological modelling. However, the cover of snow tends to reduce the reflectance anisotropy of the vegetation canopy and thus probably influences CI estimates. In this paper, we investigate the influence of snow on the magnitude and seasonal variation of the CI retrieved from Moderate-resolution Imaging Spectroradiometer (MODIS) Bidirectional Reflectance Distribution Function (BRDF) products based on field-measured CI and statistics from the global MODIS CI product. We find that the backup algorithm can effectively correct abnormally large CI values and obtain more reasonable CI retrievals than the main algorithm without any constraints in snow-covered areas. Validation indicates that the time-series CI product shows the potential in investigating the trajectories of the clumping effect in snow seasons. For evergreen forests, the clumping effect is relatively stable throughout the year; however, for deciduous vegetation types, CI values tend to display significant seasonal variations. This study suggests that the latest version of the global MODIS CI product, in which the backup algorithm is used to process the snow-covered pixels, has improved accuracy for CI retrievals in snow-covered areas and thus is probably more suitable as the input parameter for ecological and meteorological models.

1. Introduction

The leaves of natural vegetation canopies are usually organized into various canopy structures, including tree crowns, whorls, branches, and shoots [1,2]. The foliage Clumping Index (CI) characterizes the degree of foliage grouping relative to a random spatial distribution of leaves [2,3]. CI is a key canopy structure parameter of plant canopies (1) for estimating the true Leaf Area Index (LAI) from the typically measured effective LAI [1,4,5,6] and (2) for the accurate simulation of the canopy-level gross primary production [7] (3) that can affect the interception and distribution of radiation within the canopy [4], which in turn affects evapotranspiration [8,9,10] and photosynthesis [11,12,13,14,15,16]. Therefore, CI is very useful in ecological, hydrological and land surface models [17,18,19,20] as well as remote sensing applications [21,22,23,24,25,26,27,28,29,30,31].
The relationship between the Normalized Difference between Hotspot and Darkspot (NDHD) and the CI, which was originally developed by Chen et al. [4], has been used to produce regional and global CI products based on various multi-angular data from the Polarization and Directionality of the Earth’s Reflectances (POLDER, ~6 km resolution) sensor [4,32,33,34], Moderate Resolution Imaging Spectroradiometer (MODIS, ~500 m resolution) sensor [24,26,35,36,37,38,39] and Multi-angle Imaging SpectroRadiometer (MISR, ~275 m resolution) sensor [5]. The early global CI maps were usually generated with only one annual group of CI values that were retrieved by extracting either the minimum [4,24] or median CI [26]. The CI is usually assumed to be seasonally invariant in land surface models [40,41,42] because of the limited data availability. However, the seasonality of the CI is critical for LAI estimating and ecological modelling [37]. Several studies based on the ground measurements of long-term time series CI data indicate that the CI could have very strong seasonal variations due to species phenology [5,23,43,44]. In addition, various studies based on spaceborne CI products indicate that the retrieved CI values exhibit distinguishable seasonal variations [4,5,6,37,38,39]. Therefore, the seasonality of the CI should be carefully explored in spaceborne CI products.
One difficulty in capturing the seasonality of spaceborne CI products is that the seasonal variation of the CI may be contaminated by short-term fluctuations in the retrieved CI time series data [37]. For example, abnormally small or large values can be found in the CI retrievals from MODIS BRDF products at validation sites [37,38]. Recent studies found that outliers might be caused by ephemeral rain [37] or snow events [39]. Jiao et al. [39] reported that ephemeral snow during winter decreases the accuracy of MODIS Bidirectional Reflectance Distribution Function (BRDF) retrievals during leaf-off seasons, which leads to lower CI quality. Therefore, the influence of snow on spaceborne CI products should be further investigated to improve the accuracy of the global MODIS CI product when investigating the seasonality of the CI.
In this study, we mainly aim to investigate (1) the influence of ephemeral snow on the magnitude of the CI and (2) the seasonal variation of the CI after correcting for or excluding the influence of ephemeral snow. For these purposes, we collect ground measurements of CI time series data in three validation sites and the MODIS snow cover product to analyze the influence of snow on the CI product retrieved by Jiao et al. [39] from MODIS BRDF products. In addition, we summarize and analyze the CI statistics for various International Geosphere-Biosphere Programme (IGBP) classes after correcting or excluding the snow-covered pixels on the global scale to investigate the influence of snow on the magnitude and seasonal variation of spaceborne CI products.

2. Materials and Methods

2.1. Global MODIS CI Product

The global MODIS CI product used in this study, hereby termed CIMODIS, is retrieved by Jiao et al. [39] with a spatial resolution of ~500 m and an 8-day temporal resolution from January 2001 to December 2013. CIMODIS is retrieved from the MODIS BRDF products [45] based on the following linear relationship between CI and NDHD:
CI = A × NDHD + B
where A and B are the linear regression coefficients determined by a set of model simulations based on the 4-scale geometrical optical model [46] in Chen et al. [4]. The values of A and B vary with solar zenith angle (θ), spectral band and crown shape [4]. NDHD is defined as follows:
NDHD = R Hot R Dark R Hot + R Dark .
where RHot and RDark are the reflectance in hotspots and darkspots, respectively. NDHD can be calculated based on the three BRDF parameters in the MODIS BRDF product using the hotspot-corrected version of the kernel-driven model (RTCLSR) developed by Jiao et al. [47]. Here, the MODIS BRDF parameters in the red band are selected to calculate the NDHD since He et al. [26] reported that the CIs retrieved from the red band were more accurate than those retrieved from the near-infrared (NIR) band. Accordingly, CI can be calculated based on Equation (1) using the corresponding coefficients (when θ = 45°) in the red band.
The abovementioned algorithm based on the linear CI-NDHD relationship is called the main algorithm. If CI retrievals by the main algorithm are outside of the closed interval [0.33, 1.00] or the pixels are covered by snow, then a backup algorithm will be used instead of the main algorithm to achieve more reasonable CI values [39].
The backup algorithm is developed based on the angular index Anisotropic Flat Index (AFX) [48,49,50,51]. The AFX indicates the general variability of BRDF shapes (dome or bowl-shaped BRDFs) in terms of the value around unity. Jiao et al. [39] assumed that the pixels with similar canopy structures would capture similar BRDF shapes that can be identified by similar AFX values (i.e., in an AFX interval of 0.01). Therefore, a lookup table (LUT) between the CI and AFX for each IGBP class can be built based on the accumulated high quality MODIS BRDF data, which are marked as best quality by the MCD43A2 product and are not covered by snow. In the LUT, the CIs for each corresponding AFX value in each IGBP class can be calculated based on the following procedure. Firstly, a density separation method is adapted to slice the AFX range (i.e., 0.5 to 1.5) at an interval of 0.01. Then, the high-quality BRDF shapes in each AFX interval are averaged to achieve a typical BRDF archetype (i.e., an average BRDF shape) that can represent the BRDF shapes in the corresponding AFX interval. Finally, the CIs for each corresponding AFX value in each IGBP class can be calculated from the BRDF archetype using the liner relationship between the CI and NDHD. More details can be found in Jiao et al. [39].
CI retrievals by the main algorithm are marked with a MODIS CI QA flag of 0 or 1, and those by the backup algorithm are marked with a MODIS CI QA flag of 2.

2.2. MODIS Snow Cover Product

The MODIS Snow Cover product (MOD10A2, version 6) [52] is derived from the Normalized Difference Snow Index (NDSI). It reports the maximum snow cover extent during an eight-day period in 1200 km × 1200 km tiles with a spatial resolution of ~500 m. The MOD10A2 product from January 2001 to December 2013 and other MODIS products used in this study were downloaded from https://search.earthdata.nasa.gov/.
In this study, the dataset of maximum snow cover extent in the MOD10A2 product is used to select or mask the pixels that are covered by snow. The dataset is generated from the MOD10A1 tiles. If snow is observed in a pixel on any day in the period of MOD10A2, the pixel will be marked as snow. If no snow is found, the pixel will be marked as the land cover that is observed most often (snow-free land, lake and so on). If the pixel is covered by clouds for all eight days in the period, the pixel will be marked as a cloud.

2.3. MODIS Land Cover Type Product

The MODIS land cover type product (MCD12Q1) describes the land cover properties derived from the observations spanning a year of MODIS data [53]. It incorporates five land cover classification schemes derived using a supervised decision-tree classification method. The IGBP global vegetation classification dataset is used in this study for consistency with the MODIS CI product.

2.4. Collected Ground Measurements of CI Time Series

The ground measurements of the CI time series for three validation sites were collected from previous studies [6,37] and compared with CIMODIS to analyze the seasonal variation of the CI. Details on the three validation sites are shown in Table 1.
The TP39 and TP74 sites representing Evergreen Needleleaf Forest (ENF) are in Ontario, Canada. The areas are dominated by mature white pine [54]. The CIs at the two sites are measured by the Tracing Radiation and Architecture of Canopies (TRAC) instrument using the gap size distribution [1,25,55,56] method [37]. The Honghe Farm site is in the Heilongjiang Province, China. It is dominated by large, flat, homogeneous rice paddy fields (homogeneity > 5 km). The paddy rice is grown and transplanted in late May; flowering occurs in early July, grain-filling in early August and maturity in early September. The CI of this site was continuously measured from June (Day of Year (DOY) 163) to September (DOY 261) 2012, which includes the main period of paddy rice development from germination to maturity [57].

2.5. Analytical Method Regarding the Influence of Snow on the Maginutde and Seasonal Variation of CIMODIS

First, we compare the ground measurements of the CI time series for the three validation sites using CIMODIS to investigate the influence of snow on the magnitude of CIMODIS. The MOD10A2 product is used to mask snow-covered pixels. The CIMODIS of the sites will be recalculated using the corrected IGBP type if the IGBP class in the MCD12Q1 product is not consistent with the real IGBP class of the sites. Then, we investigate the extent of the areas influenced by snow for various IGBP classes based on the global snow cover and CI maps on a specific day in February 2006. Finally, we compare the temporal sequences of the average snow-free CIMODIS with the snow-covered CIMODIS for the typical IGBP classes in the northern hemisphere at latitudes ≥ 30°N from January 2001 to December 2013 to further investigate the influence of snow on the magnitude and seasonal variation of CIMODIS.

3. Results

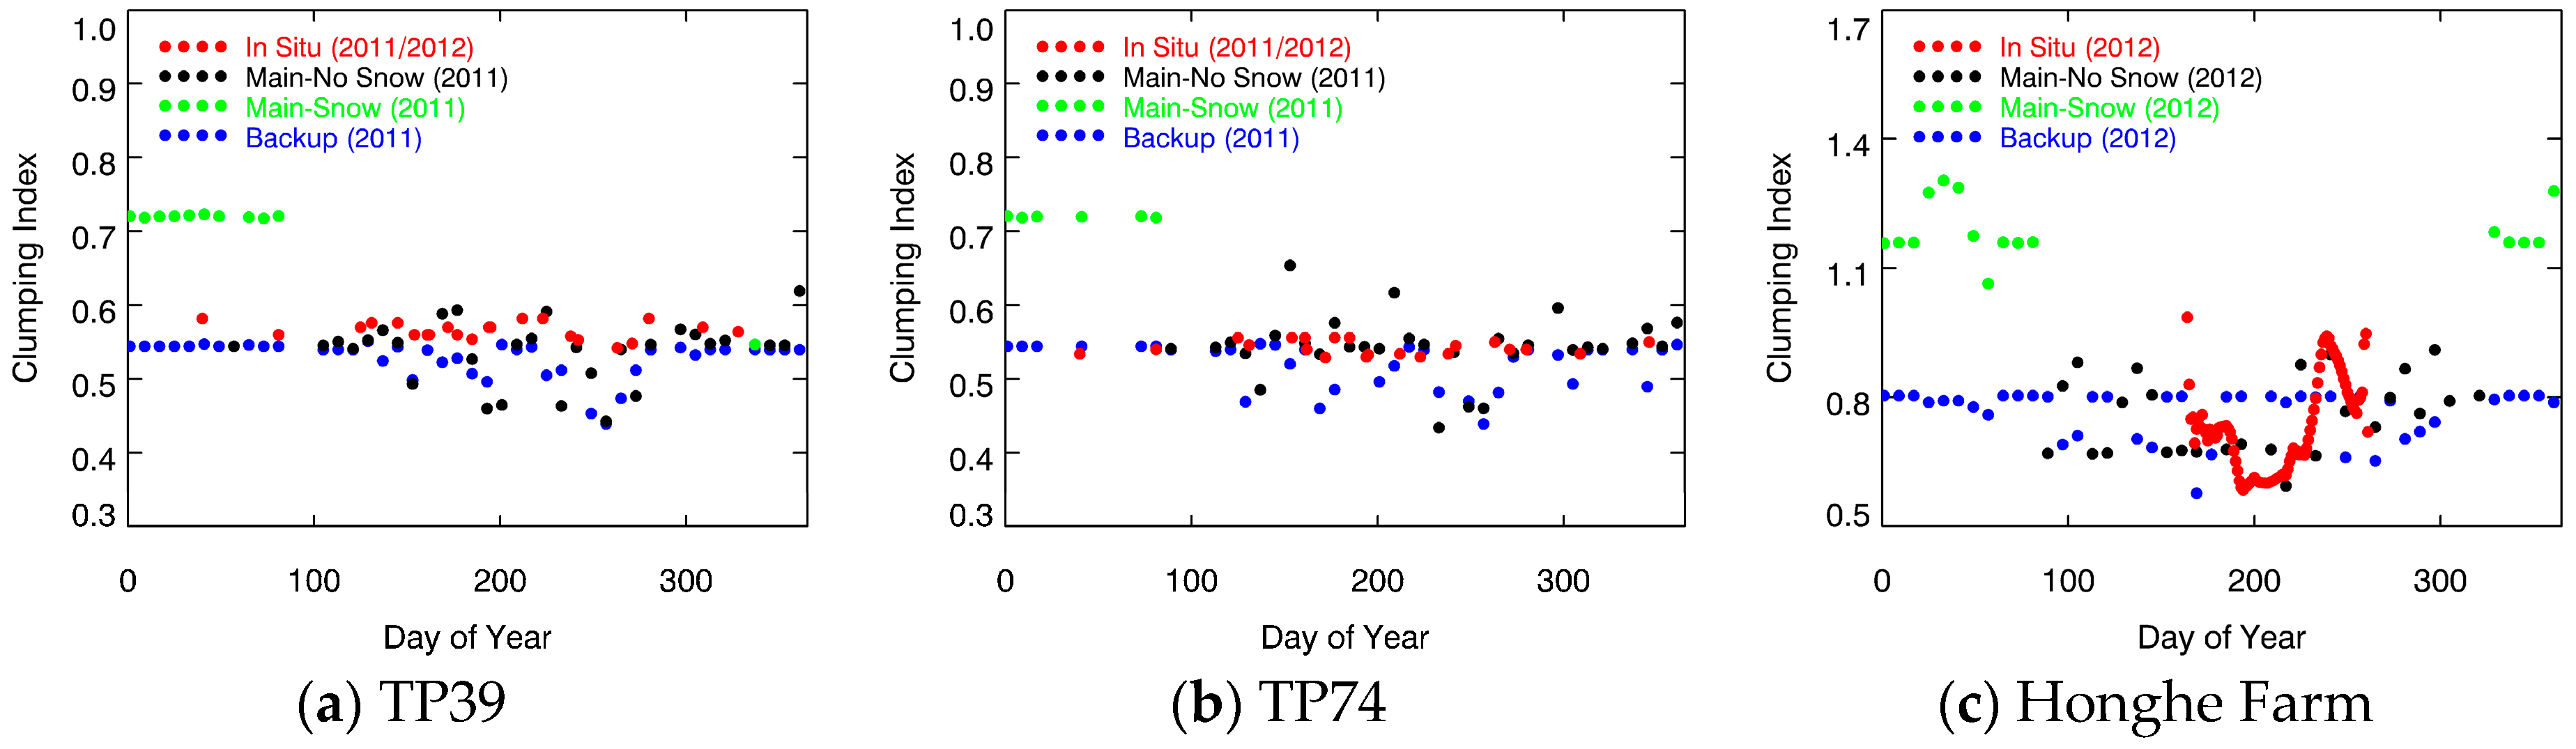
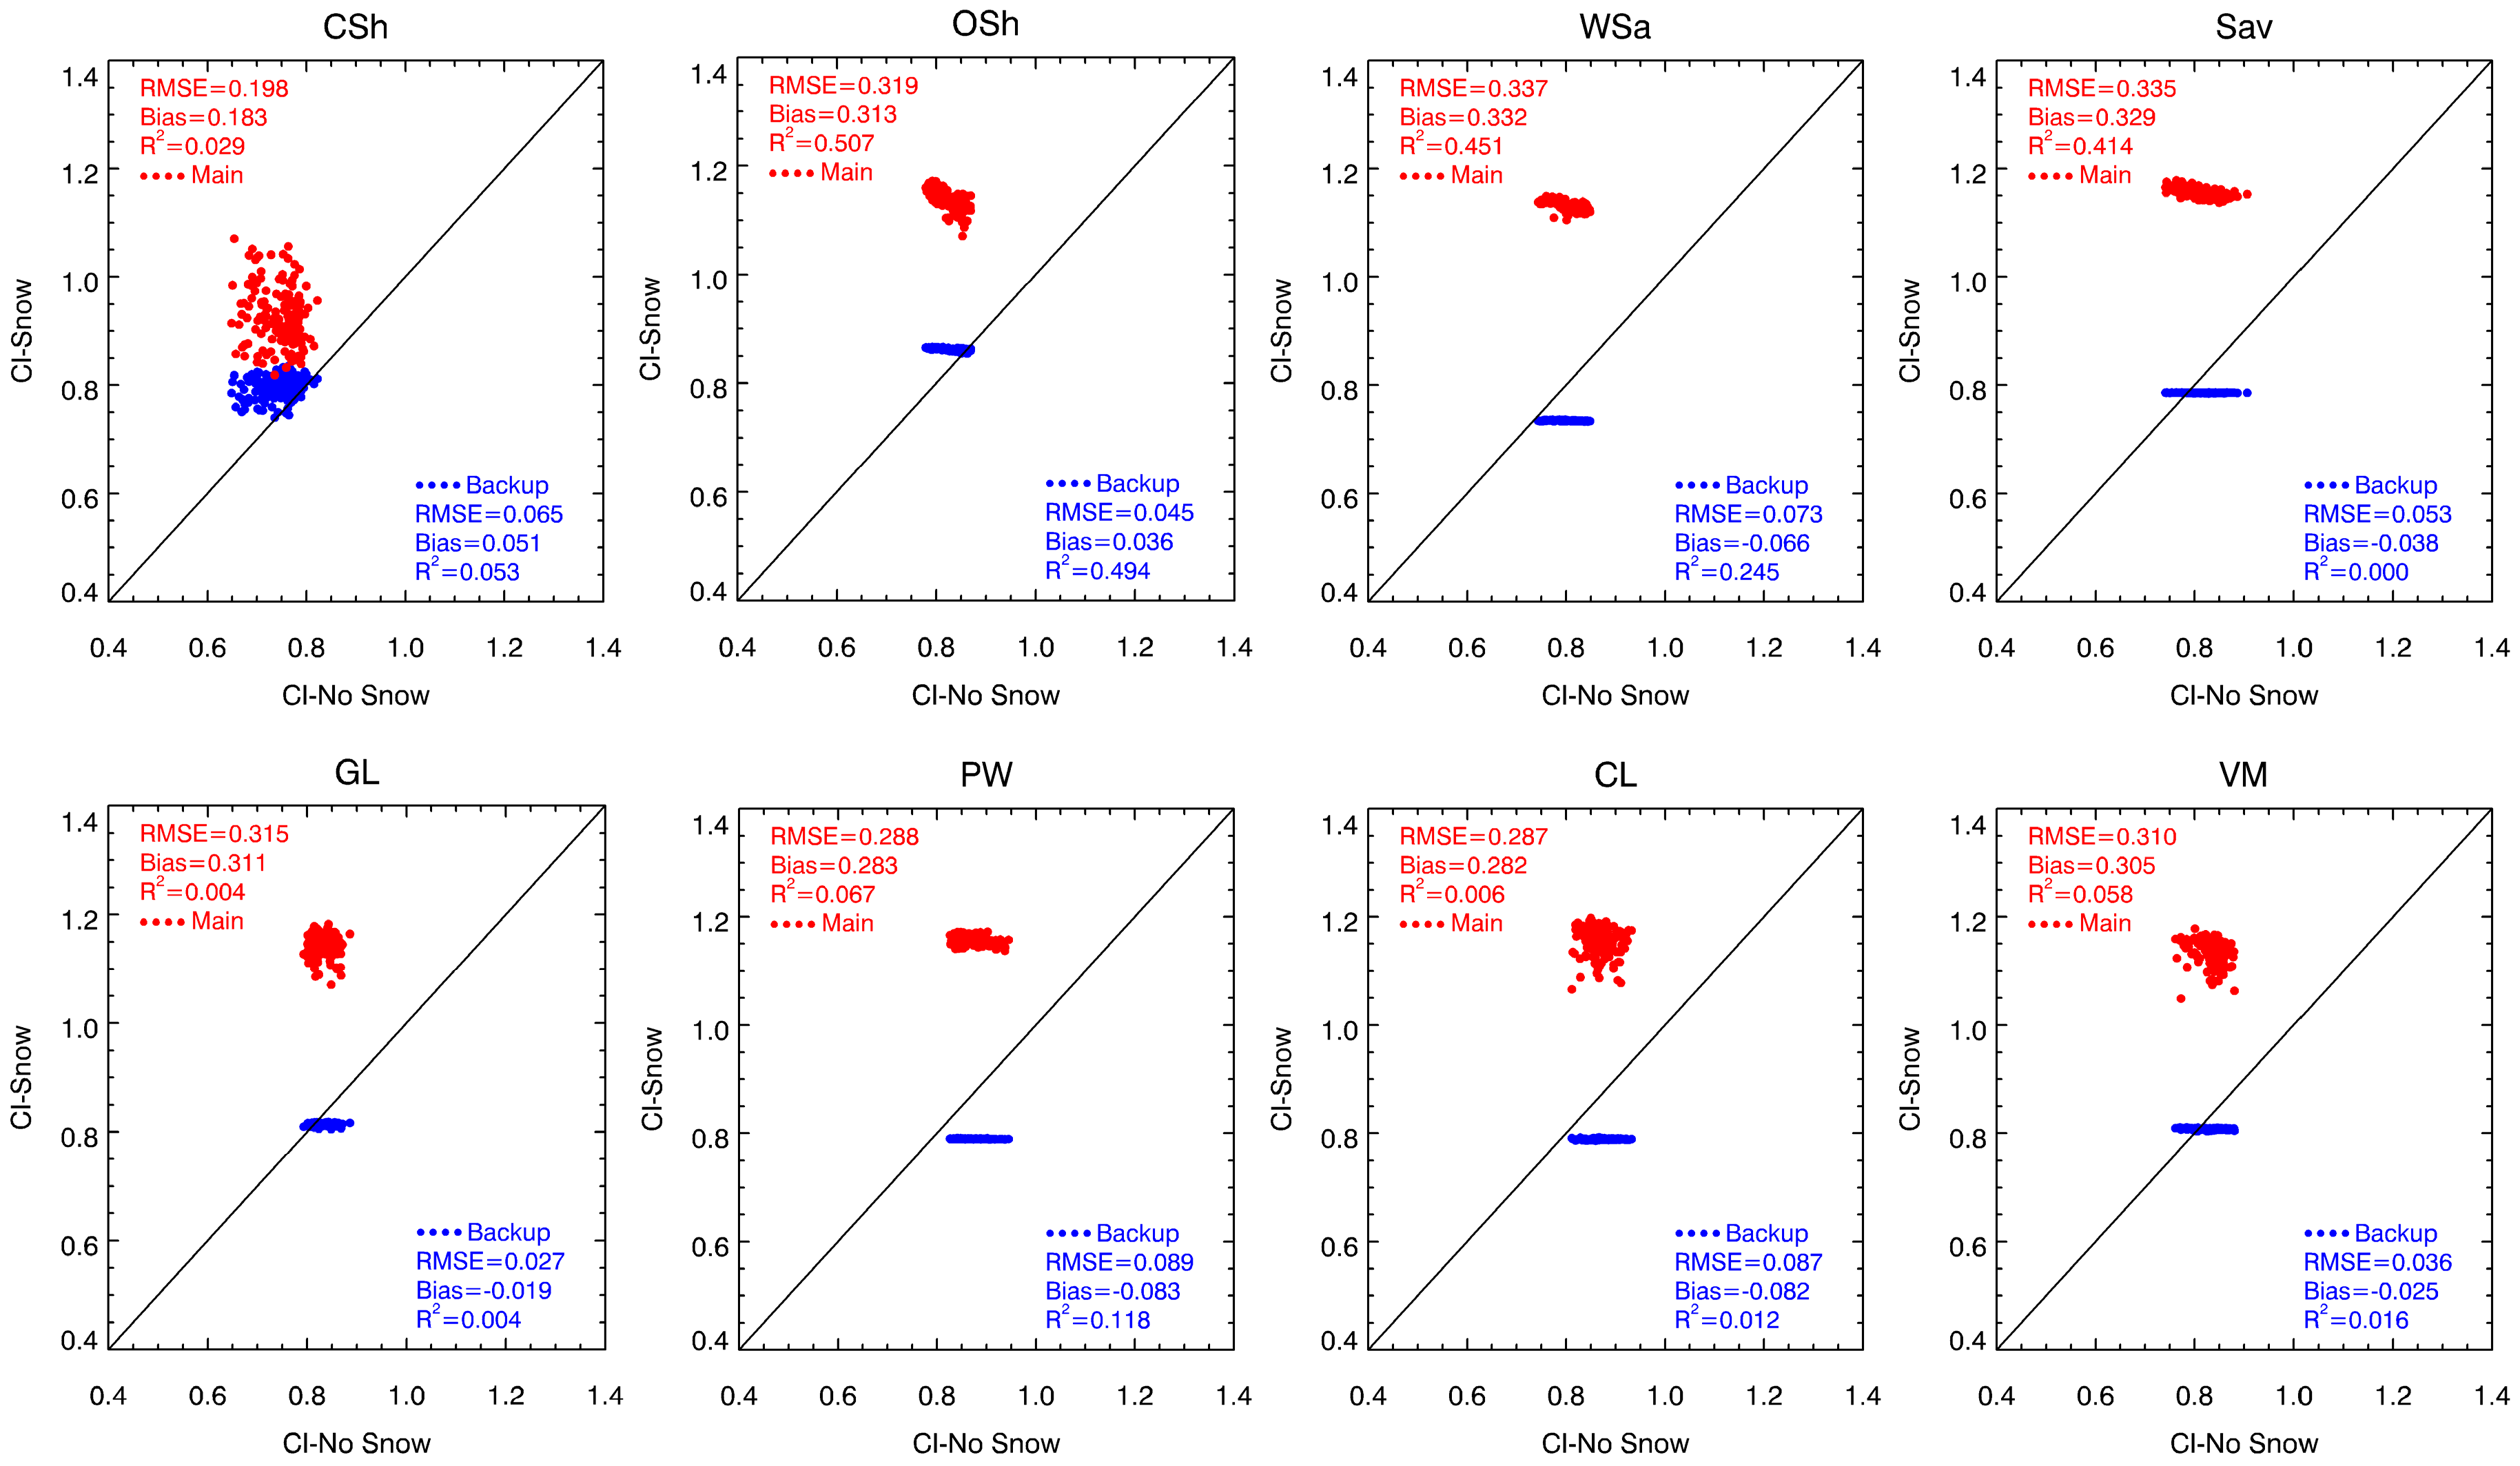
3.1. Influence of Snow on CIMODIS at Validation sites

Figure 1 shows the seasonal variation of the in situ CI (red circles) and CIMODIS. Figure 1a,b shows that although CIMODIS retrieved by the main algorithm matches quite well with the field-measured CI at the TP39 and TP74 sites on some of the snow-free days, the CIMODIS fluctuates too much with comparison to the in-situ measurements in snow-free seasons. The CIMODIS values retrieved by the main algorithm are much larger than the field-measured CI values on snow-covered days. In contrast, the CIMODIS values retrieved by the backup algorithm can correct the influence of snow and show good consistency with the field-measured CI on snow-covered days. Several CIMODIS values retrieved by the main algorithm are larger than 0.6 or smaller than 0.5 during the period from May to October. The fluctuation of CIMODIS may be caused by noise from rain events [37]. Interestingly, the backup algorithm shows a higher accuracy than the main algorithm when those outliers (CI > 0.6 or CI < 0.5) are retrieved by the main algorithm. In contrast, the main algorithm performs better than the backup algorithm on the snow-free days expect for the days when outliers are retrieved by the main algorithm.
At the Honghe Farm site, a rapid change in the CI can be observed from the in situ measurements of the CI (Figure 1c), since the structure of paddy rice varies rapidly during the growing season. CIMODIS retrieved by the main algorithm significantly captures the minimum, maximum and trajectories of the field-measured CI. The values of CIMODIS are much smaller than the values of the field-measured CI on DOYs 163, 164, 259, and 260 since CIMODIS is retrieved from the MODIS BRDF product, which assumes that the BRDF of the observed target remains consistent during the 16 days. Therefore, it is difficult for CIMODIS to capture the sudden real-time change of the CI. Apparently, the main algorithm performs better than the backup algorithm on snow-free days, which is consistent with our previous result that the main algorithm outperforms backup algorithm except for CI outliers [39]. In contrast, the CIMODIS retrieved by the main algorithm on snow-covered days are all larger than 1.00 and thus should be considerably larger than the real CI since the values of the CI are unlikely to exceed 1.00 in theory [4]. The results indicate that the CIMODIS retrieved by the backup algorithm should be more reasonable than that retrieved by the main algorithm on snow-covered days. The accuracy of the CIMODIS retrieved by the backup algorithm on snow-covered days needs further evaluation with sufficient validation data on snow-covered days.

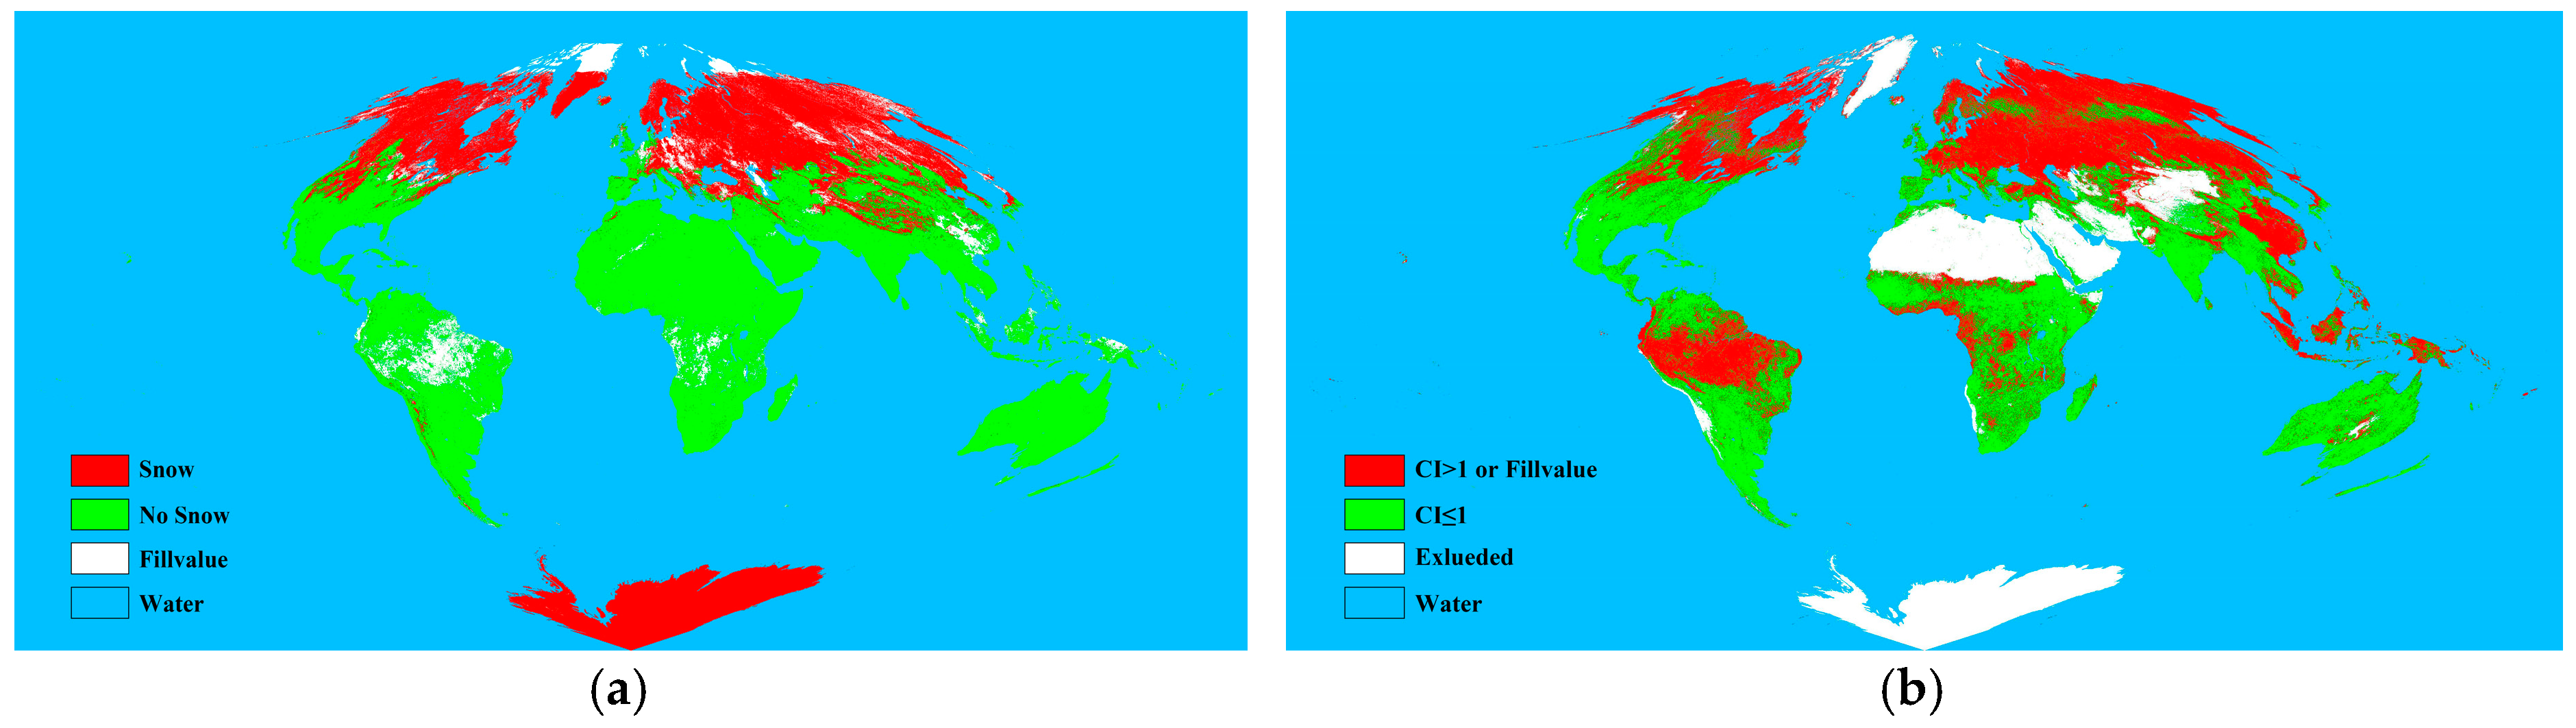
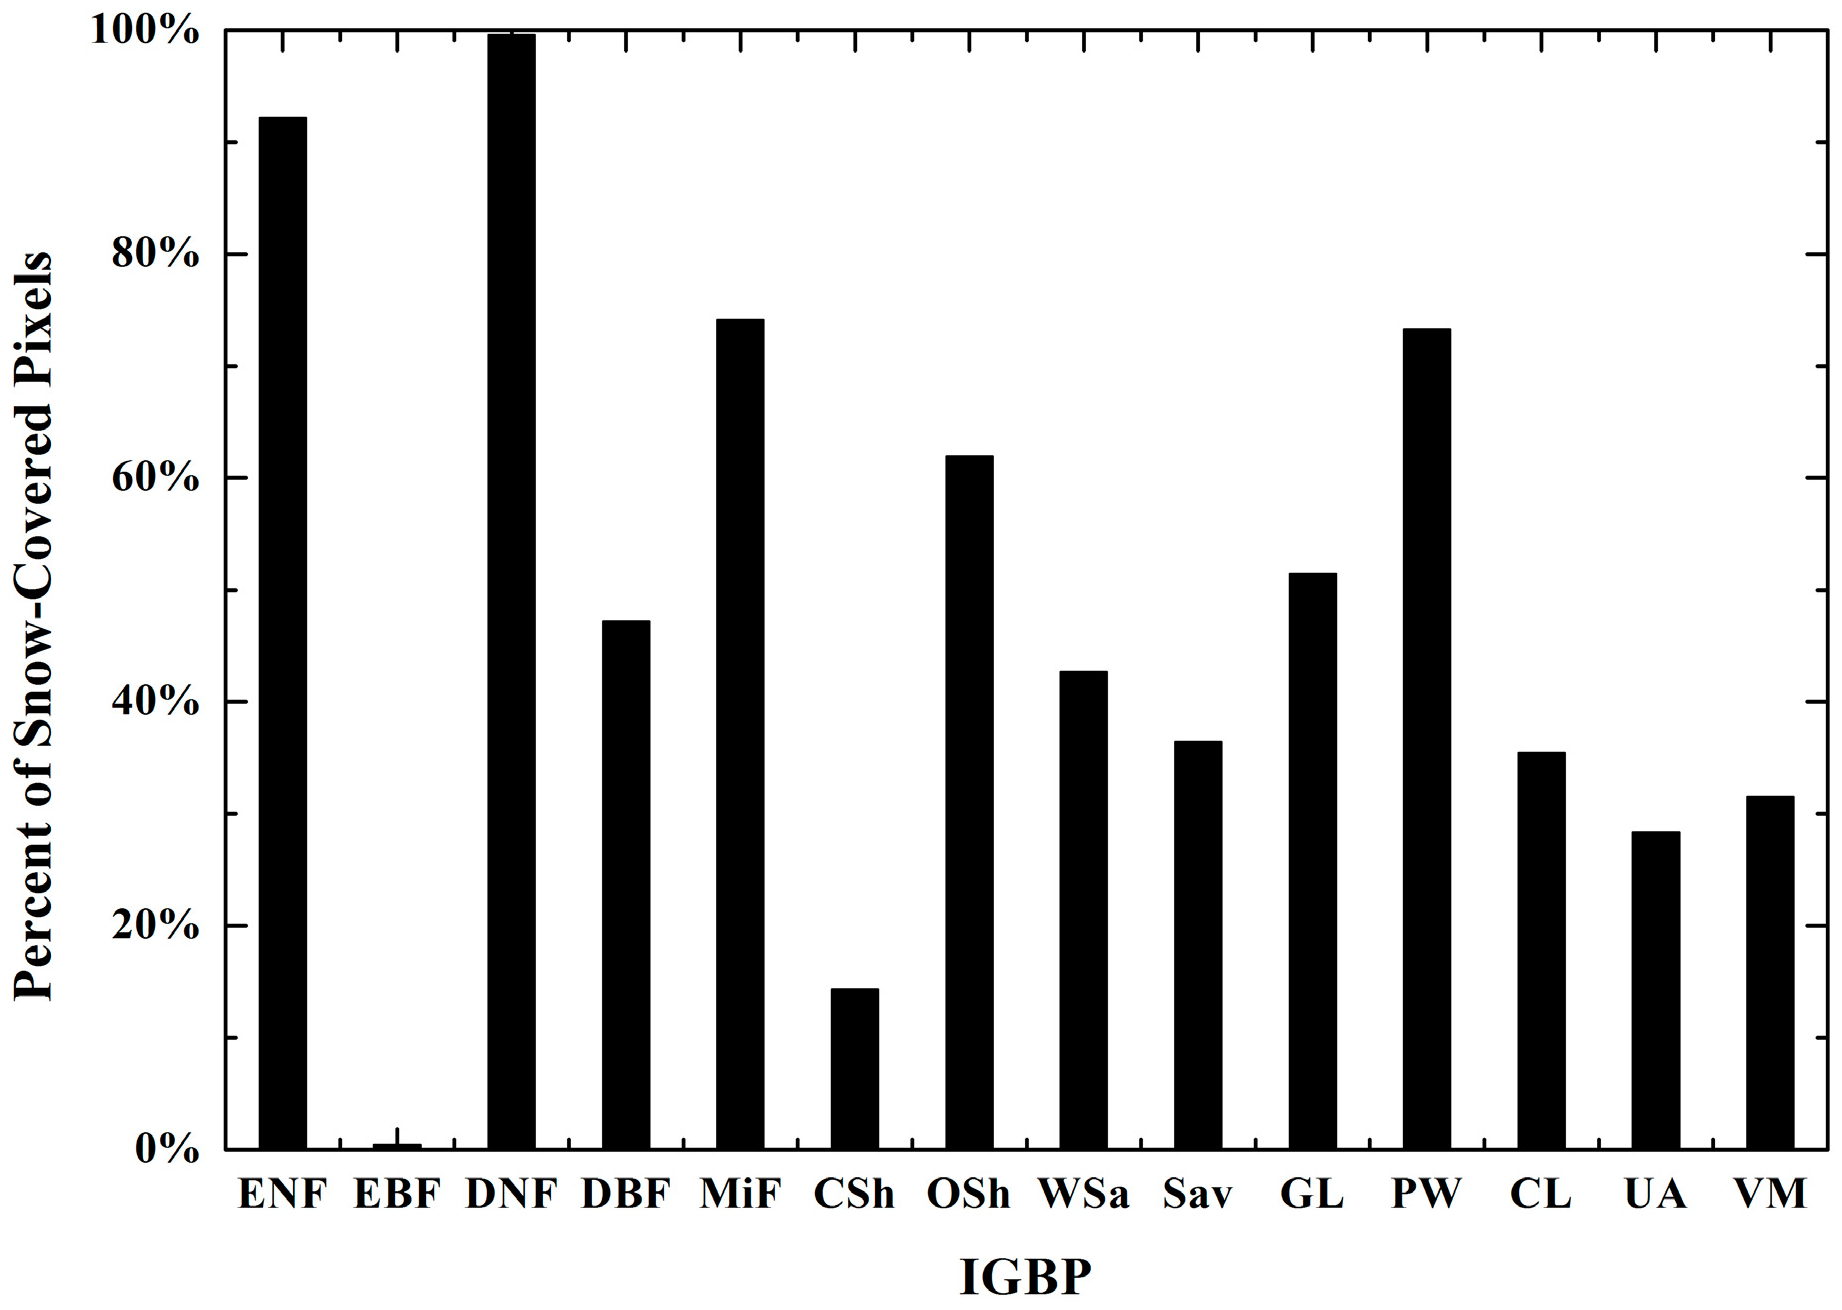
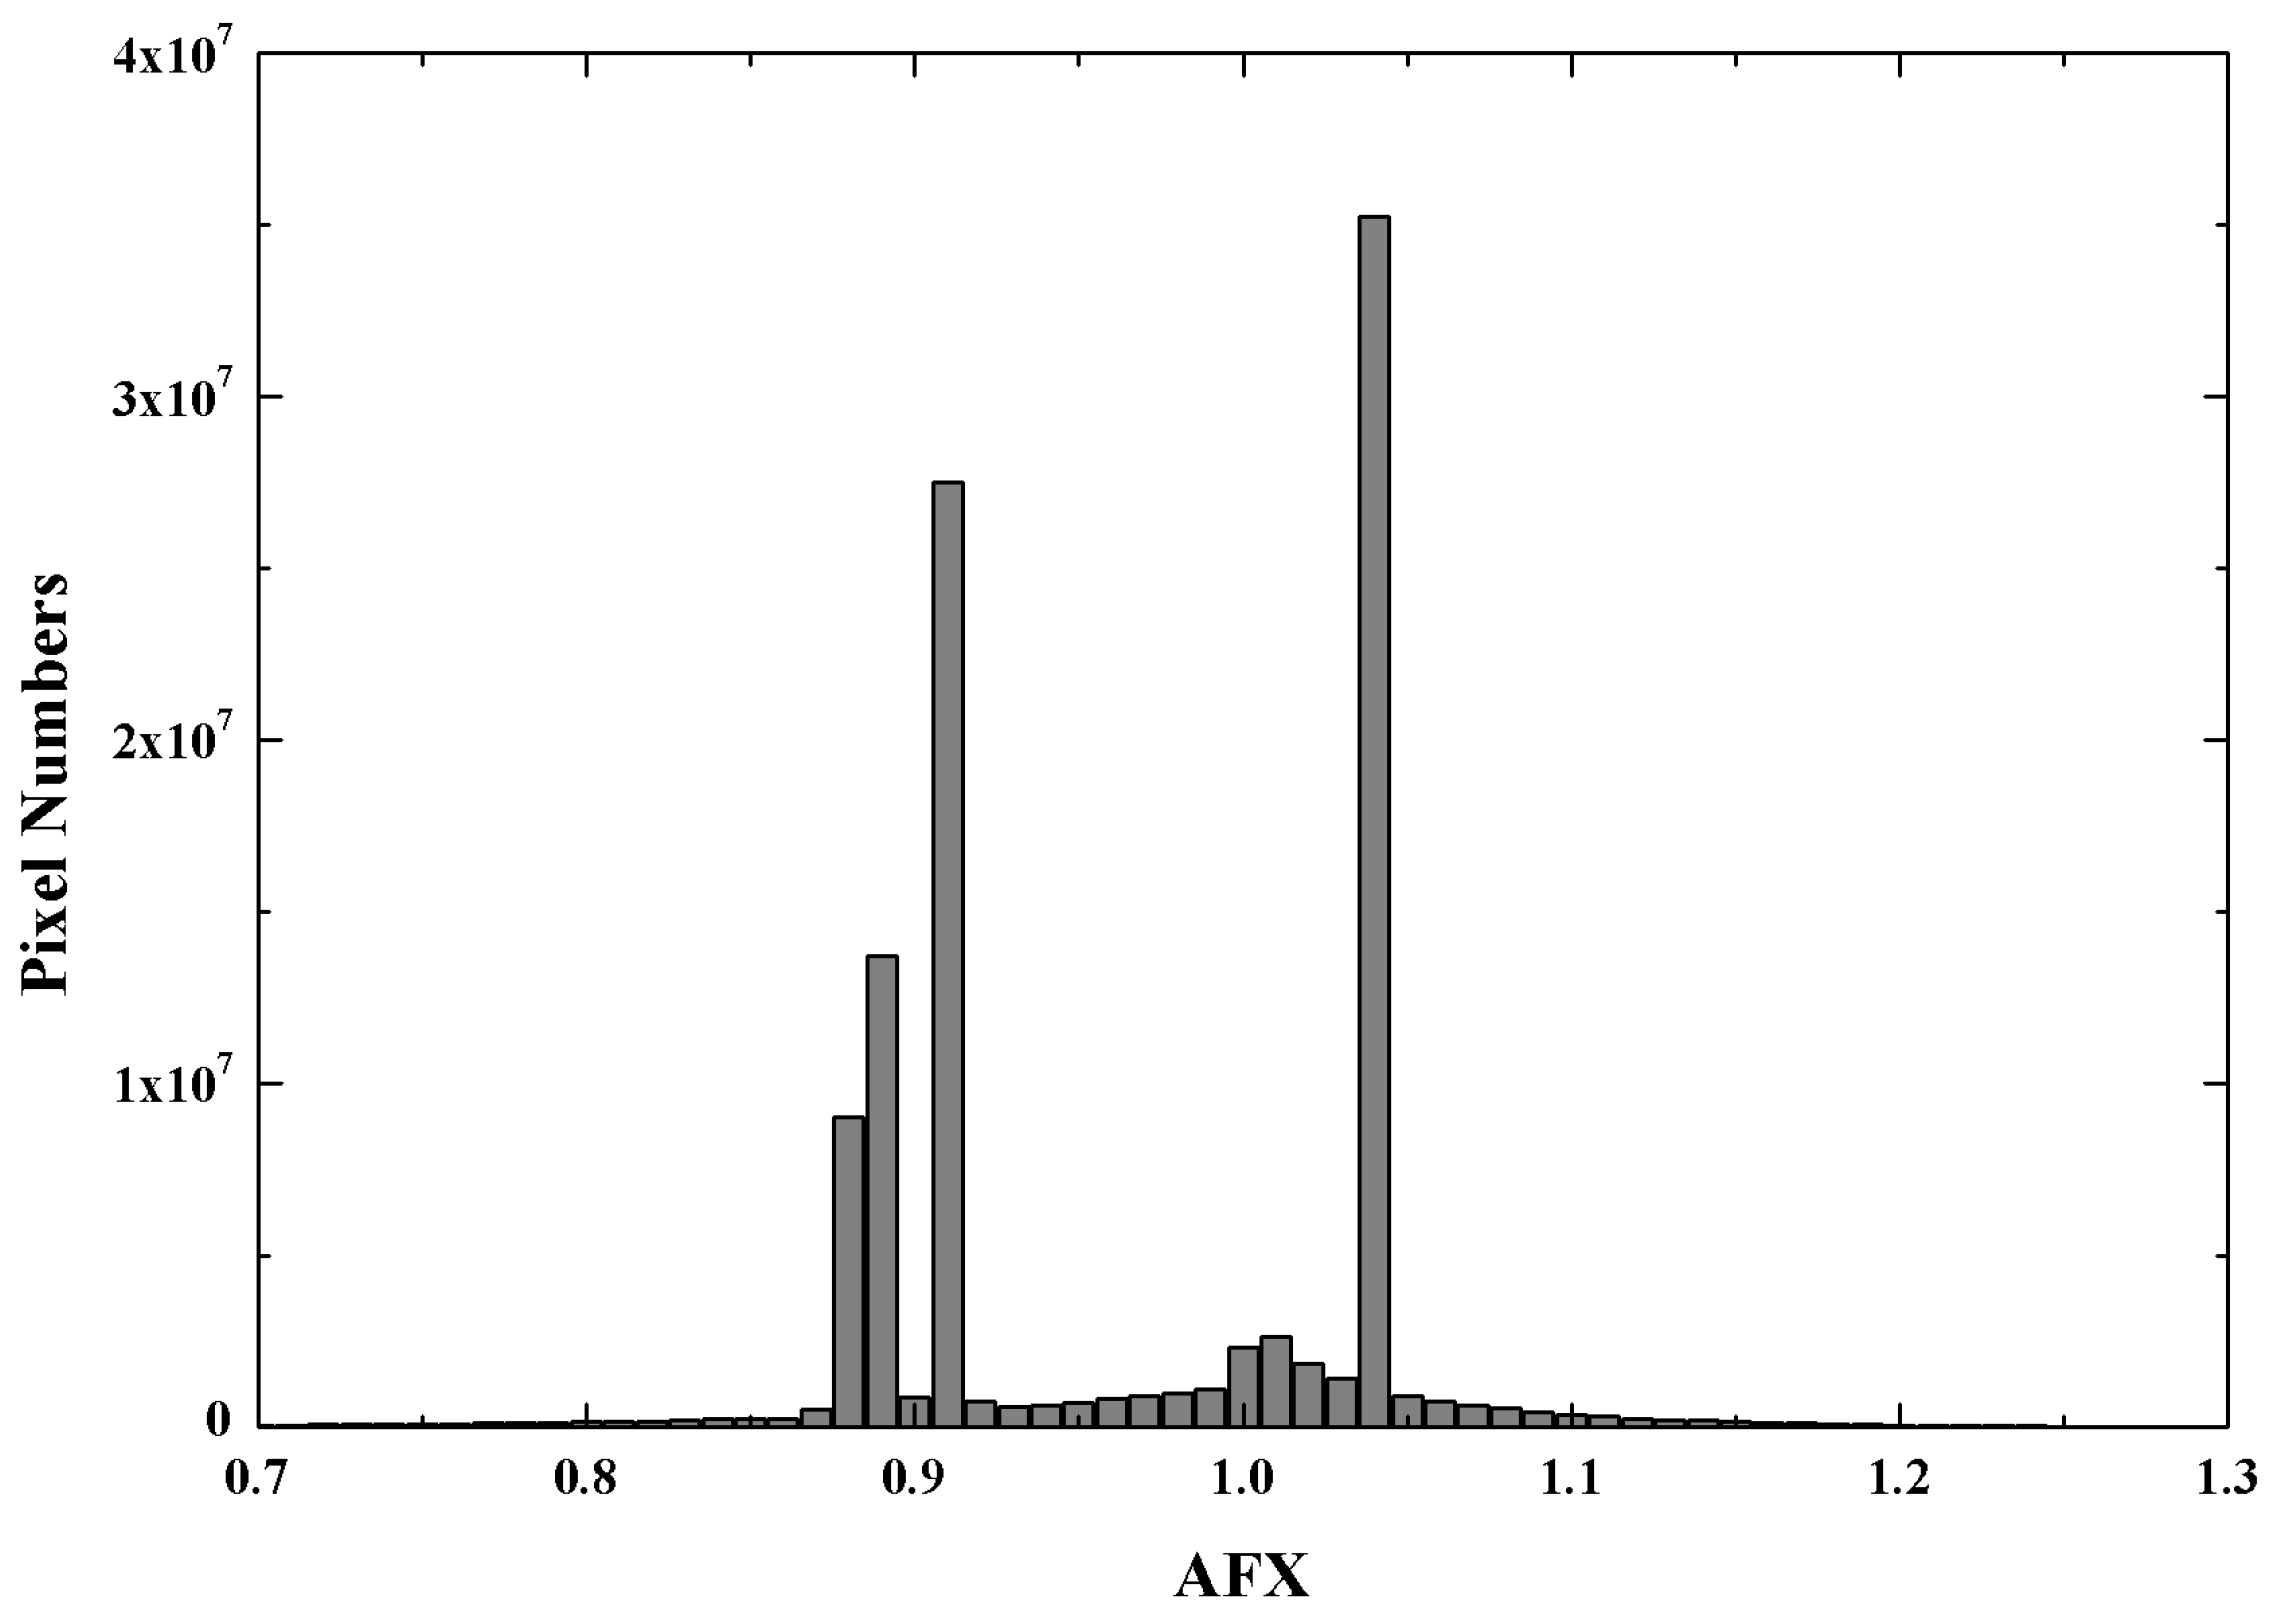
3.2. Areas Influenced by Snow at a Global Scale

In winter, snowfall can often be observed in temperate and frigid zones. Figure 2 shows that snow covers most areas of the North Frigid Zone and the northern region of the North Temperate Zone on DOY 041, 2006. Statistics indicate that nearly 31 percent of the areas in the northern hemisphere (Latitude > 0°N) on DOY 041 are covered by snow. Detailed statistics for various IGBP classes are shown in Figure 3. The ENF and Deciduous Needleleaf Forest (DNF) are more prone to be affected by snowfall. By contrast, Evergreen Broadleaf Forest (EBF) is less prone to be affected by snowfall, since most EBF are distributed in tropical and subtropical regions (where snowfall rarely occurs). Therefore, the influence of snow on CIMODIS should be carefully investigated in winter, especially for needleleaf forests.
As shown in Figure 2, most CIMODIS values for snow-covered areas are either larger than 1.00 or have no value. Statistics indicate that in areas with latitudes ≥ 30°N in the northern hemisphere, 94% of the pixels with a CIMODIS ≥ 1.00 are covered by snow. The snow on the ground is highly isotropic scattered, thus reducing the contrast between the sunlit and shadowed components of the vegetation canopy [58,59,60], resulting in a smaller NDHD. Therefore, a larger CIMODIS will be retrieved from the snow-covered pixels. The results further demonstrate that snow cover reduces the quality of the retrieved CIMODIS, resulting in either abnormally large CI values or no values. Therefore, the CIMODIS retrieved from snow-covered pixels should be corrected or excluded for various applications when studying the seasonal variation of CIMODIS at a global scale, especially in winter.

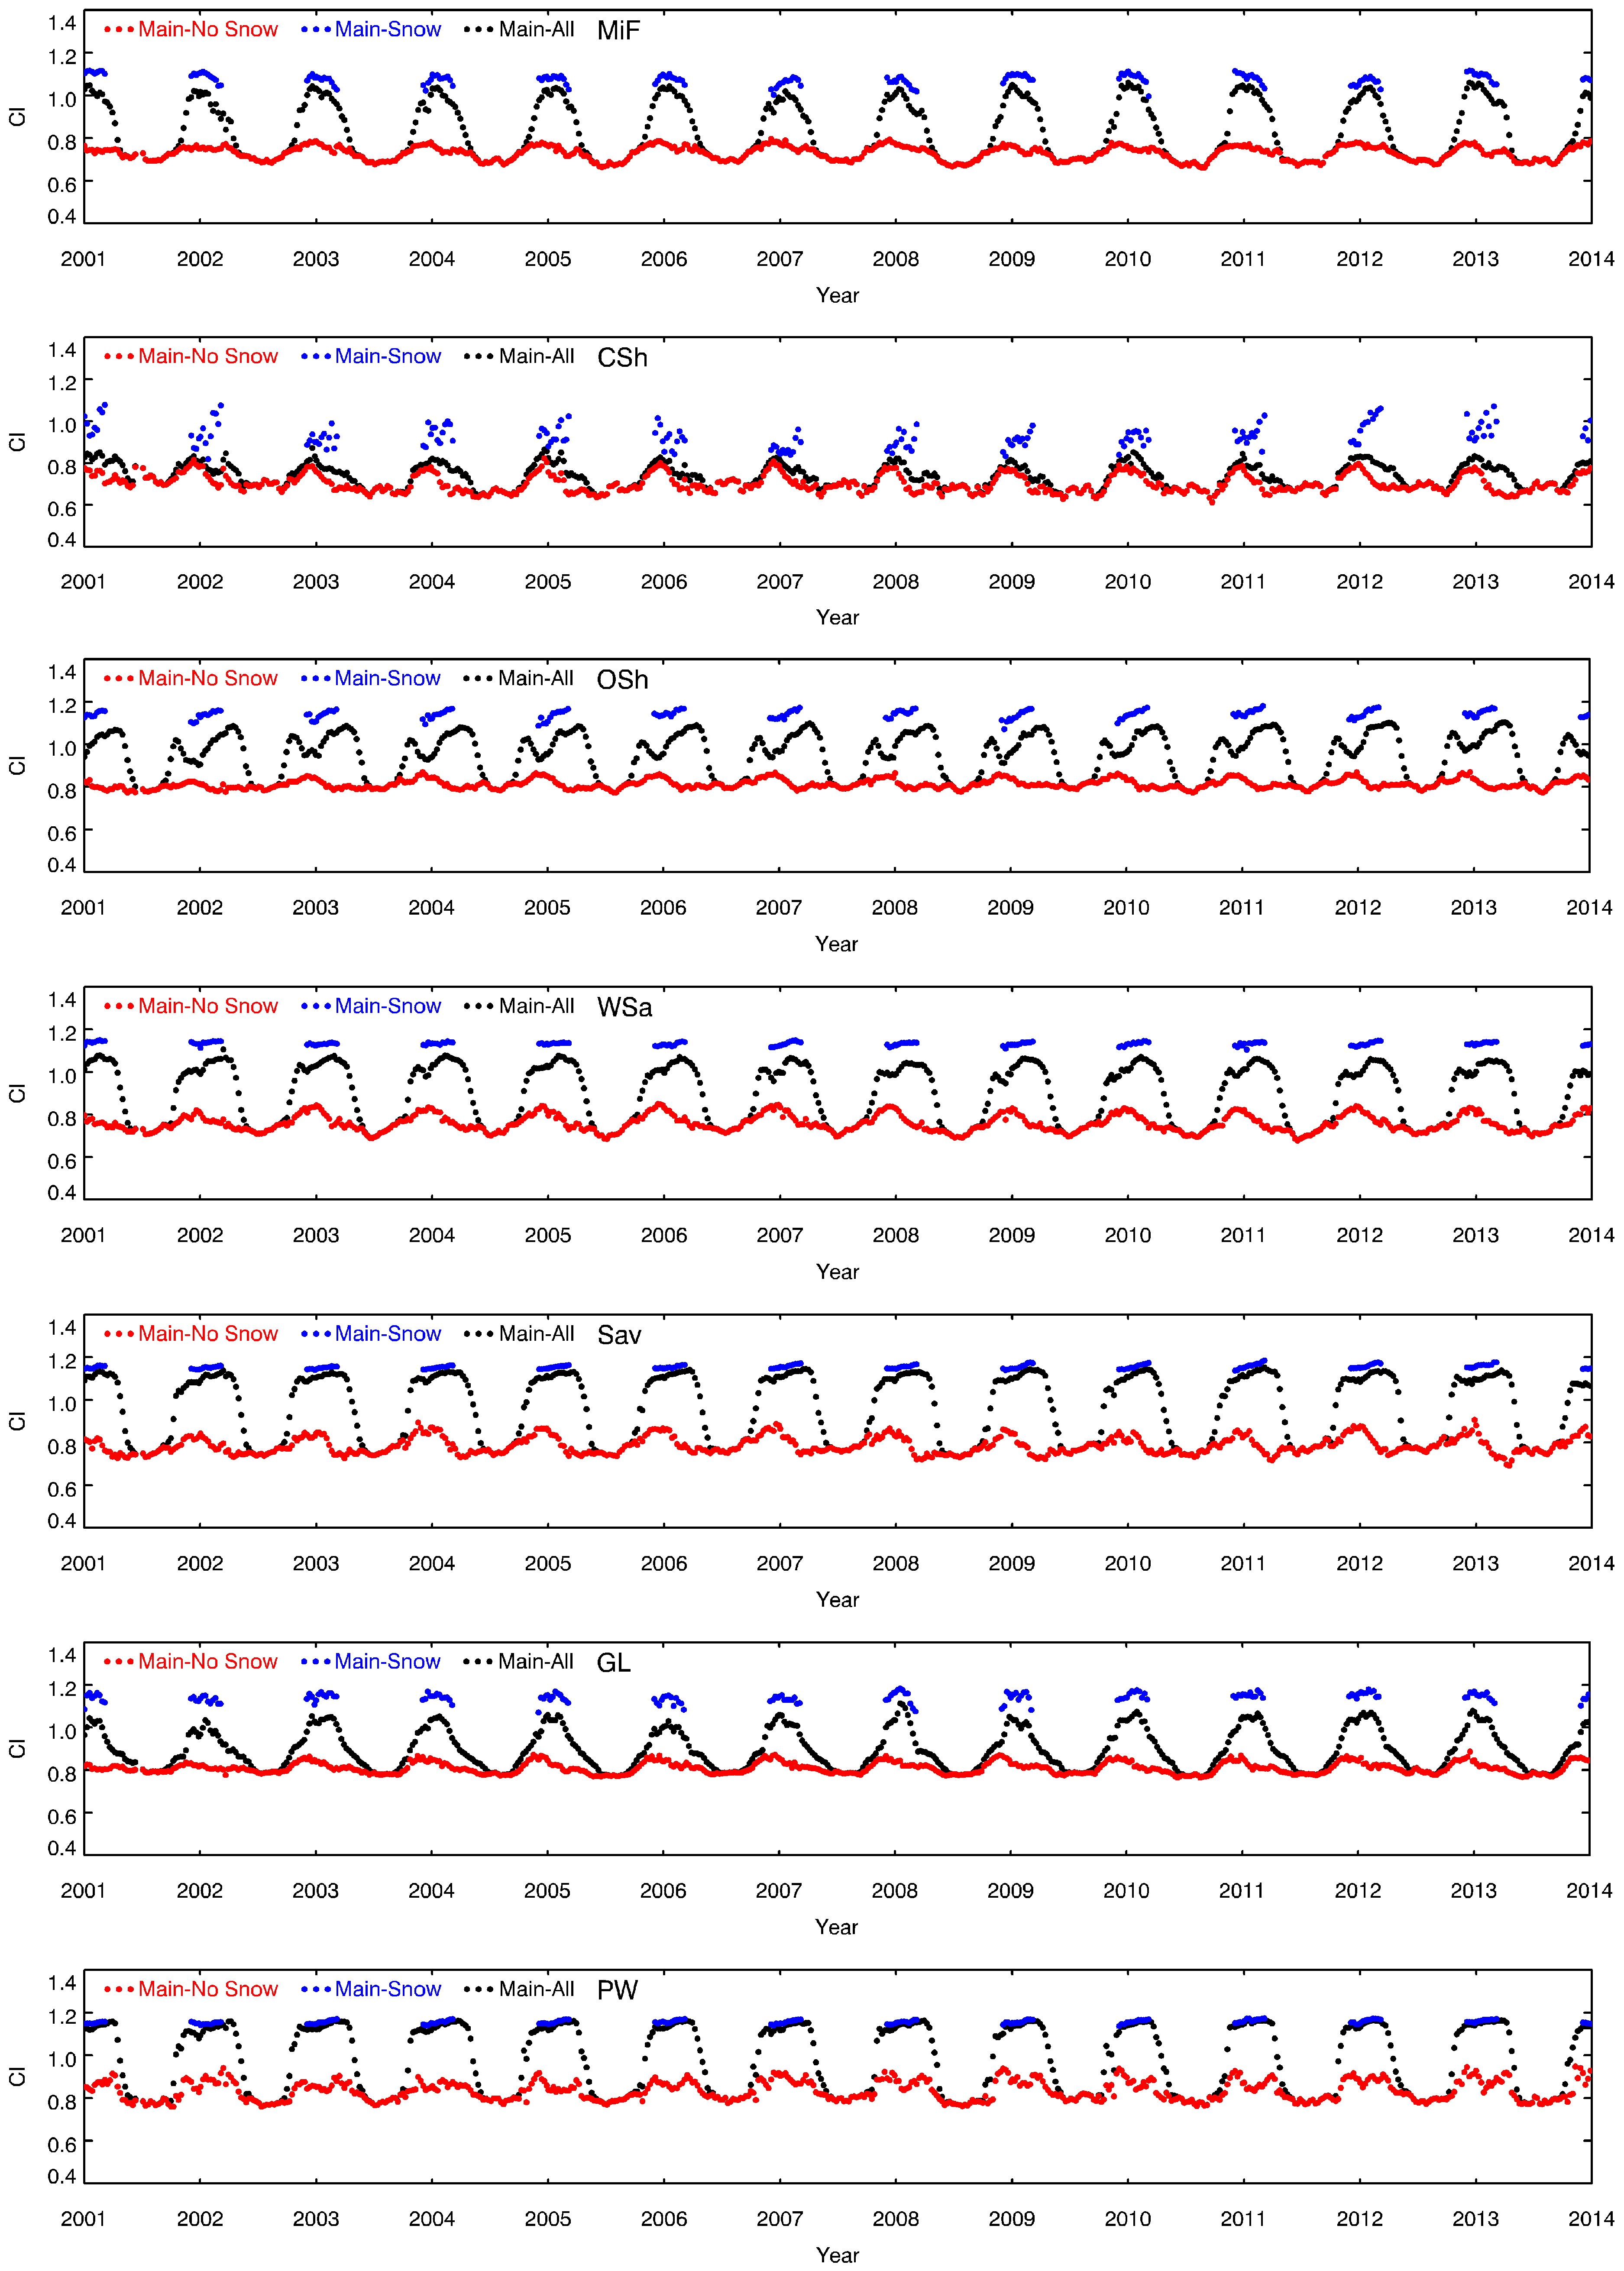
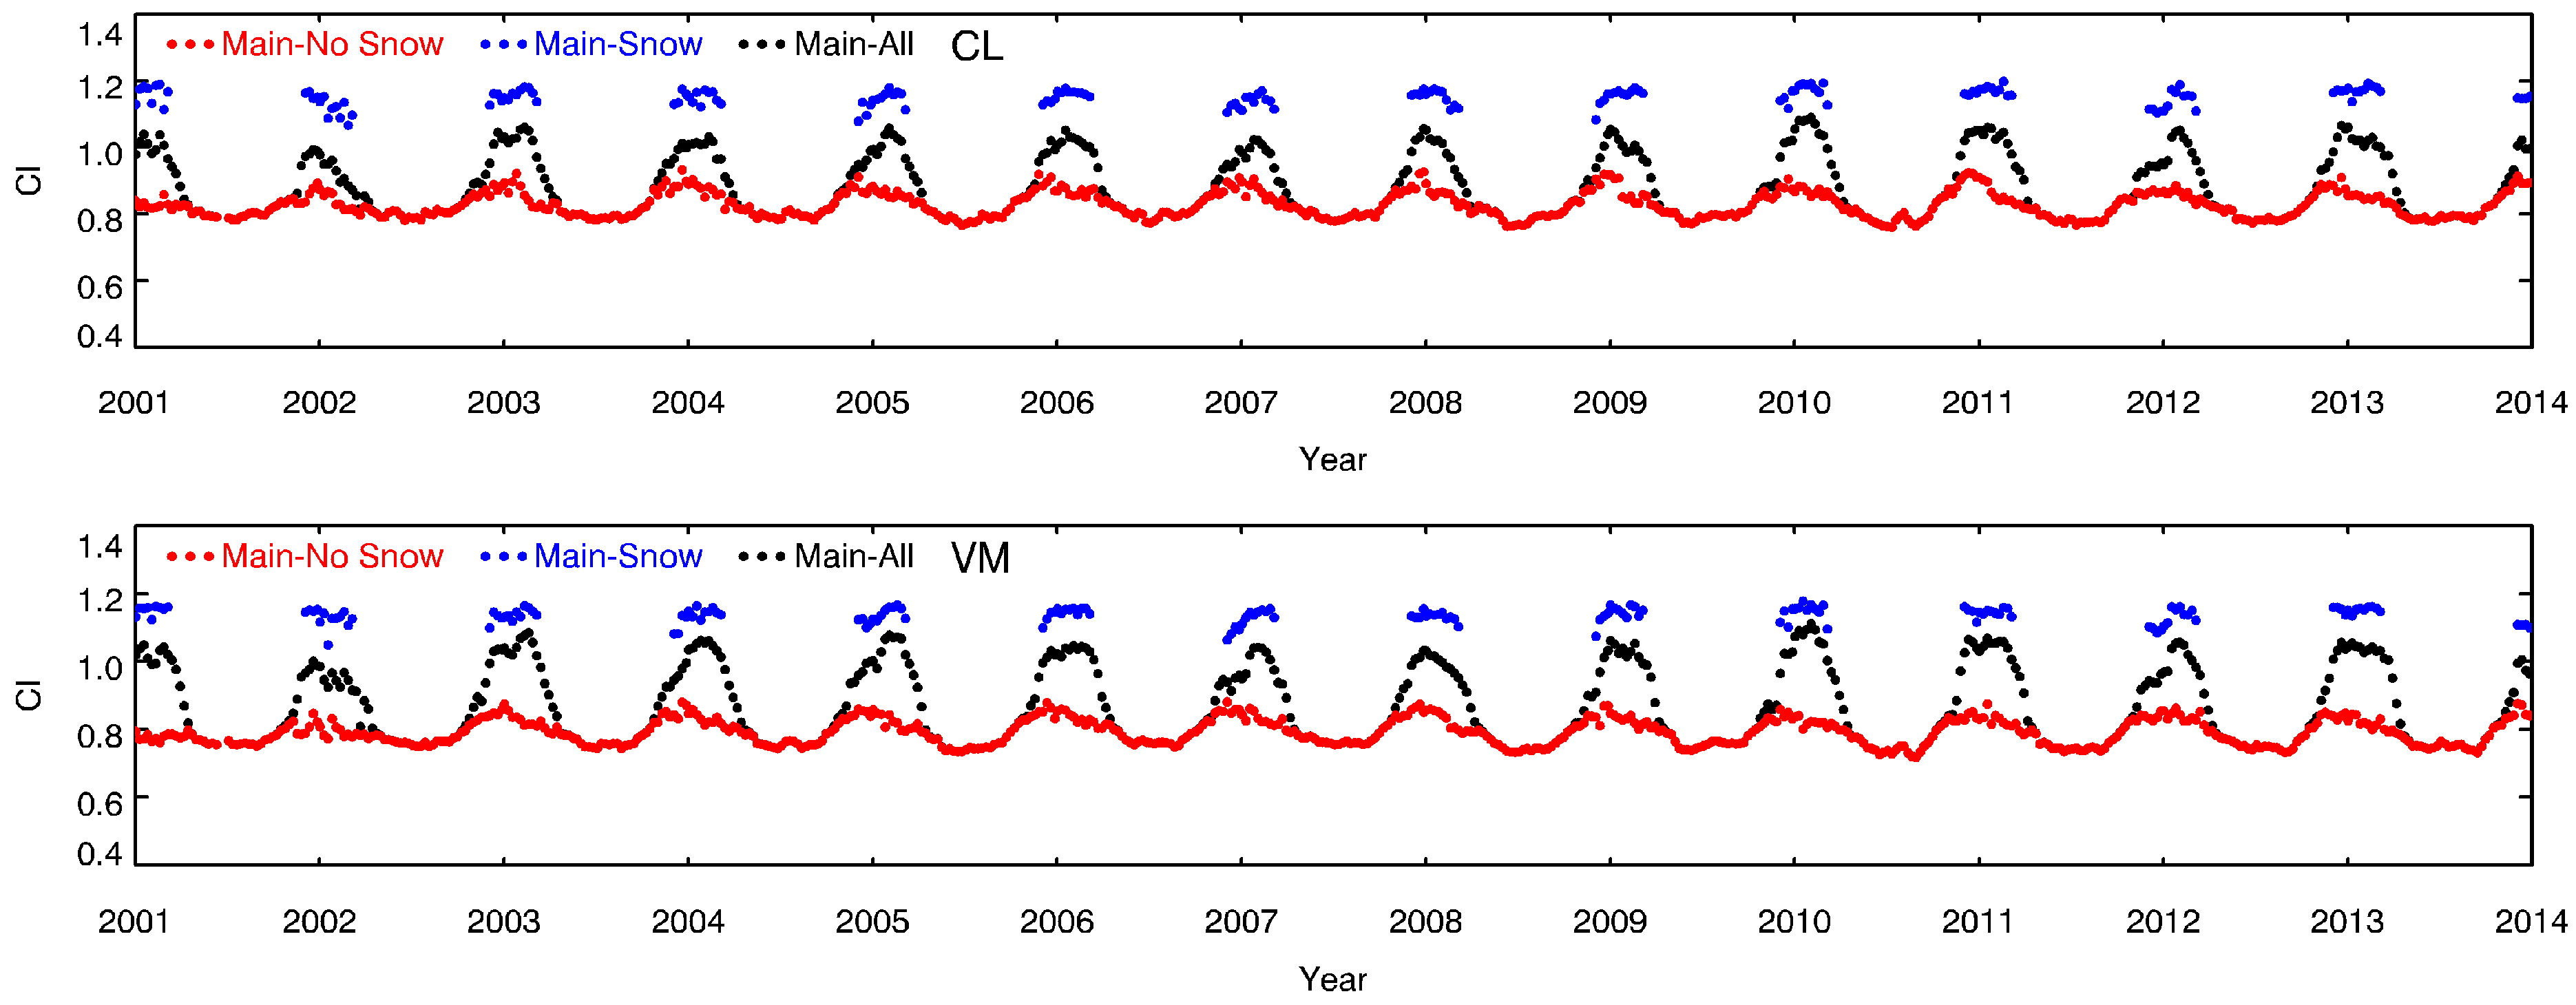
3.3. Influence of Snow on the Magnitude and Seasonal Variations of CIMODIS at a Global Scale

We summarize the temporal sequence of the average CIMODIS in snow-covered and snow-free areas for typical IGBP classes in the northern hemisphere at latitudes ≥ 30°N (Figure 4) to investigate the influence of snow on the magnitude and seasonal variation of CIMODIS. CIMODIS statistics for snow-free areas are presented in Table 2. For snow-covered areas, only the average CIMODIS in winter (from December to February) are presented in Figure 4 to ensure there are enough snow-covered pixels. The average CIMODIS of snow-covered areas for the EBF class are not presented in Figure 4 since very few pixels in the EBF class are covered by snow (Figure 3). The average CIMODIS for EBF is calculated based on the pixels in the northern hemisphere at latitudes ≥ 0°N (instead of latitudes ≥ 30°N) since most EBF (>95%) are distributed in tropical and subtropical regions.
Figure 4 shows that CIMODIS retrievals from the snow-covered pixels are considerably larger than the snow-free pixels. In addition, the biases of the CI retrieved by the main algorithm between the snow-covered and snow-free areas for open shrubs and herbaceous plants are larger than the biases for forests and closed shrubs since the open shrubs and herbaceous plants are more open than the forests and closed shrubs. A more open landcover type would have a stronger snow homogenization effect, which increases the bias of the CI between the snow-covered and snow-free areas. If the snow-covered pixels are not excluded from the statistics, a considerably larger seasonal variation will be observed for CIMODIS, even for the ENF class. However, the CIMODIS of the ENF class should be seasonally invariant since the structure of the ENF is relatively stable throughout the year [4]. Therefore, the CIMODIS retrieved from snow-covered pixels should be corrected or excluded from the statistics. It can be found from Figure 4 and Table 2 that the CIMODIS of different IGBP classes shows similar seasonal tendencies over the years. For deciduous vegetation classes, the clumping effect usually reaches a maximum in the summer and a minimum in the winter [39]. The clumping effect of evergreen forests, especially in EBF, is relatively stable throughout the year. In contrast, CIMODIS of the DBF class displays a large seasonal variation that varies from 0.67 in the summer to 0.81 in the winter. The magnitude of the seasonal variation for the DBF class is nearly 3 times that of the EBF class. As shown in Table 2, forests are usually more clumped than shrubs and herbaceous plants. In addition, needleleaf forests tend to have smaller CIMODIS than broadleaf forests. The ENF class has the highest clumping effect, with an average CI of ~0.56. In contrast, grassland (GL) is the least clumped class, with an average CI of ~0.83.
Figure 5 shows a scatterplot that compares the CI retrieved by the main algorithm for the snow-free areas (CImain-snow-free) with the CI retrievals by the main algorithm (red dots, CImain-snow) or backup algorithm (blue dots, CIbackup-snow) for snow-covered areas. Figure 4 and Figure 5 show that CImain-snow is considerably larger than CImain-snow-free with a bias of ~0.13 for needleleaf forests and ~0.32 for other vegetation types. CIbackup-snow shows better agreement with CImain-snow-free with a smaller RMSE and bias. The CIbackup-snow of the forests and herbaceous plants slightly underestimate CImain-snow-free, while the CIbackup-snow of the shrubs slightly overestimates CImain-snow-free. The magnitude of CIbackup-snow seems very stable because CI retrievals by the backup algorithm are calculated from the BRDF archetypes, which are the average BRDF shapes [39]. In summary, the backup algorithm can correct for the influence of snow to obtain a more reasonable CI for snow-covered areas. The backup algorithm can provide superior output in snow seasons probably because the CIs in the LUT of the backup algorithm are calculated based on the high-quality BRDF shapes of snow-free pixels. Thus, the CI calculated from the typical BRDF archetype in the LUT can represent the average CI of snow-free pixels for the corresponding AFX interval and should be closer to the real CIs than the CIs retrieved by the main algorithm in snow seasons.
The invariant CI retrieved by the backup algorithm in snow seasons is probably due to the relatively flat BRDF shapes of snow-covered pixels in snow seasons. We summarize the statistics of the AFX in the snow-covered areas on DOY 041, 2006 (Figure 6). Figure 6 shows that the AFX values of snow-covered pixels are mainly distributed in the AFX interval of [0.87, 1.05]. This statistics further demonstrate that snow-covered pixels capture a narrow range of AFX variations around unity (i.e., [0.87, 1.05]). Thus, the CI values retrieved by the backup algorithm are almost invariant in the AFX interval of [0.87, 1.05] compared to the entire AFX interval of [0.5, 1.5] according to the CI-AFX LUT in Jiao et al. [39].

4. Discussion

In this study, we investigate the influence of snow on CIMODIS based on in situ CI measurements and spaceborne CI product statistics. For in situ CI measurements, it is difficult to measure the CI on snow-covered days due to various environmental limitations, such as the safety of surveyors, the accessibility of the research area and the performance of instruments at low temperatures during winter. Therefore, few CI measurements are available for snow-covered days in the current accumulated field-measured CI database. The field-measured CI values of snow-covered ENF in TP39 and TP74 [37] provide an opportunity to investigate the influence of snow on CIMODIS with real validation data. The results in Figure 1 indicate that CI retrievals using only the NDHD-CI equations usually present abnormally larger fluctuations than field-measured CIs. Similar results with considerably large CIs can also be found in the CI product derived by Wei and Fang [38] in the VALERI sites. In comparison, the CIs retrieved by the backup algorithm show good consistency with the field-measured CIs once such abnormal CI values occur in the main algorithm. Therefore, the results here show the efficiency of the backup algorithm in processing snow-covered pixels.
As indicated in the Figure 1, the CIMODIS retrieved by the main algorithm fluctuates too much with comparison to the in-situ measurements in snow-free seasons. It is still challenging to capture the seasonality of CI using spaceborne CI data since the seasonal variation of the CI may be contaminated by short-term fluctuations in the retrieved CI time series data [37]. Abnormally small or large values can also be found in the recent seasonal CI retrievals from MODIS BRDF products based on the CI-NDHD equations at validation sites [37,38,39]. In this study, we mainly focus on correcting the abnormally large CI values caused by the ephemeral snow in snow seasons. Further research is definitely needed to improve our understanding in the seasonal variation of CI, especially in rainy seasons.
For current available spaceborne CI products, CI are mainly retrieved based on the NDHD-CI equations developed by Chen et al. [4]. The cover of snow reduces the contrast between the sunlit and shadowed components of the vegetation canopy. Thus, the CI retrievals based on the NDHD-CI equations are greatly influenced by snow. The CI values of snow-covered pixels are usually marked as low quality and excluded from research when studying the seasonality of the CI [5,6,37,39], which may be appropriate depending on the research purpose. However, when the global CI product is used as the input parameter for ecological, hydrological and land surface models, the accuracy of the models will be greatly influenced if the CI values in the snow-covered areas are not corrected because more than 30 percent of the pixels in the northern hemisphere are covered by snow in winter. As shown in Figure 1, Figure 4 and Figure 5, the backup algorithm provides a good correction for the influence of snow to obtain more reasonable CI values. Therefore, in the latest version of our global CI product, the backup algorithm will be used to process the pixels marked as “snow” to further improve the quality of the CI product. After such a process, the CI product should be more suitable as the input parameter for ecological, hydrological and land surface models.

5. Conclusions

The CI and its seasonality are critical for global LAI estimating and ecological modeling. In this study, we investigate the influence of snow on the magnitude and seasonal variation of the CI retrieved from MODIS BRDF products based on the ground measurements of CI time series data for the three validation sites and global CI product statistics. The result highlights are as follows:
(1) For snow-covered areas, the cover of snow will reduce the accuracy of CI retrievals by the main algorithm and result in abnormally larger CI values than the CI values for snow-free areas, with an average bias of ~0.13 for needleleaf forests and ~0.32 for other vegetation types. However, the backup algorithm can correct for the influence of snow to obtain more reasonable CI. Therefore, in the latest version of our global CI product, the backup algorithm will be further used to process the pixels of snow-covered areas. The CI product will have improved accuracy in snow-covered areas and is more suitable as the input parameters for ecological and meteorological models. (2) The time-series (e.g., 8-day) CI product shows the potential in investigating the trajectories of the clumping effect in snow seasons. However, extensive validation of the time-series CI product using field measurements is still a challenge, particularly in snow seasons. (3) The clumping effect of evergreen forests, especially for EBF, is relatively stable throughout the year. In contrast, the CI displays significant seasonal variation for deciduous vegetation types, particularly for DBF.
Snow cover information can not only be regarded as noise in CI determination but also as a clue to help retrieve a CI with higher accuracy. A more reasonable CI in snow-covered areas will be retrieved if the detailed information of snow (e.g., snow aging and ice re-crystallization processes) can be obtained from the corresponding product. In our future work, we will try to make full use of snow information to produce a global CI product that is more suitable as the input parameter for ecological and meteorological models.

Author Contributions

Conceptualization, Y.D. and Z.J.; Data curation, D.H., A.D. and Y.C.; Funding acquisition, Z.J.; Investigation, L.C.; Methodology, Y.D.; Supervision, S.Y.; Writing—original draft, Y.D.; Writing—review & editing, Y.D., Z.J., S.Y, H.Z. and X.Z.

Funding

This research was funded by the National Key Research and Development Program of China (No. 2017YFA0603001) and the National Science Foundation of China (No. 41571326).

Acknowledgments

The MODIS data were obtained from the NASA EOSDIS Land Processes Distributed Active Archive Center (LP DAAC).

Conflicts of Interest

The authors declare no conflicts of interest.

References

  1. Chen, J.M. Optically-based methods for measuring seasonal variation of leaf area index in boreal conifer stands. Agric. For. Meteorol. 1996, 80, 135–163. [Google Scholar] [CrossRef]
  2. Chen, J.M.; Black, T.A. Foliage area and architecture of plant canopies from sunfleck size distributions. Agric. For. Meteorol. 1992, 60, 249–266. [Google Scholar] [CrossRef]
  3. Nilson, T. A theoretical analysis of frequency of gaps in plant stands. Agric. Meteorol. 1971, 8, 25–38. [Google Scholar] [CrossRef]
  4. Chen, J.M.; Menges, C.H.; Leblanc, S.G. Global mapping of foliage clumping index using multi-angular satellite data. Remote Sens. Environ. 2005, 97, 447–457. [Google Scholar] [CrossRef]
  5. Pisek, J.; Ryu, Y.; Sprintsin, M.; He, L.; Oliphant, A.J.; Korhonen, L.; Kuusk, J.; Kuusk, A.; Bergstrom, R.; Verrelst, J.; et al. Retrieving vegetation clumping index from Multi-angle Imaging Spectro Radiometer (MISR) data at 275m resolution. Remote Sens. Environ. 2013, 138, 126–133. [Google Scholar] [CrossRef]
  6. Pisek, J.; Govind, A.; Arndt, S.K.; Hocking, D.; Wardlaw, T.J.; Fang, H.; Matteucci, G.; Longdoz, B. Intercomparison of clumping index estimates from POLDER, MODIS, and MISR satellite data over reference sites. ISPRS J. Photogramm. Remote Sens. 2015, 101, 47–56. [Google Scholar] [CrossRef] [Green Version]
  7. Chen, J.M.; Mo, G.; Pisek, J.; Liu, J.; Deng, F.; Ishizawa, M.; Chan, D. Effects of foliage clumping on the estimation of global terrestrial gross primary productivity. Glob. Biogeochem. Cycles 2012, 26. [Google Scholar] [CrossRef] [Green Version]
  8. Liu, J.; Chen, J.M.; Cihlar, J. Mapping evapotranspiration based on remote sensing: An application to Canada’s landmass. Water Resour. Res. 2003, 39, 1189. [Google Scholar] [CrossRef]
  9. Thomas, V.; Noland, T.; Treitz, P.; McCaughey, J.H. Leaf area and clumping indices for a boreal mixed-wood forest: Lidar, hyperspectral, and landsat models. Int. J. Remote Sens. 2011, 32, 8271–8297. [Google Scholar] [CrossRef]
  10. Chen, B.; Liu, J.; Chen, J.M.; Croft, H.; Gonsamo, A.; He, L.; Luo, X. Assessment of foliage clumping effects on evapotranspiration estimates in forested ecosystems. Agric. For. Meteorol. 2016, 216, 82–92. [Google Scholar] [CrossRef]
  11. Stenberg, P. Implications of shoot structure on the rate of photosynthesis at different levels in a coniferous canopy using a model incorporating grouping and penumbra. Funct. Ecol. 1998, 12, 82–91. [Google Scholar] [CrossRef] [Green Version]
  12. Chen, J.M.; Liu, J.; Cihlar, J.; Goulden, M.L. Daily canopy photosynthesis model through temporal and spatial scaling for remote sensing applications. Ecol. Model. 1999, 124, 99–119. [Google Scholar] [CrossRef] [Green Version]
  13. Bernier, P.Y.; Raulier, F.; Stenberg, P.; Ung, C.H. Importance of needle age and shoot structure on canopy net photosynthesis of balsam fir (Abies balsamea): A spatially inexplicit modeling analysis. Tree Physiol. 2001, 21, 815–830. [Google Scholar] [CrossRef] [PubMed]
  14. Palmroth, S.; Hari, P. Evaluation of the importance of acclimation of needle structure, photosynthesis, and respiration to available photosynthetically active radiation in a scots pine canopy. Can. J. For. Res. 2001, 31, 1235–1243. [Google Scholar] [CrossRef]
  15. Liu, J.; Chen, J.M.; Cihlar, J.; Chen, W. Net primary productivity mapped for Canada at 1-km resolution. Glob. Ecol. Biogeogr. 2002, 11, 115–129. [Google Scholar] [CrossRef]
  16. Bacour, C.; Jacquemoud, S.; Tourbier, Y.; Dechambre, M.; Frangi, J.P. Design and analysis of numerical experiments to compare four canopy reflectance models. Remote Sens. Environ. 2002, 79, 72–83. [Google Scholar] [CrossRef]
  17. Baldocchi, D.D.; Harley, P.C. scaling carbon dioxide and water vapor exchange from leaf to canopy in a deciduous forest. ii. model testing and application. Plant Cell Environ. 1995, 18, 1157–1173. [Google Scholar] [CrossRef]
  18. Law, B.E.; Cescatti, A.; Baldocchi, D.D. Leaf area distribution and radiative transfer in open-canopy forests: Implications for mass and energy exchange. Tree Physiol. 2001, 21, 777–787. [Google Scholar] [CrossRef] [PubMed]
  19. Mo, X.; Chen, J.M.; Ju, W.; Black, T.A. Optimization of ecosystem model parameters through assimilating eddy covariance flux data with an ensemble Kalman filter. Ecol. Model. 2008, 217, 157–173. [Google Scholar] [CrossRef]
  20. Chen, Q.; Baldocchi, D.; Gong, P.; Dawson, T. Modeling radiation and photosynthesis of a heterogeneous savanna woodland landscape with a hierarchy of model complexities. Agric. For. Meteorol. 2008, 148, 1005–1020. [Google Scholar] [CrossRef]
  21. Duthoit, S.; Demarez, V.; Gastellu-Etchegorry, J.; Martin, E.; Roujean, J. Assessing the effects of the clumping phenomenon on BRDF of a maize crop based on 3D numerical scenes using DART model. Agric. For. Meteorol. 2008, 148, 1341–1352. [Google Scholar] [CrossRef]
  22. Simic, A.; Chen, J.M.; Freemantle, J.R.; Miller, J.R.; Pisek, J. Improving clumping and LAI algorithms based on multiangle airborne imagery and ground measurements. IEEE Trans. Geosci. Remote Sens. 2010, 48, 1742–1759. [Google Scholar] [CrossRef]
  23. Ryu, Y.; Nilson, T.; Kobayashi, H.; Sonnentag, O.; Law, B.E.; Baldocchi, D.D. On the correct estimation of effective leaf area index: Does it reveal information on clumping effects? Agric. For. Meteorol. 2010, 150, 463–472. [Google Scholar] [CrossRef]
  24. Hill, M.J.; Roman, M.O.; Schaaf, C.B.; Hutley, L.; Brannstrom, C.; Etter, A.; Hanan, N.P. Characterizing vegetation cover in global savannas with an annual foliage clumping index derived from the MODIS BRDF Product. Remote Sens. Environ. 2011, 115, 2008–2024. [Google Scholar] [CrossRef]
  25. Pisek, J.; Lang, M.; Nilson, T.; Korhonen, L.; Karu, H. Comparison of methods for measuring gap size distribution and canopy nonrandomness at jarvselja RAMI (Radiation transfer Model Intercomparison) test sites. Agric. For. Meteorol. 2011, 151, 365–377. [Google Scholar] [CrossRef]
  26. He, L.; Chen, J.M.; Pisek, J.; Schaaf, C.B.; Strahler, A.H. Global clumping index map derived from the MODIS BRDF product. Remote Sens. Environ. 2012, 119, 118–130. [Google Scholar] [CrossRef]
  27. Pisek, J.; Oliphant, A.J. A note on the height variation of foliage clumping: Comparison with remote sensing retrievals. Remote Sens. Lett. 2013, 4, 400–408. [Google Scholar] [CrossRef]
  28. Dong, Y.; Jiao, Z.; Zhang, H.; Bai, D.; Zhang, X.; Li, Y.; He, D. A visualization tool for the kernel-driven model with improved ability in data analysis and kernel assessment. Comput. Geosci. 2016, 95, 1–10. [Google Scholar] [CrossRef]
  29. Dong, Y.; Jiao, Z.; Ding, A.; Zhang, H.; Zhang, X.; Li, Y.; He, D.; Yin, S.; Cui, L. A modified version of the kernel-driven model for correcting the diffuse light of ground multi-angular measurements. Remote Sens. Environ. 2018, 210, 325–344. [Google Scholar] [CrossRef]
  30. Zhang, X.; Jiao, Z.; Dong, Y.; Zhang, H.; Li, Y.; He, D.; Ding, A.; Yin, S.; Cui, L.; Chang, Y. Potential Investigation of Linking Prosail with the Ross-Li BRDF Model for Vegetation Characterization. Remote Sens. 2018, 10, 437. [Google Scholar] [CrossRef]
  31. Jiao, Z.; Zhang, X.; Bréon, F.; Dong, Y.; Schaaf, C.B.; Román, M.; Wang, Z.; Cui, L.; Yin, S.; Ding, A.; et al. The influence of spatial resolution on the angular variation patterns of optical reflectance as retrieved from MODIS and POLDER measurements. Remote Sens. Environ. 2018, 215, 371–385. [Google Scholar] [CrossRef]
  32. Lacaze, R.; Chen, J.M.; Roujean, J.L.; Leblanc, S.G. Retrieval of vegetation clumping index using hot spot signatures measured by POLDER instrument. Remote Sens. Environ. 2002, 79, 84–95. [Google Scholar] [CrossRef] [Green Version]
  33. Leblanc, S.G.; Chen, J.M.; White, H.P.; Latifovic, R.; Lacaze, R.; Roujean, J. Canada-wide foliage clumping index mapping from multiangular POLDER measurements. Can. J. Remote Sens. 2005, 31, 364–376. [Google Scholar] [CrossRef]
  34. Pisek, J.; Chen, J.M.; Lacaze, R.; Sonnentag, O.; Alikas, K. Expanding global mapping of the foliage clumping index with multi-angular POLDER three measurements: Evaluation and topographic compensation. ISPRS J. Photogramm. Remote Sens. 2010, 65, 341–346. [Google Scholar] [CrossRef]
  35. Pisek, J.; Chen, J.M.; Nilson, T. Estimation of vegetation clumping index using MODIS BRDF data. Int. J. Remote Sens. 2011, 32, 2645–2657. [Google Scholar] [CrossRef]
  36. Zhu, G.; Ju, W.; Chen, J.M.; Gong, P.; Xing, B.; Zhu, J. Foliage clumping index over china’s landmass retrieved from the MODIS BRDF parameters product. IEEE Trans. Geosci. Remote Sens. 2012, 50, 2122–2137. [Google Scholar] [CrossRef]
  37. He, L.; Liu, J.; Chen, J.M.; Croft, H.; Wang, R.; Sprintsin, M.; Zheng, T.; Ryu, Y.; Pisek, J.; Gonsamo, A.; et al. Inter- and intra-annual variations of clumping index derived from the MODIS BRDF product. Int. J. Appl. Earth Obs. Geoinform. 2016, 44, 53–60. [Google Scholar] [CrossRef]
  38. Wei, S.; Fang, H. Estimation of canopy clumping index from MISR and MODIS sensors using the normalized difference hotspot and darkspot (NDHD) method: The influence of BRDF models and solar zenith angle. Remote Sens. Environ. 2016, 187, 476–491. [Google Scholar] [CrossRef]
  39. Jiao, Z.; Dong, Y.; Schaaf, C.B.; Chen, J.M.; Román, M.; Wang, Z.; Zhang, H.; Ding, A.; Erb, A.; Hill, M.J.; et al. An algorithm for the retrieval of the clumping index (CI) from the MODIS BRDF product using an adjusted version of the kernel-driven BRDF model. Remote Sens. Environ. 2018, 209, 594–611. [Google Scholar] [CrossRef]
  40. Baldocchi, D.D.; Wilson, K.B.; Gu, L.H. How the environment, canopy structure and canopy physiological functioning influence carbon, water and energy fluxes of a temperate broad-leaved deciduous forest-an assessment with the biophysical model CANOAK. Tree Physiol. 2002, 22, 1065–1077. [Google Scholar] [CrossRef] [PubMed]
  41. Sampson, D.A.; Janssens, I.A.; Ceulemans, R. Under-story contributions to stand level GPP using the process model SECRETS. Agric. For. Meteorol. 2006, 139, 94–104. [Google Scholar] [CrossRef]
  42. Houborg, R.; Anderson, M.; Daughtry, C. Utility of an image-based canopy reflectance modeling tool for remote estimation of LAI and leaf chlorophyll content at the field scale. Remote Sens. Environ. 2009, 113, 259–274. [Google Scholar] [CrossRef]
  43. Sprintsin, M.; Cohen, S.; Maseyk, K.; Rotenberg, E.; Grunzweig, J.; Karnieli, A.; Berliner, P.; Yakir, D. Long term and seasonal courses of leaf area index in a semi-arid forest plantation. Agric. For. Meteorol. 2011, 151, 565–574. [Google Scholar] [CrossRef]
  44. Ryu, Y.; Verfaillie, J.; Macfarlane, C.; Kobayashi, H.; Sonnentag, O.; Vargas, R.; Ma, S.; Baldocchi, D.D. Continuous observation of tree leaf area index at ecosystem scale using upward-pointing digital cameras. Remote Sens. Environ. 2012, 126, 116–125. [Google Scholar] [CrossRef]
  45. Schaaf, C.B.; Gao, F.; Strahler, A.H.; Lucht, W.; Li, X.W.; Tsang, T.; Strugnell, N.C.; Zhang, X.Y.; Jin, Y.F.; Muller, J.P.; et al. First operational BRDF, albedo NADIR reflectance products from MODIS. Remote Sens. Environ. 2002, 83, 135–148. [Google Scholar] [CrossRef]
  46. Chen, J.M.; Leblanc, S.G. A four-scale bidirectional reflectance model based on canopy architecture. IEEE Trans. Geosci. Remote Sens. 1997, 35, 1316–1337. [Google Scholar] [CrossRef] [Green Version]
  47. Jiao, Z.; Schaaf, C.B.; Dong, Y.; Román, M.; Hill, M.J.; Chen, J.M.; Wang, Z.; Zhang, H.; Saenz, E.; Poudyal, R.; et al. A Method for improving hotspot directional signatures in BRDF models used for MODIS. Remote Sens. Environ. 2016, 186, 135–151. [Google Scholar] [CrossRef]
  48. Jiao, Z.T.; Hill, M.J.; Schaaf, C.B.; Zhang, H.; Wang, Z.S.; Li, X.W. An anisotropic flat index (AFX) to derive BRDF archetypes from MODIS. Remote Sens. Environ. 2014, 141, 168–187. [Google Scholar] [CrossRef]
  49. Zhang, H.; Jiao, Z.; Dong, Y.; Li, X. Evaluation of BRDF archetypes for representing surface reflectance anisotropy using MODIS BRDF data. Remote Sens. 2015, 7, 7826–7845. [Google Scholar] [CrossRef]
  50. Zhang, H.; Jiao, Z.; Dong, Y.; Du, P.; Li, Y.; Lian, Y.; Cui, T. Analysis of extracting prior BRDF from MODIS BRDF data. Remote Sens. 2016, 8, 1004. [Google Scholar] [CrossRef]
  51. Jiao, Z.; Zhang, H.; Dong, Y.; Liu, Q.; Xiao, Q.; Li, X. An algorithm for retrieval of surface albedo from small view-angle airborne observations through the use of BRDF archetypes as prior knowledge. IEEE J. Sel. Top. Appl. Earth Obs. Remote Sens. 2015, 8, 3279–3293. [Google Scholar] [CrossRef]
  52. Hall, D.K.; Riggs, G.A.; Salomonson, V.V.; DiGirolamo, N.E.; Bayr, K.J. MODIS snow-cover products. Remote Sens. Environ. 2002, 83, 181–194. [Google Scholar] [CrossRef] [Green Version]
  53. Friedl, M.A.; Sulla-Menashe, D.; Tan, B.; Schneider, A.; Ramankutty, N.; Sibley, A.; Huang, X. MODIS collection 5 global land cover: Algorithm refinements and characterization of new datasets. Remote Sens. Environ. 2010, 114, 168–182. [Google Scholar] [CrossRef]
  54. Peichl, M.; Arain, M.A.; Brodeur, J.J. Age effects on carbon fluxes in temperate pine forests. Agric. For. Meteorol. 2010, 150, 1090–1101. [Google Scholar] [CrossRef]
  55. Chen, J.M.; Cihlar, J. Plant canopy gap-size analysis theory for improving optical measurements of leaf-area index. Appl. Opt. 1995, 34, 6211–6222. [Google Scholar] [CrossRef] [PubMed]
  56. Leblanc, S.G. Correction to the plant canopy gap-size analysis theory used by the tracing radiation and architecture of canopies instrument. Appl. Opt. 2002, 41, 7667–7670. [Google Scholar] [CrossRef] [PubMed]
  57. Fang, H.; Li, W.; Wei, S.; Jiang, C. Seasonal variation of leaf area index (LAI) over paddy rice fields in NE china: Intercomparison of destructive sampling, LAI-2200, digital hemispherical photography (DHP), and AccuPAR methods. Agric. For. Meteorol. 2014, 198–199, 126–141. [Google Scholar] [CrossRef]
  58. Jin, Y.; Schaaf, C.B.; Gao, F.; Li, X.; Strahler, A.H.; Zeng, X.; Dickinson, R.E. How does snow impact the albedo of vegetated land surfaces as analyzed with MODIS data? Geophys. Res. Lett. 2002, 29. [Google Scholar] [CrossRef]
  59. Wang, Z.; Schaaf, C.B.; Chopping, M.J.; Strahler, A.H.; Wang, J.; Román, M.O.; Rocha, A.V.; Woodcock, C.E.; Shuai, Y. Evaluation of moderate-resolution imaging spectroradiometer (MODIS) snow albedo product (MCD43A) over tundra. Remote Sens. Environ. 2012, 117, 264–280. [Google Scholar] [CrossRef]
  60. Wang, Z.; Schaaf, C.B.; Strahler, A.H.; Chopping, M.J.; Román, M.O.; Shuai, Y.; Woodcock, C.E.; Hollinger, D.Y.; Fitzjarrald, D.R. Evaluation of MODIS albedo product (MCD43A) over grassland, agriculture and forest surface types during dormant and snow-covered periods. Remote Sens. Environ. 2014, 140, 60–77. [Google Scholar] [CrossRef]
Figure 1. Seasonal profiles of the in situ CI and CIMODIS for the three validation sites. “Main-No Snow” and “Main-Snow” indicate that the CIMODIS values are retrieved by the main algorithm on snow-free and snow-covered days, respectively. “Backup” indicates that the CIMODIS values are retrieved by the backup algorithm.
Remotesensing 10 01194 g001
Figure 2. Global snow-cover (a) and CI (b) maps on DOY 041, 2006.
Remotesensing 10 01194 g002
Figure 3. The percent of snow-covered pixels on DOY 041, 2006 for various IGBP classes in the northern hemisphere (Latitude > 0°N). UA is the abbreviation for the Urban and Build-up IGBP class. Detailed descriptions of other IGBP classes are shown in Table 2.
Remotesensing 10 01194 g003
Figure 4. Temporal sequence of the average CIMODIS for various IGBP classes in the northern hemisphere at latitudes ≥ 30°N. The average CIMODIS for EBF are calculated based on the areas in the northern hemisphere at latitudes ≥ 0°N instead of latitudes ≥ 30°N. “Main-No Snow,” “Main-Snow” and “Main-All” indicate CI retrievals by the main algorithm for snow-free, snow-covered, and both snow-free and snow-covered areas, respectively.
Remotesensing 10 01194 g004aRemotesensing 10 01194 g004bRemotesensing 10 01194 g004c
Figure 5. Comparison of CI retrieved by the main algorithm in snow-free areas with CI retrieved by the main algorithm (red dots) or backup algorithm (blue dots) in snow-covered areas for various IGBP classes over a consecutive 13-year period from 2001 to 2013 in the northern hemisphere at latitudes ≥ 30°N during winter (from December to February).
Remotesensing 10 01194 g005aRemotesensing 10 01194 g005b
Figure 6. Histogram characterizing the AFX as a function of pixel numbers in snow-covered areas on DOY 041, 2006. AFX = 1.0 refers to a Lambertian surface; AFX > 1.0 indicates that the volumetric scattering is dominant; AFX < 1.0 indicates that the geometric-optical scattering is dominant.
Remotesensing 10 01194 g006
Table 1. Detailed description of the three validation sites with the seasonal profiles of the clumping index (CI).
.SiteLocationLatitudeLongitudeSpeciesIGBPTime of MeasurementsReferences
TP39Canada42.710−80.360White pine15/2011–9/2012He et al. (2016)
TP74Canada42.707−80.348White pine15/2011–9/2012He et al. (2016)
Honghe FarmChina47.652133.522Paddy rice126/2012–9/2012Fang et al. (2014)
Table 2. CIMODIS statistics for snow-free areas over a consecutive 13-year period from 2001 to 2013. The min, max and mean represent the average CI calculated from 13 CIminimum, CImaximum and CImean in corresponding years.
AbbreviationIGBP ClassMinMaxMean
ENFEvergreen Needleleaf Forest0.530.590.56
EBFEvergreen Broadleaf Forest0.700.740.72
DNFDeciduous Needleleaf Forest0.560.660.60
DBFDeciduous Broadleaf Forest0.670.810.74
MiFMixed Forest0.680.780.73
CShClosed Shrublands0.640.790.70
OShOpen Shrublands0.780.860.81
WSaWoody Savannas0.700.840.76
SavSavannas0.730.870.79
GLGrasslands0.780.870.81
PWPermanent Wetlands0.770.930.83
CLCroplands0.770.910.83
VMCropland Natural Vegetation Mosaic0.740.870.79

