Evolution and Controls of Large Glacial Lakes in the Nepal Himalaya

 , , ,
, , ,  and
and
Abstract
:
1. Introduction
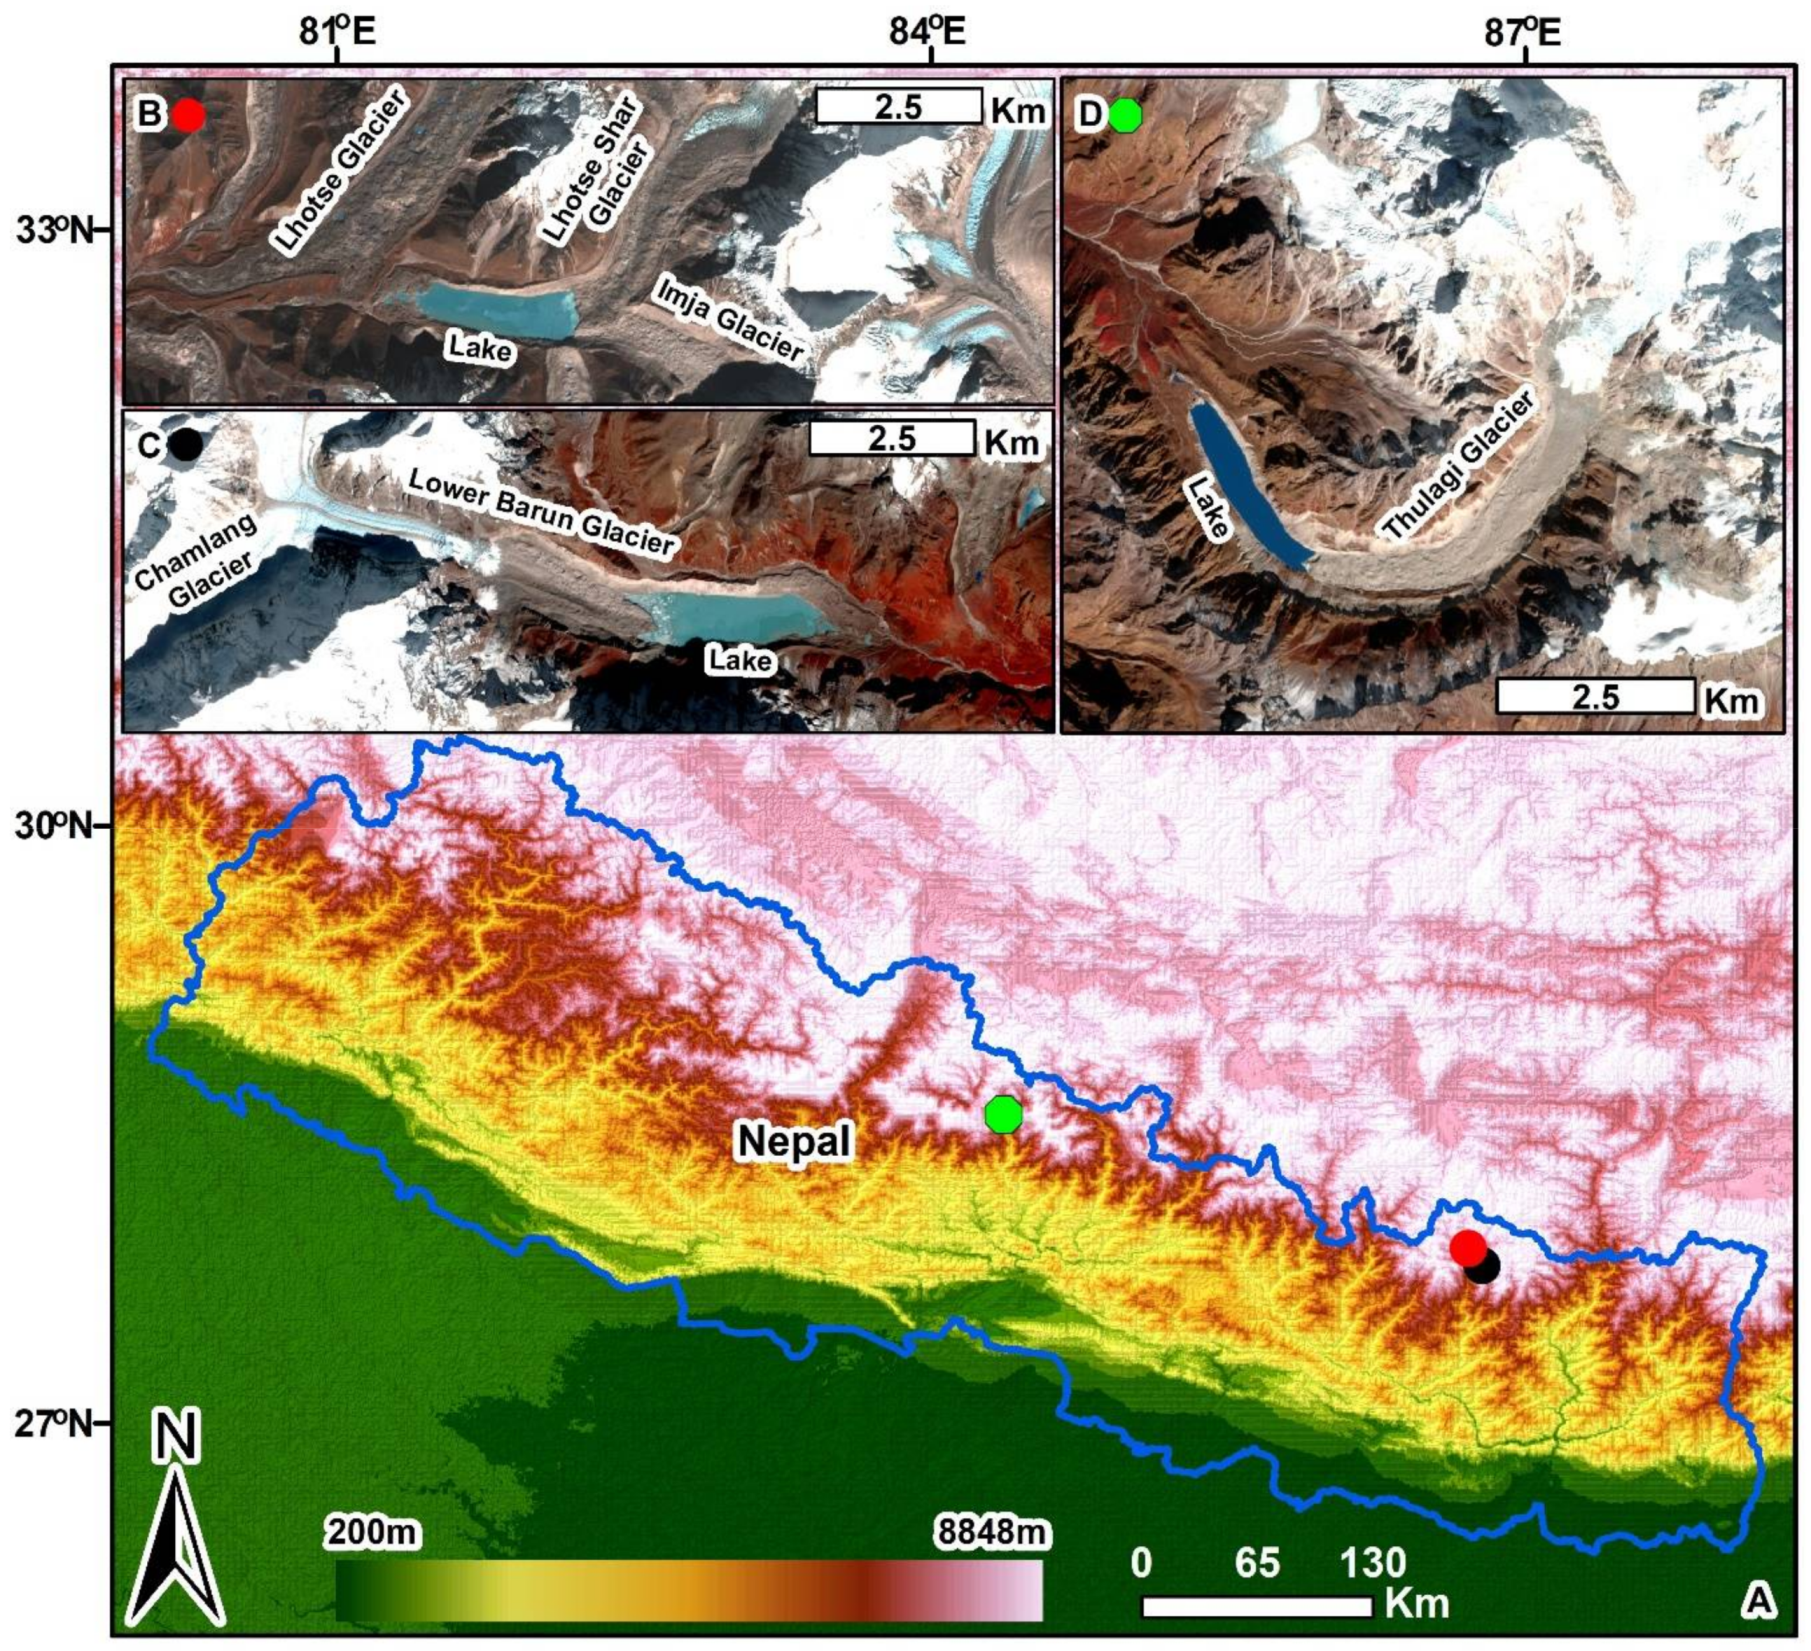
2. Study Area
2.1. Imja
2.2. Lower Barun
2.3. Thulagi
3. Data, Methods, and Uncertainties
3.1. Lake Perimeter Mapping
3.2. Digital Elevation Model (DEM) Analysis
3.3. Glacier Velocity
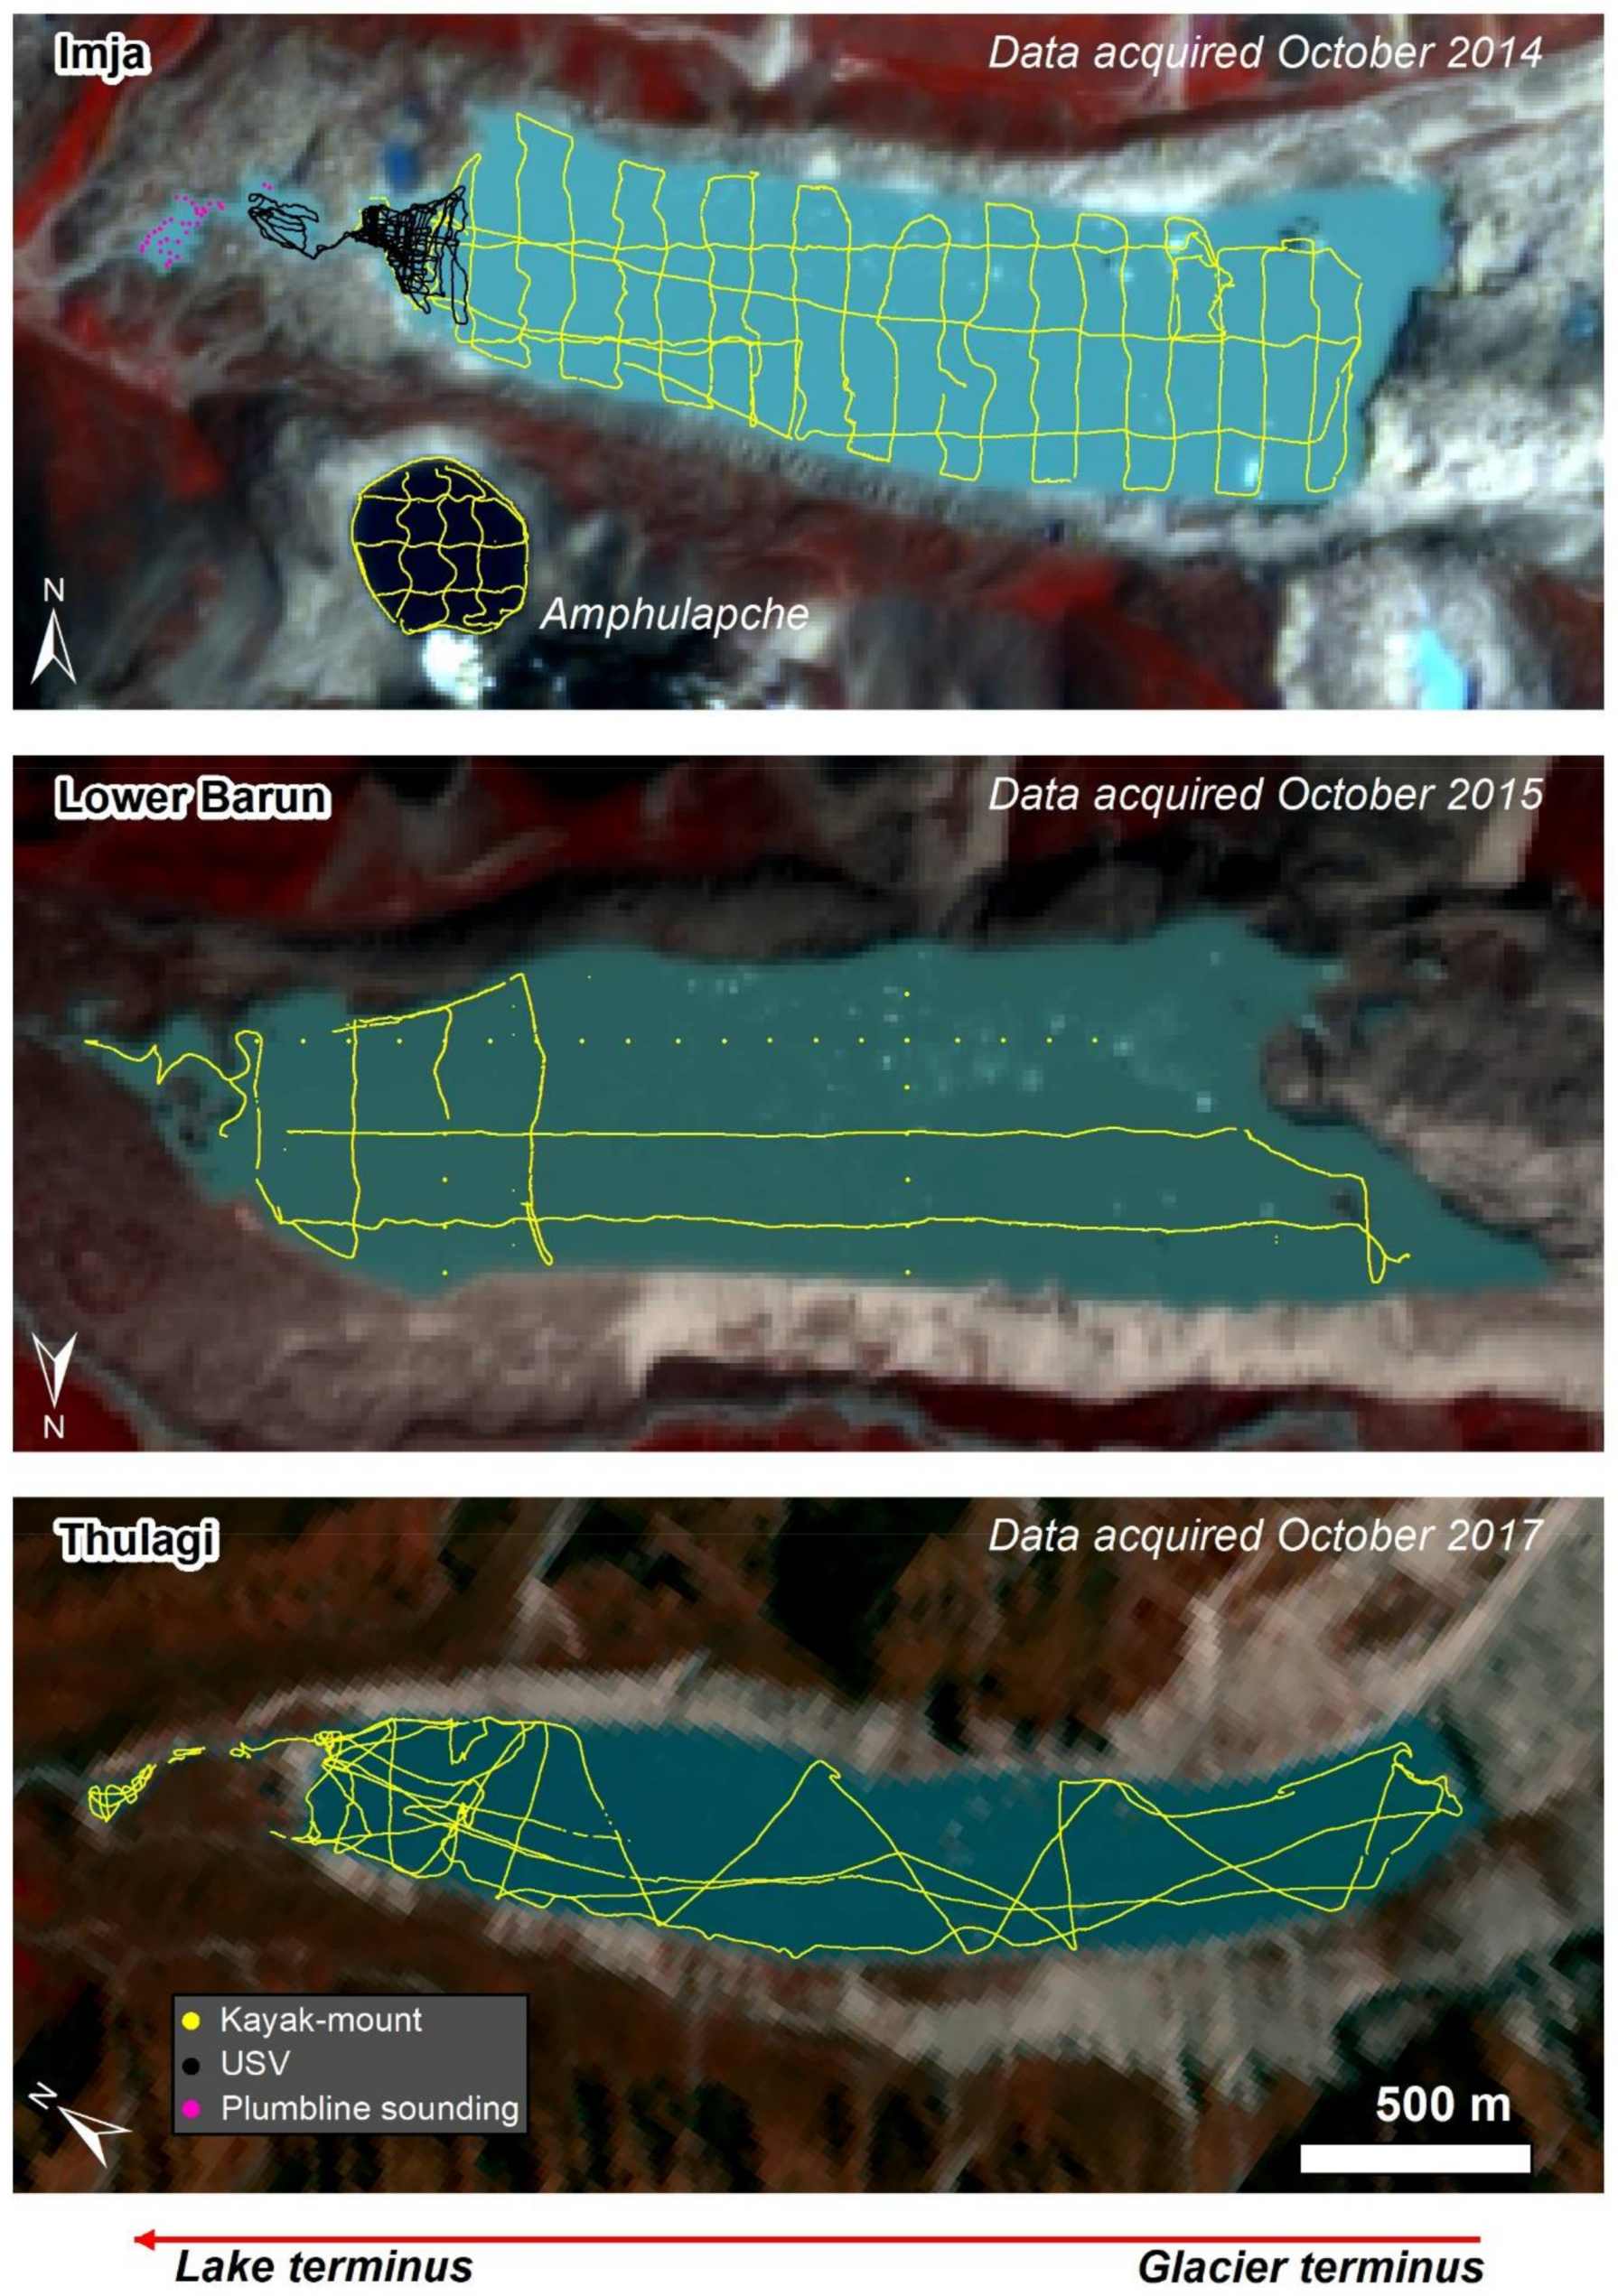
3.4. Bathymetry
4. Results and Analysis
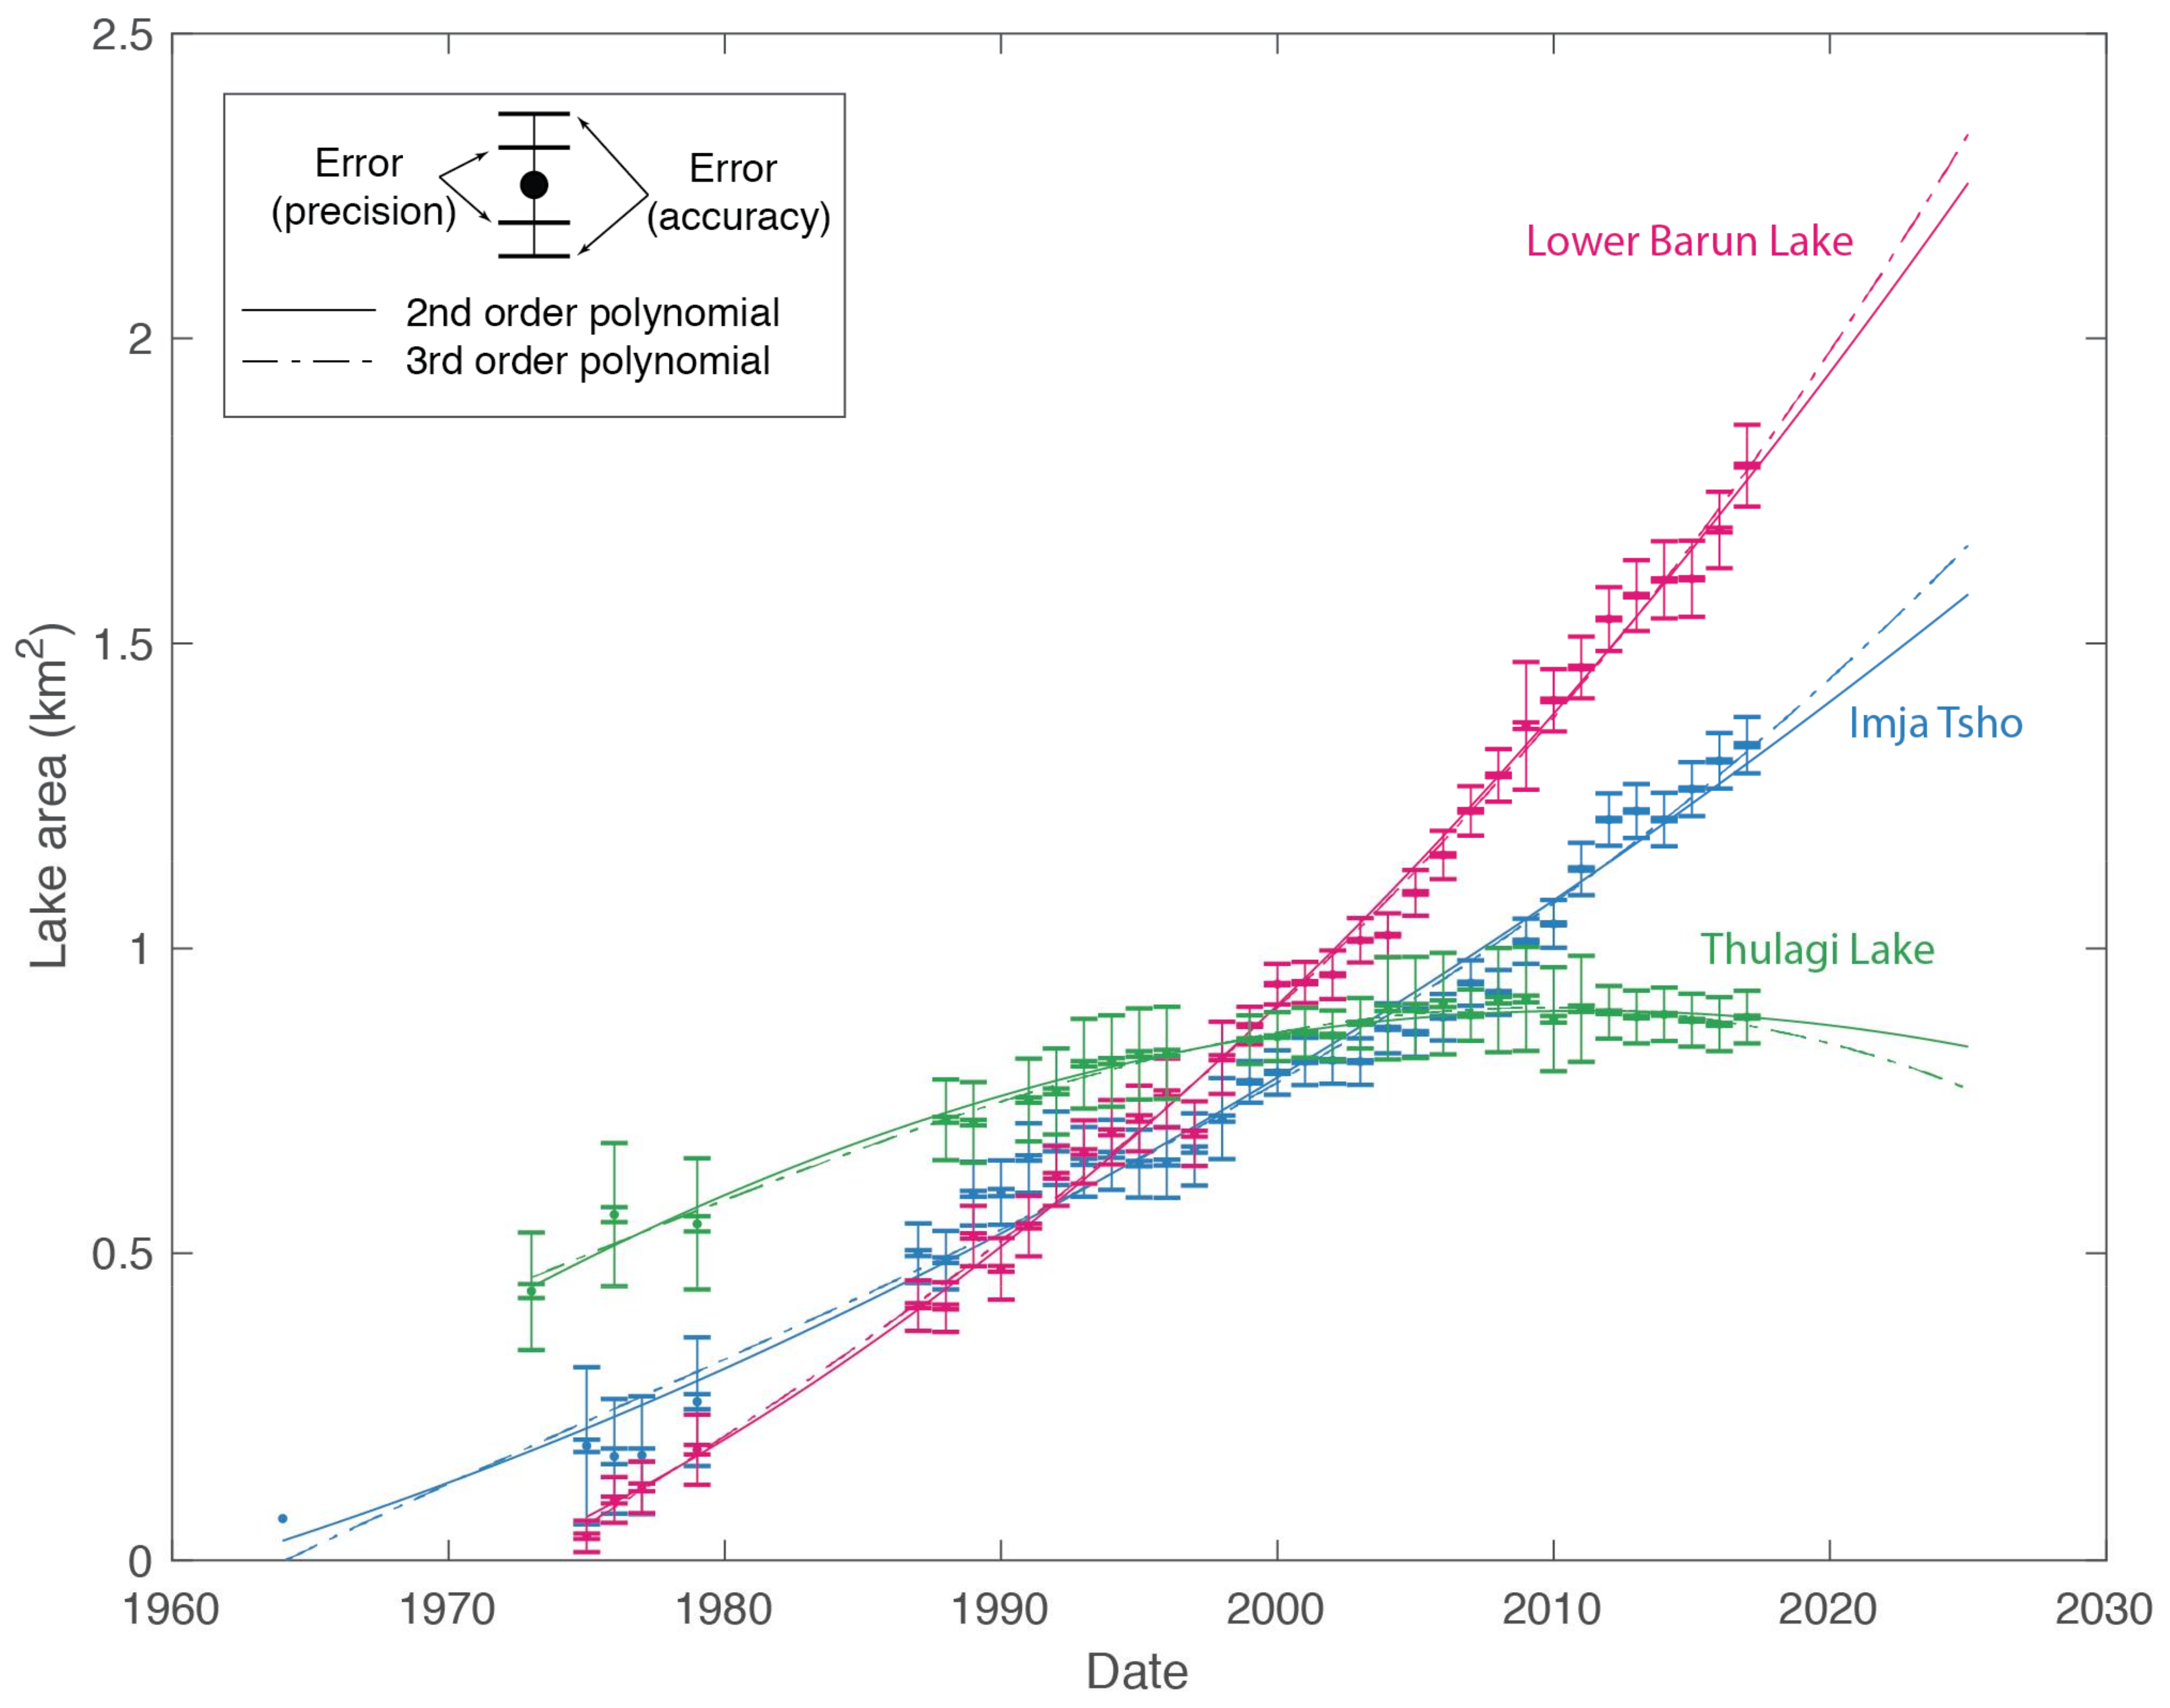
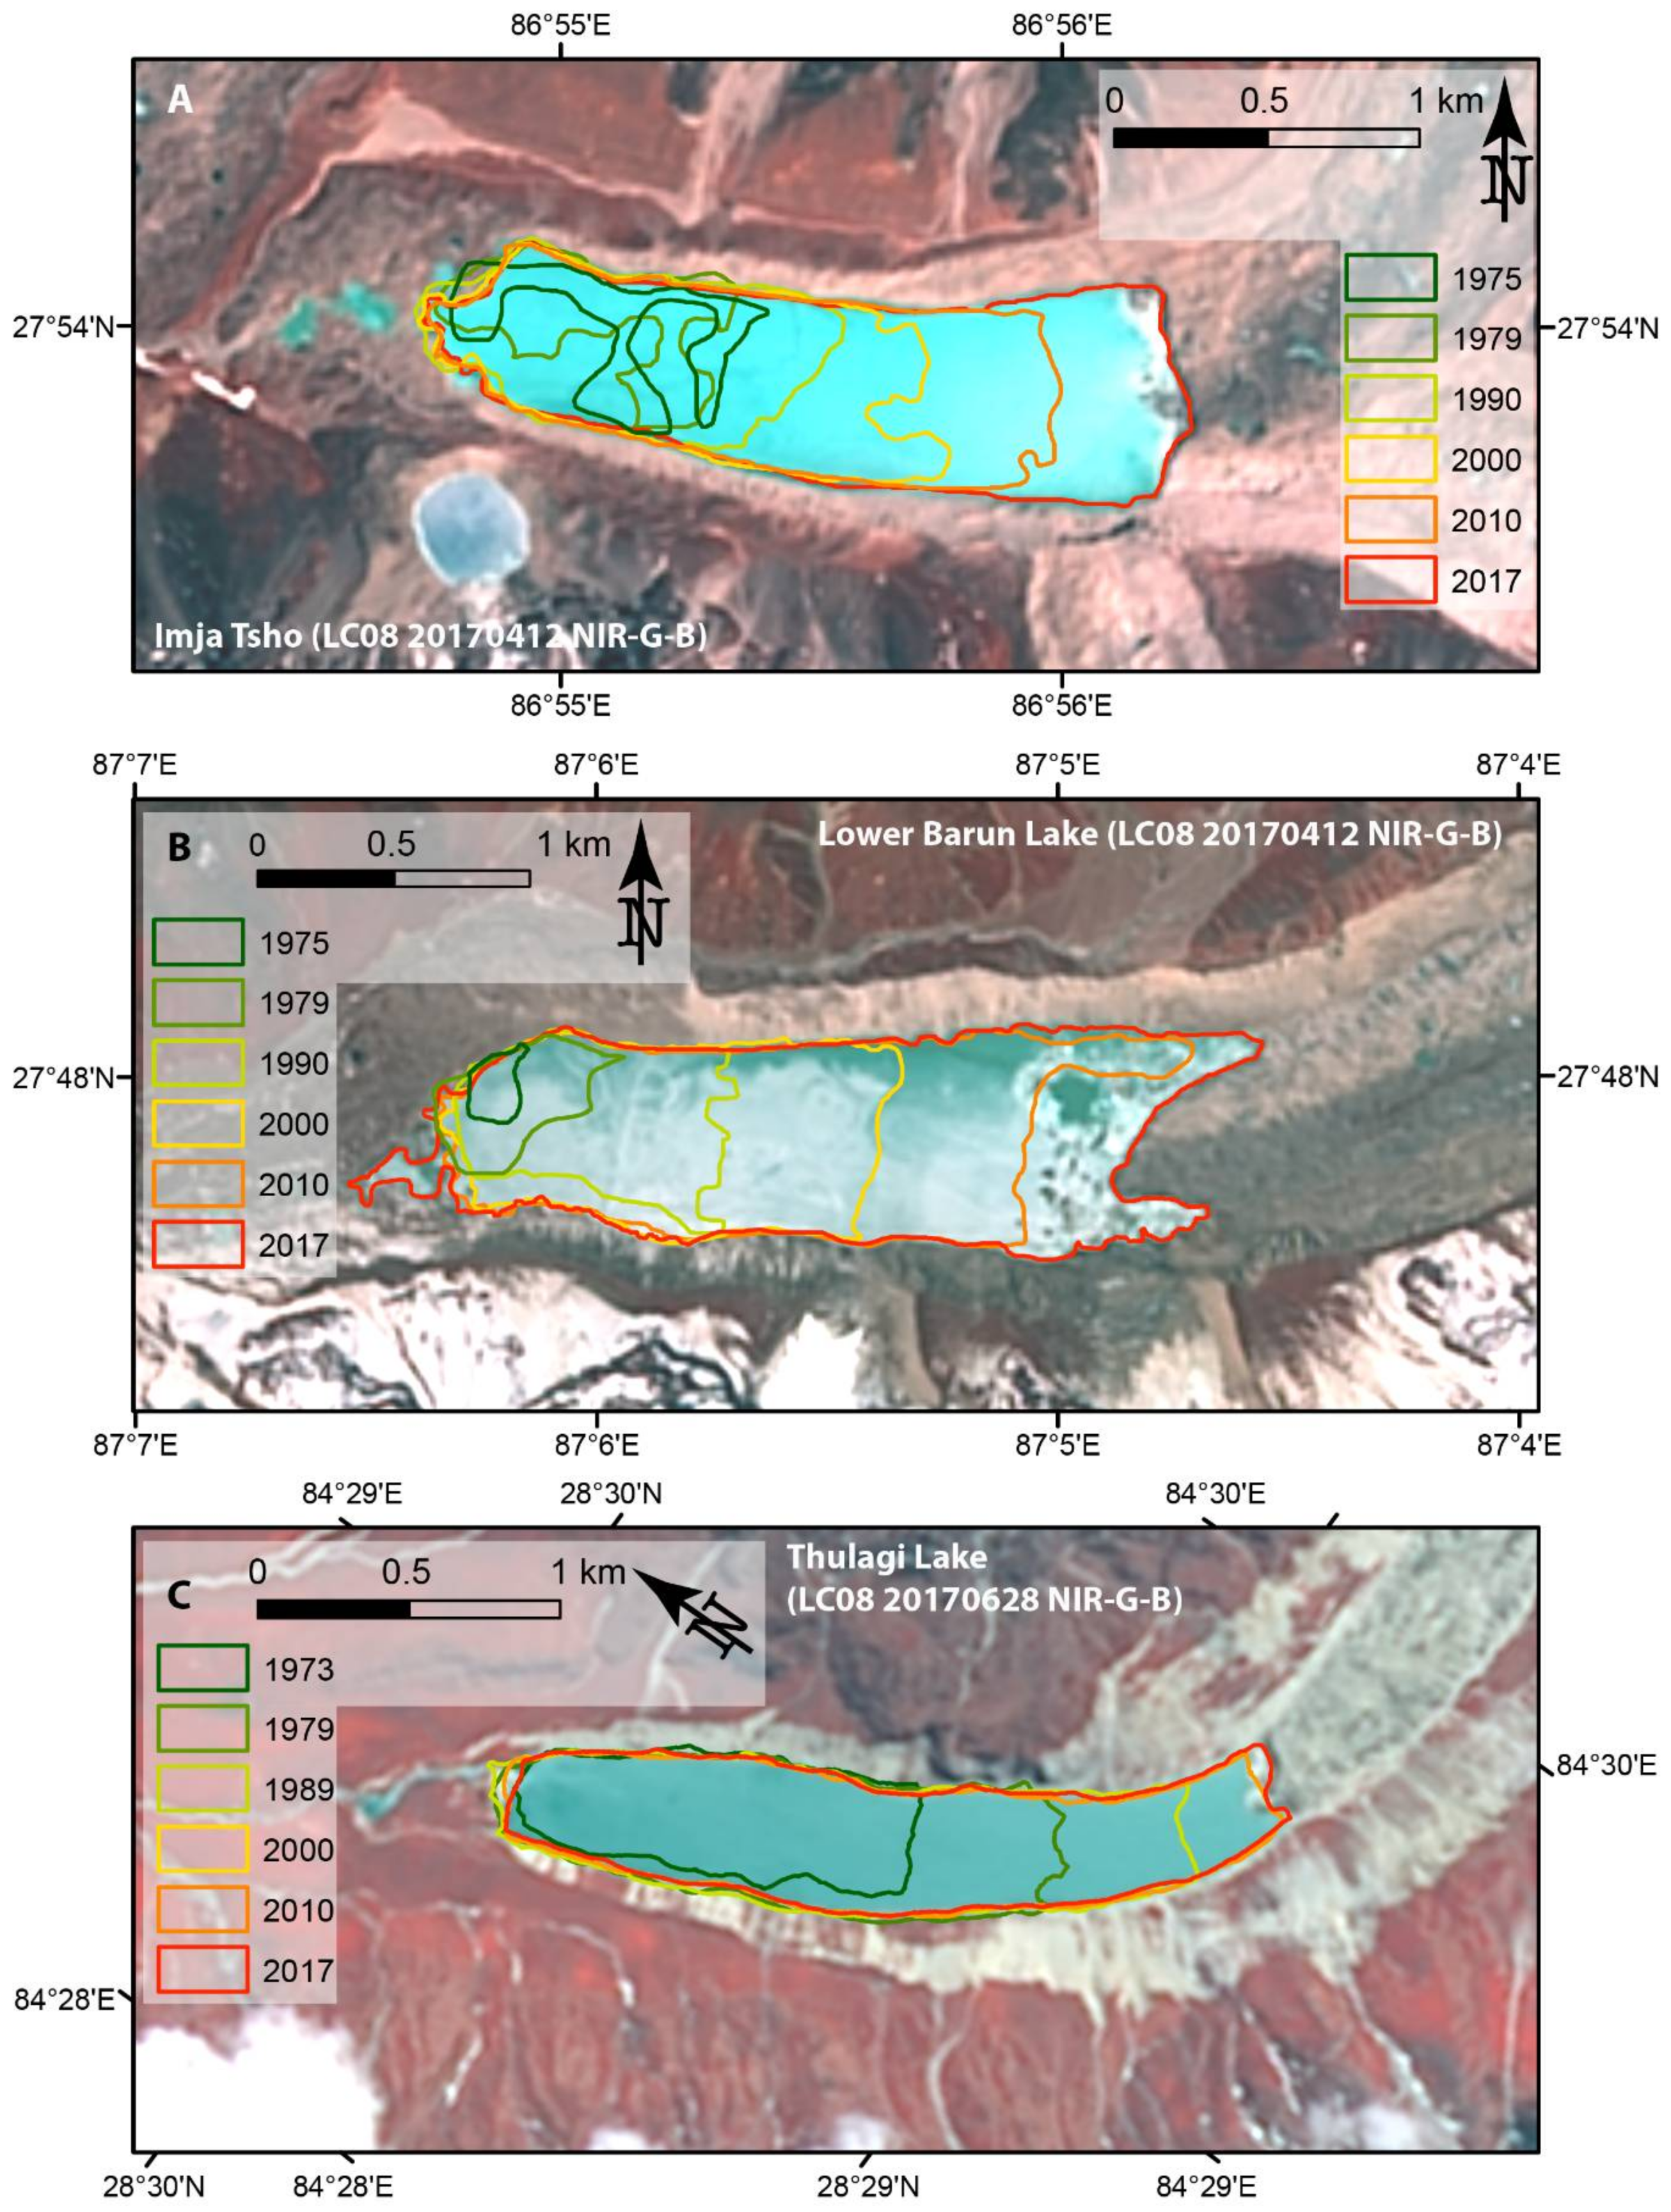
4.1. Moraine-Dammed Proglacial Lake Evolution
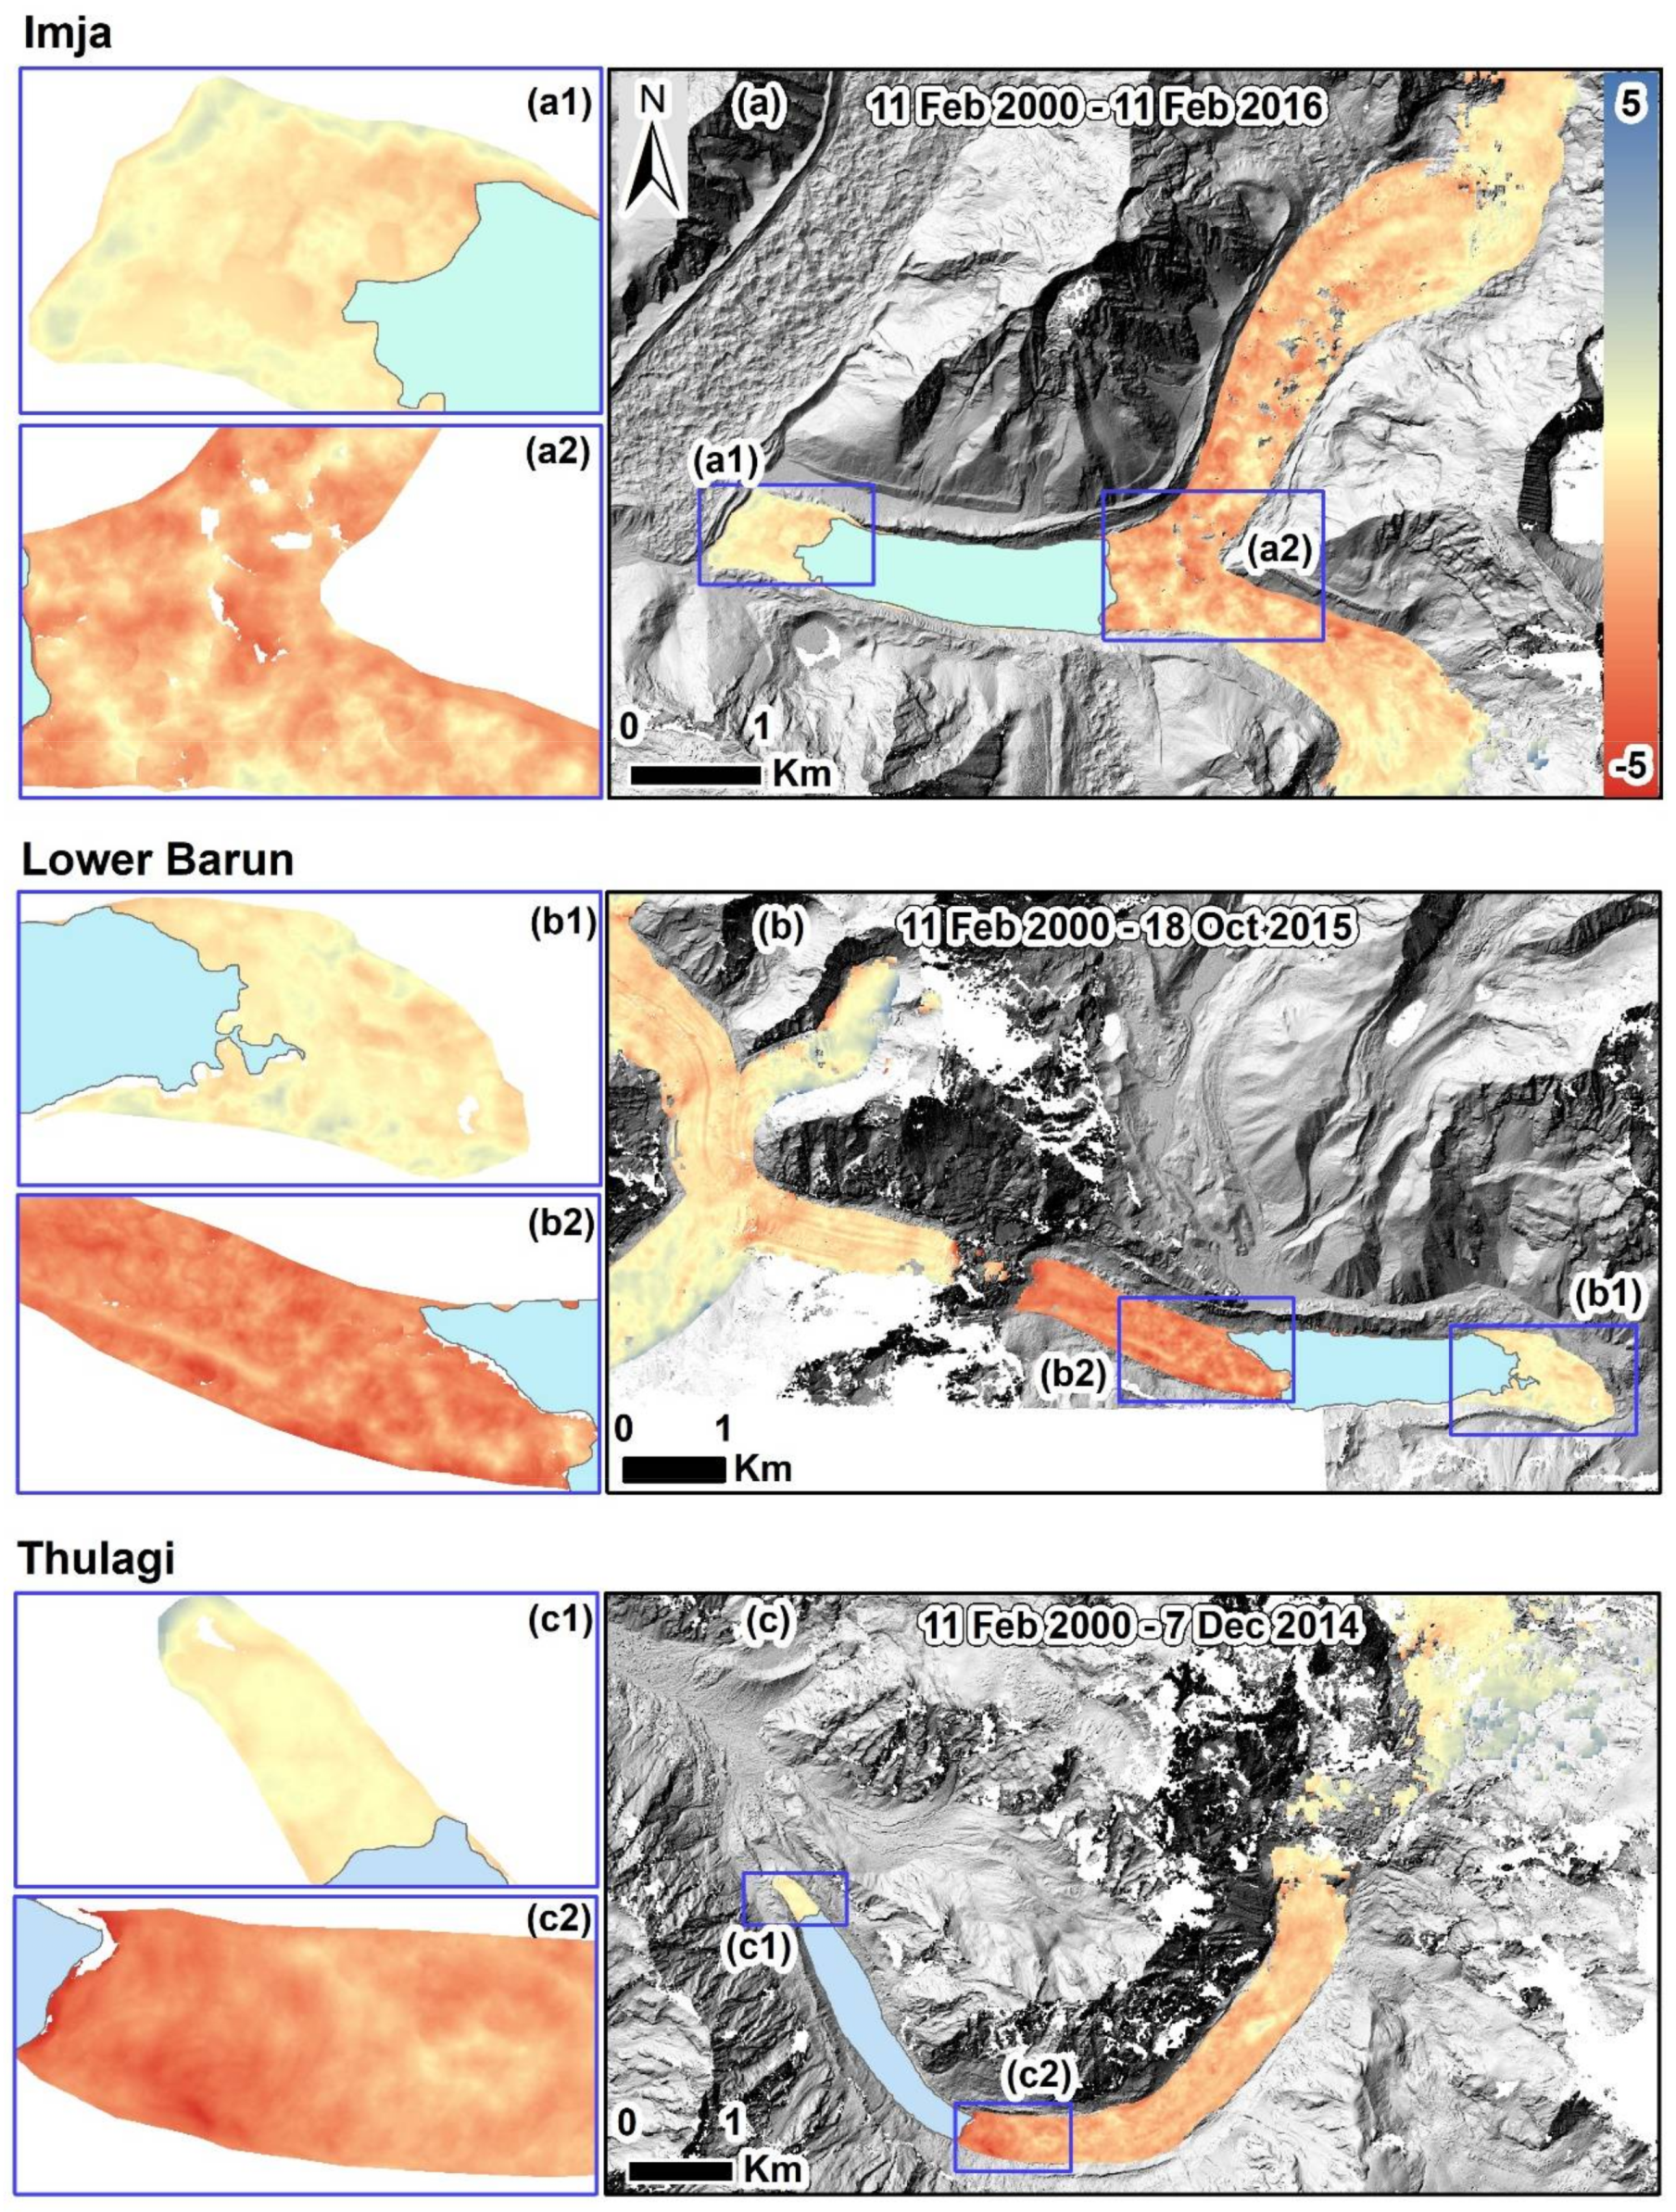
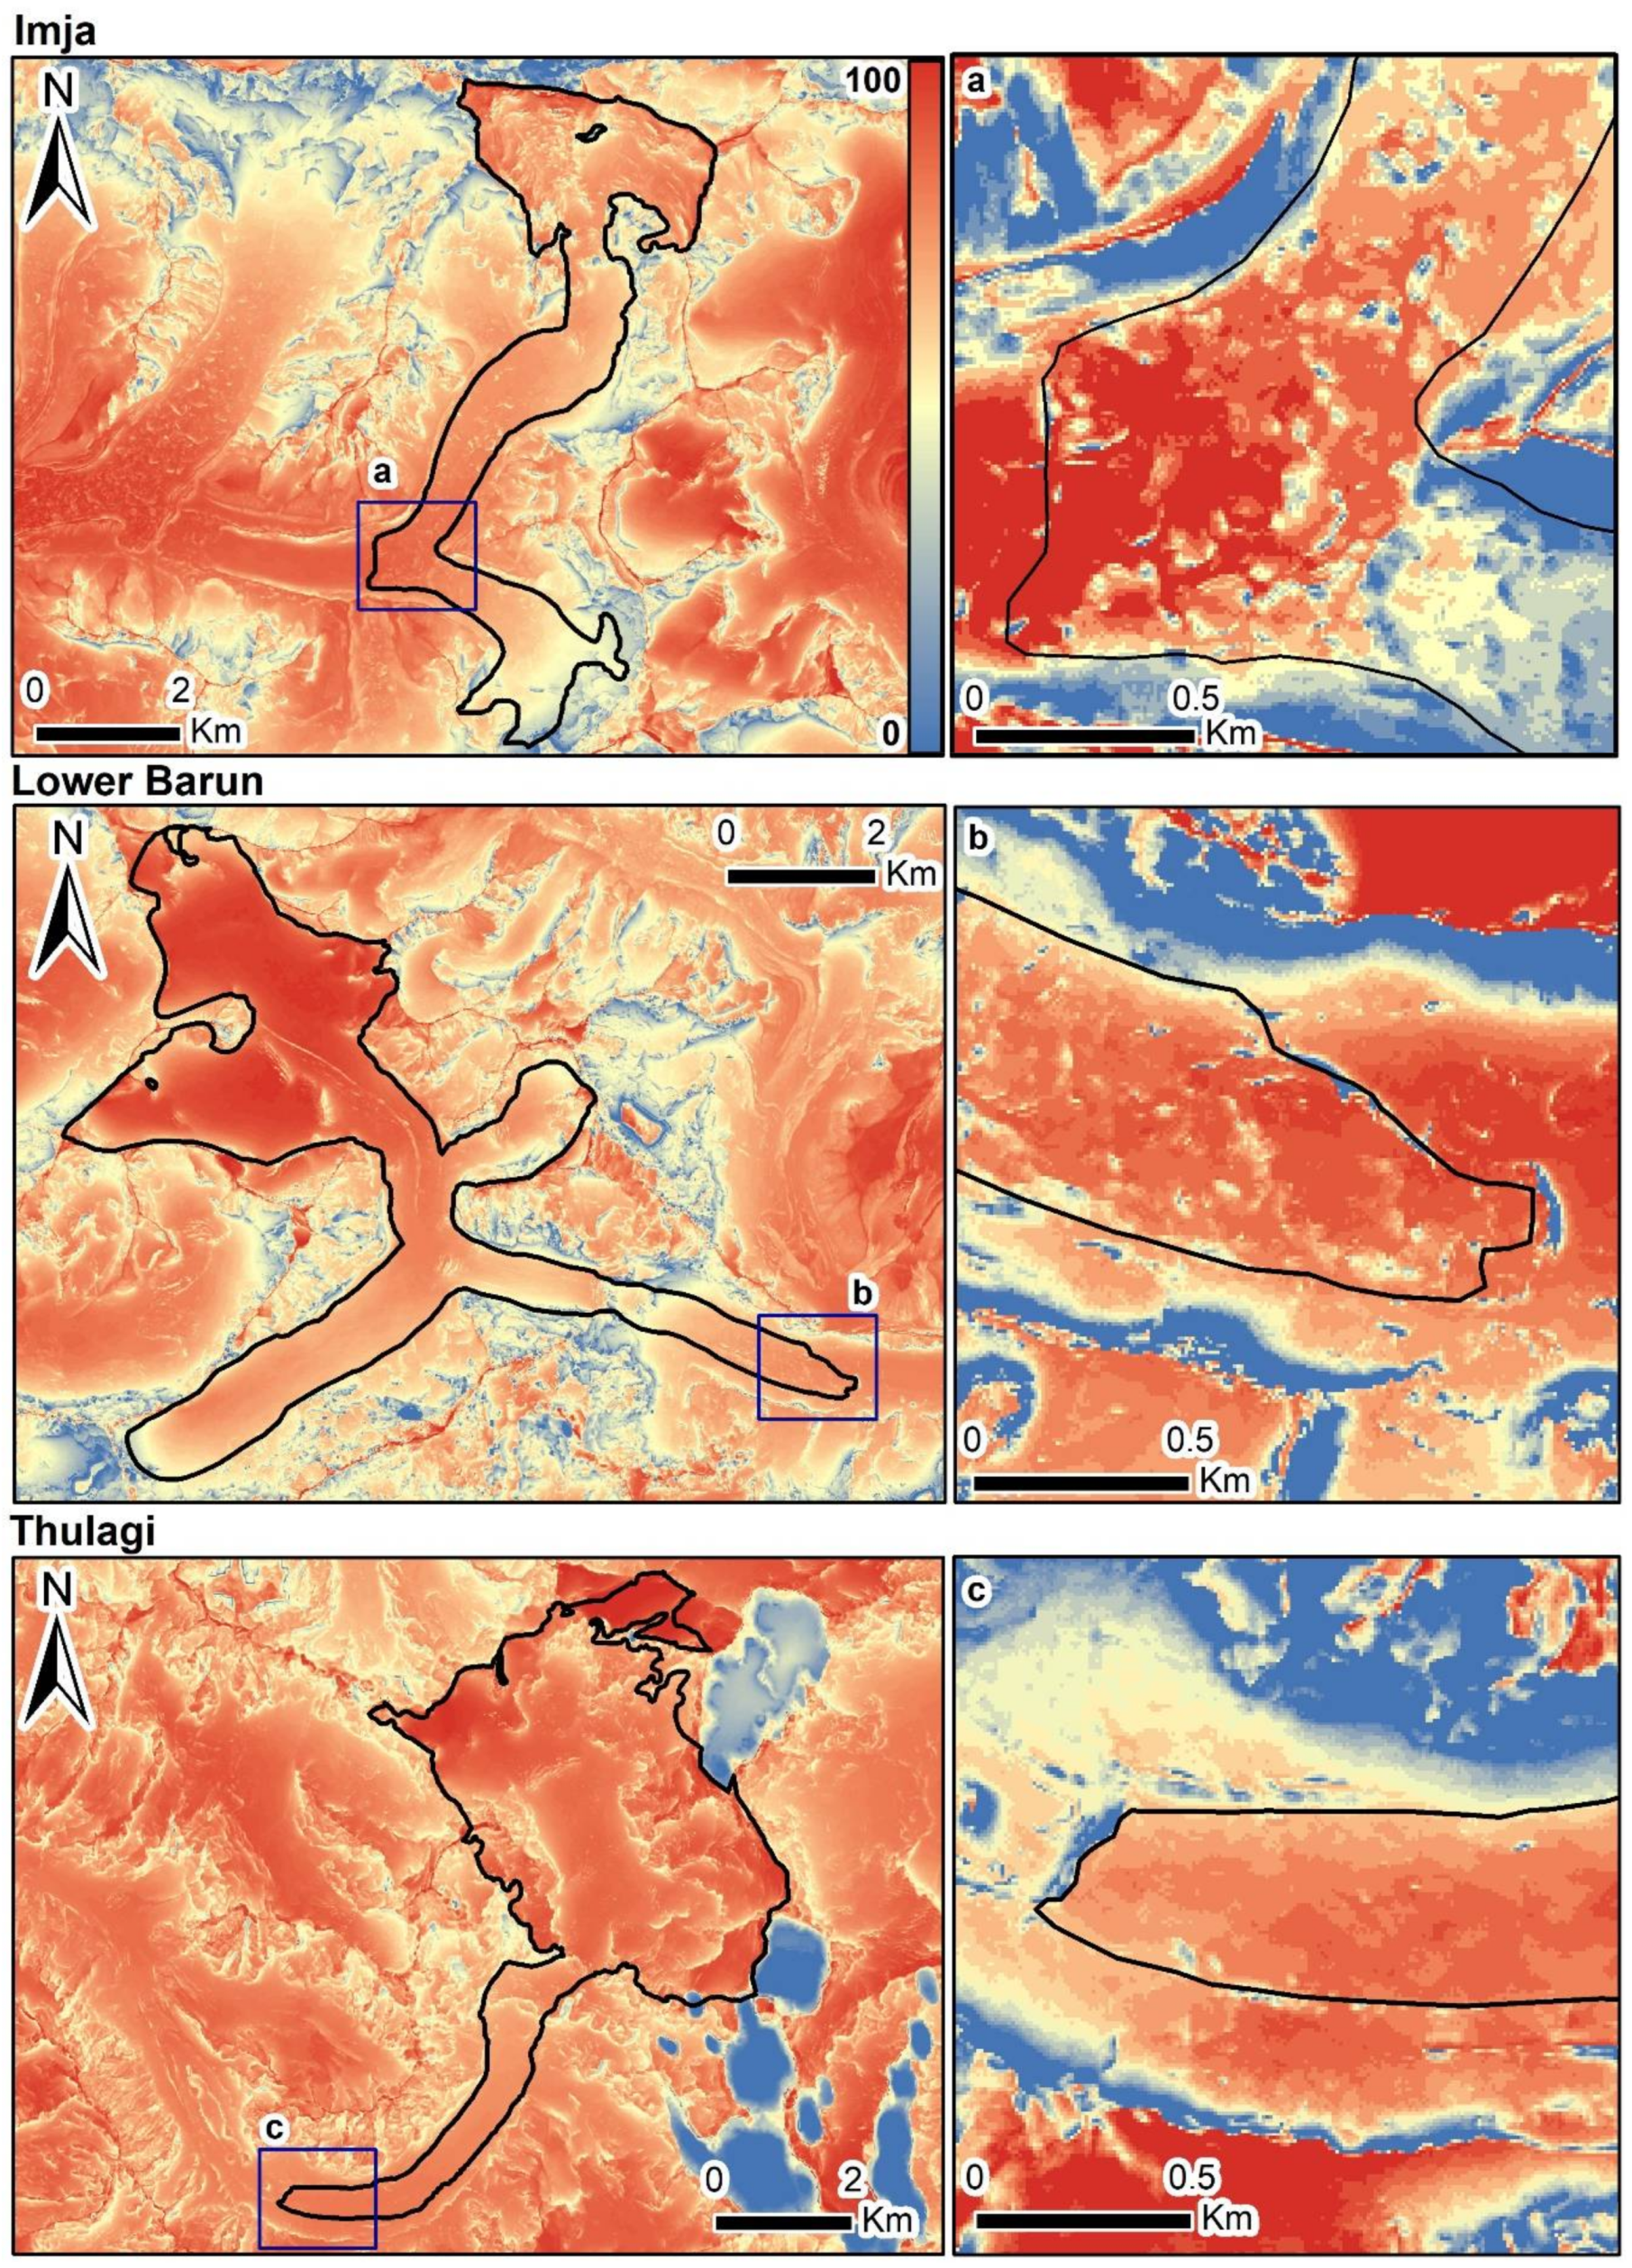
4.2. Topographic Analysis
4.3. Glacier Surface Velocity
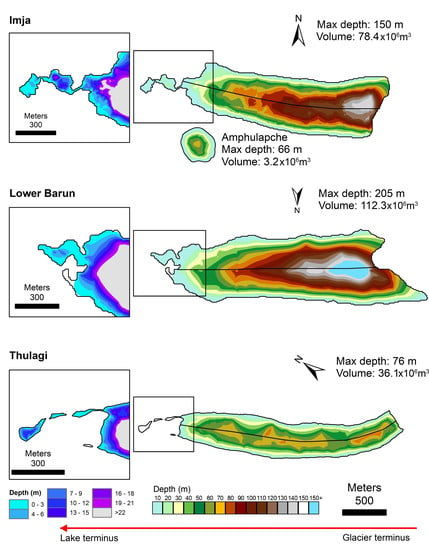
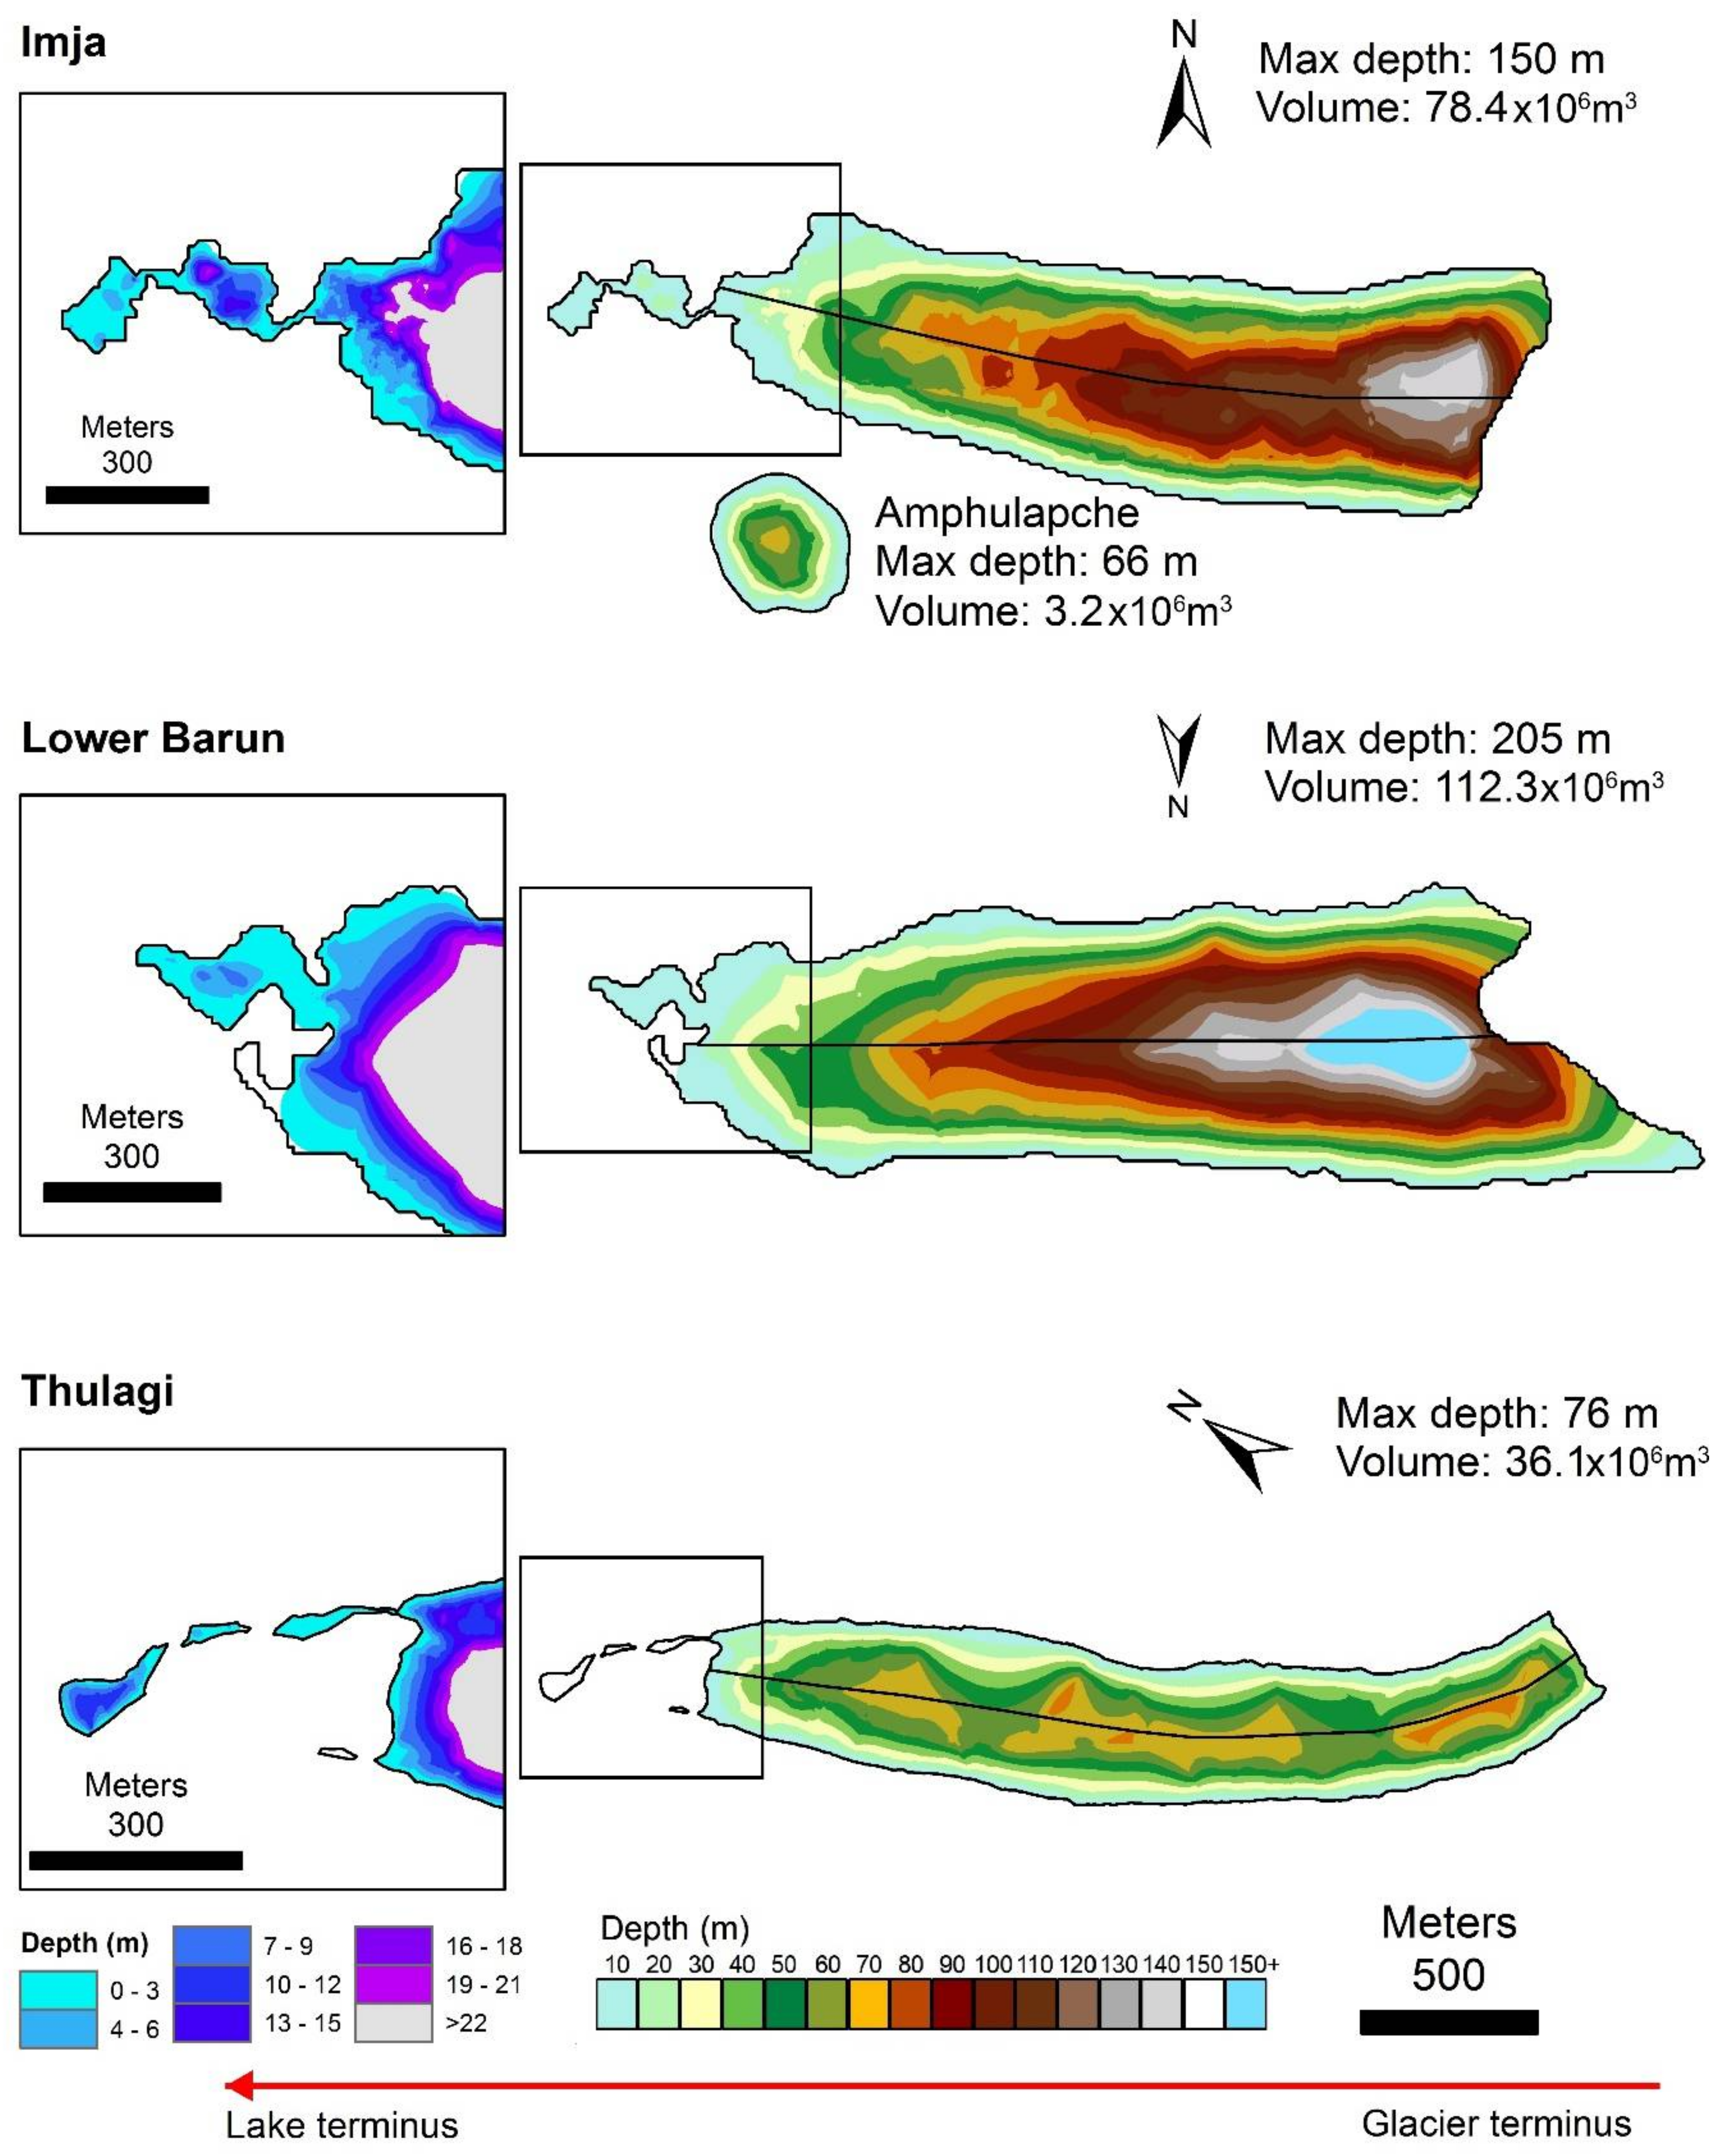
4.4. Bathymetry
5. Discussion
5.1. Lake Evolution
5.1.1. Distinct Thulagi Lake Evolution
5.1.2. Lake Evolution—Future Projections
5.2. Lake Bathymetry—Comparison with Previous Surveys
5.3. Glacier Dynamic Evolution
5.4. State and Dynamics of the Moraines and Glacier Thinning
5.5. Lake Stability and Hazards Associated with GLOFs
5.6. Engineered Lowering of Imja Lake and Prognosis for Other Lakes
6. Concluding Remarks
Supplementary Materials
Author Contributions
Acknowledgments
Conflicts of Interest
References
- Kraaijenbrink, P.D.A.; Bierkens, M.F.P.; Lutz, A.F.; Immerzeel, W.W. Impact of a global temperature rise of 1.5 degrees celsius on asia’s glaciers. Nature 2017, 549, 257. [Google Scholar] [CrossRef] [PubMed]
- Roe, G.H.; Baker, M.B.; Herla, F. Centennial glacier retreat as categorical evidence of regional climate change. Nat. Geosci. 2017, 10, 95. [Google Scholar] [CrossRef]
- Shugar, D.H.; Clague, J.J.; Best, J.L.; Schoof, C.; Willis, M.J.; Copland, L.; Roe, G.H. River piracy and drainage basin reorganization led by climate-driven glacier retreat. Nat. Geosci. 2017, 10, 370. [Google Scholar] [CrossRef]
- Kargel, J.S.; Leonard, G.J.; Bishop, M.P.; Kääb, A.; Raup, B.H. Global Land Ice Measurements from Space; Springer: Heidelberg, Germany, 2014. [Google Scholar]
- Ives, J.D.; Shrestha, R.B.; Mool, P.K. Formation of Glacial Lakes in the Hindu Kush-Himalayas and Glof Risk Assessment; ICIMOD: Kathmandu, Nepal, 2010. [Google Scholar]
- Cruz, R.V.; Harasawa, H.; Lal, M.; Wu, S.; Anokhin, Y.; Punsalmaa, B.; Honda, Y.; Jafari, M.; Li, C.; Huu Ninh, N. Asia. In Climate Change 2007: Impacts, Adaptation and Vulnerability. Contribution of Working Group II to the Fourth Assessment Report of the Intergovernmental Panel on Climate Change’; Parry, M.L., Canziani, O.F., Palutikof, J.P., van der Linden, P.J., Hanson, C.E., Eds.; Cambridge University Press: Cambridge, UK; pp. 469–506.
- Schiermeier, Q. Glacier Estimate is on Thin Ice; Nature Publishing Group: New York, NY, USA, 2010. [Google Scholar]
- Cogley, J.G. Himalayan glaciers in 2010 and 2035. In Encyclopedia of Snow, Ice and Glaciers; Springer: Heidelberg, Germany, 2011; pp. 520–523. [Google Scholar]
- Nüsser, M.; Baghel, R. The emergence of the cryoscape: Contested narratives of himalayan glacier dynamics and climate change. Environ. Clim. Chang. South Southeast Asia 2014, 2, 138–156. [Google Scholar]
- Immerzeel, W.W.; Van Beek, L.P.H.; Bierkens, M.F.P. Climate change will affect the asian water towers. Science 2010, 328, 1382–1385. [Google Scholar] [CrossRef] [PubMed]
- Bolch, T.; Kulkarni, A.; Kääb, A.; Huggel, C.; Paul, F.; Cogley, J.G.; Frey, H.; Kargel, J.S.; Fujita, K.; Scheel, M. The state and fate of himalayan glaciers. Science 2012, 336, 310–314. [Google Scholar] [CrossRef] [PubMed] [Green Version]
- Bajracharya, S.R.; Maharjan, S.B.; Shrestha, F.; Bajracharya, O.R.; Baidya, S. Glacier Status in Nepal and Decadal Change from 1980 to 2010 Based on Landsat Data; International Centre for Integrated Mountain Development: Kathmandu, Nepal, 2014. [Google Scholar]
- Brun, F.; Berthier, E.; Wagnon, P.; Kääb, A.; Treichler, D. A spatially resolved estimate of high mountain asia glacier mass balances from 2000 to 2016. Nat. Geosci. 2017, 10, 668–673. [Google Scholar] [CrossRef] [PubMed]
- Azam, M.F.; Wagnon, P.; Berthier, E.; Vincent, C.; Fujita, K.; Kargel, J.S. Review of the status and mass changes of himalayan-karakoram glaciers. J. Glaciol. 2018, 64, 61–74. [Google Scholar] [CrossRef]
- Cogley, J.G. Climate science: Himalayan glaciers in the balance. Nature 2012, 488, 468. [Google Scholar] [CrossRef] [PubMed]
- Fujita, K.; Nuimura, T. Spatially heterogeneous wastage of himalayan glaciers. Proc. Natl. Acad. Sci. USA 2011, 108, 14011–14014. [Google Scholar] [CrossRef] [PubMed]
- Kargel, J.S.; Cogley, J.G.; Leonard, G.J.; Haritashya, U.; Byers, A. Himalayan glaciers: The big picture is a montage. Proc. Natl. Acad. Sci. USA 2011, 108, 14709–14710. [Google Scholar] [CrossRef] [PubMed]
- Carrivick, J.L.; Tweed, F.S. Proglacial lakes: Character, behaviour and geological importance. Q. Sci. Rev. 2013, 78, 34–52. [Google Scholar] [CrossRef]
- Wang, X.; Ding, Y.; Liu, S.; Jiang, L.; Wu, K.; Jiang, Z.; Guo, W. Changes of glacial lakes and implications in tian shan, central asia, based on remote sensing data from 1990 to 2010. Environ. Res. Lett. 2013, 8, 044052. [Google Scholar] [CrossRef]
- Truffer, M.; Motyka, R.J. Where glaciers meet water: Subaqueous melt and its relevance to glaciers in various settings. Rev. Geophys. 2016, 54, 220–239. [Google Scholar] [CrossRef]
- Linsbauer, A.; Frey, H.; Haeberli, W.; Machguth, H.; Azam, M.F.; Allen, S. Modelling glacier-bed overdeepenings and possible future lakes for the glaciers in the himalaya—Karakoram region. Ann. Glaciol. 2016, 57, 119–130. [Google Scholar] [CrossRef]
- Chalise, S.R.; Shrestha, M.L.; Bajracharya, O.R.; Shrestha, A.B. Climate change impacts on glacial lakes and glacierized basins in Nepal and implications for water resources. In Climate Variability and Change. Hydrological Impacts; IAHS Publications: Hamburg, Germany, 2006; Volume 308, pp. 460–465. [Google Scholar]
- Watanabe, T.; Lamsal, D.; Ives, J.D. Evaluating the growth characteristics of a glacial lake and its degree of danger of outburst flooding: Imja Glacier, Khumbu Himal, Nepal. Norsk Geografisk Tidsskrift 2009, 63, 255–267. [Google Scholar] [CrossRef]
- Bajracharya, S.R.; Mool, P. Glaciers, glacial lakes and glacial lake outburst floods in the mount everest region, Nepal. Ann. Glaciol. 2009, 50, 81–86. [Google Scholar] [CrossRef]
- Komori, J. Recent expansions of glacial lakes in the bhutan himalayas. Q. Int. 2008, 184, 177–186. [Google Scholar] [CrossRef]
- International Centre for Integrated Mountain Development; Mool, P. Glacial Lakes and Glacial Lake Outburst Floods in Nepal; International Centre for Integrated Mountain Development: Kathmandu, Nepal, 2011. [Google Scholar]
- Yamada, T.; Sharma, C.K. Glacier lakes and outburst floods in the Nepal Himalaya. In Snow and Glacier Hydrology; IAHS Publications: Hamburg, Germany, 1993; Volume 218, pp. 319–330. [Google Scholar]
- Harrison, S.; Kargel, J.S.; Huggel, C.; Reynolds, J.; Shugar, D.H.; Betts, R.A.; Emmer, A.; Glasser, N.; Haritashya, U.K.; Klimeš, J.; et al. Climate change and the global pattern of moraine-dammed glacial lake outburst floods. Cryosphere 2018, 12, 1195–1209. [Google Scholar] [CrossRef]
- Rounce, D.R.; Watson, C.S.; McKinney, D.C. Identification of hazard and risk for glacial lakes in the Nepal Himalaya using satellite imagery from 2000–2015. Remote Sens. 2017, 9, 654. [Google Scholar] [CrossRef]
- Rounce, D.R.; McKinney, D.C.; Lala, J.M.; Byers, A.C.; Watson, C.S. A new remote hazard and risk assessment framework for glacial lakes in the Nepal Himalaya. Hydrol. Earth Syst. Sci. 2016, 20, 3455. [Google Scholar] [CrossRef]
- Kargel, J.S.; Haritashya, U.K.; Leonard, G.J.; Regmi, D.; Chand, M.; Joshi, S.; Mool, P. The Community Based Flood and Glacial Lake Outburst Risk Reduction Project (CFGORRP). 2015. Available online: http://cfgorrp.dhm.gov.np/accomplishments/undp-imja-final-report/ (accessed on 21 May 2018).
- Benn, D.I.; Bolch, T.; Hands, K.; Gulley, J.; Luckman, A.; Nicholson, L.I.; Quincey, D.; Thompson, S.; Toumi, R.; Wiseman, S. Response of debris-covered glaciers in the mount everest region to recent warming, and implications for outburst flood hazards. Earth-Sci. Rev. 2012, 114, 156–174. [Google Scholar] [CrossRef] [Green Version]
- Costa, J.E.; Schuster, R.L. The formation and failure of natural dams. Geol. Soc. Am. Bull. 1988, 100, 1054–1068. [Google Scholar] [CrossRef]
- Clague, J.J.; Evans, S.G. A review of catastrophic drainage of moraine-dammed lakes in british columbia. Q. Sci. Rev. 2000, 19, 1763–1783. [Google Scholar] [CrossRef]
- Rana, B.; Shrestha, A.B.; Reynolds, J.M.; Aryal, R. Hazard assessment of the tsho rolpa glacier lake and ongoing. J. Nepal Geol. Soc. 2000, 22, 563–570. [Google Scholar]
- Emmer, A.; Vilímek, V.; Zapata, M.L. Hazard mitigation of glacial lake outburst floods in the cordillera blanca (Peru): The effectiveness of remedial works. J. Flood Risk Manag. 2018, 11, S489–S501. [Google Scholar] [CrossRef]
- Cuellar, A.D.; McKinney, D.C. Decision-making methodology for risk management applied to Imja Lake in Nepal. Water 2017, 9, 591. [Google Scholar] [CrossRef]
- Watanbe, T.; Rothacher, D. The 1994 Lugge Tsho glacial lake outburst flood, Bhutan Himalaya. Mt. Res. Dev. 1996, 16, 77–81. [Google Scholar] [CrossRef]
- Haeberli, W.; Kääb, A.; Mühll, D.V.; Teysseire, P. Prevention of outburst floods from periglacial lakes at grubengletscher, valais, swiss alps. J. Glaciol. 2001, 47, 111–122. [Google Scholar] [CrossRef] [Green Version]
- Huggel, C.; Kääb, A.; Haeberli, W.; Teysseire, P.; Paul, F. Remote sensing based assessment of hazards from glacier lake outbursts: A case study in the swiss alps. Can. Geotech. J. 2002, 39, 316–330. [Google Scholar] [CrossRef]
- Kershaw, J.A.; Clague, J.J.; Evans, S.G. Geomorphic and sedimentological signature of a two-phase outburst flood from moraine-dammed Queen Bess Lake, British Columbia, Canada. Earth Surf. Process. Landf. 2005, 30, 1–25. [Google Scholar] [CrossRef]
- Harrison, S.; Glasser, N.; Winchester, V.; Haresign, E.; Warren, C.; Jansson, K. A glacial lake outburst flood associated with recent mountain glacier retreat, patagonian andes. Holocene 2006, 16, 611–620. [Google Scholar] [CrossRef]
- Hegglin, E.; Huggel, C. An integrated assessment of vulnerability to glacial hazards: A case study in the cordillera blanca, peru. Mt. Res. Dev. 2008, 28, 299–309. [Google Scholar] [CrossRef] [Green Version]
- Dussaillant, A.; Benito, G.; Buytaert, W.; Carling, P.; Meier, C.; Espinoza, F. Repeated glacial-lake outburst floods in Patagonia: An increasing hazard? Nat. Hazards 2010, 54, 469–481. [Google Scholar] [CrossRef]
- Mergili, M.; Schneider, J.F. Regional-scale analysis of lake outburst hazards in the southwestern Pamir, Tajikistan, based on remote sensing and GIS. Nat. Hazards Earth Syst. Sci. 2011, 11, 1447–1462. [Google Scholar] [CrossRef]
- Schneider, D.; Huggel, C.; Cochachin, A.; Guillén, S.; García, J. Mapping hazards from glacier lake outburst floods based on modelling of process cascades at lake 513, Carhuaz, Peru. Adv. Geosci. 2014, 35, 145. [Google Scholar] [CrossRef] [Green Version]
- Iribarren Anacona, P.; Mackintosh, A.; Norton, K.P. Hazardous processes and events from glacier and permafrost areas: Lessons from the chilean and argentinean andes. Earth Surf. Process. Landf. 2015, 40, 2–21. [Google Scholar] [CrossRef]
- Shijin, W.; Dahe, Q.; Cunde, X. Moraine-dammed lake distribution and outburst flood risk in the chinese himalaya. J. Glaciol. 2015, 61, 115–126. [Google Scholar] [CrossRef]
- Reynolds, J.M. Assessing glacial hazards for hydro development in the Himalayas, Hindu Kush and Karakoram. Int. J. Hydropower Dams 2014, 21, 60–65. [Google Scholar]
- Zaginaev, V.; Ballesteros-Cánovas, J.A.; Erokhin, S.; Matov, E.; Petrakov, D.; Stoffel, M. Reconstruction of glacial lake outburst floods in northern tien shan: Implications for hazard assessment. Geomorphology 2016, 269, 75–84. [Google Scholar] [CrossRef]
- Carrivick, J.L.; Tweed, F.S. A global assessment of the societal impacts of glacier outburst floods. Glob. Planet. Chang. 2016, 144, 1–16. [Google Scholar] [CrossRef]
- Richardson, S.D.; Reynolds, J.M. An overview of glacial hazards in the himalayas. Q. Int. 2000, 65, 31–47. [Google Scholar] [CrossRef]
- Schwanghart, W.; Worni, R.; Huggel, C.; Stoffel, M.; Korup, O. Uncertainty in the himalayan energy–water nexus: Estimating regional exposure to glacial lake outburst floods. Environ. Res. Lett. 2016, 11, 074005. [Google Scholar] [CrossRef]
- Konz, M.; Braun, L.; Grabs, W.; Shrestha, A.; Uhlenbrook, S. Runoff from Nepalese Headwater Catchments: Measurements and Modelling; Unesco International Hydrological Programme: Paris, France, 2006. [Google Scholar]
- Hambrey, M.J.; Quincey, D.J.; Glasser, N.F.; Reynolds, J.M.; Richardson, S.J.; Clemmens, S. Sedimentological, geomorphological and dynamic context of debris-mantled glaciers, mount everest (Sagarmatha) region, Nepal. Q. Sci. Rev. 2008, 27, 2361–2389. [Google Scholar] [CrossRef]
- Krumwiede, B.S.; Kamp, U.; Leonard, G.J.; Kargel, J.S.; Dashtseren, A.; Walther, M. Recent glacier changes in the mongolian altai mountains: Case studies from munkh khairkhan and tavan bogd. In Global Land Ice Measurements from Space; Springer: Heidelberg, Germany, 2014; pp. 481–508. [Google Scholar]
- Shean, D.E.; Alexandrov, O.; Moratto, Z.M.; Smith, B.E.; Joughin, I.R.; Porter, C.; Morin, P. An automated, open-source pipeline for mass production of digital elevation models (DEMS) from very-high-resolution commercial stereo satellite imagery. J. Photogram. Remote Sens. 2016, 116, 101–117. [Google Scholar] [CrossRef]
- Shean, D.E. High Mountain Asia 8-Meter Dems Derived from Along-Track Optical Imagery, 1st ed.; NASA National Snow and Ice Data Center Distributed Active Archive Center: Boulder, CO, USA, 2017.
- Shean, D.E. High Mountain Asia 8-Meter Dems Derived from Cross-Track Optical Imagery, 1st ed.; NASA National Snow and Ice Data Center Distributed Active Archive Center: Boulder, CO, USA, 2017.
- Hansen, M.C.; Potapov, P.V.; Moore, R.; Hancher, M.; Turubanova, S.; Tyukavina, A.; Thau, D.; Stehman, S.V.; Goetz, S.J.; Loveland, T.R. High-resolution global maps of 21st-century forest cover change. Science 2013, 342, 850–853. [Google Scholar] [CrossRef] [PubMed]
- Höhle, J.; Höhle, M. Accuracy assessment of digital elevation models by means of robust statistical methods. J. Photogram. Remote Sens. 2009, 64, 398–406. [Google Scholar] [CrossRef]
- Zakšek, K.; Oštir, K.; Kokalj, Ž. Sky-view factor as a relief visualization technique. Remote Sens. 2011, 3, 398–415. [Google Scholar] [CrossRef]
- Richter, R.; Schläpfer, D. Atmospheric/Topographic Correction for Satellite Imagery; DLR Report DLR-IB; DLR: Oberpfaffenhofen, Germany, 2005; p. 565-01.
- Röhl, K. Characteristics and evolution of supraglacial ponds on debris-covered tasman glacier, new zealand. J. Glaciol. 2008, 54, 867–880. [Google Scholar] [CrossRef]
- Chinn, T.J.; Kargel, J.S.; Leonard, G.J.; Haritashya, U.K.; Pleasants, M. New Zealand’s glaciers. In Global Land Ice Measurements from Space; Springer: Heidelberg, Germany, 2014; pp. 675–715. [Google Scholar]
- Leprince, S.; Ayoub, F.; Klinger, Y.; Avouac, J.-P. Co-registration of optically sensed images and correlation (COSI-Corr): An operational methodology for ground deformation measurements. In Proceedings of the 2007 International Geoscience and Remote Sensing Symposium, Barcelona, Spain, 23–27 July 2007; pp. 1943–1946. [Google Scholar]
- Scherler, D.; Leprince, S.; Strecker, M.R. Glacier-surface velocities in alpine terrain from optical satellite imagery—Accuracy improvement and quality assessment. Remote Sens. Environ. 2008, 112, 3806–3819. [Google Scholar] [CrossRef]
- Sam, L.; Bhardwaj, A.; Singh, S.; Kumar, R. Remote sensing flow velocity of debris-covered glaciers using landsat 8 data. Prog. Phys. Geogr. 2016, 40, 305–321. [Google Scholar] [CrossRef]
- Gibson, M.J.; Glasser, N.F.; Quincey, D.J.; Mayer, C.; Rowan, A.V.; Irvine-Fynn, T.D.L. Temporal variations in supraglacial debris distribution on baltoro glacier, karakoram between 2001 and 2012. Geomorphology 2017, 295, 572–585. [Google Scholar] [CrossRef]
- Ragettli, S.; Bolch, T.; Pellicciotti, F. Heterogeneous glacier thinning patterns over the last 40 years in langtang himal. Cryosphere 2016, 10, 2075–2097. [Google Scholar] [CrossRef]
- Haritashya, U.K.; Pleasants, M.S.; Copland, L. Assessment of the evolution in velocity of two debris-covered valley glaciers in Nepal and New Zealand. Geogr. Ann. Ser. A Phys. Geogr. 2015, 97, 737–751. [Google Scholar] [CrossRef]
- Thompson, S.; Benn, D.I.; Mertes, J.; Luckman, A. Stagnation and mass loss on a himalayan debris-covered glacier: Processes, patterns and rates. J. Glaciol. 2016, 62, 467–485. [Google Scholar] [CrossRef]
- Watson, C.S.; Quincey, D.J.; Carrivick, J.L.; Smith, M.W.; Rowan, A.V.; Richardson, R. Heterogeneous water storage and thermal regime of supraglacial ponds on debris-covered glaciers. Earth Surf. Process. Landf. 2018, 43, 229–241. [Google Scholar] [CrossRef]
- International Hydrographic Organization (IHO). IHO Standards for Hydrographic Surveys; IHO: Monaco, 2008; p. 36. [Google Scholar]
- Lamsal, D.; Sawagaki, T.; Watanabe, T. Digital terrain modelling using corona and alos prism data to investigate the distal part of Imja Glacier, Khumbu Himal, Nepal. J. Mt. Sci. 2011, 8, 390–402. [Google Scholar] [CrossRef]
- Hanisch, J.; Delisle, G.; Pokhrel, A.P.; Dixit, A.M.; Reynolds, J.M.; Grabs, W.E. The Thulagi Glacier Lake, Manaslu Himal, Nepal-hazard assessment of a potential outburst. In Proceedings of the 8th International Conference of the IAEG, Vancouver, BC, Canada, 21–25 September 1998; pp. 2209–2215. [Google Scholar]
- Somos-Valenzuela, M.; McKinney, D.C.; Byers, A.C.; Voss, K.; Moss, J.; McKinney, J.C. Ground Penetrating Radar Survey for Risk Reduction at Imja Lake, Nepal; Center for Research in Water Resources, University of Texas at Austin: Austin, TX, USA, 2012. [Google Scholar]
- Nie, Y.; Sheng, Y.; Liu, Q.; Liu, L.; Liu, S.; Zhang, Y.; Song, C. A regional-scale assessment of himalayan glacial lake changes using satellite observations from 1990 to 2015. Remote Sens. Environ. 2017, 189, 1–13. [Google Scholar] [CrossRef]
- WECS. Preliminary Report on the First Field Investigation on the Lower Barun Glacier Lake; WECS: Kathmandu, Nepal, 1993. [Google Scholar]
- Byers, A.C. An assessment of contemporary glacier fluctuations in Nepal’s khumbu himal using repeat photography. Himal. J. Sci. 2007, 4, 21–26. [Google Scholar] [CrossRef]
- Schneider, E. The map of the” Khumbu Himal (Everest); Ergebnisse des Forshungsunternehmens Nepal Himalaya: Munich, German, 1967; Volume 1. [Google Scholar]
- Schneider, E. Begleitworte zur Karte Khumbu Himal i und zur namensgebung. In Khumbu Himal; Springer: Heidelberg, Germany, 1967; pp. 430–446. [Google Scholar]
- Yamada, T. Report for the First Research Expedition to Imja Glacier Lake; WECS Report No. 3/4/120892/1/1 Seq. No. 412; Snow and Glacier Hydrology; WECS: Kathmandu, Nepal, 1992. [Google Scholar]
- Bolch, T.; Buchroithner, M.F.; Peters, J.; Baessler, M.; Bajracharya, S. Identification of glacier motion and potentially dangerous glacial lakes in the MT. Everest region/Nepal using spaceborne imagery. Nat. Hazards Earth Syst. Sci. 2008, 8, 1329–1340. [Google Scholar] [CrossRef]
- Fujita, K.; Sakai, A.; Nuimura, T.; Yamaguchi, S.; Sharma, R.R. Recent changes in Imja Glacial Lake and its damming moraine in the Nepal Himalaya revealed by in situ surveys and multi-temporal aster imagery. Environ. Res. Lett. 2009, 4, 045205. [Google Scholar] [CrossRef]
- Thakuri, S.; Salerno, F.; Bolch, T.; Guyennon, N.; Tartari, G. Factors controlling the accelerated expansion of Imja Lake, mount everest region, Nepal. Ann. Glaciol. 2016, 57, 245–257. [Google Scholar] [CrossRef]
- Somos-Valenzuela, M.A.; McKinney, D.C.; Rounce, D.R.; Byers, A.C. Changes in Imja Tsho in the mount everest region of Nepal. Cryosphere 2014, 8, 1661–1671. [Google Scholar] [CrossRef]
- Watanabe, T.; Ives, J.D.; Hammond, J.E. Rapid growth of a Glacial Lake in Khumbu Himal, Himalaya: Prospects for a catastrophic flood. Mt. Res. Dev. 1994, 14, 329–340. [Google Scholar] [CrossRef]
- Sakai, A.; Chikita, K.; Yamada, T. Expansion of a moraine-dammed Glacial Lake, Tsho Rolpa, in Rolwaling Himal, Nepal Himalaya. Limnol. Oceanogr. 2000, 45, 1401–1408. [Google Scholar] [CrossRef]
- Warren, C.R.; Glasser, N.F.; Harrison, S.; Winchester, V.; Kerr, A.R.; Rivera, A. Characteristics of tide-water calving at glaciar san rafael, chile. J. Glaciol. 1995, 41, 273–289. [Google Scholar] [CrossRef]
- Haresign, E.; Warren, C.R. Melt rates at calving termini: A study at glaciar león, chilean patagonia. Geol. Soc. Lond. Spec. Publ. 2005, 242, 99–109. [Google Scholar] [CrossRef]
- Benn, D.I.; Warren, C.R.; Mottram, R.H. Calving processes and the dynamics of calving glaciers. Earth-Sci. Rev. 2007, 82, 143–179. [Google Scholar] [CrossRef]
- Wang, X.; Liu, S.; Ding, Y.; Guo, W.; Jiang, Z.; Lin, J.; Han, Y. An approach for estimating the breach probabilities of moraine-dammed lakes in the chinese himalayas using remote-sensing data. Nat. Hazards Earth Syst. Sci. 2012, 12, 3109–3122. [Google Scholar] [CrossRef] [Green Version]
- Anacona, P.I.; Norton, K.P.; Mackintosh, A. Moraine-dammed lake failures in Patagonia and assessment of outburst susceptibility in the Baker Basin. Nat. Hazards Earth Syst. Sci. 2014, 14, 3243–3259. [Google Scholar] [CrossRef]
- Wilson, R.; Glasser, N.F.; Reynolds, J.M.; Harrison, S.; Anacona, P.I.; Schaefer, M.; Shannon, S. Glacial lakes of the central and patagonian andes. Glob. Planet. Chang. 2018, 162, 275–291. [Google Scholar] [CrossRef]
- Robson, B.A.; Nuth, C.; Nielsen, P.R.; Girod, L.; Hendrickx, M.; Dahl, S.O. Spatial variability in patterns of glacier change across the manaslu range, central Himalaya. Front. Earth Sci. 2018, 6, 12. [Google Scholar] [CrossRef]
- Bishop, M.P.; Bush, A.B.G.; Furfaro, R.; Gillespie, A.R.; Hall, D.K.; Haritashya, U.K.; Shroder, J.F. Theoretical foundations of remote sensing for glacier assessment and mapping. In Global Land Ice Measurements from Space; Springer: Heidelberg, Germany, 2014; pp. 23–52. [Google Scholar]
- Proy, C.; Tanre, D.; Deschamps, P.Y. Evaluation of topographic effects in remotely sensed data. Remote Sens. Environ. 1989, 30, 21–32. [Google Scholar] [CrossRef]
- Reid, T.D.; Brock, B.W. Assessing ice-cliff backwasting and its contribution to total ablation of debris-covered Miage Glacier, Mont Blanc Massif, Italy. J. Glaciol. 2014, 60, 3–13. [Google Scholar] [CrossRef]
- Immerzeel, W.W.; Kraaijenbrink, P.D.A.; Shea, J.M.; Shrestha, A.B.; Pellicciotti, F.; Bierkens, M.F.P.; De Jong, S.M. High-resolution monitoring of Himalayan glacier dynamics using unmanned aerial vehicles. Remote Sens. Environ. 2014, 150, 93–103. [Google Scholar] [CrossRef]
- Steiner, J.F.; Pellicciotti, F.; Buri, P.; Miles, E.S.; Immerzeel, W.W.; Reid, T.D. Modelling ice-cliff backwasting on a debris-covered glacier in the Nepalese Himalaya. J. Glaciol. 2015, 61, 889–907. [Google Scholar] [CrossRef]
- Buri, P.; Pellicciotti, F.; Steiner, J.F.; Miles, E.S.; Immerzeel, W.W. A grid-based model of backwasting of supraglacial ice cliffs on debris-covered glaciers. Ann. Glaciol. 2016, 57, 199–211. [Google Scholar] [CrossRef]
- Miles, E.S.; Willis, I.C.; Arnold, N.S.; Steiner, J.; Pellicciotti, F. Spatial, seasonal and interannual variability of supraglacial ponds in the langtang valley of Nepal, 1999–2013. J. Glaciol. 2017, 63, 88–105. [Google Scholar] [CrossRef]
- Watson, C.S.; Quincey, D.J.; Smith, M.W.; Carrivick, J.L.; Rowan, A.V.; James, M.R. Quantifying ice cliff evolution with multi-temporal point clouds on the debris-covered Khumbu glacier, Nepal. J. Glaciol. 2017, 63, 823–837. [Google Scholar] [CrossRef]
- Ohmura, A. Enhanced temperature variability in high-altitude climate change. Theor. Appl. Climatol. 2012, 110, 499–508. [Google Scholar] [CrossRef]
- Rangwala, I.; Miller, J.R. Climate change in mountains: A review of elevation-dependent warming and its possible causes. Clim. Chang. 2012, 114, 527–547. [Google Scholar] [CrossRef]
- Shea, J.M.; Immerzeel, W.W.; Wagnon, P.; Vincent, C.; Bajracharya, S. Modelling glacier change in the everest region, Nepal Himalaya. Cryosphere 2015, 9, 1105–1128. [Google Scholar] [CrossRef] [Green Version]
- Lutz, A.F.; Immerzeel, W.W.; Shrestha, A.B.; Bierkens, M.F.P. Consistent increase in high asia’s runoff due to increasing glacier melt and precipitation. Nat. Clim. Chang. 2014, 4, 587–592. [Google Scholar] [CrossRef]
- Scherler, D.; Bookhagen, B.; Strecker, M.R. Spatially variable response of himalayan glaciers to climate change affected by debris cover. Nat. Geosci. 2011, 4, 156–159. [Google Scholar] [CrossRef]
- Racoviteanu, A.E.; Arnaud, Y.; Baghuna, I.M.; Bajracharya, S.R.; Berthier, E.; Bhambri, R.; Bolch, T.; Byrne, M.; Chaujar, R.K.; Frauenfelder, R. Himalayan Glaciers (India, Bhutan, Nepal): Satellite observations of thinning and retreat. In Global Land Ice Measurements from Space; Springer: Heidelberg, Germany, 2014; pp. 549–582. [Google Scholar]
- Brahmbhatt, R.M.; Rathore, B.P.; Pattnaik, S.; Jani, P.; Bahuguna, I.; Shah, R.D.; Rajawat, A.S. Peculiar characteristics of fragmentation of glaciers: A case study of western Himalaya, India. Int. J. Geosci. 2015, 6, 455–463. [Google Scholar] [CrossRef]
- Sakai, A.; Fujita, K.; Yamada, T. Volume change of imja tsho in the Nepal Himalayas. In Proceedings of the ISDB 2003, Niigata, Japan, 7–10 December 2003; pp. 556–561. [Google Scholar]
- GDH. G.L.O.F Risk Assessment on the Thulagi Lake, Nepal; GDH: Saint-Pancrasse, France, 2013; p. 81. [Google Scholar]
- Quincey, D.J.; Luckman, A.; Benn, D. Quantification of everest region glacier velocities between 1992 and 2002, using satellite radar interferometry and feature tracking. J. Glaciol. 2009, 55, 596–606. [Google Scholar] [CrossRef]
- Quincey, D.J.; Richardson, S.D.; Luckman, A.; Lucas, R.M.; Reynolds, J.M.; Hambrey, M.J.; Glasser, N.F. Early recognition of glacial lake hazards in the Himalaya using remote sensing datasets. Glob. Planet. Chang. 2007, 56, 137–152. [Google Scholar] [CrossRef]
- Finkel, R.C.; Owen, L.A.; Barnard, P.L.; Caffee, M.W. Beryllium-10 dating of mount everest moraines indicates a strong monsoon influence and glacial synchroneity throughout the Himalaya. Geology 2003, 31, 561–564. [Google Scholar] [CrossRef]
- Owen, L.A.; Robinson, R.; Benn, D.I.; Finkel, R.C.; Davis, N.K.; Yi, C.; Putkonen, J.; Li, D.; Murray, A.S. Quaternary glaciation of mount everest. Q. Sci. Rev. 2009, 28, 1412–1433. [Google Scholar] [CrossRef]
- Kulkarni, A.V.; Rathore, B.P.; Mahajan, S.; Mathur, P. Alarming retreat of Parbati Glacier, Beas Basin, Himachal Pradesh. Curr. Sci. 2005, 1844–1850. [Google Scholar]
- Jiskoot, H.; Curran, C.J.; Tessler, D.L.; Shenton, L.R. Changes in clemenceau icefield and chaba group Glaciers, Canada, related to hypsometry, tributary detachment, length–slope and area–aspect relations. Ann. Glaciol. 2009, 50, 133–143. [Google Scholar] [CrossRef]
- Haritashya, U.K.; Bishop, M.P.; Shroder, J.F.; Bush, A.B.G.; Bulley, H.N.N. Space-based assessment of glacier fluctuations in the wakhan pamir, afghanistan. Clim. Chang. 2009, 94, 5–18. [Google Scholar] [CrossRef]
- Bolch, T.; Pieczonka, T.; Benn, D.I. Multi-decadal mass loss of glaciers in the everest area (Nepal Himalaya) derived from stereo imagery. Cryosphere 2011, 5, 349–358. [Google Scholar] [CrossRef] [Green Version]
- Jones, D.B.; Harrison, S.; Anderson, K.; Selley, H.L.; Wood, J.L.; Betts, R.A. The distribution and hydrological significance of rock glaciers in the Nepalese Himalaya. Glob. Planet. Chang. 2018, 160, 123–142. [Google Scholar] [CrossRef]
- Nicholson, L.; Benn, D.I. Calculating ice melt beneath a debris layer using meteorological data. J. Glaciol. 2006, 52, 463–470. [Google Scholar] [CrossRef]
- Reid, T.D.; Brock, B.W. An energy-balance model for debris-covered glaciers including heat conduction through the debris layer. J. Glaciol. 2010, 56, 903–916. [Google Scholar] [CrossRef]
- Sakai, A.; Takeuchi, N.; Fujita, K.; Nakawo, M. Role of supraglacial ponds in the ablation process of a debris-covered glacier in the Nepal Himalayas. In Debris-Covered Glaciers; International Association of Hydrological Sciences: Oxford, UK, 2000; pp. 119–132. [Google Scholar]
- Mertes, J.R.; Thompson, S.S.; Booth, A.D.; Gulley, J.D.; Benn, D.I. A conceptual model of supra-glacial lake formation on debris-covered glaciers based on GPR facies analysis. Earth Surf. Process. Landf. 2017, 42, 903–914. [Google Scholar] [CrossRef]
- Westoby, M.J.; Glasser, N.F.; Brasington, J.; Hambrey, M.J.; Quincey, D.J.; Reynolds, J.M. Modelling outburst floods from moraine-dammed glacial lakes. Earth-Sci. Rev. 2014, 134, 137–159. [Google Scholar] [CrossRef]
- Emmer, A. Geomorphologically effective floods from moraine-dammed lakes in the cordillera Blanca, Peru. Q. Sci. Rev. 2017, 177, 220–234. [Google Scholar] [CrossRef]
- Rounce, D.R.; Byers, A.C.; Byers, E.A.; McKinney, D.C. Brief communication: Observations of a glacier outburst flood from Lhotse Glacier, Everest area, Nepal. Cryosphere 2017, 11, 443–449. [Google Scholar] [CrossRef]
- GlacierHub. A Visit to the Source of a Recent Glacier Flood in Nepal. Available online: http://glacierhub.org/2017/05/17/a-visit-to-the-source-of-a-recent-glacier-flood-in-nepal/ (accessed on 5 April 2018).
- Shangguan, D.; Ding, Y.; Liu, S.; Xie, Z.; Pieczonka, T.; Xu, J.; Moldobekov, B. Quick release of internal water storage in a glacier leads to underestimation of the hazard potential of glacial lake outburst floods from lake merzbacher in central tian shan mountains. Geophys. Res. Lett. 2017, 44, 9786–9795. [Google Scholar] [CrossRef]
- Byers, A.C.; Byers, E.A.; McKinney, D.C.; Rounce, D.R. A field-based study of impacts of the 2015 earthquake on potentially dangerous Glacial Lakes in Nepal. HIMALAYA J. Assoc. Nepal Himal. Stud. 2017, 37, 7. [Google Scholar]
- Kargel, J.S.; Leonard, G.J.; Shugar, D.H.; Haritashya, U.K.; Bevington, A.; Fielding, E.J.; Fujita, K.; Geertsema, M.; Miles, E.S.; Steiner, J. Geomorphic and geologic controls of geohazards induced by Nepal’s 2015 Gorkha earthquake. Science 2016, 351, aac8353. [Google Scholar] [CrossRef] [PubMed]
- Xu, J.; Grumbine, R.E.; Shrestha, A.; Eriksson, M.; Yang, X.; Wang, Y.U.N.; Wilkes, A. The melting himalayas: Cascading effects of climate change on water, biodiversity, and livelihoods. Conserv. Biol. 2009, 23, 520–530. [Google Scholar] [CrossRef] [PubMed]
- Fattet, M.; Fu, Y.; Ghestem, M.; Ma, W.; Foulonneau, M.; Nespoulous, J.; Le Bissonnais, Y.; Stokes, A. Effects of vegetation type on soil resistance to erosion: Relationship between aggregate stability and shear strength. CATENA 2011, 87, 60–69. [Google Scholar] [CrossRef]
- Carey, M.; Huggel, C.; Bury, J.; Portocarrero, C.; Haeberli, W. An integrated socio-environmental framework for glacier hazard management and climate change adaptation: Lessons from lake 513, cordillera blanca, Peru. Clim. Chang. 2012, 112, 733–767. [Google Scholar] [CrossRef]


| Lake | Lake Width at Calving Front (m) | Lake Max Depth (m) | Estimated Lake Depth (m) | Lake Area (m2) | Lake Volume (m3) |
|---|---|---|---|---|---|
| Thulagi | 265 | 76 | up to 40 | 0.90 × 10⁶ | 36.1 × 10⁶ |
| Imja | 695 | 150 | up to 110 | 1.28 × 10⁶ | 78.4 × 10⁶ |
| Lower Barun | 770 | 205 | up to 110 | 1.80 × 10⁶ | 112.3 × 10⁶ |
© 2018 by the authors. Licensee MDPI, Basel, Switzerland. This article is an open access article distributed under the terms and conditions of the Creative Commons Attribution (CC BY) license (http://creativecommons.org/licenses/by/4.0/).
Share and Cite
Haritashya, U.K.; Kargel, J.S.; Shugar, D.H.; Leonard, G.J.; Strattman, K.; Watson, C.S.; Shean, D.; Harrison, S.; Mandli, K.T.; Regmi, D. Evolution and Controls of Large Glacial Lakes in the Nepal Himalaya. Remote Sens. 2018, 10, 798. https://doi.org/10.3390/rs10050798
Haritashya UK, Kargel JS, Shugar DH, Leonard GJ, Strattman K, Watson CS, Shean D, Harrison S, Mandli KT, Regmi D. Evolution and Controls of Large Glacial Lakes in the Nepal Himalaya. Remote Sensing. 2018; 10(5):798. https://doi.org/10.3390/rs10050798
Chicago/Turabian StyleHaritashya, Umesh K., Jeffrey S. Kargel, Dan H. Shugar, Gregory J. Leonard, Katherine Strattman, C. Scott Watson, David Shean, Stephan Harrison, Kyle T. Mandli, and Dhananjay Regmi. 2018. "Evolution and Controls of Large Glacial Lakes in the Nepal Himalaya" Remote Sensing 10, no. 5: 798. https://doi.org/10.3390/rs10050798