1. Introduction
Current CO
2 emissions from the forestry sector are mainly due to deforestation in developing countries, exceeding 10% of total anthropogenic emissions, which is the major cause of climate change [
1]. In light of this, the REDD-plus (Reducing Emissions from Deforestation and forest Degradation, and the role of forest conservation, sustainable management of forests, and enhancement of forest carbon stocks) framework has been developed under the UN Framework Convention on Climate Change (UNFCCC) to reduce emissions in developing countries. The basic concept is to provide economic incentives to developing countries to support the implementation of REDD-plus activities. The UNFCCC requests that forest monitoring at a national level should follow the IPCC guidelines [
2] to quantify the changes in the amount of carbon stored in forests [
3]. At a national level, remote sensing and ground-based inventory can be combined to effectively determine carbon stock changes [
3]. According to the IPCC guidelines, emissions can be estimated by multiplying the area of land use change (activity data) by the corresponding change in carbon stock per unit area (emission factor). It is expected that the area of land use change is identified from remote sensing data and carbon stock per unit area is estimated from ground-based inventory data. However, a systematic field inventory program to obtain the emission factors is difficult to implement for developing countries because of limited resources and inaccessibility to forests. Accordingly, many developing countries have insufficient national forest inventory systems, and even if they do have these systems, their inventory data is often old or outdated. Due to the high cost of on-site monitoring at a national level, many countries have not developed the institutional capacity for field surveys [
4]. In addition, it is difficult to establish the expertise required to design field surveys needed for reliable data. Thus, these countries prefer to use an alternative method for obtaining the data required to estimate the forest carbon stock per unit area so that they can use this data to calculate emission factors under the REDD-plus framework.
Advanced remote sensing techniques can determine forest carbon stock per unit area. Overstory height is an important factor in obtaining these estimates because of the power-law relationship between the overstory height and biomass [
5,
6]. Moderate-spatial-resolution satellite imagery (e.g., Landsat) is useful to identify land use changes, but is insensitive to canopy height variation in forest stands [
7]. LiDAR (light detection and ranging) is a particularly useful alternative to field surveys because it provides detailed information on the three-dimensional structure of forests to estimate biomass rapidly and, in some cases, at low cost (comparing with field surveys such as national forest inventory). Therefore, forest carbon stock change can be estimated using the moderate-spatial-resolution satellite imagery for the acquisition of activity data and airborne LiDAR data to estimate emission factors [
8]. Saarela et al. [
9] showed model-based estimators for growing stock volume and its uncertainty estimation, combining sparse samples of field plots, samples of laser data, and wall-to-wall Landsat data for large-scale forest inventory development, and also indicated that they have a potential to contribute to the development of new techniques for surveys in large area. Ståhl at al. [
10] reviewed studies on large-area forest surveys based on model-assisted, model-based, and hybrid estimation using field inventory and remote sensing data, such as Landsat and airborne LiDAR, and pointed out that they have advantages and disadvantages. Therefore, which approach to choose depends on the purpose of the survey and the availability of appropriate data.
Previous studies of airborne LiDAR have been used in temperate and boreal forests to estimate stand attributes such as tree height [
11,
12,
13,
14], the number of stems [
13,
15], and the stand volume [
15,
16], as well as the attributes of individual trees [
17,
18,
19,
20,
21]. These studies have demonstrated the high potential of LiDAR in the forest monitoring. In recent years, researchers have begun to use LiDAR to estimate biomass and carbon density in tropical forests [
22,
23,
24,
25]. However, studies of LiDAR application in tropical forests to estimate biomass and carbon density are limited and the potential has not been appreciated over a wide range of forest types [
22].
Despite the high potential of LiDAR to estimate forest carbon stock per unit area, the cost can be an obstacle to the application to REDD-plus implementation on a large scale, such as at a national level. One of the most promising alternatives for the estimation of the emission factors at low cost is to use LiDAR sampling rather than comprehensive surveys [
26,
27], although sampling at a national scale in a large country can become costly. Multistage sampling using different instruments can reduce the cost needed to estimate emission factors; that is, high-cost LiDAR surveys can be used to accurately identify the characteristics of the specific forest type in surveys in small areas, and relatively low-cost satellite data can be used to expand them. For example, currently very-high-spatial-resolution (VHSR) satellite instruments, with a ground resolution finer than 1 m × 1 m, can be used for digital analysis of forest stand attributes, including aboveground biomass (AGB) [
28]. Access to the data from these satellites is still costly. In addition, some parts of the target area are affected by clouds. Because of this, the use of VHSR satellite sensors is not appropriate for mapping at the national scale. However, it is possible to use it in the limited area for the multistage sampling for the estimation of the emission factors. Hilker et al. [
29] indicated the potential of combining VHSR satellite imagery and LiDAR to update forest inventory data.
The VHSR of some sensors makes it possible to distinguish individual tree crowns, and the forest stand can be regarded as an aggregation of individual trees [
30,
31,
32,
33,
34]. In addition, VHSR satellite data has a wide dynamic range. With these advantages, stands with different forest types and canopy conditions can be distinguished. On the other hand, due to the irregularity of reflectance from the forest canopy, it is difficult to apply conventional pixel-based classification to the data [
35]. Couteron et al. [
36] indicated the possibility of obtaining texture features from VHSR images and the capability of the Fourier-based textural ordination (FOTO) method to quantify them. Bastin et al. [
37] showed the availability of canopy texture by harmonizing FOTO indices of images acquired from two different VHSR sensors with different sun-scene-sensor geometries. In addition, the development of object-based image classification based on artificial neural networks, fuzzy sets, genetic algorithms, and support vector machines can improve the representation of complex environments [
30]. The object-based approach is advantageous for changing scales [
38], which makes it possible to develop classification strategies that use the spatial relationships between objects in addition to spectral information [
39]. A method to estimate AGB from the delineation of individual crowns using this approach for VHSR image was developed [
40]. The object-based approach can be also applied to LiDAR data for the classification. In the previous studies, the object-based approach was used for land cover classification using LiDAR data [
41] and for forest species classification using a combination of VHSR satellite images and LiDAR data [
42].
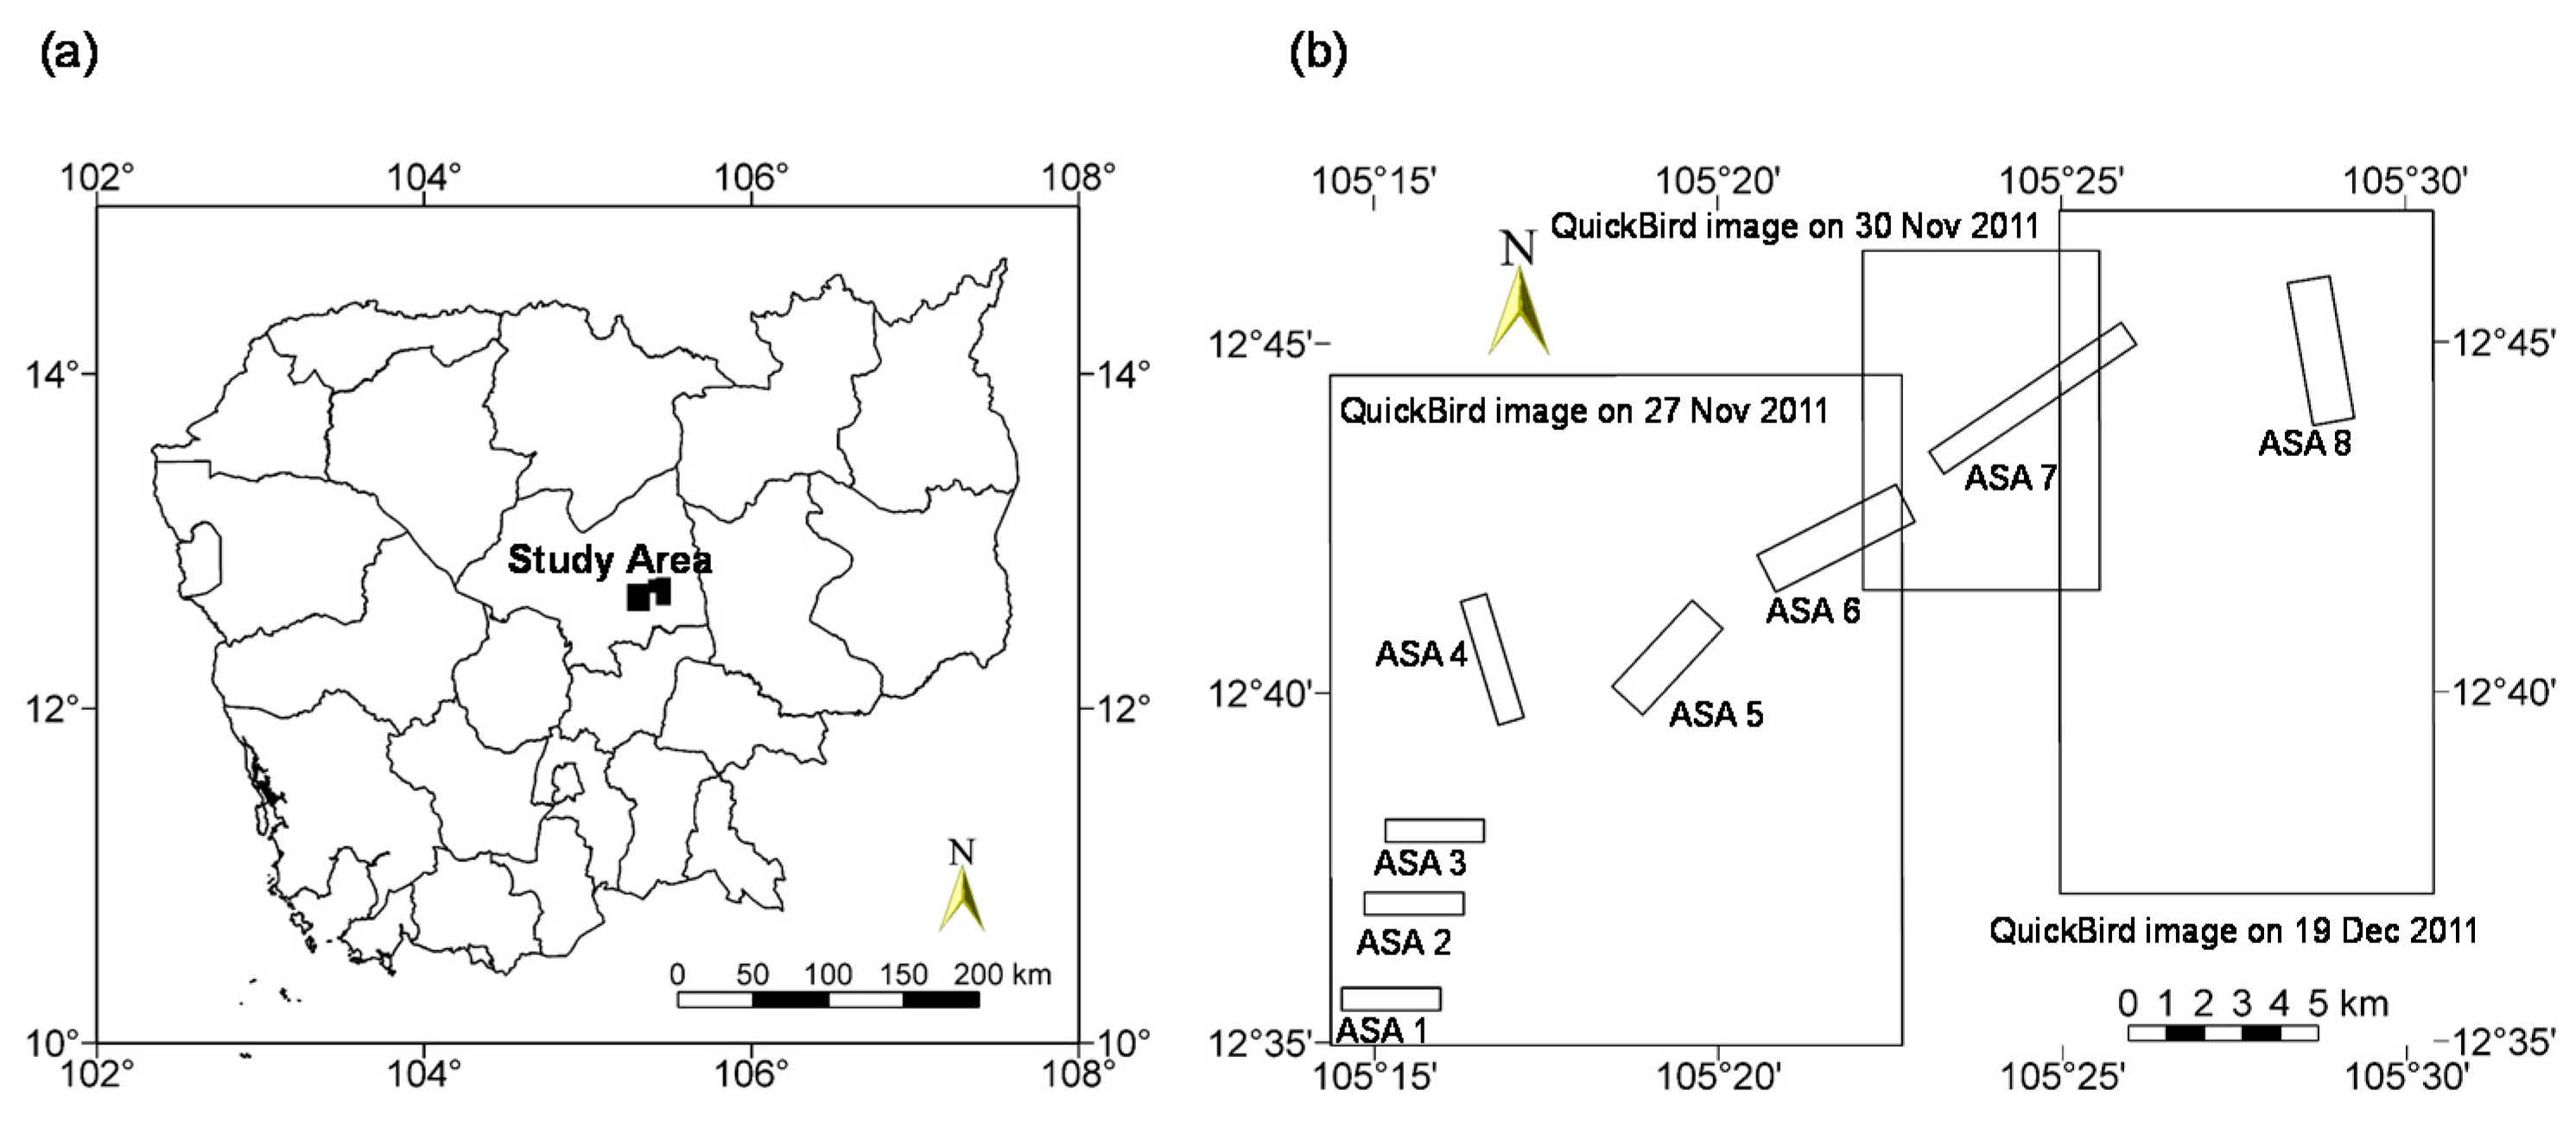
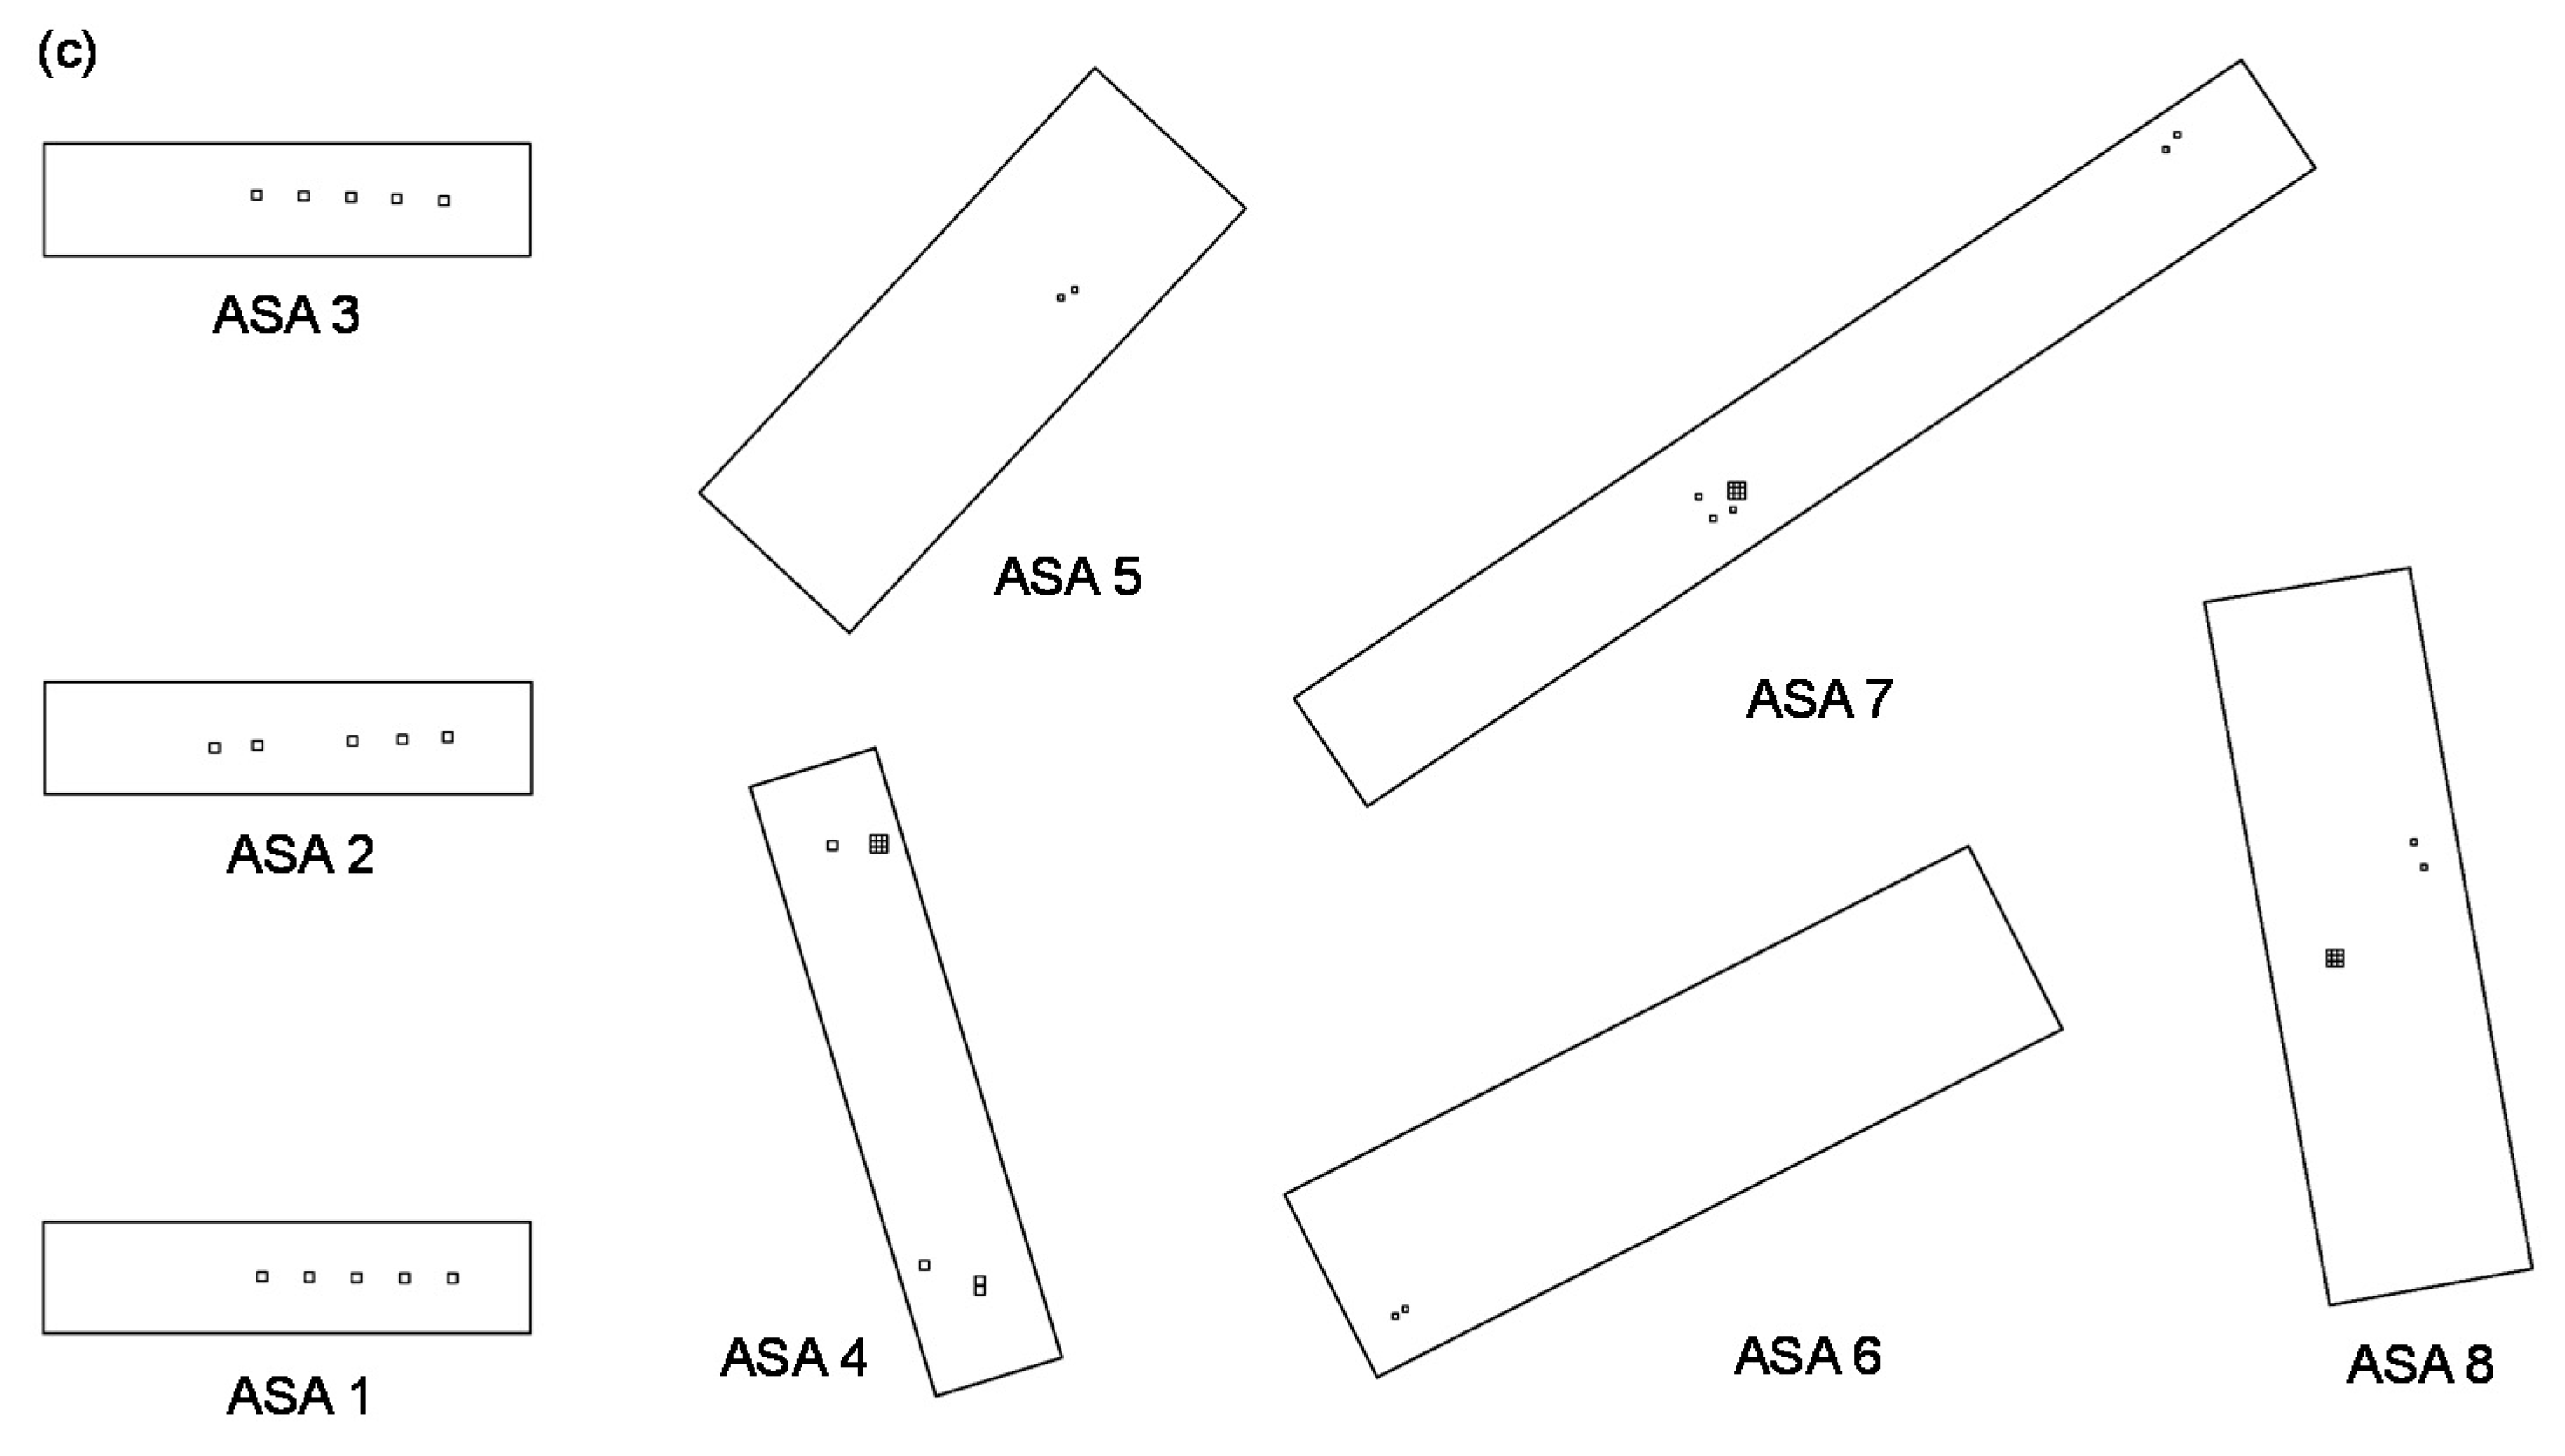
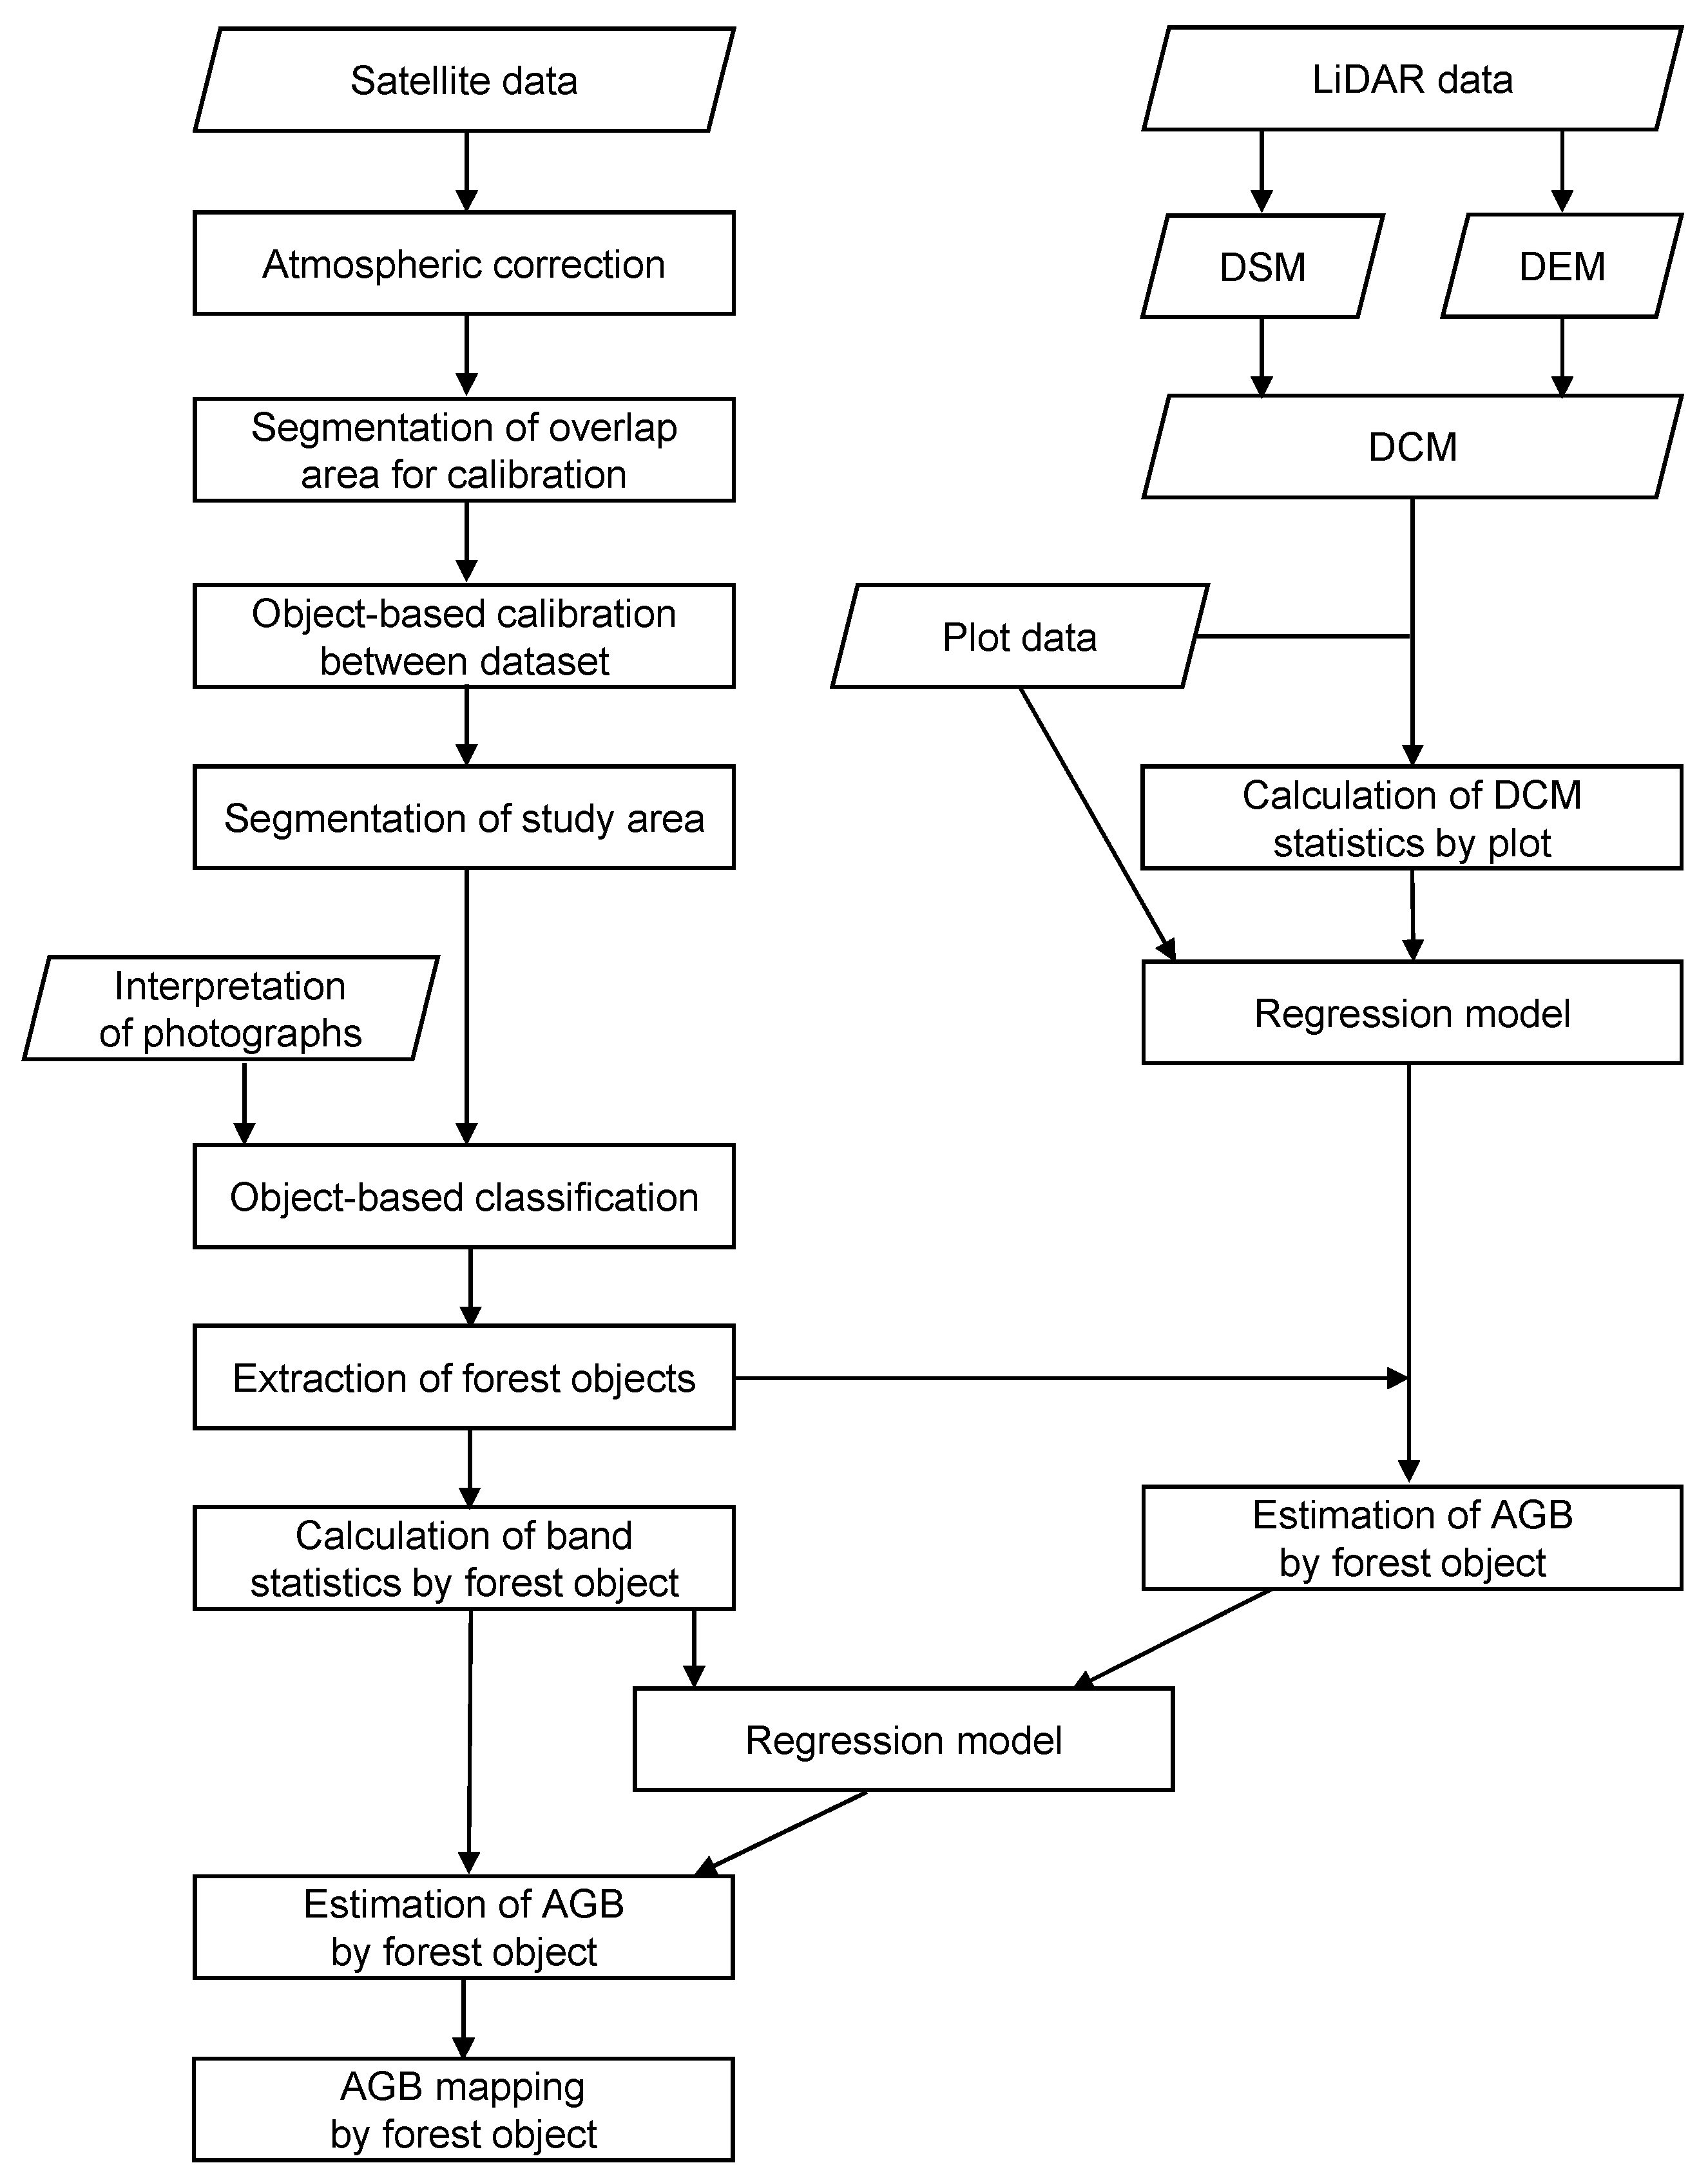
In this study, we aim to develop a method of estimating AGB in seasonal tropical forests by combining airborne LiDAR data with VHSR satellite data to obtain sampling data of forest carbon stock per unit area as the emission factor at a national level. This method can be used as an alternative of comprehensive field surveys to establish timely and reliable national forest inventory data. We used a two-step method: first, we studied the relationship between field-surveyed AGB and AGB predicted by the model derived from LiDAR data. Second, we created a multiple-regression model using AGB predicted by the LiDAR-based model as a dependent variable and the mean and standard deviation of the reflectance values of each band of the satellite data as the explanatory variables. This combination of methods is practical, as the cost of field survey is high and the cost of LiDAR survey is also relatively high. Thus, researchers and resource managers with limited budgets can estimate changes in the forest carbon stock per unit area as an emission factor based on the IPCC method by reducing the cost for forest inventory at a national level and compensating the lack of expertise necessary for large-scale surveys.
4. Discussion
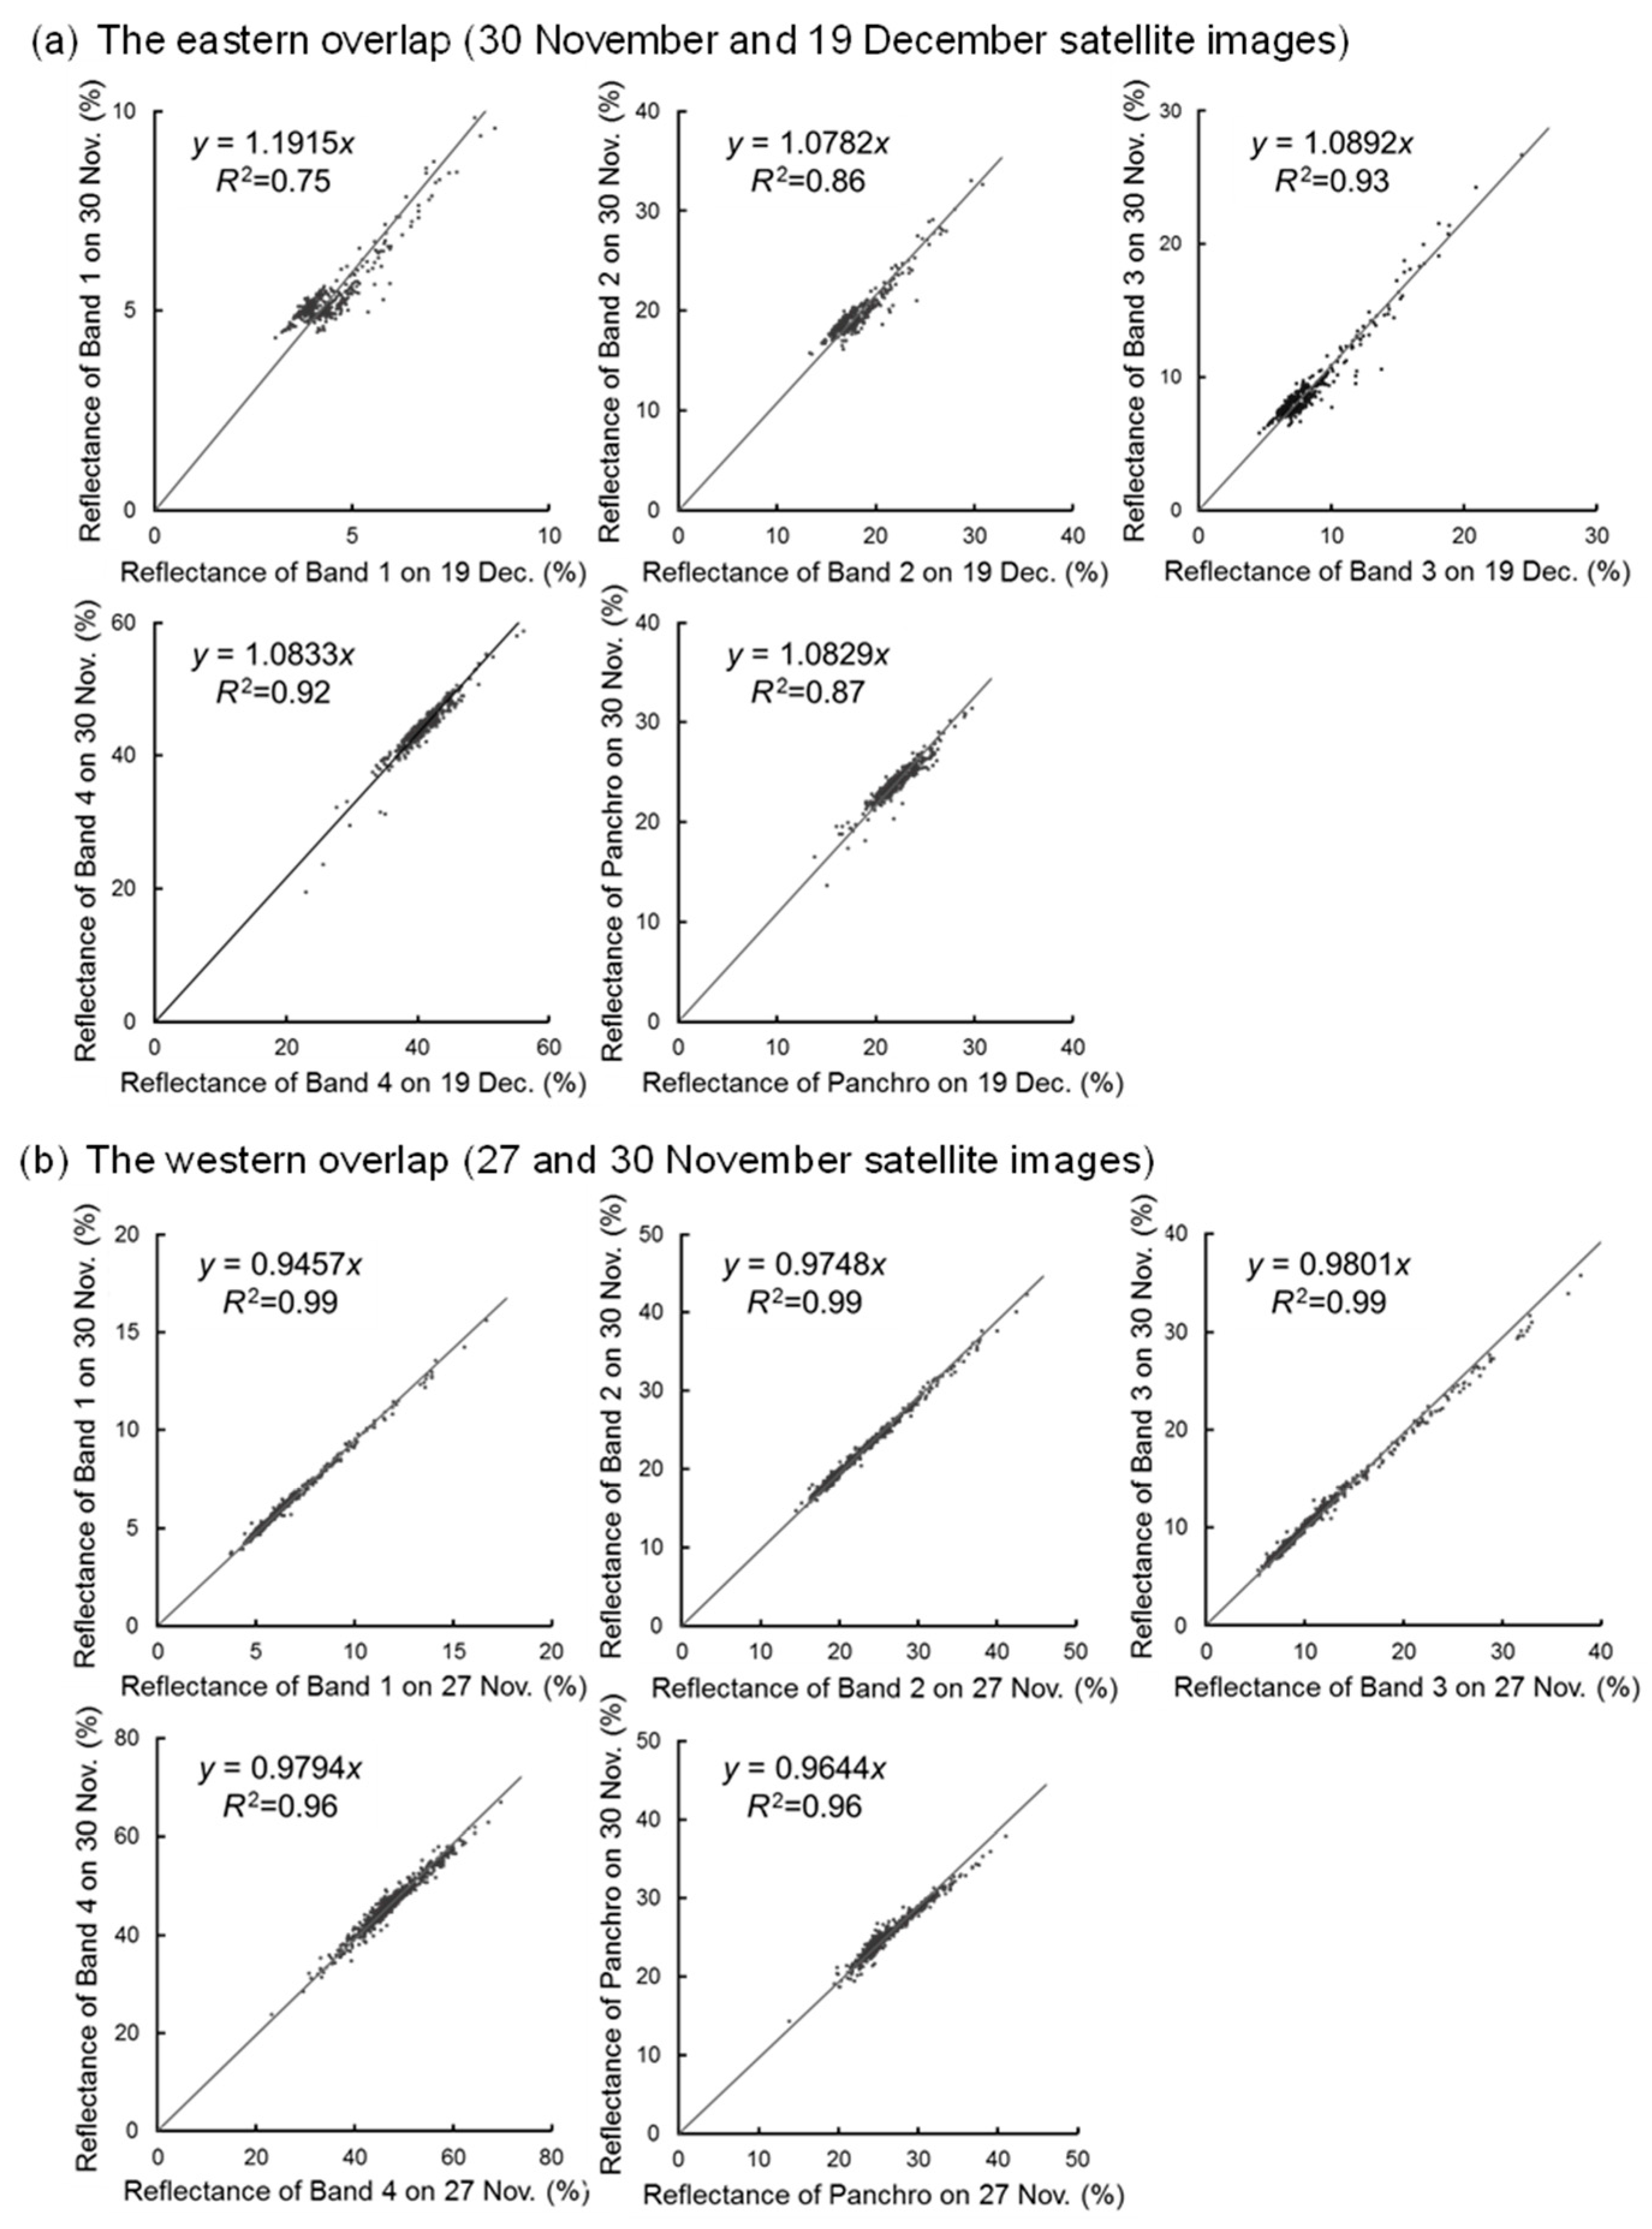
In this study, we assessed the viability of the two-step method for estimating AGB in tropical forests using LiDAR data and VHSR satellite data as the emission factor based on the IPCC method. When systematically obtaining such data from multistage sampling at a national level, the sampling rate must be taken into account, as the data depends largely on environmental and forest conditions. Multiple satellite images are occasionally needed to cover the area of interest for the mosaic processing to avoid the cloud problem or the east–west width of about 10 km covered by the satellite during each orbit. In this study, we used three satellite images that were acquired on close days, but not the same day. However, such images are not always available. When multiple satellite images are used, it is necessary to take account of the influences of the season and solar elevation, the difference in observation angles, and change in land use that occurred during the interval between images. The calibration method proposed in this study is not applicable when the images are acquired in different seasons or when there is a rapid change in land use. Changes in reflectance values caused by the seasonal influence in Landsat data were identified from the data with high temporal resolution such as MODIS [
61,
62]. In future research, it is necessary to confirm the applicability of the methods to the VHSR satellite images. Methods of detecting the change in land use were developed using time-series data from satellites such as Landsat in the previous studies [
63,
64,
65]. Occurrences of land cover change need to be confirmed using such methods when multiple satellite images are used. There is the same problem in acquiring of LiDAR data. In the seasonal forest, the condition of the canopy changes in the dry season. Some cell values of the LiDAR-based DCM in the deciduous forest can be underestimated due to fallen leaves. The laser pulses return back only from the branches of the canopy. The tendency of this underestimate becomes stronger when the small size of cell is used for the DCM. Therefore, the beginning of the dry season is the best timing to acquire the LiDAR data in tropical seasonal forests, as leaves still remain in the trees. It is also necessary to consider the influences of changes in land use that occur in the interval between the image and the acquisition days of LiDAR.
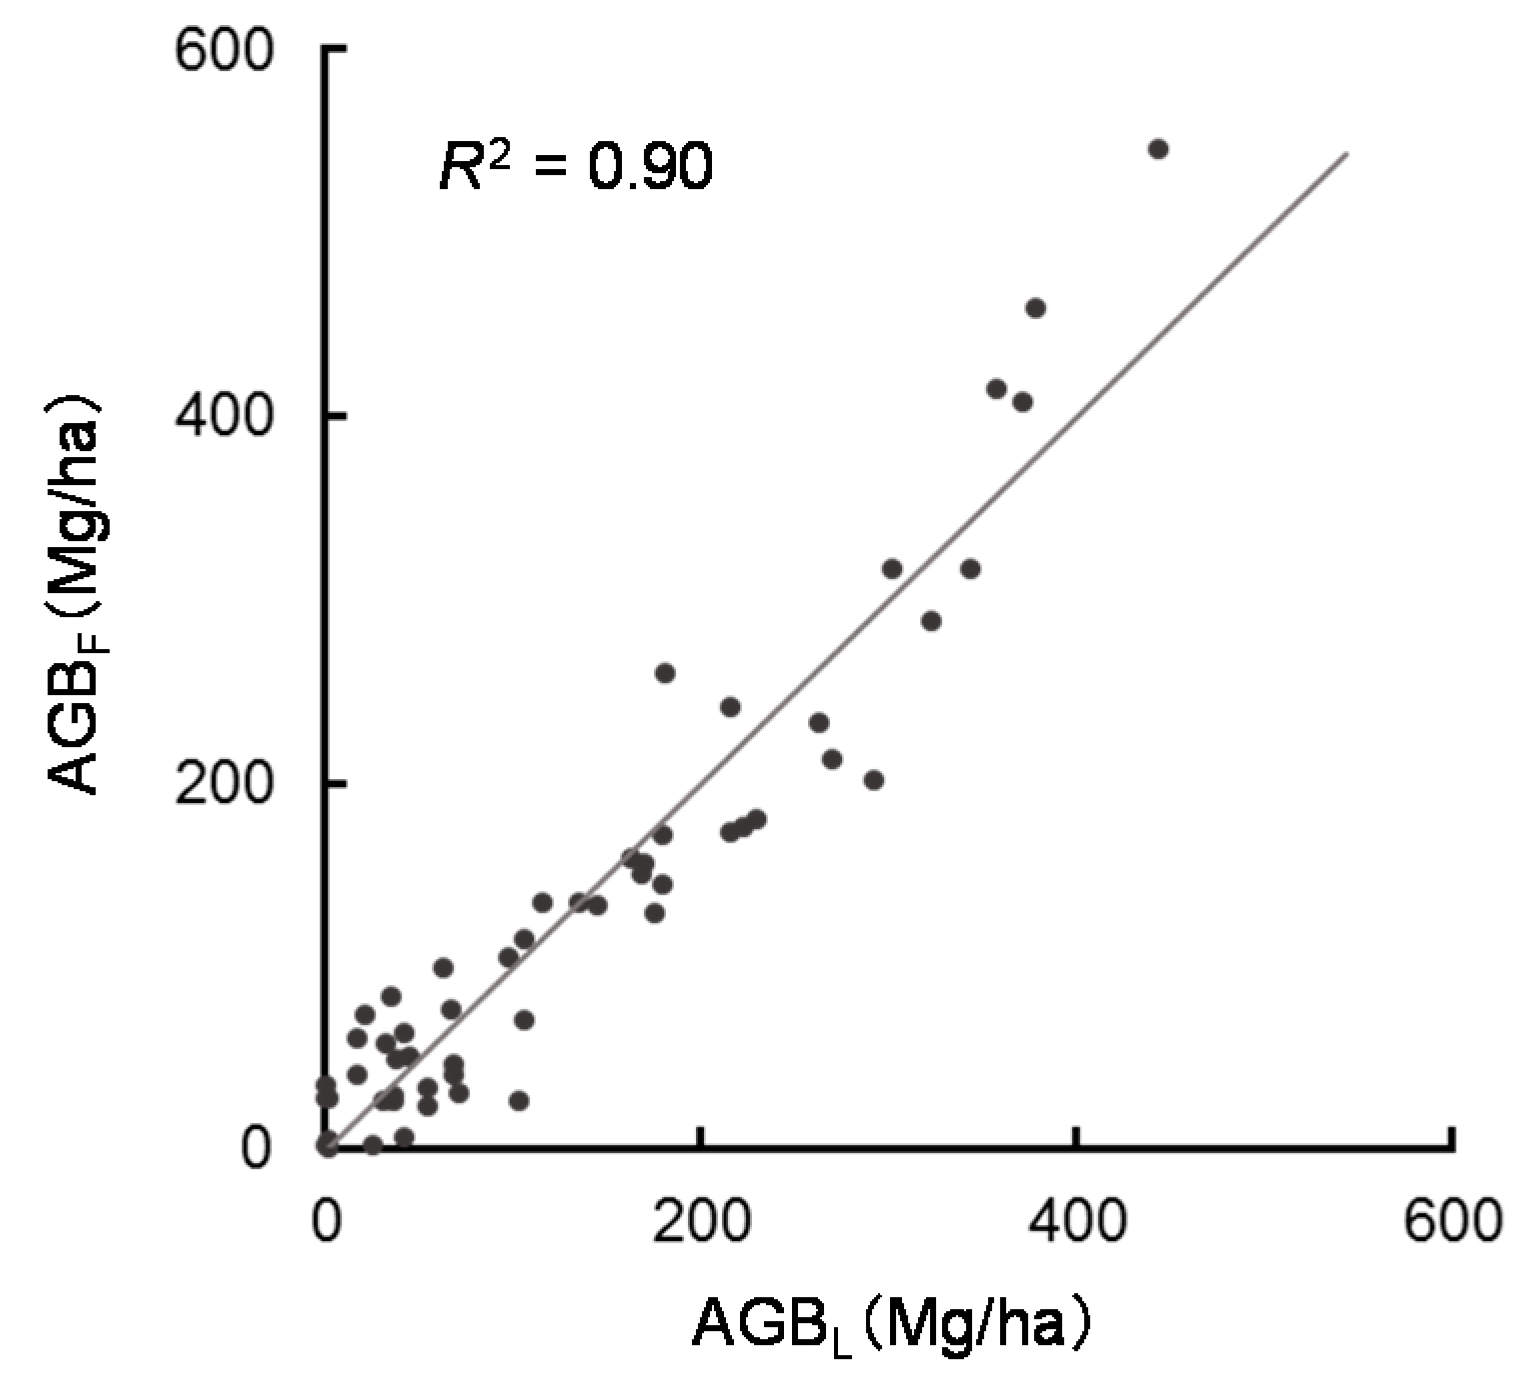
Point-cloud data or percentiles from LiDAR data have often been used to estimate AGB [
24,
66], but we used DCM in the raster format. There was little difference between the DCM obtained from the raster format and that obtained from the point-cloud data. Ota et al. [
25] developed a model to estimate aboveground carbon using point-cloud data in the same study area and the same LiDAR data, and showed that
R2 was 0.92. The RMSE was slightly smaller than that of the model in this study. As a result, by simplifying using the DCM with 1 m cell size in place of the original point cloud data, the decrease in accuracy was small, so it is applicable to estimating forest carbon stock per unit area as an emission factor. In the tropics, with LiDAR, RMSEs ranging from 17 to 40 Mg/ha in forest carbon estimation or 10% of total carbon stock are reported [
67]. Biomass is about twice as much as forest carbon stock. According to the analysis, AGB can be predicted with reasonable accuracy using the variables derived from LiDAR. Raster data has an advantage of estimating AGB in multistage sampling at a national level for REDD-plus implementation, because it is easier to process raster data than point-cloud data. However, the estimation accuracy depends on the cell size in the DCM, which in turn depends on the laser pulse density. When forests degrade due to the selective logging of large trees and other processes, the AGB will decrease and the gaps in the forest canopy will increase. In that case, the minimum DCM takes a small value when the value of the laser pulse density is larger than the reciprocal of the area of each gap, and the AGB of degraded forest is correctly estimated from the model. If the laser pulse density is lower than the above value, some gaps cannot be identified from the DCM and the AGB can be overestimated from the model. Optimal point density in the LiDAR measurement of various forest types and conditions need to be studied in future research.
In this study, we used the DCM in raster format, and the value of each cell showed the highest value in the cell. Therefore, we also needed to take account of the cell size when we used the raster data. When part of the crown is included in a given cell around the rim of a gap, that cell takes the value of the crown height even if the ground occupies most of the cell. Since the frequency of such cells increases when the cell size is large, some gaps cannot be identified in the DCM and the estimates of the mean and minimum DCM increase. However, the number of such cells is usually very small compared to the total number of cells. Therefore, the influence of cell size of the model is considered to be relatively small. As the DCM represents only the canopy surface, information from understorey strata is lost. Thus, it is a concern that this will lead to underestimation of the AGB, because it is not enough to estimate the AGB of standing trees in the understorey strata. However, the RMSE of our model was almost the same as that of the model developed using point-cloud data. It is suggested that standing trees in the understorey strata account for a small ratio in AGB. It should also be noted that information on the understorey strata obtained from point-cloud data is limited when the canopy layer is closed.
When developing a model to estimate AGB in tropical forests, it is necessary to consider the problem of the plot size. In LiDAR measurement, we retrieved the three-dimensional structure of the canopy and estimated AGB mainly from the canopy height. Generally, a part of crown of the tree which stands outside of the plot is included in the plot, and that of the tree which stands inside of the plot sometimes exists outside of the plot. This leads to overestimation or underestimation of the AGB. In addition, problems can arise from the combination of small plots with imperfect positioning with a low-end GPS device. When plot size is small, the influence is large. Establishing large plots can reduce the influence, but it is difficult to establish the required number of plots for developing the model with accurate differential positioning, particularly in tropical forests.
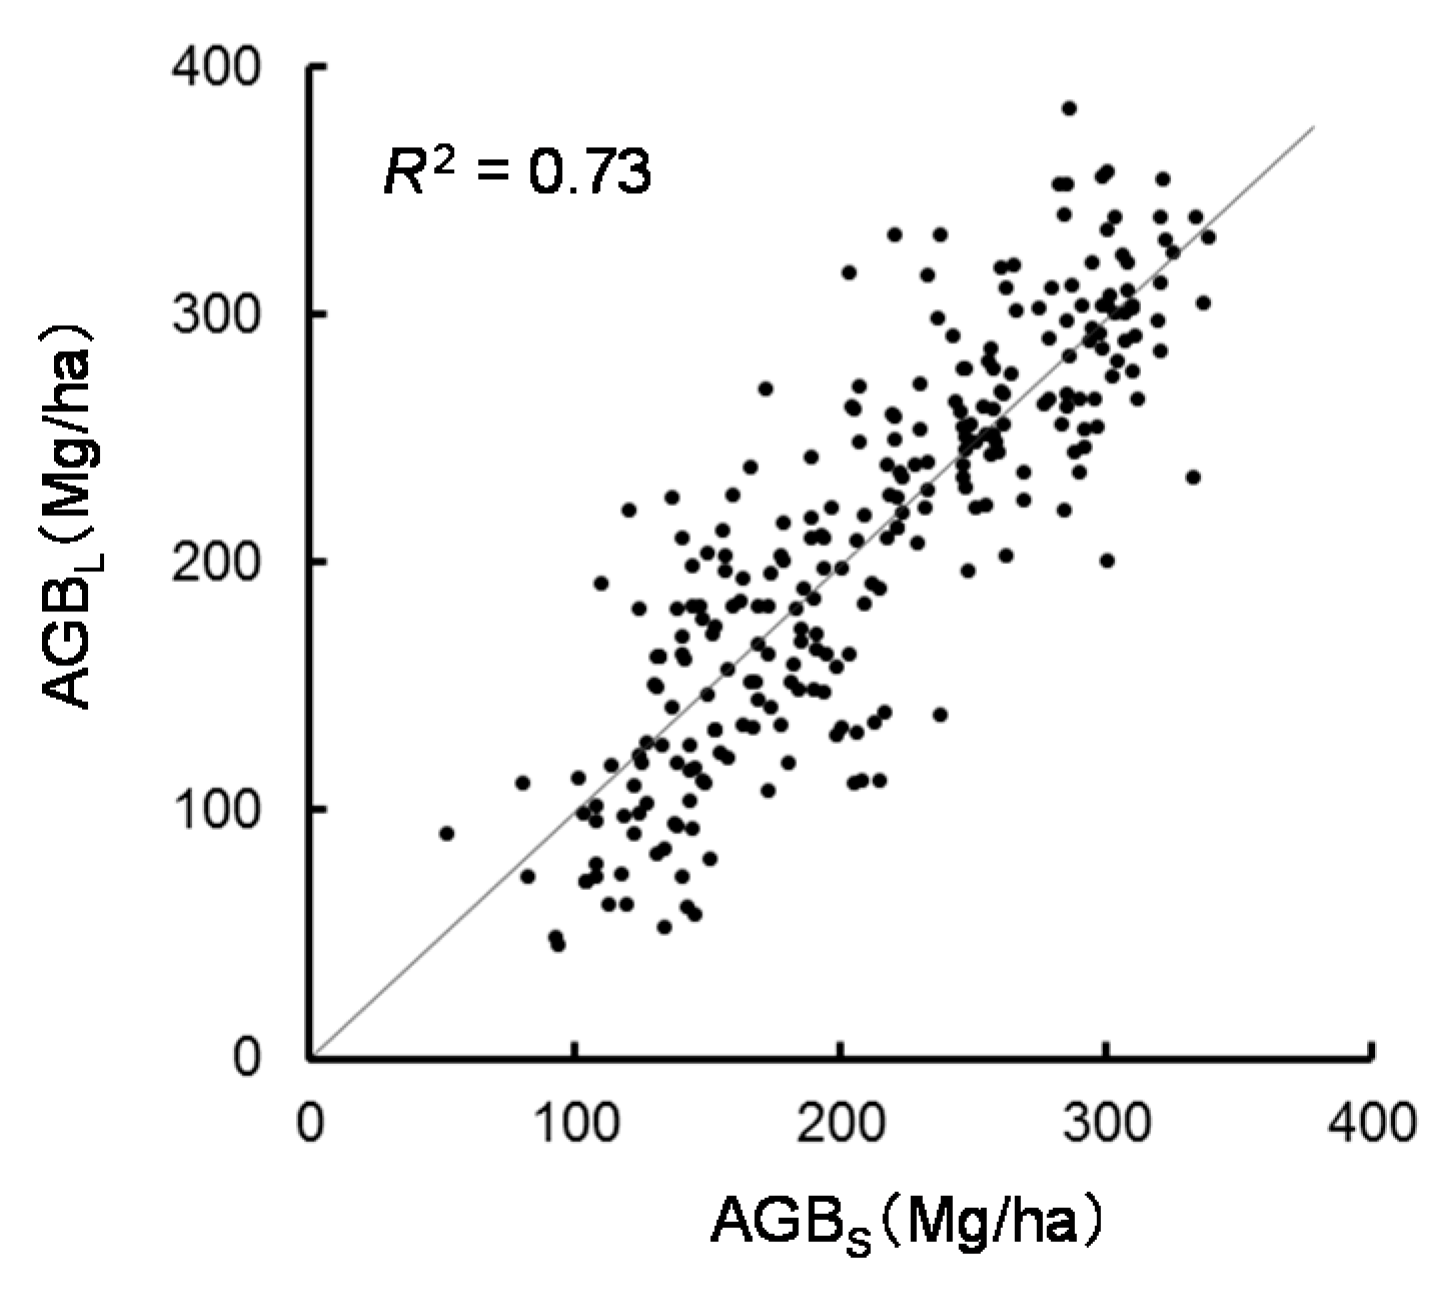
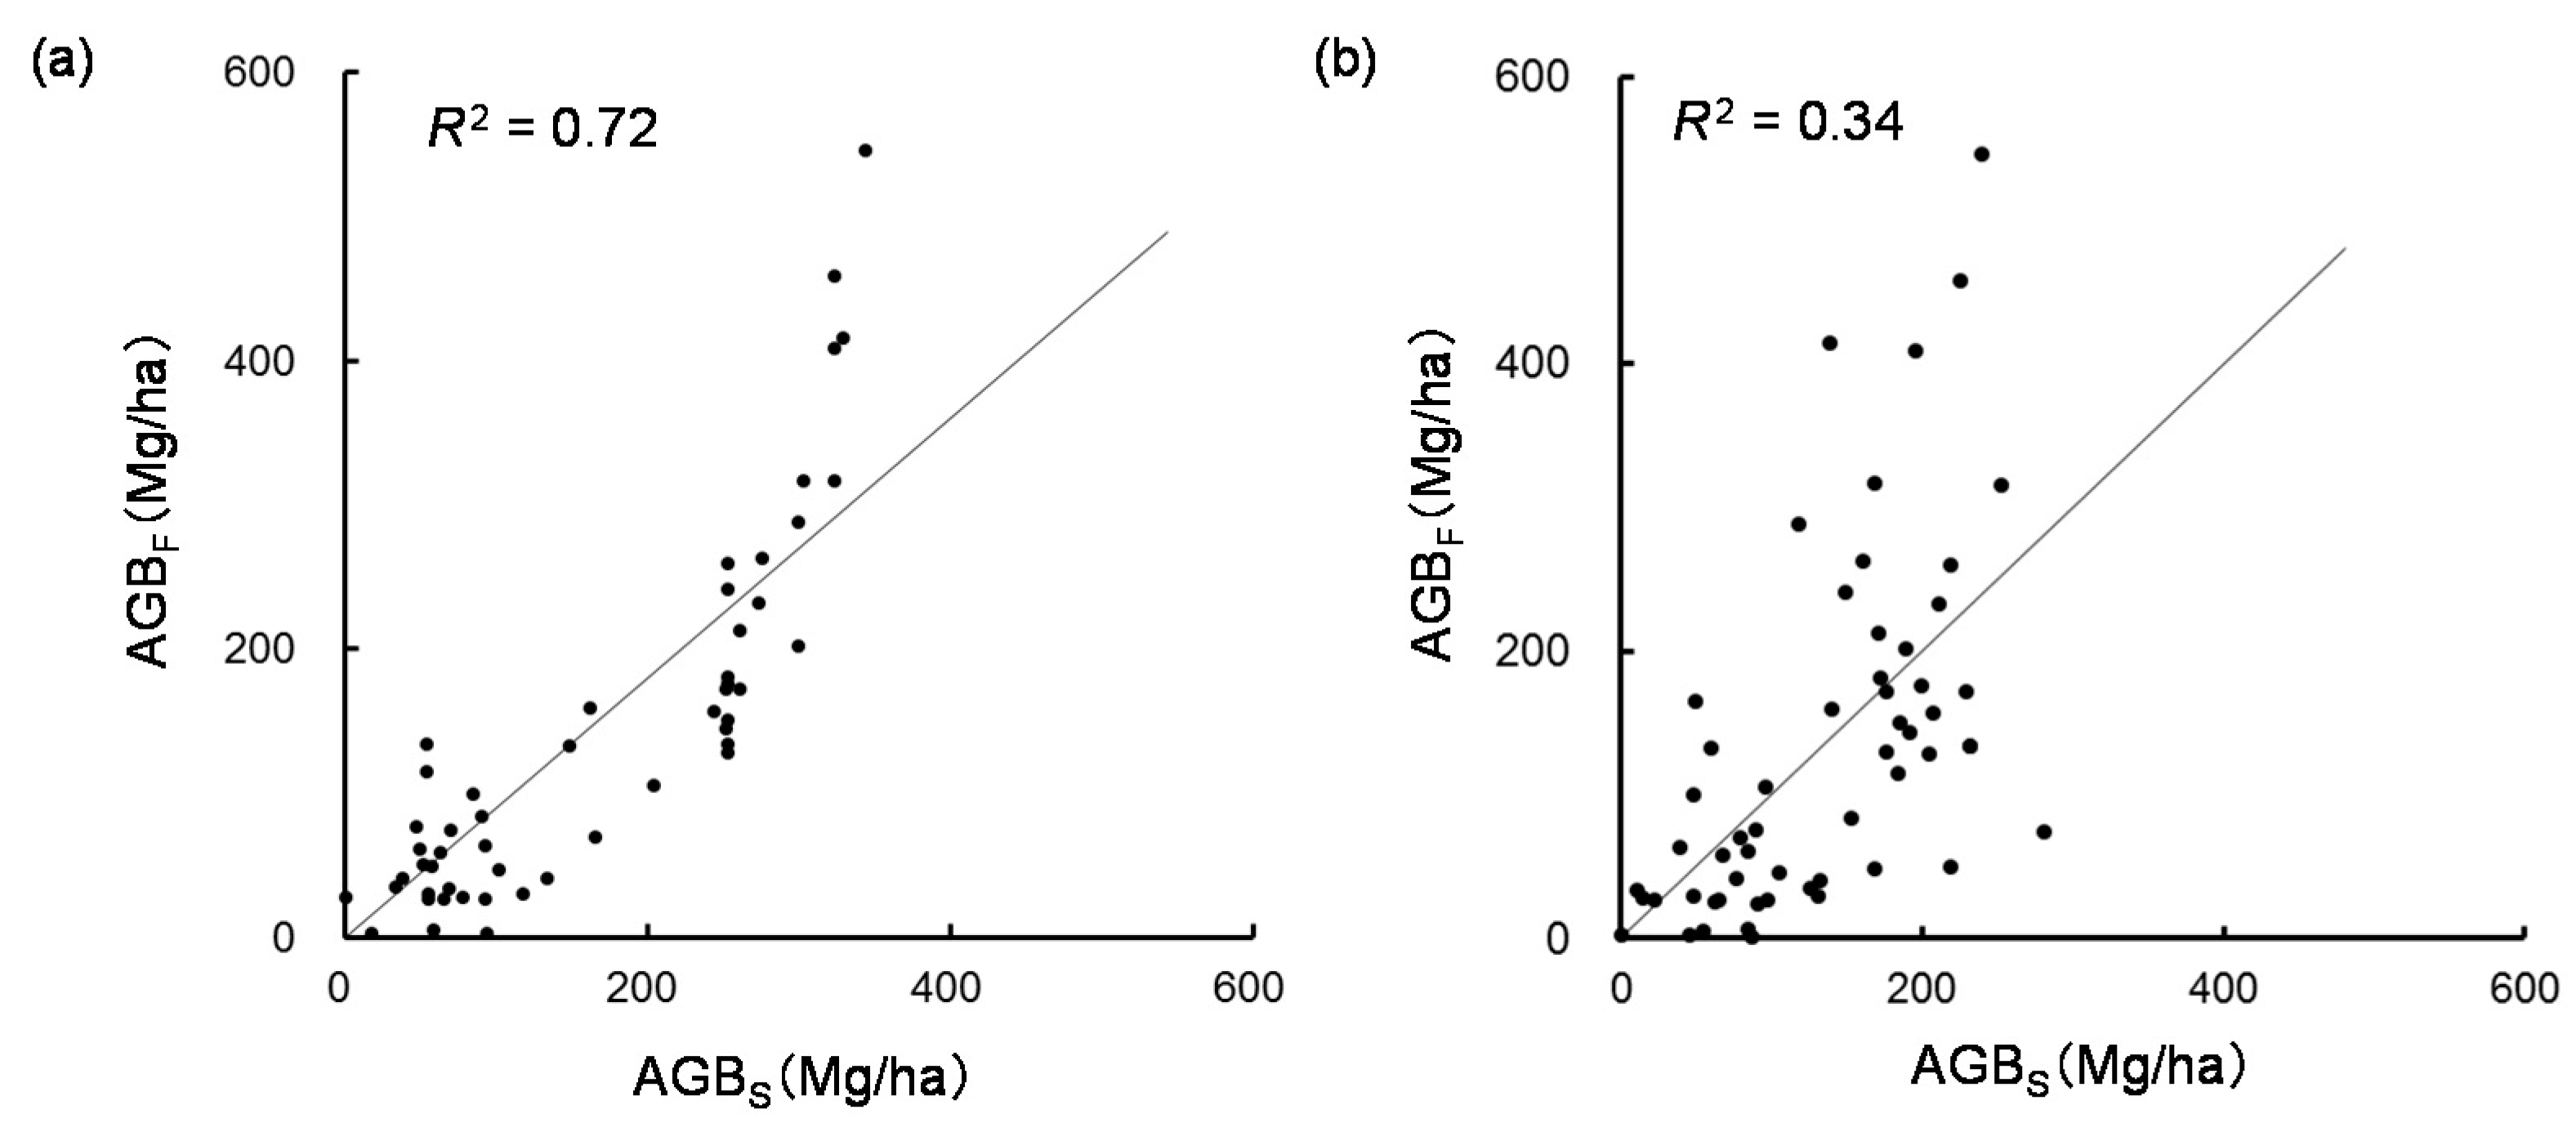
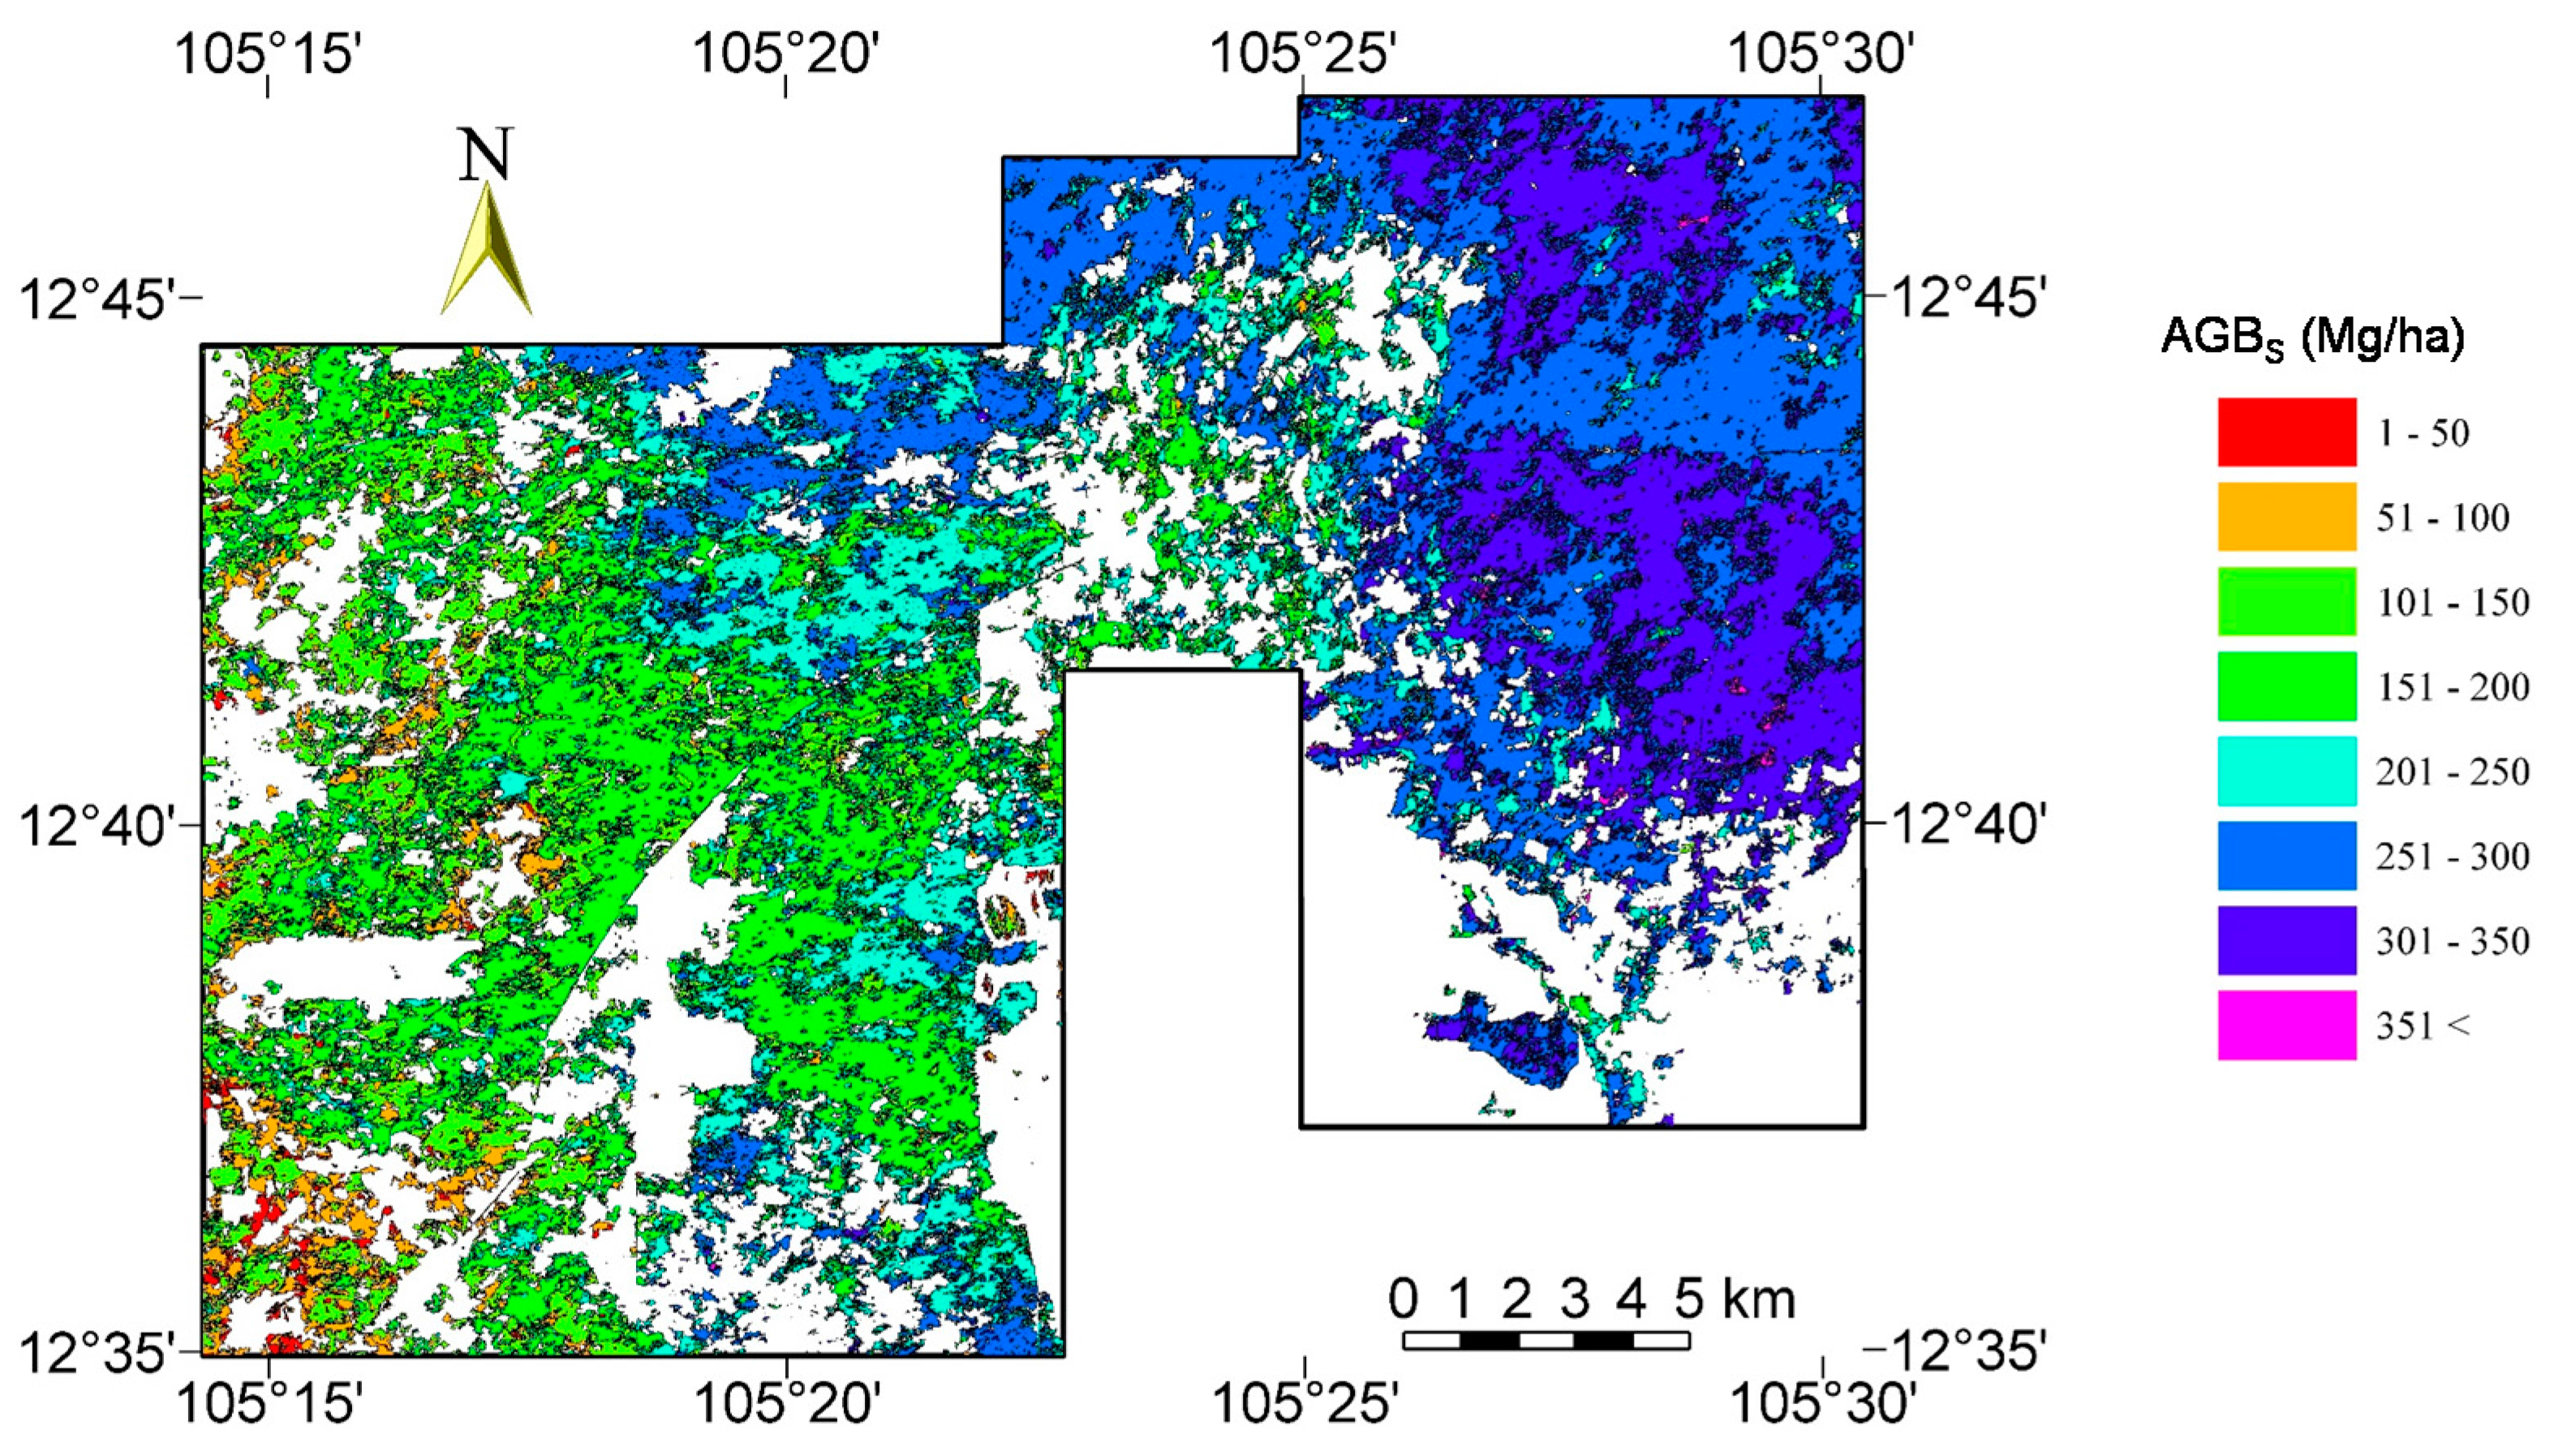
We showed that the satellite-based model for the AGB estimation using the two-step method was superior to that using the direct method, when compared the RSMEs. However, the saturation of the AGB values of about 330 Mg/ha in the two-step method and about 200 Mg/ha in the direct method occurred. In general, the optical satellite sensor observes the canopy surface of forest areas. Therefore, it is thought that the difference in individual tree sizes becomes unclear when the forest canopy is closed.
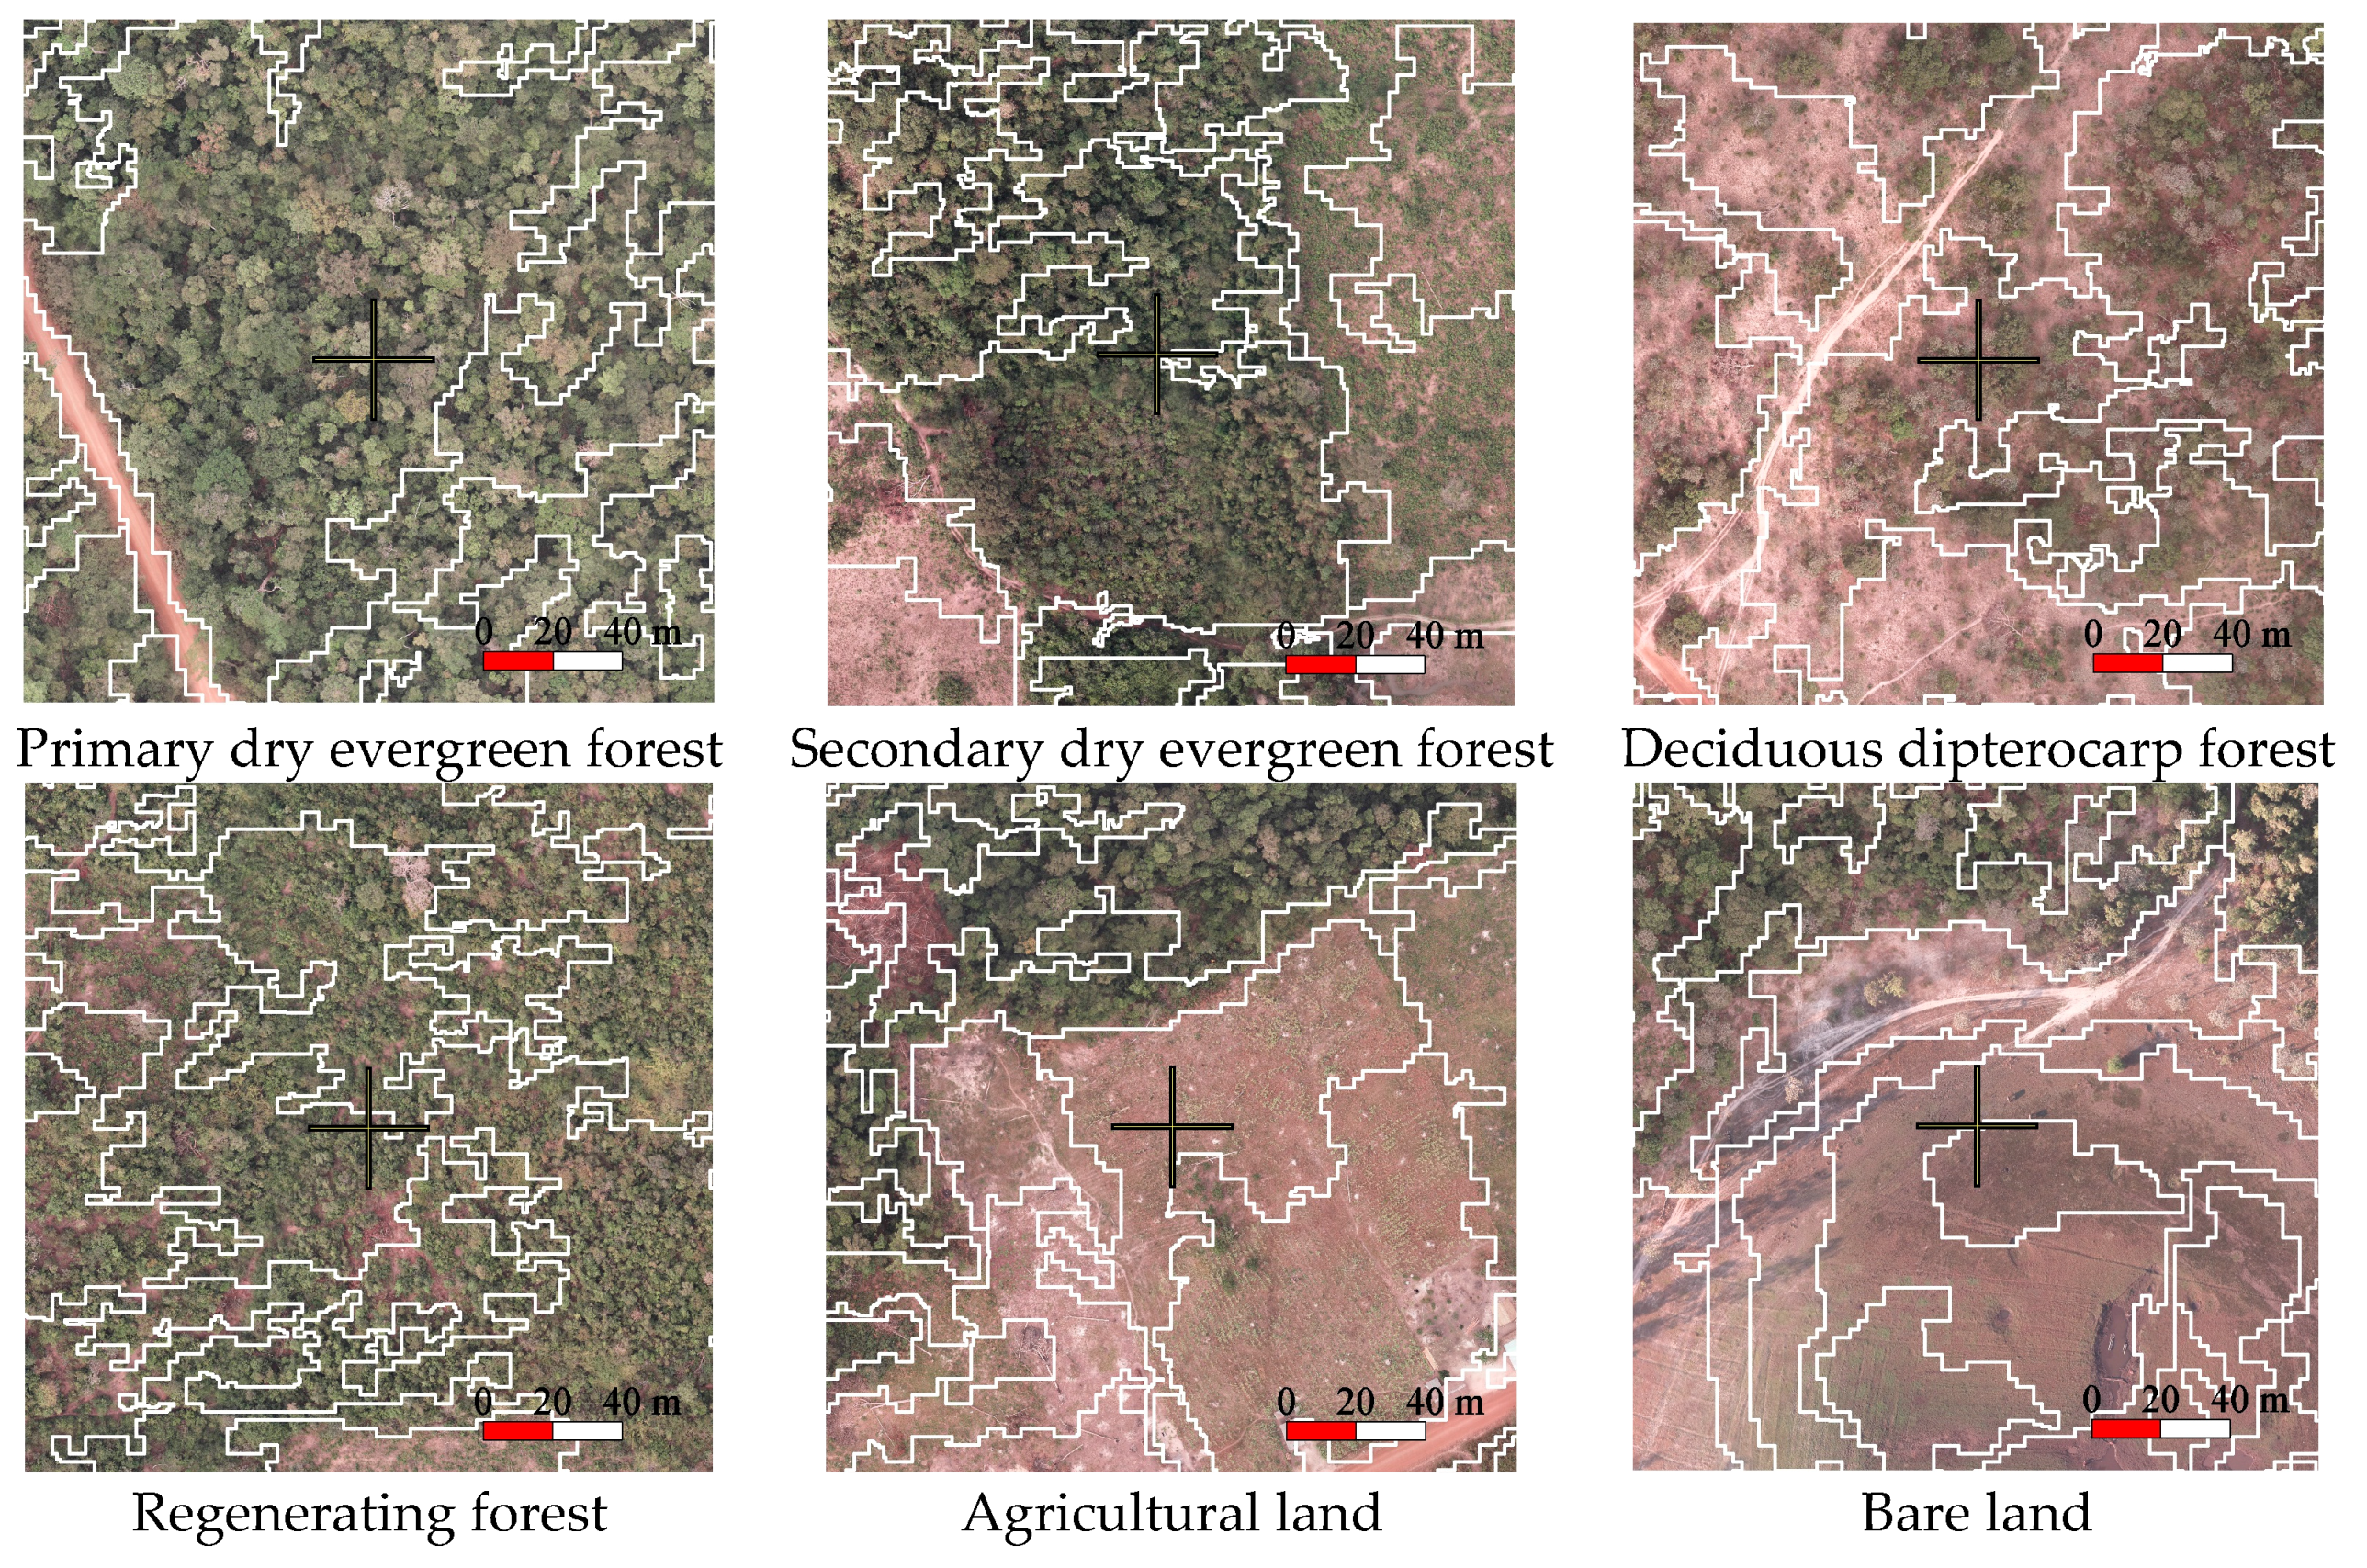
AGB maps produced using the method in the present study provide a clear picture of forest conditions at a local level. Object-based classification facilitates the creation of such maps using geographic information system software, and the data directly supports the planning of forest management activities. The object-based approach is used in the expectation that it will divide the image into relatively uniform and thematically significant groups of pixels [
30]. In recent years, an automated parameterization method for multi-scale image segmentation on multiple layers has been developed [
68]. Advances in object-based approaches have potential to expand the use of VHSR satellite images for land cover classification. On the other hand, the problem of the land use not being the same as the land cover means it is difficult to apply fully automatic method in the object-based approach. In addition, the minimum mapping unit differs greatly from the area used to define a patch of forest in many developing countries. Due to the difference between the two scales, it is difficult to distinguish forest degradation from land cover change cutting the small area of the forests [
69]. In particular, the land use pattern around residential areas is complicated, and two land cover classes are frequently mixed. For example, when crops are cultivated in an open forest, the land use is considered to agriculture. However, satellite sensors simultaneously observe a mixture of reflectance from tree crowns, crops, and soil, which causes misclassification. It should be noted that such misclassification often occurs in highly populated areas.


