1. Introduction
Passive microwave remote sensing is an important tool for studying atmospheric and oceanographic processes, and it can provide both daytime and nighttime observations of geophysical parameters such as atmospheric water vapor, cloud liquid water, rain rate, sea surface temperature, surface wind speed, and sea surface salinity. These satellite measurements offer a much larger area of observation than in situ measurements. This tool can provide scientists and forecasters with vital information for understanding and studying global weather and climate change. Microwave radiometers have long been used to measure ocean surface winds [
1,
2,
3,
4,
5,
6,
7,
8,
9,
10,
11,
12,
13,
14,
15,
16,
17]. The first Special Sensor Microwave Imager (SSM/I) onboard Defense Meteorological Satellite Program (DMSP) was launched in July 1987, making it possible to estimate global ocean surface winds from a spaceborne passive microwave instrument. Since then, a successive dataset of wind speed measurements has been obtained from different spaceborne microwave radiometers, which has been used as an important input for numerical weather forecasting and certain ocean circulation models [
18,
19]. In addition, ocean surface winds have been used to study climate and air–sea interactions. Therefore, accurate estimation of ocean surface winds is important in such applications.
At present, spaceborne passive microwave instruments are mainly operating in sun-synchronous orbits to measure ocean surface winds. The currently operating SSM/I instrument is SSM/I F15. The Special Sensor Microwave Imager/Sounder (SSMIS) is the successor to SSM/I, and the current operating instruments include SSMIS F16, SSMIS F17, and SSMIS F18. The Advanced Microwave Scanning Radiometer 2 (AMSR2) onboard the JAXA GCOM-W1 spacecraft was launched on 18 May 2012, and it is currently operating. WindSat is the first spaceborne passive polarimetric microwave radiometer, which can measure not only wind speed but also wind direction, and it is currently operating [
20]. Many wind speed products can be obtained from these satellites. Remote Sensing Systems (RSS) is a world leader in processing and analyzing microwave data, which provides wind speed products on a 0.25-degree grid. Daily, three-day, and monthly files can be obtained from RSS web site (
www.remss.com). An updated and comprehensive validation study of these products is necessary.
Buoy measurements have been extensively used to validate the accuracy of satellite wind speed products [
21,
22,
23,
24,
25,
26,
27]. Previous studies [
21,
23,
25] showed that the root-mean-square error (RMSE) is less than 2 m/s between the winds derived from spaceborne passive microwave radiometers and buoy observations. In this study, an updated and detailed comparison between ocean surface wind speeds retrieved from five different microwave radiometers and those observed by buoys is performed. In addition, we also compare these satellite wind speeds with the reanalysis data produced by the European Center for Medium-Range Weather Forecasts (ECMWF). Earlier studies have provided comparisons between ECMWF reanalysis data and satellite-derived winds from radiometers during the periods of 1988–1991 [
28], 1986–1992 [
29], 1987–1997 [
30], 2000–2001 [
31] and 1992–2002 [
32]. These studies are mostly based on SSM/I data. In this study, we focus on five different satellite radiometers: SSMIS F16, SSMIS F17, AMSR-E, AMSR2, and WindSat.
This paper is organized as follows.
Section 2 describes the methods and the selected datasets that include satellite winds, buoy measurements and ECMWF wind speed products. In
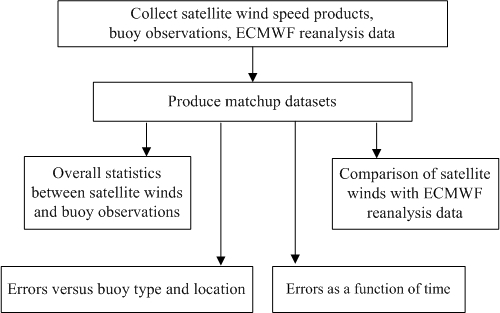
Section 3, we report detailed comparisons between satellite winds and buoy observations, including a detailed global statistical analysis. In addition, we also compare satellite winds with those derived from ECMWF reanalysis data, including seasonal wind speed difference over the global ocean and time series of specific latitude bands.
Section 4 shows a discussion. In
Section 5, we present a short summary and conclusions.
2. Materials and Methods
2.1. Materials
2.1.1. Satellite Data
The SSM/I and SSMIS sensors are operating on DMSP polar orbiters, which are part of the Department of Defense [
33]. The SSM/I is a seven-channel, linearly polarized, passive microwave radiometer that measures microwave energy at 19.35, 22.235, 37.0, and 85 GHz channels. The first SSM/I instrument onboard the DMSP F08 spacecraft was launched in July 1987. Since then, this instrument has been fitted to several satellites: F10 (November 1990), F11 (December 1991), F12 (August 1994), F13 (March 1995), F14 (April 1997) and F15 (January 2000). Up to now, SSM/I F15 continues to function in orbit. The SSMIS is the next generation of SSM/I. The first SSMIS instrument flew on the DMSP F16 in November 2005. Three subsequent SSMIS instruments (F17, F18, and F19) were successfully launched in 2006, 2009, and 2014, respectively. The SSMIS is also a linearly polarized passive microwave radiometer system, and it measures brightness temperatures at 24 discrete frequencies from 19 to 183 GHz. The SSMIS brightness temperatures have been carefully intercalibrated with the previous SSM/I data, and they extend the time series of geophysical parameters [
34]. A previous study showed that the performance of SSMIS F16 was similar to that of SSM/I F13, SSM/I F14, and SSM/I F15, and the standard deviation of wind speeds between SSMIS F16 and buoy observations ranges from 1.7 m/s to 1.9 m/s [
34].
The Advanced Microwave Scanning Radiometer has operated on three satellites: AMSR-J (December 2002), AMSR-E (May 2002), and AMSR2 (May 2012). The AMSR-J instrument stopped running in October 2003 because the solar panels ceased functioning. AMSR-E is a modified version of AMSR-J, and it is a twelve-channel, six-frequency, passive microwave radiometer system. AMSR-E can measure microwave energy at 6.9, 10.7, 18.7, 23.8, 36.5, and 89 GHz channels. The spatial resolution of the observations varies from 5.4 km to 56 km. In contrast to SSM/I or SSMIS instruments, sea surface temperature can be obtained from AMSR instruments because of the low-frequency channels (6.9 and 10.7 GHz). These low-frequency channels have an appreciable sensitivity to the sea surface temperature [
35]. The AMSR-E instrument stopped rotating on 4 October 2011. AMSR2 measures microwave energy at multiple frequencies, ranging from 6.9 GHz to 89 GHz. AMSR2 has continued the global observations performed by AMSR-E with high spatial resolution and is able to estimate a variety of geophysical parameters, particularly those involved in the water cycle [
36].
The WindSat onboard the Coriolis mission was launched on 6 January 2003, and its primary objective is to demonstrate the capabilities of a fully polarimetric radiometer to measure the ocean surface wind vector from space. WindSat is well calibrated and operates in 5 frequencies: 6.8, 10.7, 18.7, 23.8, and 37.0 GHz. Measurements at 10.7, 18.7, and 37.0 GHz channels are fully polarimetric, and they can be used to retrieve wind direction [
20]. Spatial resolution of the observations varies from 10 km to 50 km. More detailed information can be found at the NRL WindSat web site (
www.nrl.navy.mil/WindSat).
The selected satellite wind speed products in this study are produced by RSS using a unified, physically-based algorithm which is mainly based on the physical radiative transfer model described in [
8,
37,
38].
Table 1 shows the time periods of data analyzed in this paper.
2.1.2. Buoy Data
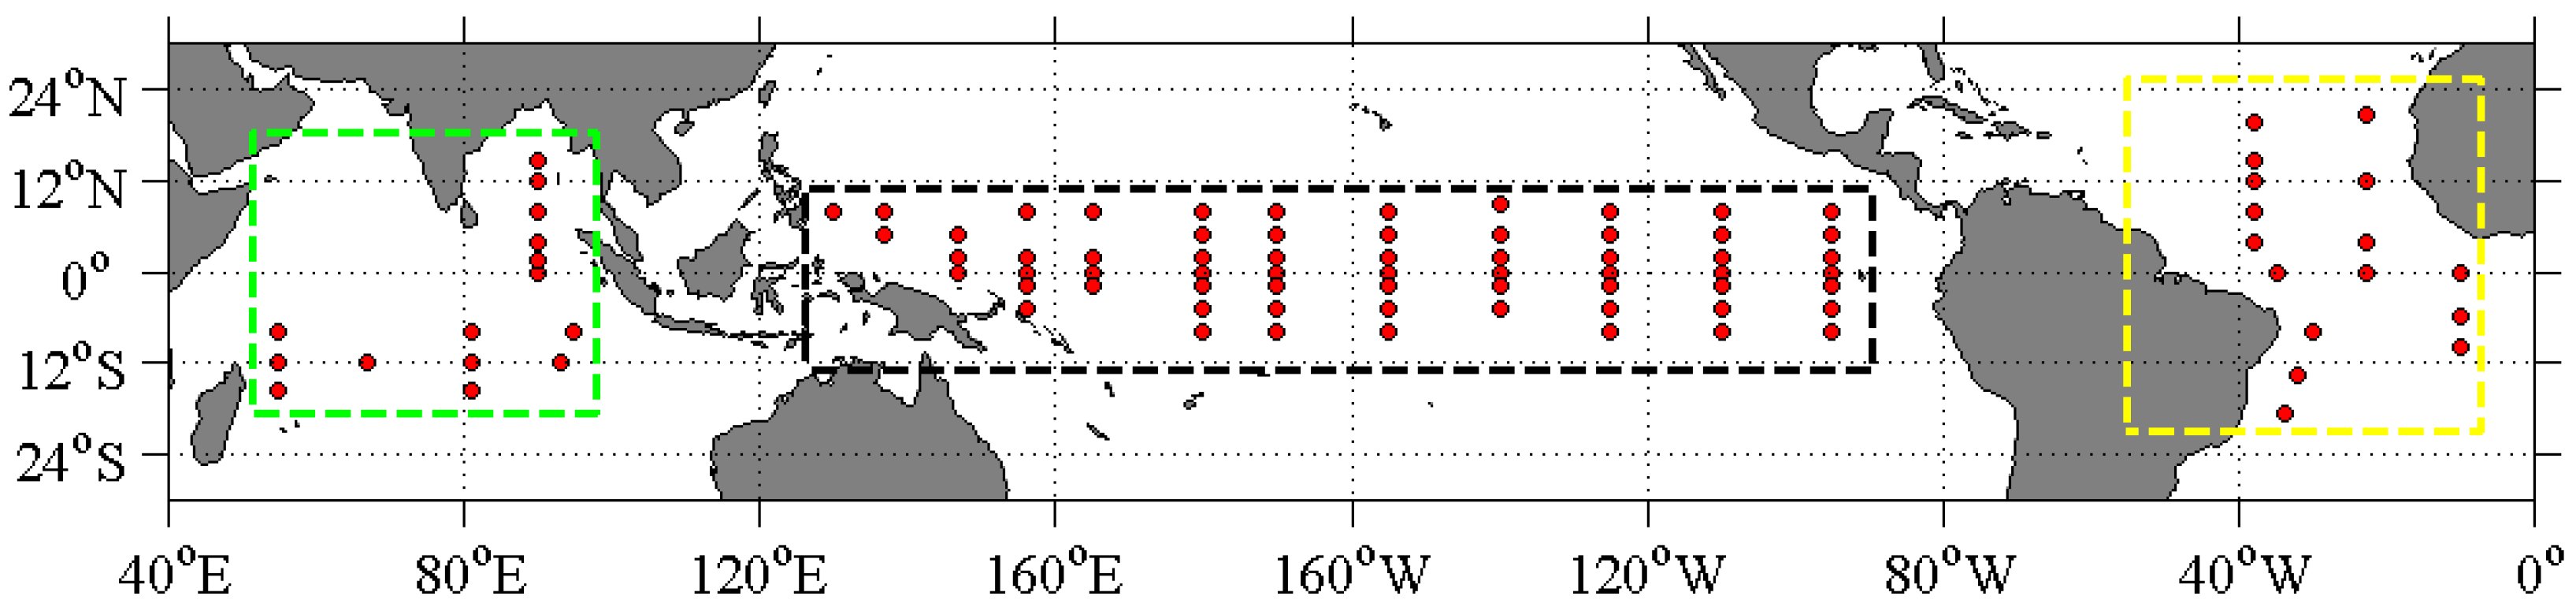
The selected buoy observations are available from the National Data Buoy Center (NDBC), which is made up of four sources: 63 are from the operational Tropical Atmosphere-Ocean (TAO) array of moored ocean buoys in the tropical Pacific Ocean; 16 buoys are operated by the Pilot Research Moored Array (PIRATA), which are located in the tropical Atlantic Ocean; and 15 buoys are operated by the Africa-Asian-Australian Monsoon Analysis and Prediction (RAMA) program, which are mainly located in the tropical Indian Ocean. The locations of 94 buoys are shown in
Figure 1. All of the buoys are located more than 100-km from the coast, and quality control is performed to reject the poor or low-quality measurements, which include checks for missing data, blank fields and out-of-bounds data. The selected buoy winds are measured at different heights. TAO buoys, PIRATA buoys, and RAMA buoys are sampled at 3.5-m or 4-m heights. A simple logarithmic correction method is used to calibrate the buoy measurements to a height of 10-m height [
21].
2.1.3. ECMWF Data
The selected ECMWF reanalysis data are available from the ERA-Interim project, which was conducted in part to prepare for a new and improved atmospheric reanalysis to replace ERA-40 [
39]. ERA-Interim is the latest ECMWF global atmospheric reanalysis of the period 1979 to the present. The reanalysis data are produced by a data assimilation system based on a 2006 version of the IFS (Cy31r2) that continues to be updated in real time. This assimilation system includes a four-dimensional variational analysis (4D-Var) with a 12-h analysis window. ECMWF assimilates some satellite measurements such as SSM/I, SSMIS, and AMSR-E observations. A detailed discussion of the ERA-Interim model and the assimilation system can be found in the IFS Cy31r1 documentation (
www.ecmwf.inf). Monthly means of daily means of wind speeds at 10-m height are obtained from ECMWF web site.
2.2. Methods
Satellite data products can be collected and downloaded from the RSS web site (
www.remss.com). RSS provides maps of ocean surface winds with the spatial resolution of 0.25°. Each valid satellite day contains two maps, which include the descending and ascending orbit segments. Note that the satellite data products are continually undergoing improvement. The selected version of WindSat data products is version 7.0.1, which is the latest version at present. RSS provides three kinds of WindSat wind speed products: low frequency (LF), medium frequency (MF), and all-weather products. In this study, only the WindSat MF product is used. AMSR-E (v7) and AMSR-2 (v8) data are now available, and we also use the MF products. In addition, the selected version of SSMIS data products is version 7 (v7).
To validate the accuracy of satellite-derived winds, satellite measurements and buoy observations are collocated using a 30-min temporal window and 20-km spatial window. No temporal or spatial interpolation is executed for the selected data. A relatively strict clear sky condition is adopted to reduce the influence of rain. The satellite observation can be preserved only when cloud liquid water <0.05 mm is detected in the pixel, and then there is no rain in the pixel. Note that for the satellite observations, the center of the first cell of the 1440 column and 720 row map is at 0.125°E longitude and −89.875°S latitude; however, the center of the first ECMWF cell of the 1440 column and 720 row map is at 0°E longitude and −90°S latitude. As a result, the ECMWF products are processed with bilinear interpolation to match the satellite observations.
The mean bias and RMSE are calculated by
(2) The
RMSE:
where
denotes the total number of collocations,
is the satellite wind and
is the buoy observation.
3. Results
Evaluation of satellite wind speeds consists of two components: (1) comparisons with in situ measurements; and (2) comparisons with the ECMWF reanalysis data.
3.1. Overall Statistics
The comparison statistics are provided in
Figure 2 and
Table 2.
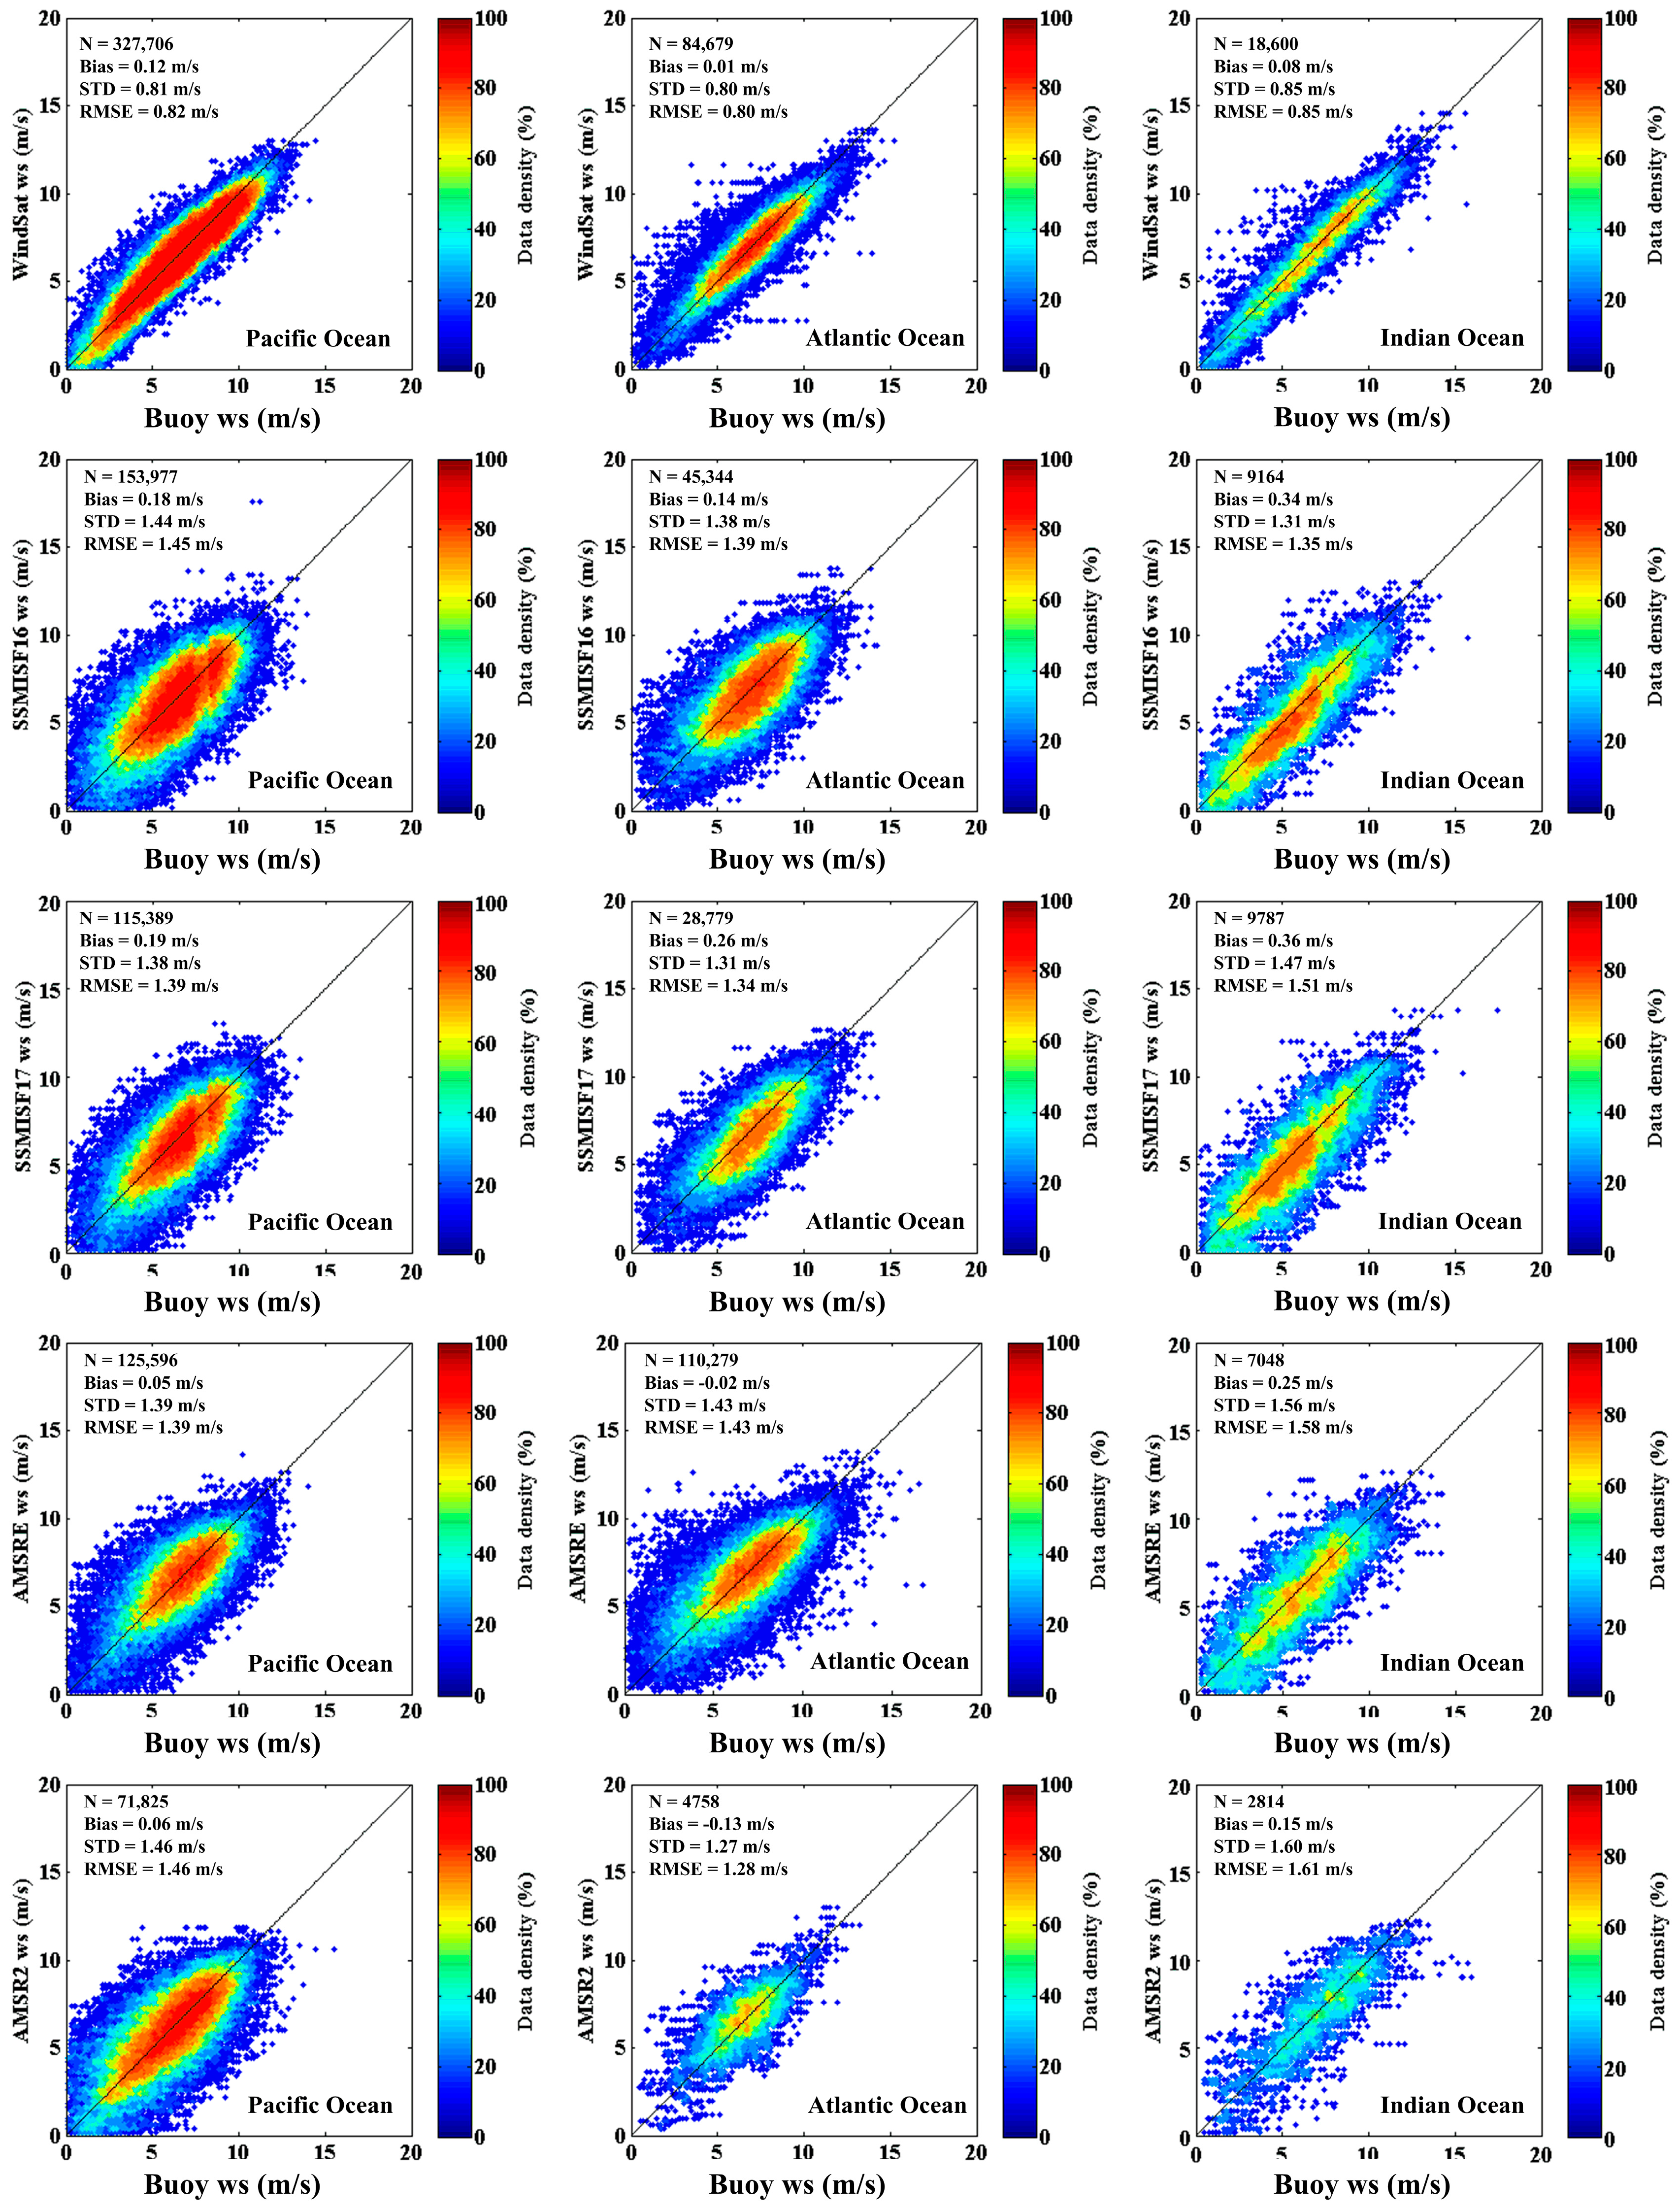
Table 2 shows the overall statistical results between satellite winds and buoy observations. The results reveal that the numbers of collocations between the buoy and WindSat, SSMIS F16, SSMIS F17, AMSR-E, and AMSR2 are 430,985, 208,485, 153,955, 242,923, and 79,397, respectively. The WindSat-buoy has the maximum collocations, and the AMSR-2-buoy has the minimum collocations. The number of collocations in the tropical Pacific Ocean is more than that in the other two regions (tropical Atlantic Ocean and tropical Indian Ocean).
Table 2 also provides the mean bias results. For the selected satellite retrievals, the mean biases between the buoy and WindSat, SSMIS F16, SSMIS F17, AMSR-E, and AMSR2 are 0.10 m/s, 0.24 m/s, 0.21 m/s, 0.03 m/s, and 0.05 m/s, respectively. These results indicate that satellite-derived winds tend to be lower than those observed by buoys. The WindSat wind speeds show the best agreement with those observed by buoys, which yields an overall RMSE of 0.82 m/s. In three different study regions, it ranges from 0.8 m/s to 0.85 m/s. The overall RMSE of SSMIS F17 is 1.39 m/s with respect to the buoy measurements, and it ranges from 1.34 m/s to 1.51 m/s in three different study regions. The overall RMSE of SSMIS F16, AMSR-E, and AMSR2 are 1.45 m/s, 1.43 m/s, and 1.45 m/s, respectively. In addition, the overall standard deviations and correlation coefficients are also presented in
Table 2.
Figure 2 depicts the scatterplot results between buoys and satellites: WindSat (top), SSMIS F16 (second row), SSMIS F17 (middle), AMSR-E (fourth row), and AMSR2 (bottom). For these results, the agreement between the WindSat retrievals and buoy measurements is obviously better than the other four satellites, whose results show slightly more scatter than WindSat retrievals. In addition, some differences exist in diverse study regions for a given satellite.
3.2. Errors versus Buoy Type and Location
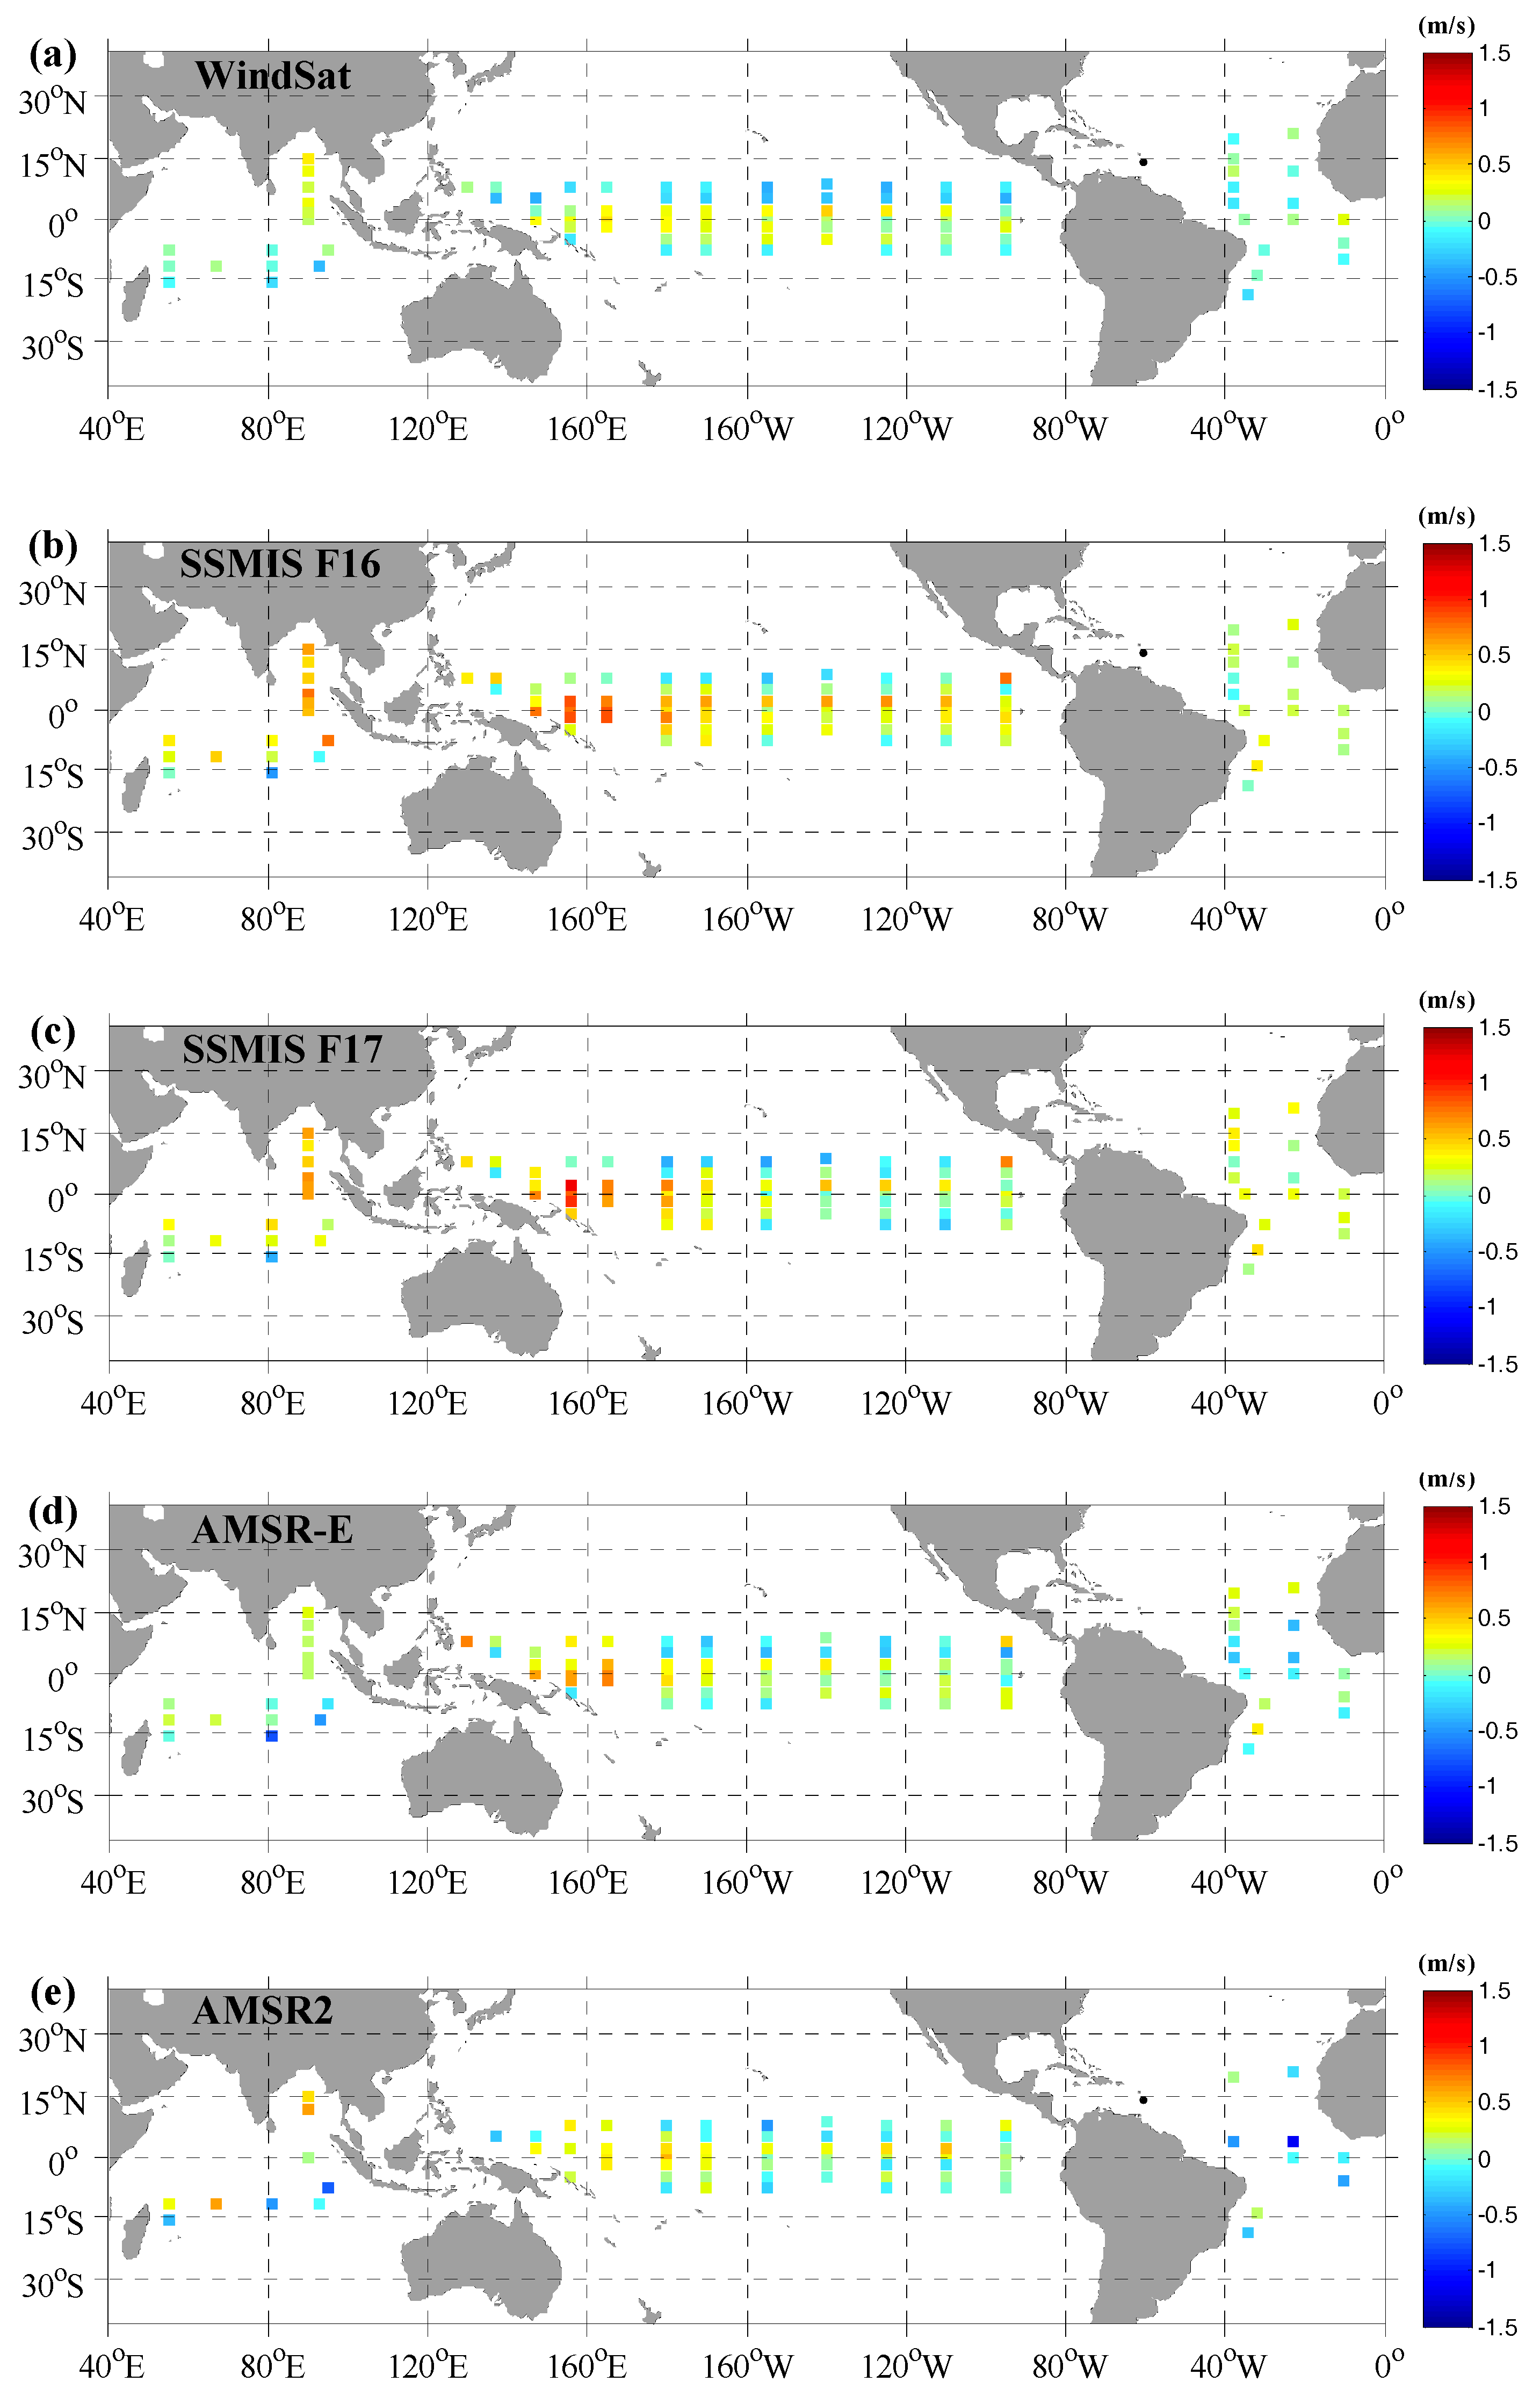
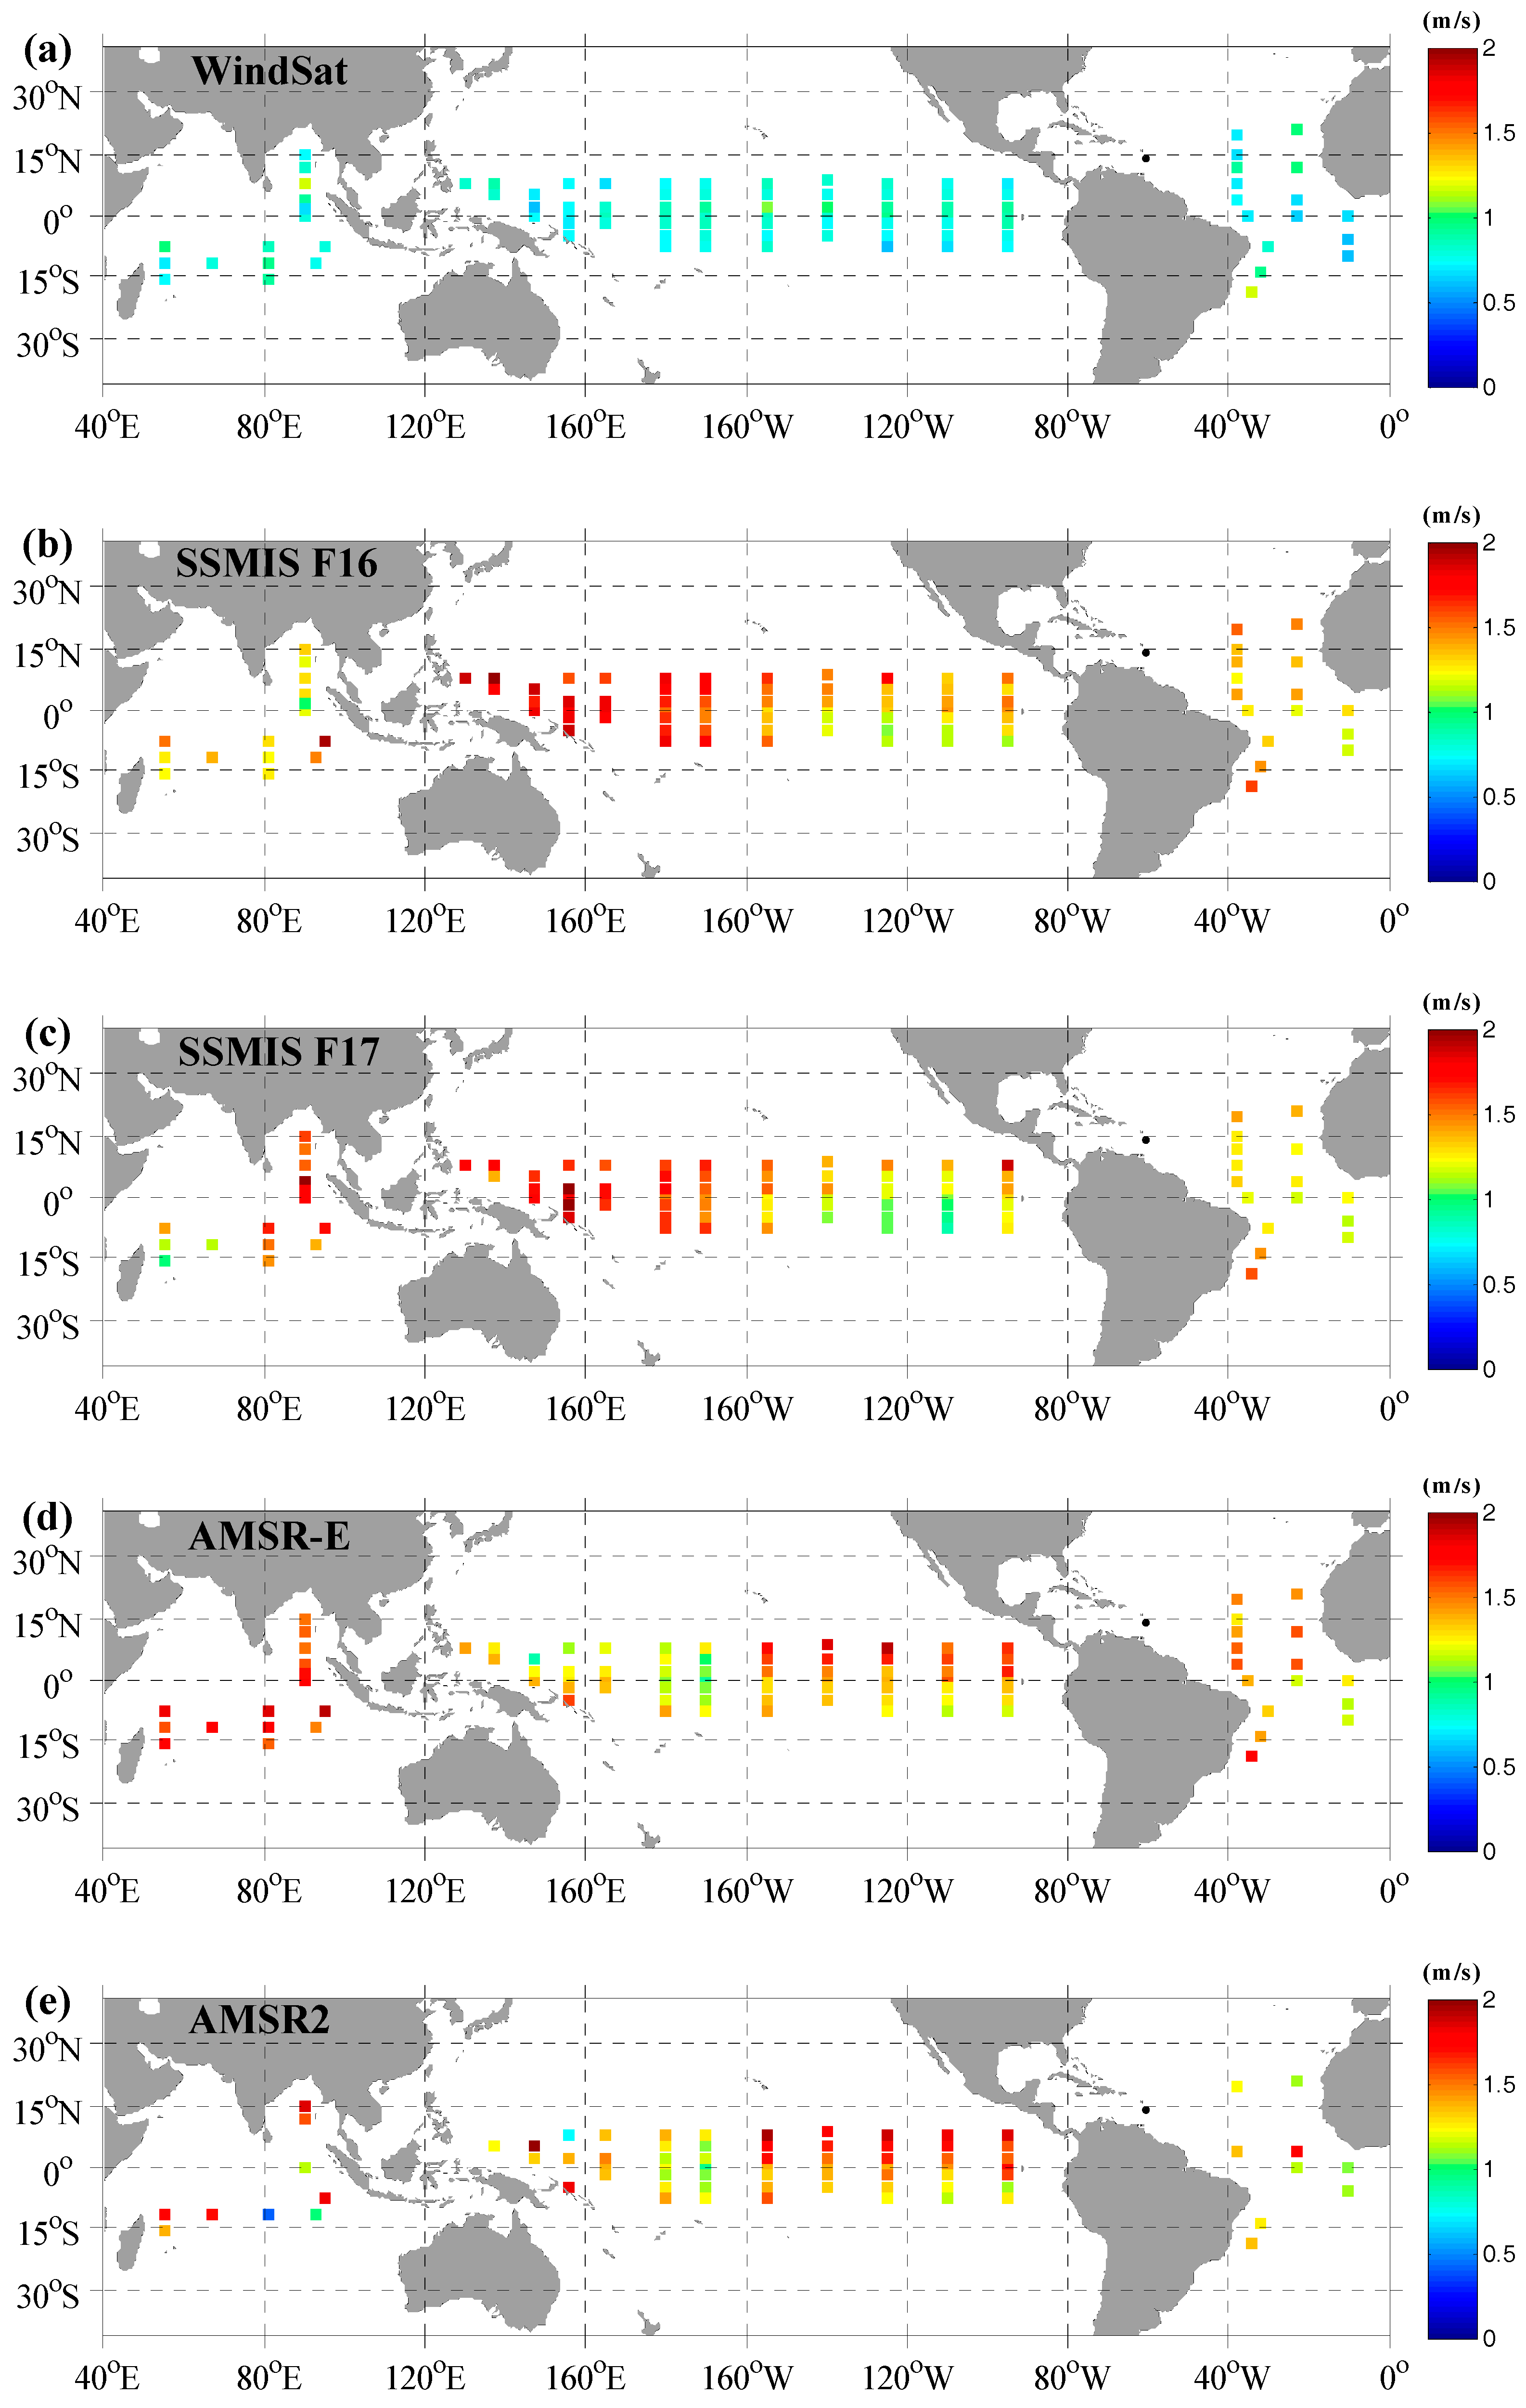
To study the geographic distribution of wind speed bias, global maps of mean biases are plotted in
Figure 3. Each square represents one buoy, and the color of the square indicates the mean bias between buoy observations and satellite-derived winds. For the WindSat results (see
Figure 3a), the positive deviation is obvious near the Equator and in the southern tropical Pacific Ocean as well as in the northern tropical Indian Ocean. In contrast, the negative deviations are mainly located in the northern tropical Pacific Ocean and the western tropical Atlantic Ocean. For buoys in a band from −8°S to 4°N, the WindSat wind speeds tend to be low, by approximately 0.22 m/s. For buoys near the northern tropical Indian Ocean, the WindSat wind speeds also tend to be low, by approximately 0.26 m/s. The maximum positive deviation is 0.47 m/s, which is located at 140°W and 2°N. The corresponding minimum negative deviation is −0.41 m/s, which is located at 125°W and 8°N.
The results for SSMIS F16 (see
Figure 3b) are similar to those of SSMIS F17 (see
Figure 3c). For buoys in a band from −8°S to 4°N, the overall wind speeds of SSMIS F16 and SSMIS F17 are both lower than buoy measurements, by approximately 0.3–0.4 m/s. Overall, the two satellite-derived winds are lower than the buoy observations in the tropical Indian Ocean and the tropical Atlantic Ocean. The results for AMSR-E (see
Figure 3d) are similar to those of AMSR2 (see
Figure 3e). In the tropical Atlantic Ocean, the two satellite-derived winds tend to be higher than buoy observations, which are different from the three other satellite wind speeds.
The global maps of the wind speed RMSE are shown in
Figure 4. Each square represents one buoy, and the color of the square indicates the RMSE between buoy observations and satellite-derived winds.
Figure 4 shows that the results of WindSat are better than those of the four other satellites, as is also shown in
Figure 2 and
Table 2. For SSMIS F16 and F17, the overall RMSE in the western tropical Pacific Ocean is greater than that in the eastern tropical Pacific Ocean. In addition, some large errors occur near the coast or land, and these may be due to the orographic effects, as was also described in a previous study [
40].
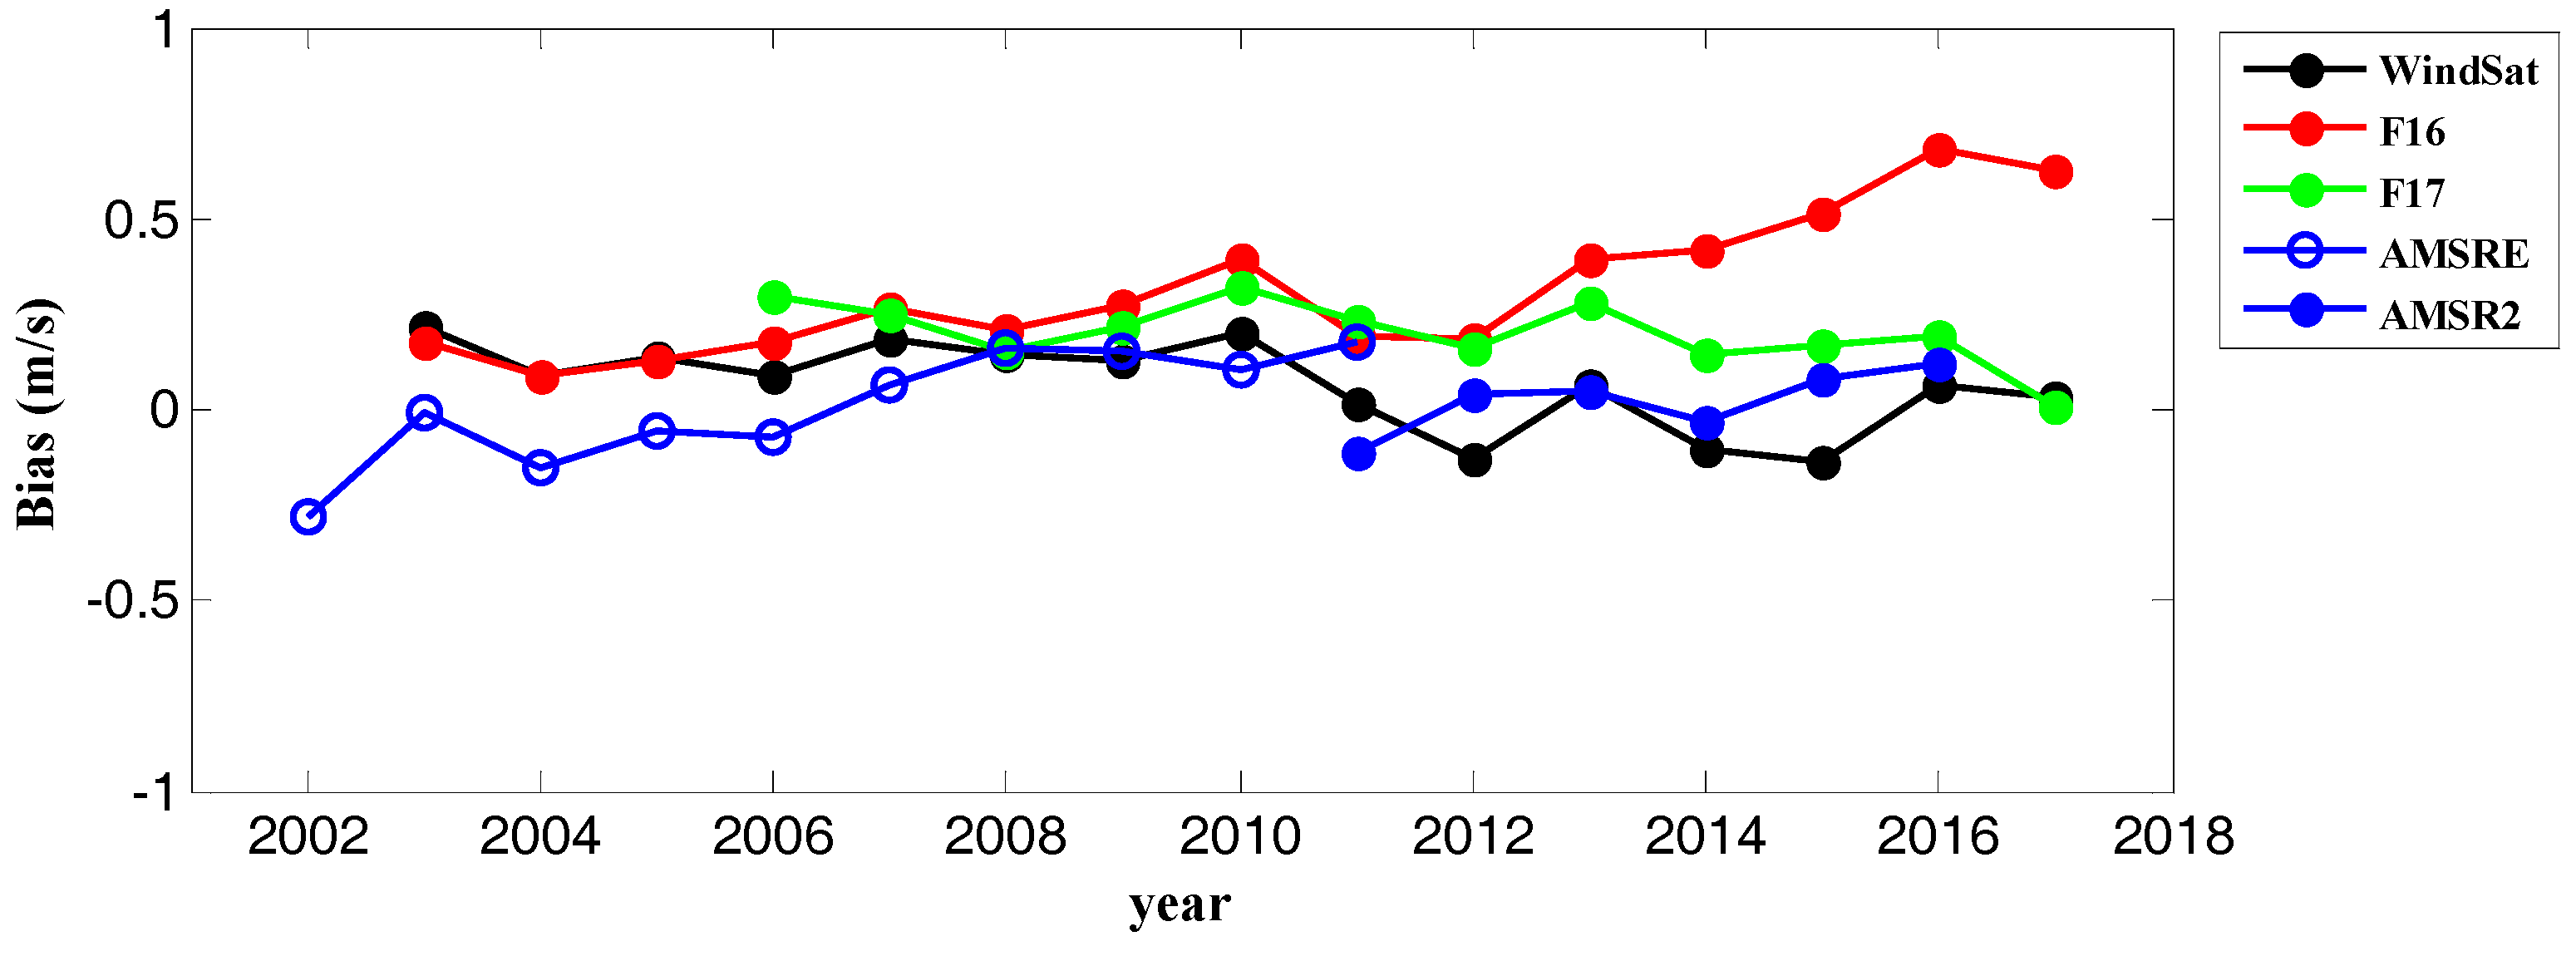
3.3. Errors as a Function of Time
Figure 5 shows the mean buoy–satellite biases as a function of year for each satellite. It shows that no obvious fluctuation is found and the mean biases always range from −0.4 m/s to 0.4 m/s, except for SSMIS F16. For SSMIS F16, no obvious fluctuation is found before 2014. After that, a relatively large positive bias exists in 2016, by 0.69 m/s.
3.4. Comparison of Satellite Winds with ECMWF Reanalysis Data
This section discusses long time series of specific latitude bands and the global seasonal wind speed differences between satellite winds and ECMWF reanalysis data.
3.4.1. Regional Wind Speed Differences
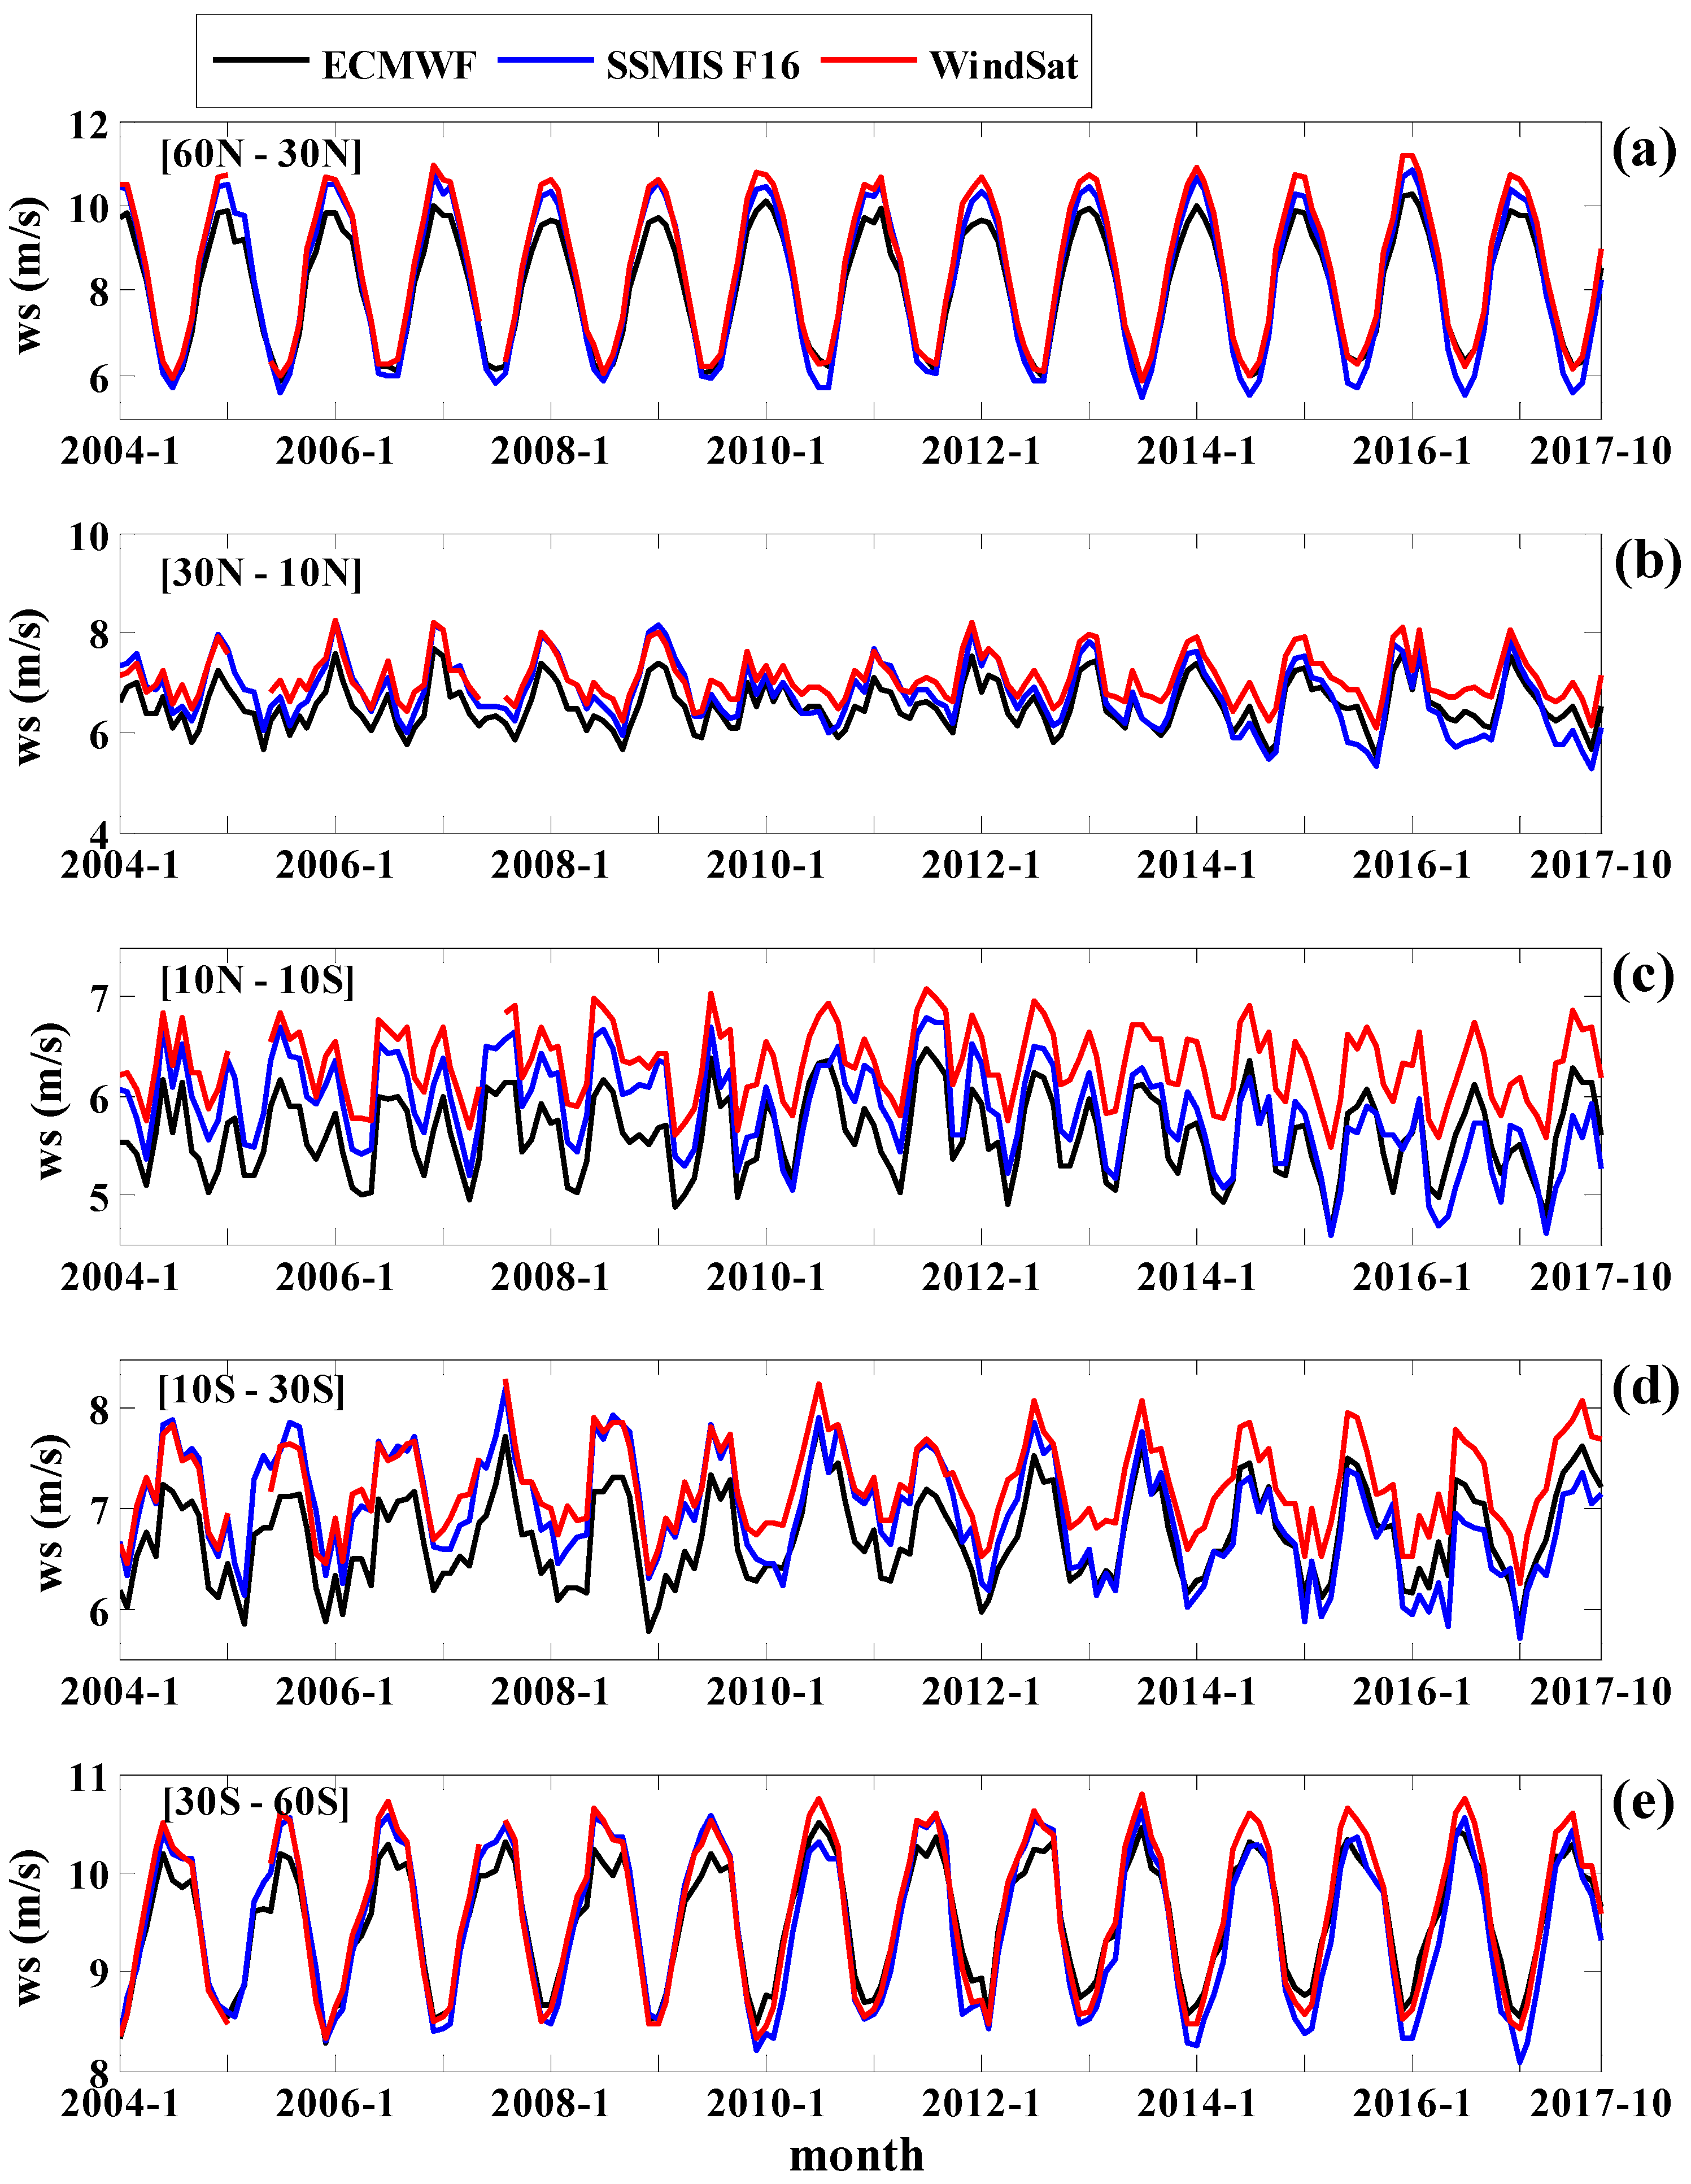
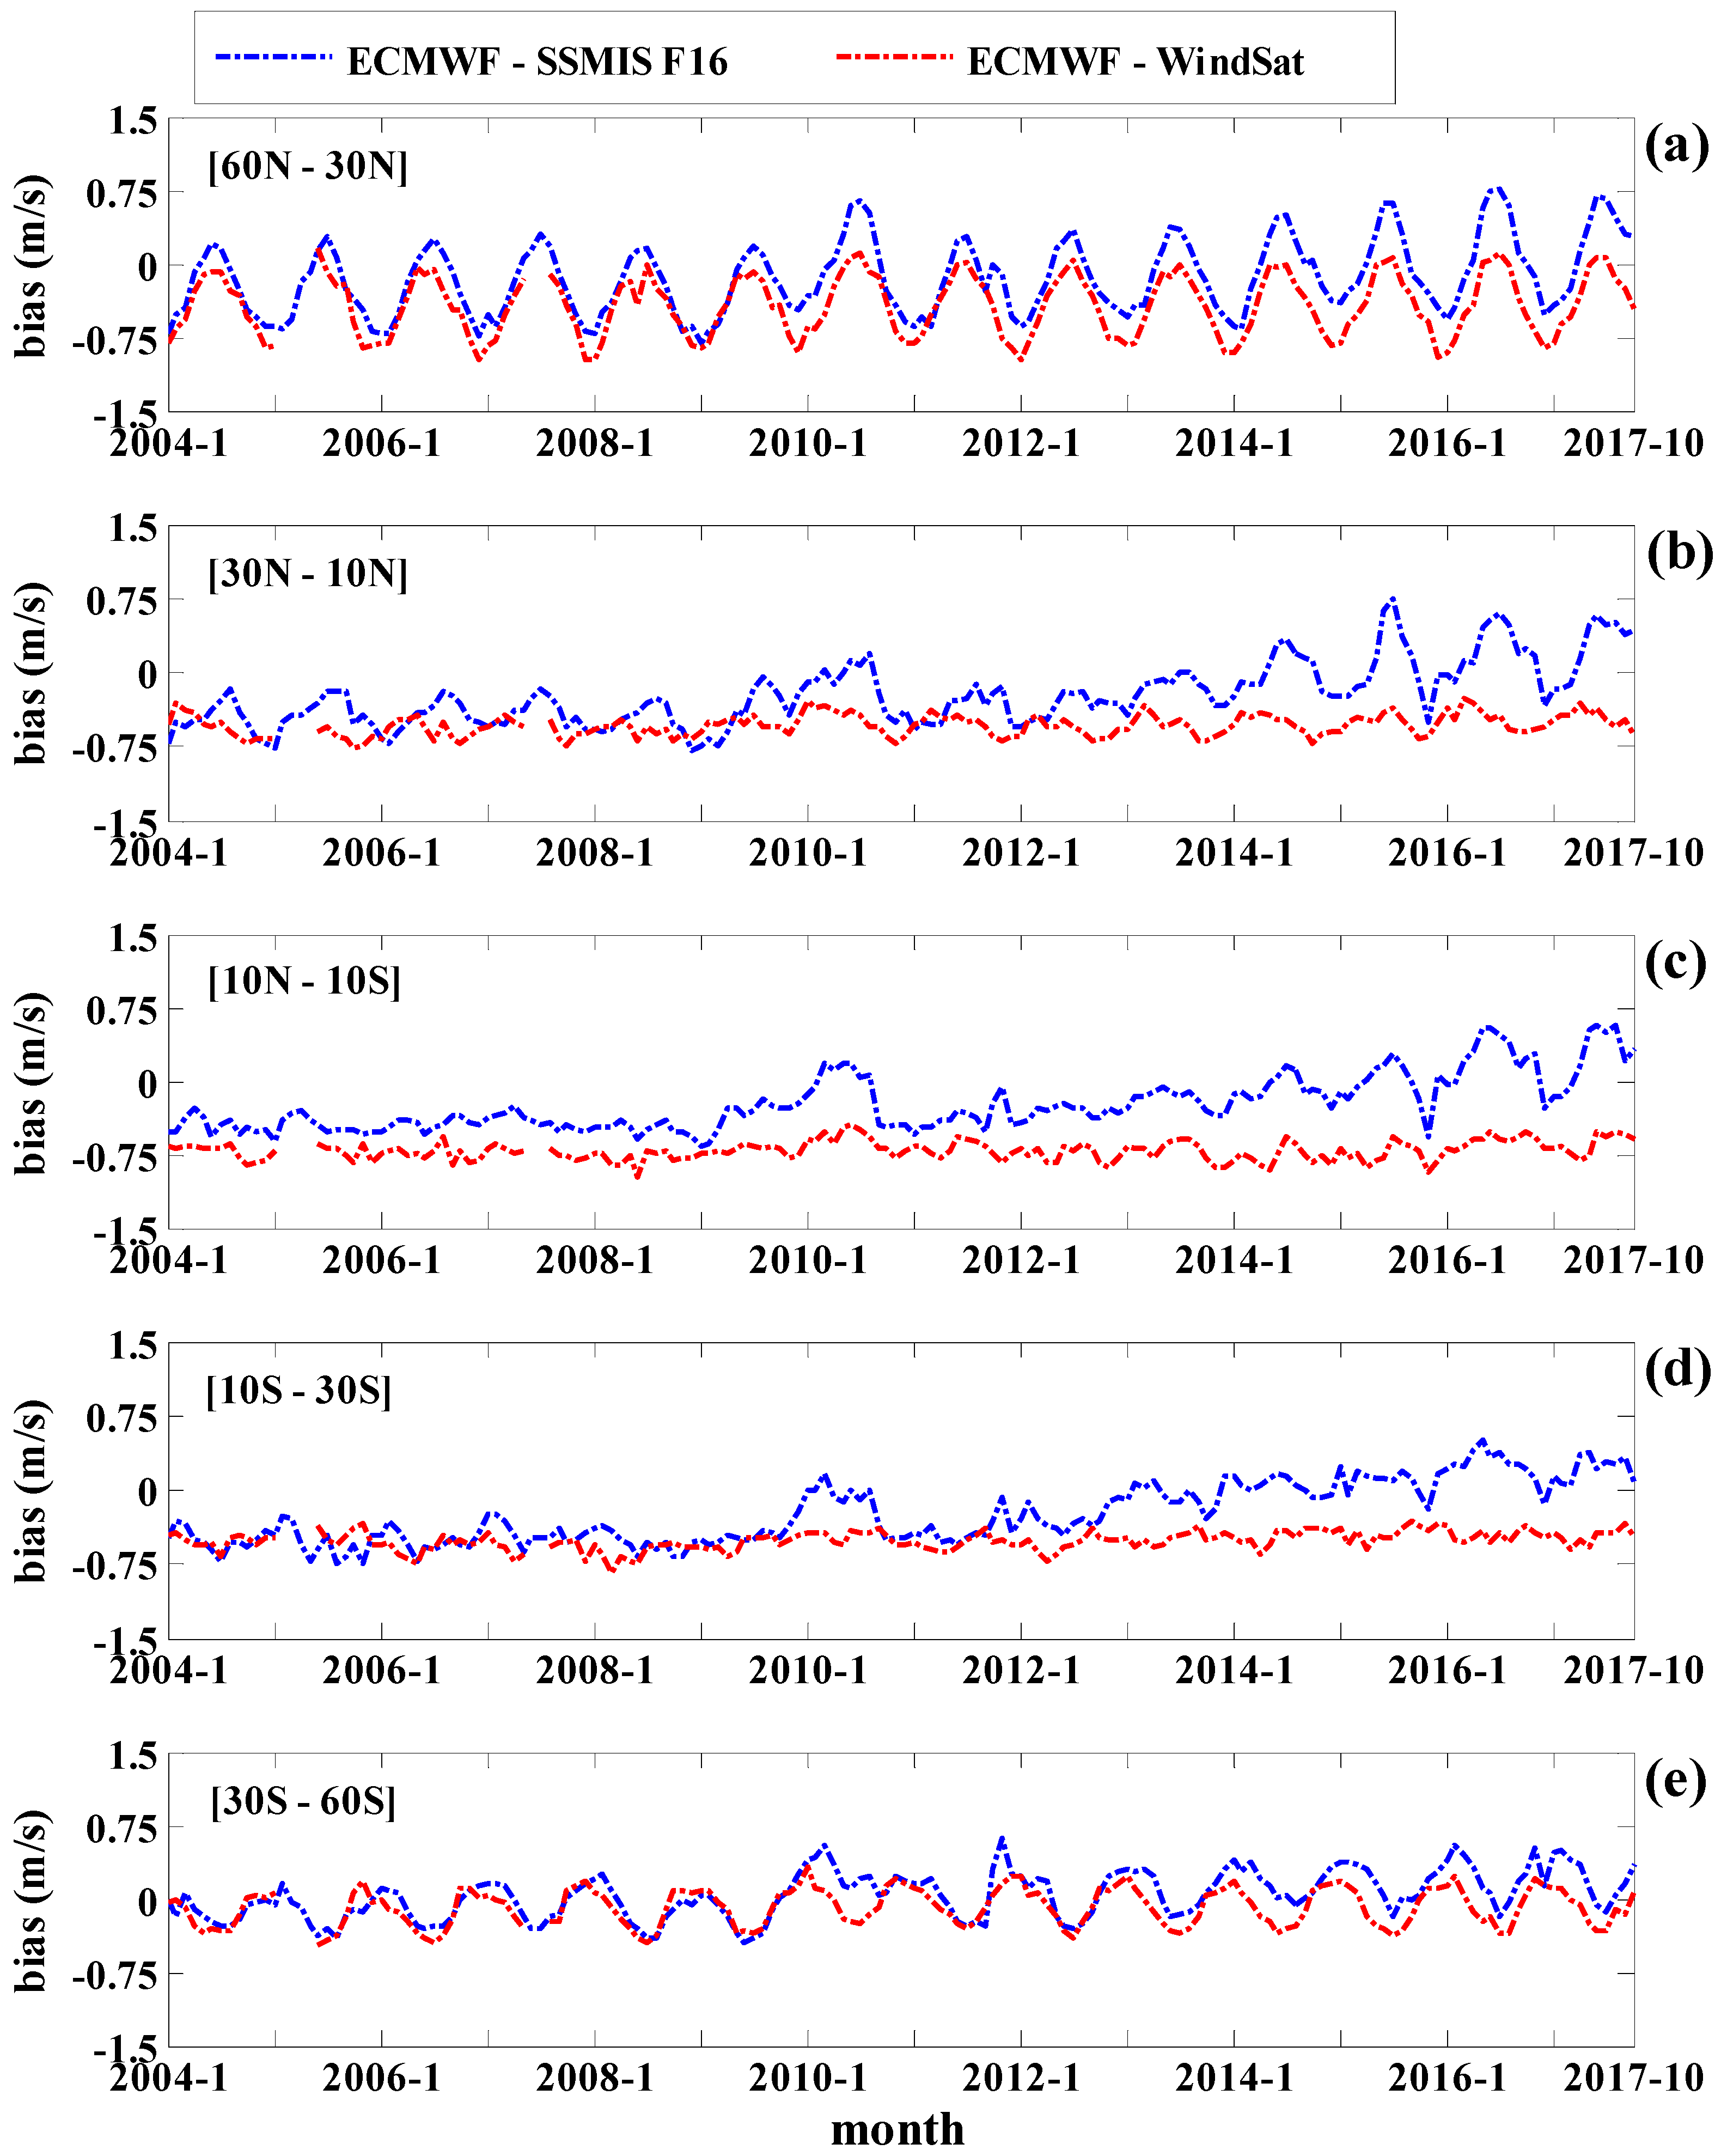
Figure 6 shows the monthly averaged wind speeds for WindSat (red solid line), SSMIS F16 (blue solid line), and ECMWF (black solid line) depicted in five different latitudinal bands: 30°N–60°N, 10°N–30°N, 10°S–10°N, 10°S–30°S, and 30°S–60°S. Time periods range from January 2004 to October 2017. The corresponding monthly mean differences between ECMWF and satellites are presented in
Figure 7. The red dashed line represents the wind speed differences between ECMWF and WindSat, and the blue dashed line represents the wind speed differences between ECMWF and SSMIS F16.
The monthly averaged wind speeds show an obvious seasonal characteristic at high latitudes, as shown in the top and bottom panels of
Figure 6. High winds take place during December, January, and February at high northern latitudes (see
Figure 6a) and take place during June, July, and August at high southern latitudes (see
Figure 6e). The magnitude of high winds in the Northern Hemisphere is as large as in the Southern Hemisphere. Low winds occur during June, July, and August at high northern latitudes and occur during December, January, and February at high southern latitudes. Overall, the low winds at high northern latitudes are lower than those at high southern latitudes (approximately 2.4 m/s). The top panel of
Figure 6 shows that the peak monthly averaged wind speed is approximately 9.84 m/s (ECMWF), which is higher (approximately 2.6 m/s) than the global averaged wind speed (ECMWF).
The top panel in
Figure 7 shows that during winter, a large negative difference is found between satellite winds and ECMWF data, especially for ECMWF–WindSat (see
Figure 7a). That means the monthly averaged WindSat winds are larger than those of ECMWF at high northern latitudes in winter. Conversely, during summer, the biases are always positive for ECMWF–SSMIS F16, and the monthly averaged WindSat winds are larger than those of SSMIS F16 in this period. In general, the monthly mean ECMWF–WindSat wind differences range from −0.99 m/s to 0.15 m/s, and the monthly mean ECMWF–SSMIS F16 wind differences range from −0.82 m/s to 0.76 m/s.
The seasonal characteristics are also found at northern mid-latitudes (see
Figure 6b), but these signals are weaker than those at high northern latitudes (see
Figure 6a). The WindSat winds are always higher than those of ECMWF within latitude bands of 30°N–30°S (see
Figure 7b–d). Similar characteristics can be found between ECMWF wind speeds and SSMIS F16 retrievals before 2010 (see
Figure 7b–d). In
Figure 7b–d, we find no obvious fluctuation is found in the monthly averaged wind differences of ECMWF–WindSat. However, some relatively larger fluctuations are occasionally found in the monthly averaged wind differences of ECMWF–SSMIS F16 after 2010. The specific reasons need further study. Before 2010, the WindSat winds show good agreements with those of SSMIS F16 within latitude bands of 30°S–60°S (see
Figure 7e). The differences of WindSat retrievals with respect to ECMWF winds range from −0.77 m/s to −0.27 m/s within the latitude bands of 10°N–30°N, and within the southern latitude bands of 10°S–30°S the differences range from −0.83 m/s to −0.31 m/s. The middle panel in
Figure 7 shows that the ECMWF wind speeds are mostly lower than WindSat wind speeds by approximately 0.45 to 1 m/s. The wind differences between SSMIS F16 and ECMWF range from −0.66 m/s to 0.57 m/s within the latitude band of 10°N–10°S. Overall, SSMIS F16 winds show better agreement with ECMWF data than WindSat winds, especially in the latitude band of 10°N–10°S. This might be because ECMWF assimilates SSMIS radiances.
3.4.2. Seasonal Wind Speed Differences over the Global Ocean
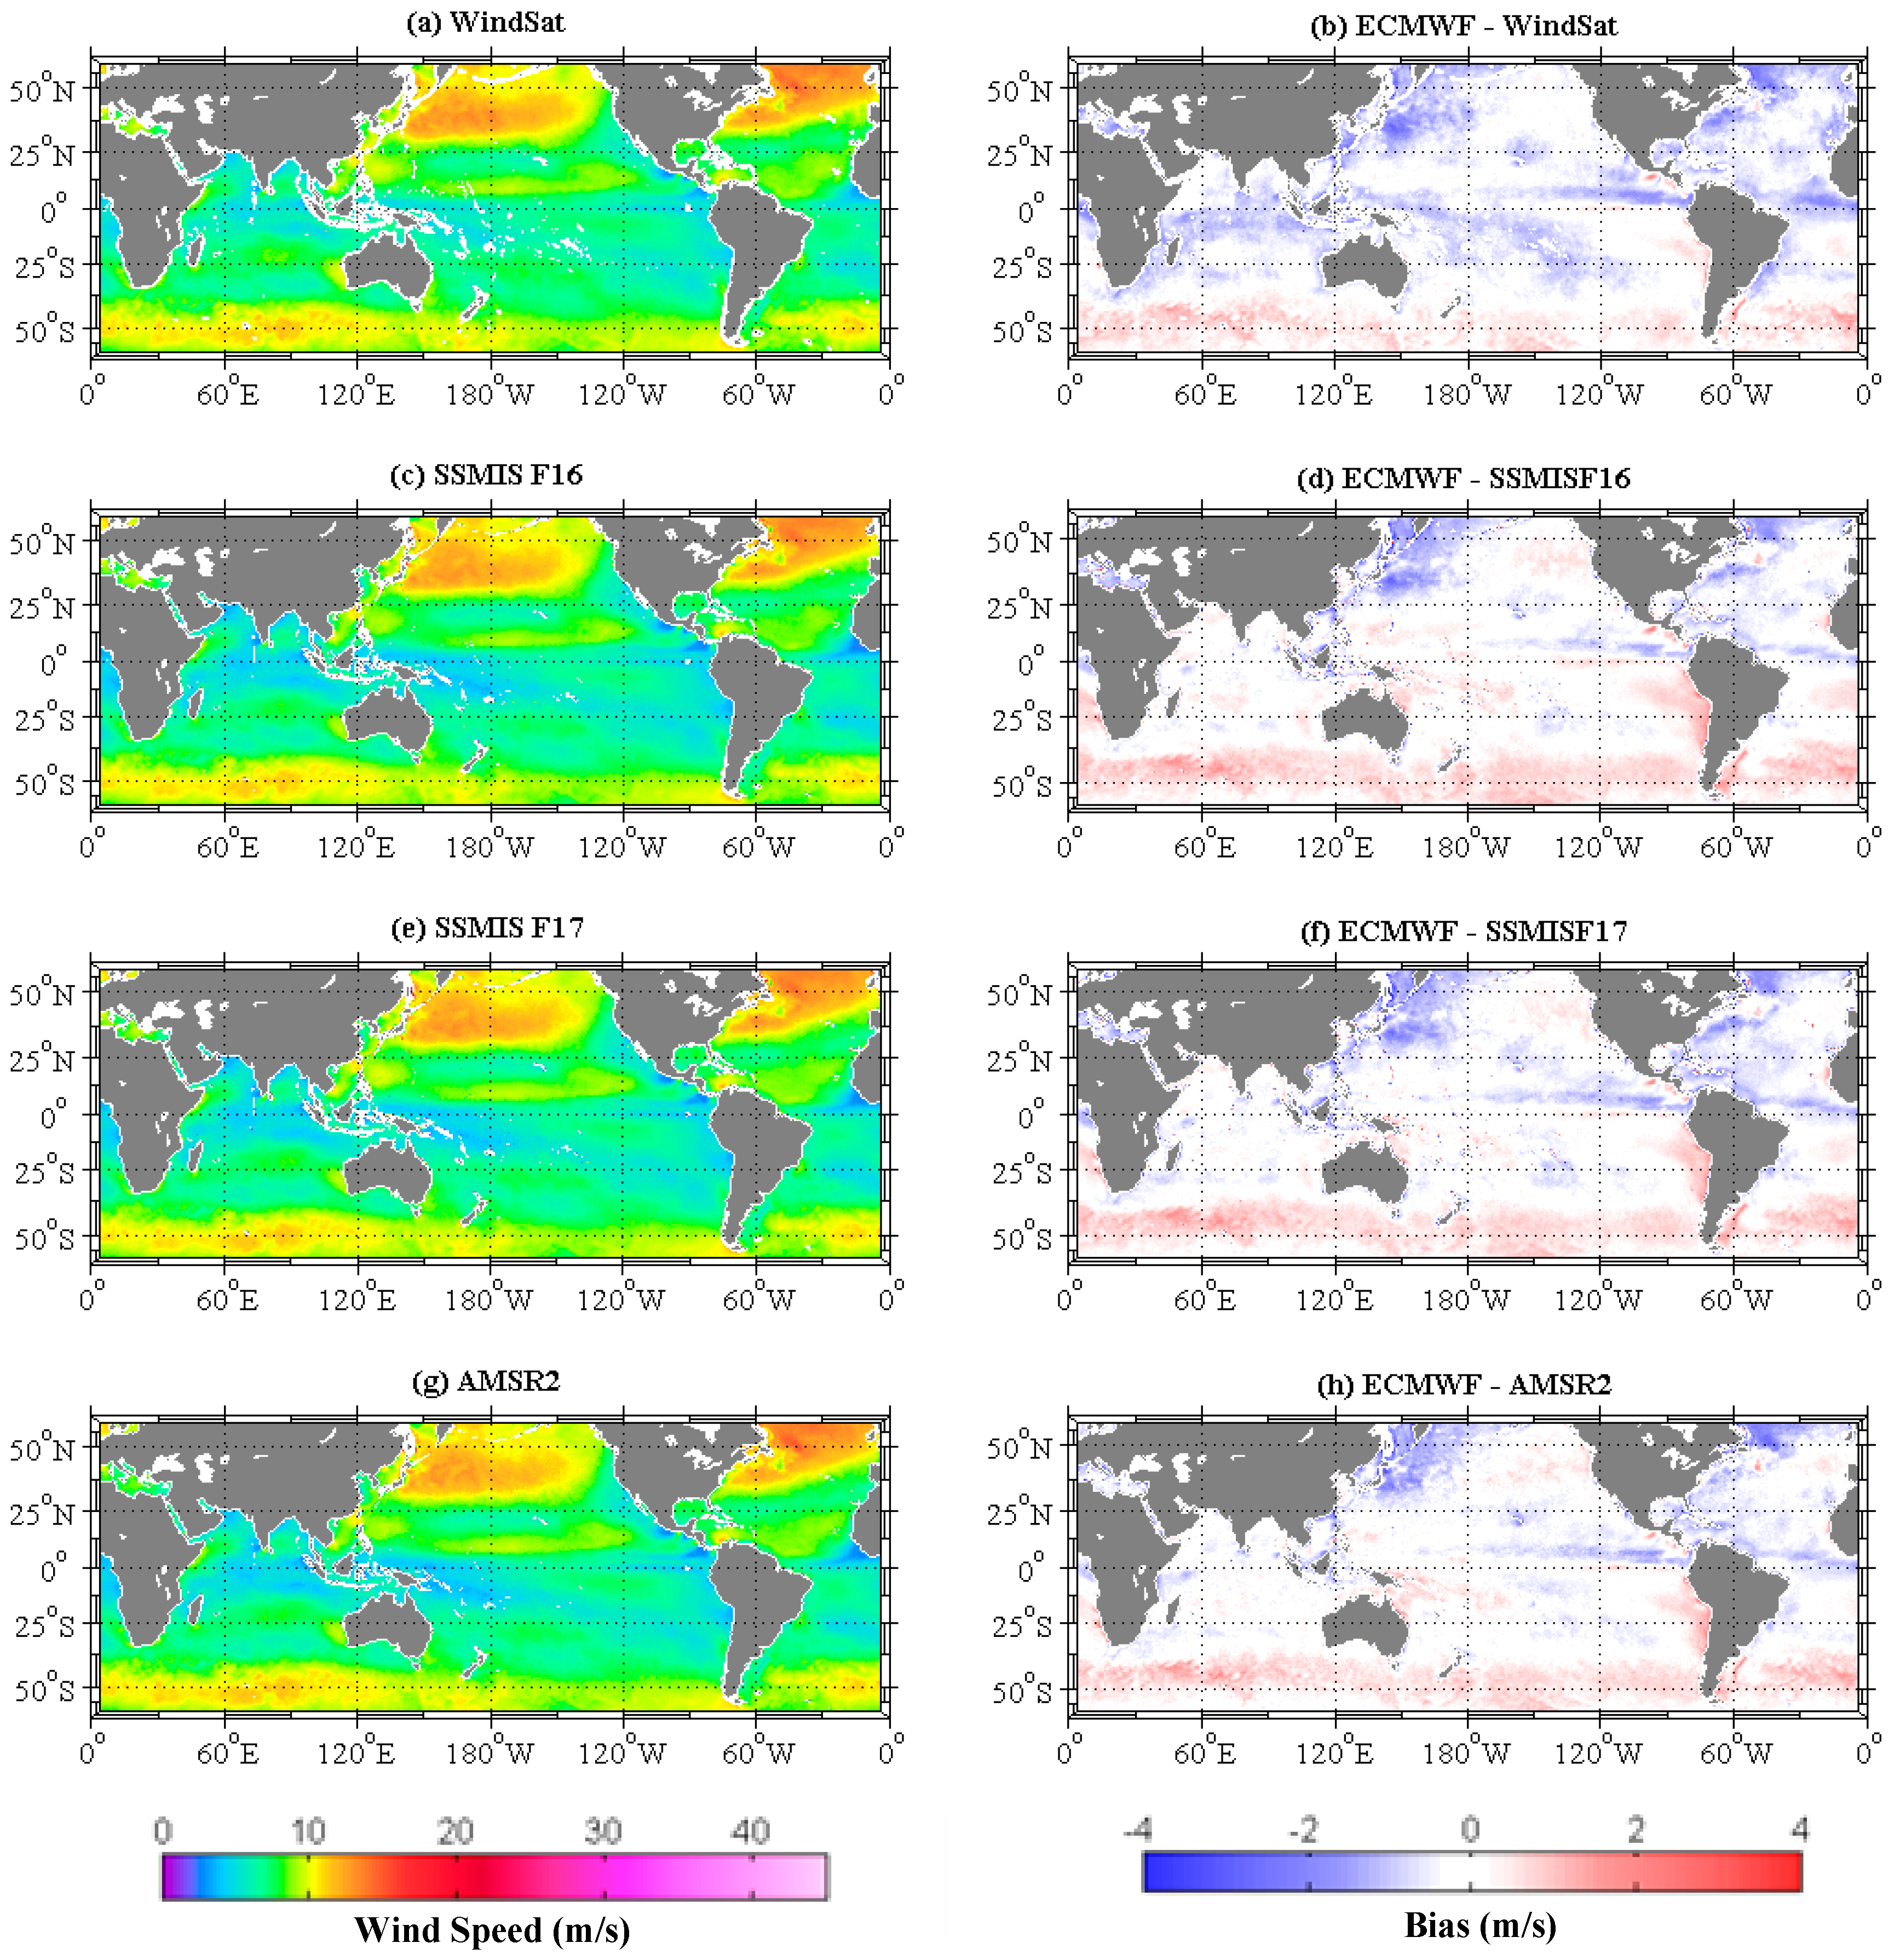
Figure 8 shows the mean monthly (in January) wind speeds derived from four different satellites (WindSat, SSMIS F16, SSMIS F17, and AMSR2) during the period 2013–2017 (see the left column). The mean monthly (in January) wind speed differences between each satellite and ECMWF are also shown in
Figure 8 (see the right column). The spatial distribution of mean monthly wind speeds reveals that strong wind speeds exist at high northern latitudes in winter, which can also be found in
Figure 6a. As for the differences of satellite-ECMWF, an obviously positive deviation exists at high southern latitudes (see
Figure 8b,d,f,h). Within the southern latitude band of 40°S–60°S, the satellite wind speed is lower than that of ECMWF by approximately 1 m/s. In these regions, we cannot determine whether the difference originates from the ECMWF reanalysis data or from the satellite data because these areas lack sufficient in situ measurements. Some obvious negative deviations between ECMWF and WindSat are found in most regions (typically above 25°S). In these regions, the WindSat winds are larger than those of ECMWF. The previous study [
41] have also demonstrated that WindSat wind speeds show better agreement with TAO buoys than ECMWF winds. The bias (TAO-ECMWF) is 0.39 m/s, and that is only 0.1 m/s between TAO measurements and WindSat winds. That indicates that ECMWF underestimates wind speeds in the black dashed rectangle of
Figure 1. Some negative differences are also found among SSMIS F16, SSMIS F17, and AMSR2, which are mainly located in the northeastern tropical Pacific Ocean, the Pacific east of Japan, the Sea of Okhotsk, the tropical Atlantic Ocean, and the northwest of Atlantic Ocean.
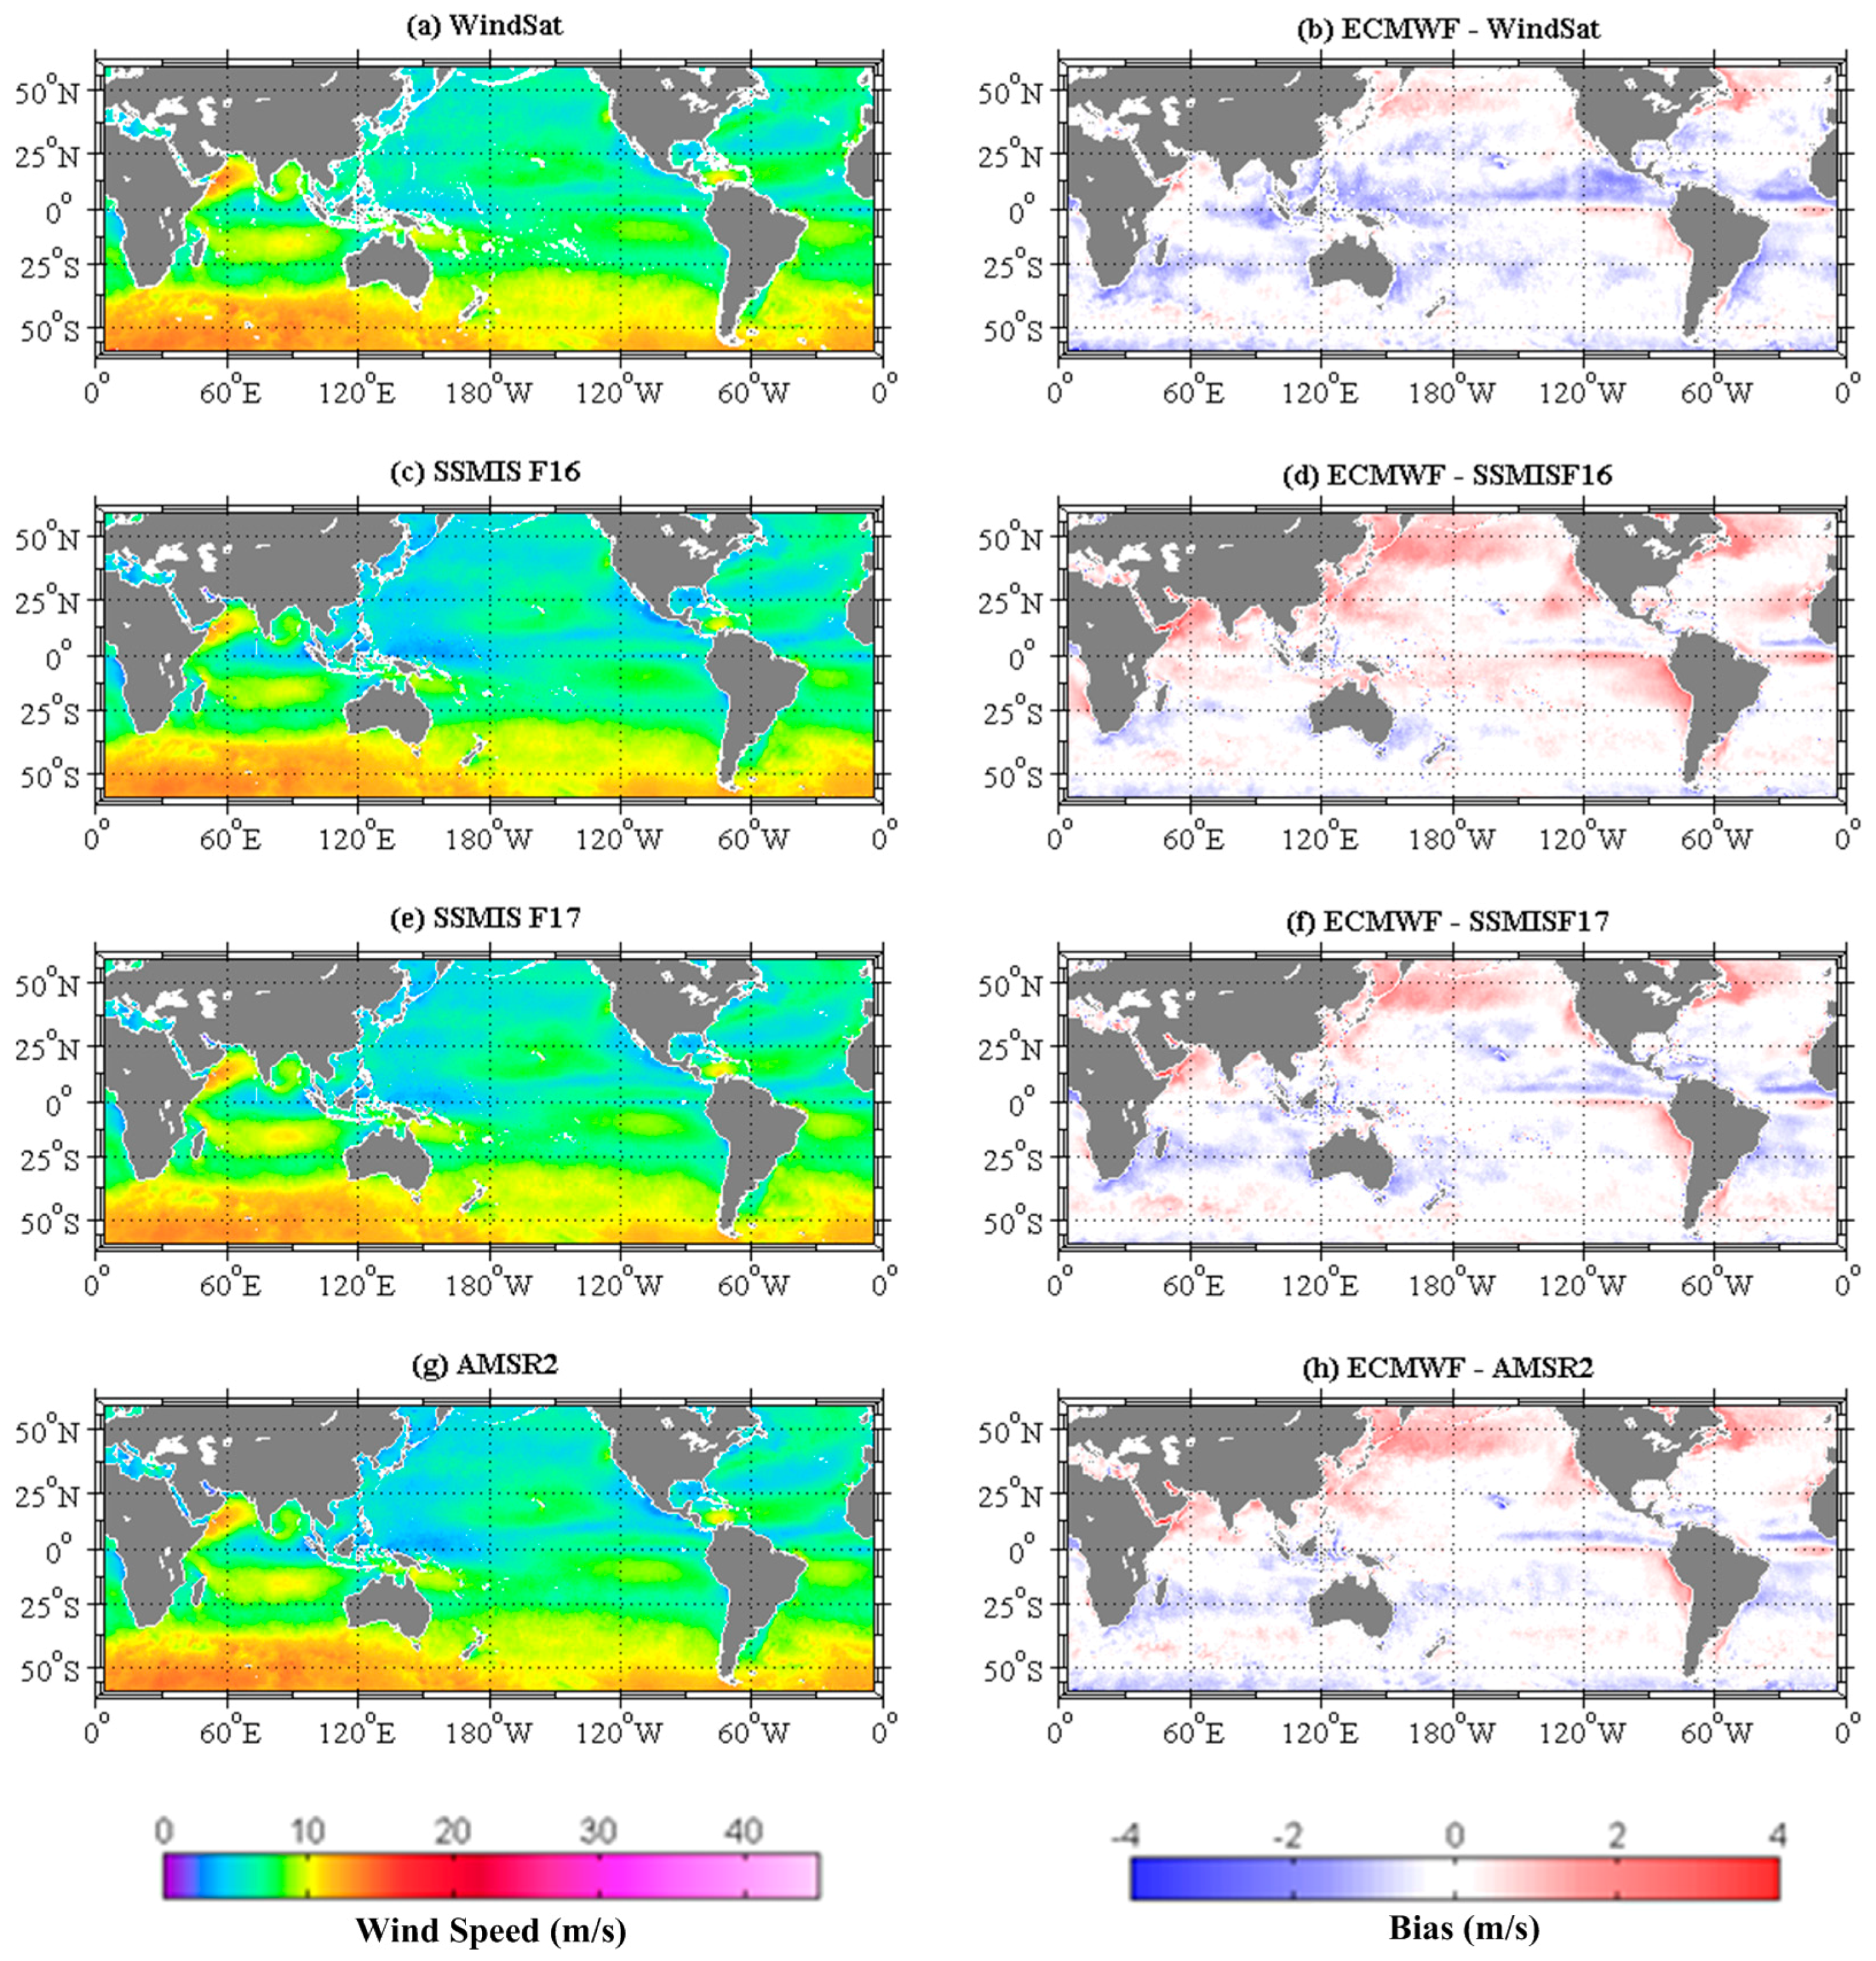
Figure 9 shows mean monthly (in July) wind speeds derived from four different satellites (WindSat, SSMIS F16, SSMIS F17, and AMSR2) during the period 2013–2017 (see the left column). The mean monthly (in July) wind speed differences between each satellite and ECMWF are also shown in
Figure 9 (see the right column). The monthly averaged wind speed differences indicate that strong wind speeds exist at the high southern latitudes, and the winds are relatively strong. The wind speeds are relatively low in the Northern Hemisphere. By comparing with
Figure 8, it is clear that some positive deviations exist at the high northern latitudes, and these signals are very obvious for ECMWF–SSMIS F16, ECMWF–SSMIS F17, and ECMWF–AMSR2. The satellite wind speed estimates are lower than those of ECMWF in these regions. In addition, some obvious positive deviations are also found within the latitude bands of 30°N–25°S in the ECMWF–SSMIS F16 results. That is different from the three other results. In these regions, the SSMIS F16 wind speeds are underestimated. For the ECMWF–WindSat results, the negative deviations are widely distributed within the latitude bands of 25°N–30°S. The similar characteristics are also found in both ECMWF–SSMIS F17 and ECMWF–AMSR2 results. However, the magnitude is weaker than that of ECMWF–WindSat. In these regions, WindSat wind speeds are mostly larger than the three other satellites.
4. Discussion
In the previous sections, we have compared wind speeds retrieved from five different satellite microwave radiometers to those directly observed by buoy-mounted anemometers. The results show that the overall mean difference for each satellite is typically <0.25 m/s, and the RMSE is better than 1.5 m/s. The WindSat wind speeds show the best agreement with those observed by buoys. It is noted that a new feature of the WindSat ocean algorithm compared with algorithms for the other four satellites (SSMIS F16, SSMIS F17, AMSR-E, and AMSR2) is the use of the third and fourth Stokes brightness temperature, and it can retrieve not only wind speed but also wind direction. To retrieve wind direction, a maximum-likelihood approach finds a set of possible wind vector solutions that minimize the difference between the observations and the radiative transfer model. These may contribute to the improvement of the wind speed retrieval accuracy of WindSat. In addition, the different performances in these radiometers may be due to the different radiometer noise in each individual instrument, to different sea state, and to different atmospheric effects.
As discussed in
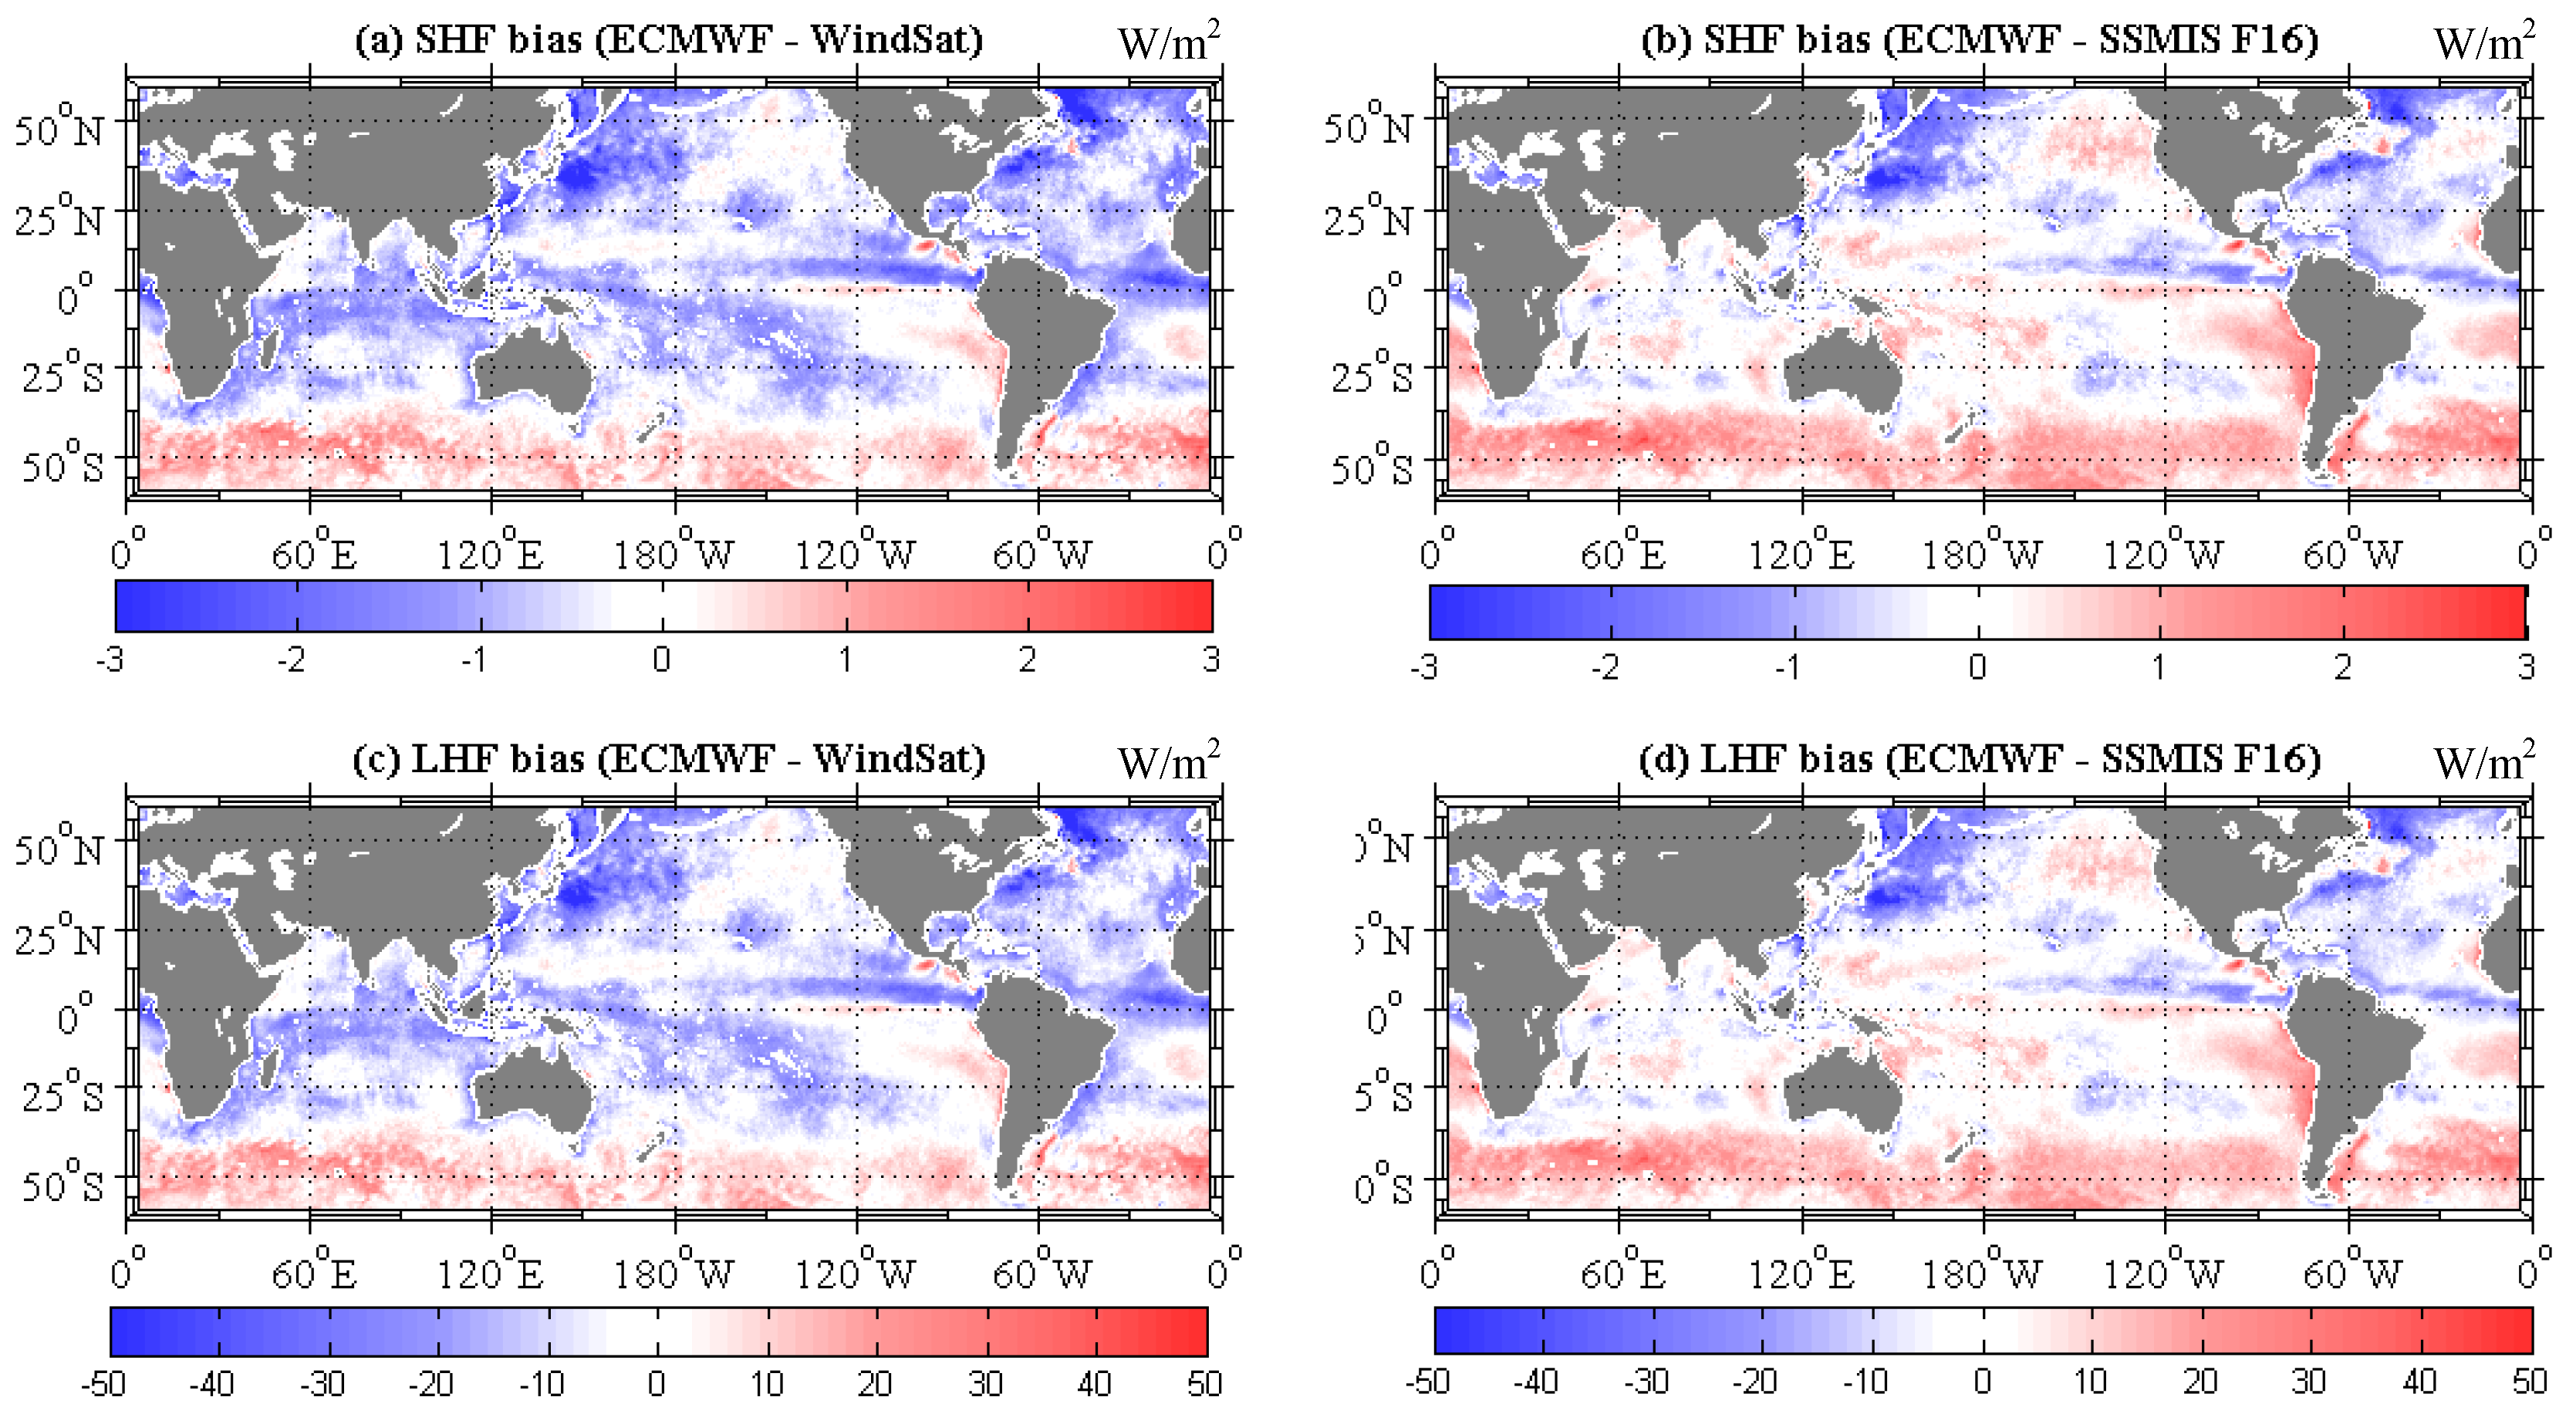
Section 3.4, some differences are found between satellite winds and the ECMWF reanalysis data. We will then explore differences in the resulting latent heat flux (LHF) and sensible heat flux (SHF) when using wind speeds from each particular product over the global ocean. The latent heat and sensible heat fluxes are calculated using the COARE (v3.0) algorithm [
42]. This algorithm relates turbulent fluxes to four variables which include wind speed, sea surface temperature, air temperature and humidity. Sea surface temperature, air temperature and humidity are constants, which are 27 °C, 26 °C, and 16 g/kg, respectively. The only changing variable is the wind speed from WindSat, SSMIS F16, and ECMWF. The mean monthly (in January) wind speeds in
Section 3.4.2 are finally used. Similar to wind speed differences in
Figure 8, some obvious negative differences between ECMWF-derived and WindSat-derived turbulent fluxes are found in the most of regions (typically above 25°S) (see
Figure 10a,c). The ECMWF winds are much weaker (2.5 m/s or more) than satellite winds near the region (26.4°N–27.4°N, 124.6°E–125.9°E), which yields the differences for latent heat fluxes are >50 W/m
2 in this region. Similar results can be found in some other regions. This comparison seems to indicate that the required accuracy for wind speed parameter is high because the error propagation in the bulk formula leads to large errors in the derived latent heat fluxes. In general, ECMWF wind speeds tend to overestimate latent heat fluxes by approximately 5–40 W/m
2 near the southern latitude band of 40°S–50°S with respect to WindSat wind speeds. It is difficult to derive the absolute accuracy in these regions since there is no in situ measurement. The sensible heat flux differences (see
Figure 10a) are smaller than those in latent heat fluxes (see
Figure 10c) because of smaller sensible heat flux magnitudes. In addition, the calculated turbulent fluxes differences for ECMWF results with respect to SSMIS F16 are also presented in
Figure 10.
5. Summary and Conclusions
The study compares sea surface wind speeds from five different passive microwave instruments (WindSat, SSMIS F16, SSMIS F17, AMSR-E, and AMSR-2) with those obtained from in situ measurements and ECMWF reanalysis data. The moored buoy observations are used to quantify the overall accuracy of the satellite-derived wind speeds. The global seasonal wind speed differences and the characteristics of five specific latitude bands between the satellite winds and ECMWF reanalysis data are also examined. The chief findings are summarized as follows.
The results reveal that the number of collocations between the buoy and WindSat, SSMIS F16, SSMIS F17, AMSR-E, and AMSR-2 are 430,985, 208,485, 153,955, 242,923, and 79,397, respectively. The number of collocations is sufficient to perform a meaningful validation. Overall, the satellite retrievals tend to be lower than the buoy observations. Agreement between the WindSat retrievals and buoy measurements is obviously better than the four other instruments. The overall RMSE results are all better than 1.5 m/s. Different performances in these radiometers may be due to different retrieval algorithms, to the different radiometer noise in each individual instrument, to different sea state, and to different atmospheric effects.
The monthly averaged wind speeds show an obvious seasonal characteristic at high latitudes. This phenomenon occurs during December, January, and February at high northern latitudes (30°N–60°N) and occurs during June, July, and August at high southern latitudes (30°S–60°S). The WindSat winds are always higher than those of ECMWF within latitude bands of 30°N–30°S. The differences of WindSat retrievals with respect to ECMWF winds range from −0.77 m/s to −0.27 m/s within the latitude bands of 10°N–30°N, and within the southern latitude bands of 10°S–30°S the differences range from −0.83 m/s to −0.31 m/s. Similar characteristics can be found between ECMWF winds and SSMIS F16 retrievals before 2010. However, the wind speed differences between ECMWF and SSMIS F16 are occasionally positive after 2010. Overall, SSMIS F16 winds show better agreement with ECMWF data than WindSat winds, especially in the latitude band of 10°N–10°S. This might be because ECMWF assimilates SSMIS radiances.
Regional differences exist over the global ocean between satellite winds and ECMWF data. In January, an obviously positive deviation exists at high southern latitudes. Within the southern latitude band of 40°S–60°S, the satellite wind speed is lower than that of ECMWF by approximately 1 m/s. Some obvious negative deviations between ECMWF and WindSat are found in the most of regions (typically above 25°S). In these regions, the WindSat winds are larger than those of ECMWF. Similar spatial distributions of negative deviation are found among SSMIS F16, SSMIS F17, and AMSR2. In July, strong winds exist at the high southern latitudes. Some positive deviations exist at the high northern latitudes, and these signals are obvious for ECMWF–SSMIS F16, ECMWF–SSMIS F17, and ECMWF–AMSR2. The satellite wind speed estimates are lower than those of ECMWF in these regions. In addition, some obvious positive deviations are also found within the latitude bands of 30°N–25°S in the ECMWF–SSMIS F16 results. That is different from the three other results. Satellite winds have a vital role in calculating sensible and latent heat fluxes. As revealed in
Section 4, the required accuracy for wind speed is very high since the error propagation in the bulk formula leads to large errors in the derived turbulent fluxes. Therefore, continuous evaluations of winds, as presented in this study, are helpful for some types of applications.


